")
Back to Journals » Diabetes, Metabolic Syndrome and Obesity » Volume 13
The Oral Glucose Tolerance Test: 100 Years Later
Authors Jagannathan R , Neves JS, Dorcely B, Chung ST , Tamura K , Rhee M , Bergman M
Received 3 August 2020
Accepted for publication 24 September 2020
Published 19 October 2020 Volume 2020:13 Pages 3787—3805
DOI https://doi.org/10.2147/DMSO.S246062
Checked for plagiarism Yes
Review by Single anonymous peer review
Peer reviewer comments 3
Editor who approved publication: Prof. Dr. Juei-Tang Cheng
Ram Jagannathan,1 João Sérgio Neves,2,3 Brenda Dorcely,4 Stephanie T Chung,5 Kosuke Tamura,6 Mary Rhee,7 Michael Bergman8
1Division of Hospital Medicine, Emory University School of Medicine, Atlanta, GA, USA; 2Department of Surgery and Physiology, Cardiovascular Research and Development Center, Faculty of Medicine, University of Porto, Porto, Portugal; 3Department of Endocrinology, Diabetes and Metabolism, Sa&uppertilde;o Joa&uppertilde; o University Hospital Center, Porto, Portugal; 4NYU Grossman School of Medicine, Division of Endocrinology, Diabetes, Metabolism, New York, NY 10016, USA; 5Diabetes, Obesity, and Endocrinology Branch, National Institute of Diabetes & Digestive & Kidney Diseases, National Institutes of Health, Bethesda, MD, USA; 6Social Determinants of Obesity and Cardiovascular Risk Laboratory, Cardiovascular Branch, Division of Intramural Research, National Heart, Lung, and Blood Institute, National Institutes of Health, Bethesda, MD 20892, USA; 7Emory University School of Medicine, Department of Medicine, Division of Endocrinology, Metabolism, and Lipids, Atlanta VA Health Care System, Atlanta, GA 30322, USA; 8NYU Grossman School of Medicine, NYU Diabetes Prevention Program, Endocrinology, Diabetes, Metabolism, VA New York Harbor Healthcare System, Manhattan Campus, New York, NY 10010, USA
Correspondence: Ram Jagannathan
Division of Hospital Medicine, Emory University School of Medicine, Atlanta, GA 30322, USA
Email [email protected]
Abstract: For over 100 years, the oral glucose tolerance test (OGTT) has been the cornerstone for detecting prediabetes and type 2 diabetes (T2DM). In recent decades, controversies have arisen identifying internationally acceptable cut points using fasting plasma glucose (FPG), 2-h post-load glucose (2-h PG), and/or HbA1c for defining intermediate hyperglycemia (prediabetes). Despite this, there has been a steadfast global consensus of the 2-h PG for defining dysglycemic states during the OGTT. This article reviews the history of the OGTT and recent advances in its application, including the glucose challenge test and mathematical modeling for determining the shape of the glucose curve. Pitfalls of the FPG, 2-h PG during the OGTT, and HbA1c are considered as well. Finally, the associations between the 30-minute and 1-hour plasma glucose (1-h PG) levels derived from the OGTT and incidence of diabetes and its complications will be reviewed. The considerable evidence base supports modifying current screening and diagnostic recommendations with the use of the 1‐h PG. Measurement of the 1‐h PG level could increase the likelihood of identifying high-risk individuals when the pancreatic ß-cell function is substantially more intact with the added practical advantage of potentially replacing the conventional 2‐h OGTT making it more acceptable in the clinical setting.
Keywords: OGTT history, OGTT, glycated hemoglobin, diabetes, gestational diabetes, pathophysiology, 1-h post-load glucose, prediction, shape index
Introduction
The global prevalence of type 2 diabetes mellitus (T2DM) is rapidly increasing at an alarming rate as a result of population aging, urbanization, and associated lifestyle changes. Emphasis has been placed on intervening in those with “prediabetes,” defined as levels of fasting plasma glucose (FPG), 2-h post-load glucose (2-h PG), or HbA1c above their consensus-derived normal ranges but below diagnostic thresholds for diabetes. While prediabetes is a risk factor for T2DM, given its high prevalence – affecting 35% of US adults 1 intervening in everyone with prediabetes may not be cost-effective.2 Furthermore, longitudinal observational studies have shown that ~40% of those who progress to T2DM over five years had normal glucose tolerance (NGT) at baseline, suggesting that prediabetes status is not sufficient in identifying a large portion of individuals at risk for diabetes.3 Therefore, reliance on established prediabetes criteria may not only miss a large subset of individuals at high risk of developing T2DM but may identify them later than optimal for lifestyle intervention when earlier treatment may be more effective. The question, therefore, arises as to the earlier recognition of individuals at future risk for T2DM. In this review, we will re-explore intermediate glucose measurements during the OGTT. Clinical application of (“The OGTT Pendulum” Figure 1), initially considered many years ago, the reinstitution of which may improve the identification of individuals at risk for developing T2DM.
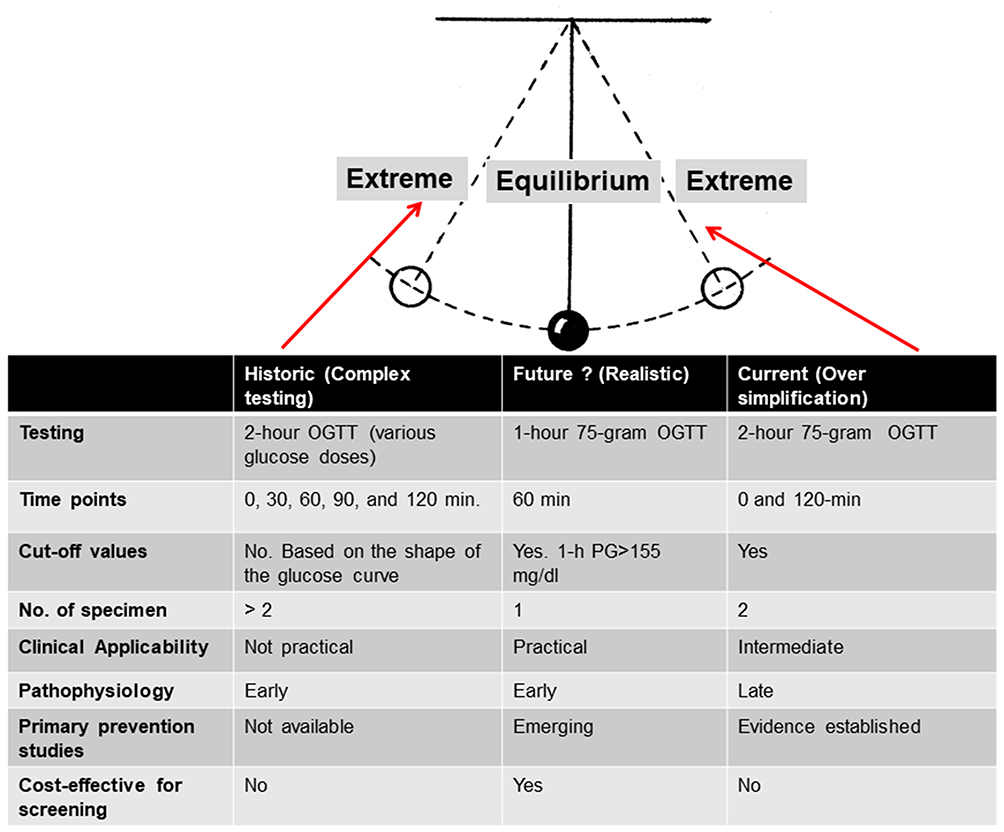 |
Figure 1 The OGTT Pendulum. |
OGTT – History
Accurate quantification of glycemia with reliable and feasible tests for screening and early detection has historically been challenging. Indications for performing the OGTT are numerous (Table 1). The OGTT has evolved considerably over the last century - the glucose solution concentration for testing (50, 75, or 100 g), using plasma glucose instead of whole blood, the timing of sample collection (0, 30, 60, 90, 120 minutes), number of samples required for diagnosis, and the criteria and terminology for diagnosing dysglycemia (eg, prediabetes, chemical, borderline, subclinical, latent or overt diabetes). Plasma glucose concentrations, measured either after an overnight fast or glucose loading, have been the mainstay for diagnosing T2DM for more than a century.4 However, there was little consensus on which cut-points for glucose loading should be considered to diagnose prediabetes and T2DM requiring further re-evaluation.5
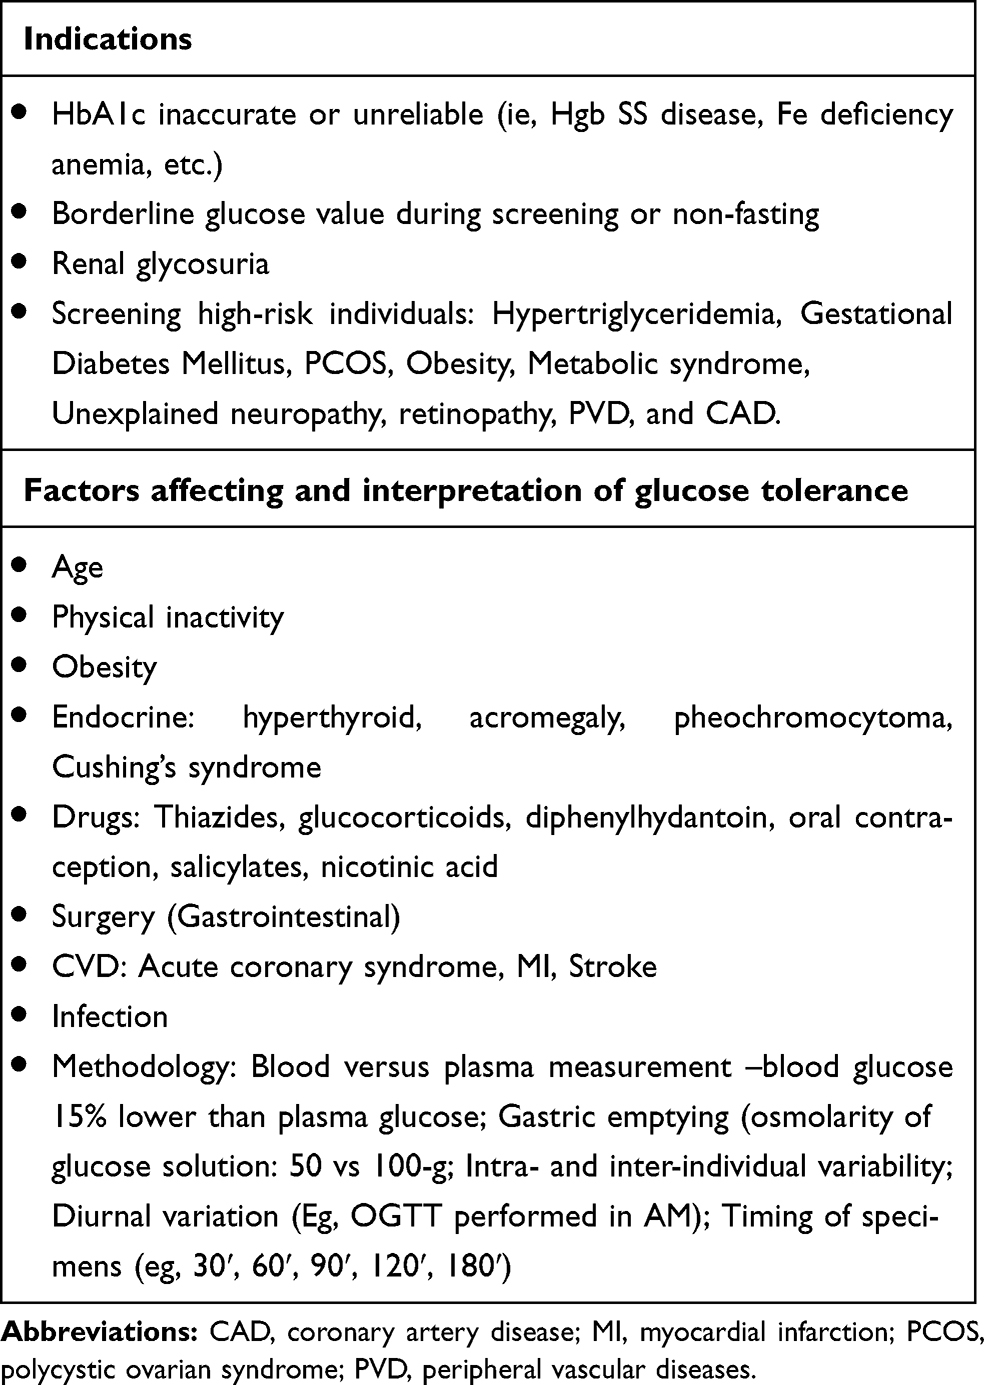 |
Table 1 Indications, Factors Affecting, and Interpretation of OGTT |
Table 2 details the key time points in the history of OGTT standardization and the evolution of diagnosing prediabetes and diabetes. There has been spirited disagreement on the diagnostic criteria for T2DM and the utility of the OGTT in clinical practice.6 The FPG was not always utilized for diagnosing T2DM. The index of glucose excursions, such as the shape of the glucose curve, and area under the curve (AUC), was suggested early in the evolution of the OGTT (recent adaptations are described below). The latter necessitated intermediate glucose measurements, including the 30-minute, 1-hour plasma glucose (threshold of 8.6 mmol/L) was coincident with current research findings discussed below], 90-min, and the 2-hour plasma glucose (2-h PG)). Threshold levels of these intermediate values were relatively lower than those currently endorsed leading to a higher prevalence of detected diabetes. Prediabetes was also not defined in the earlier era of the OGTT.
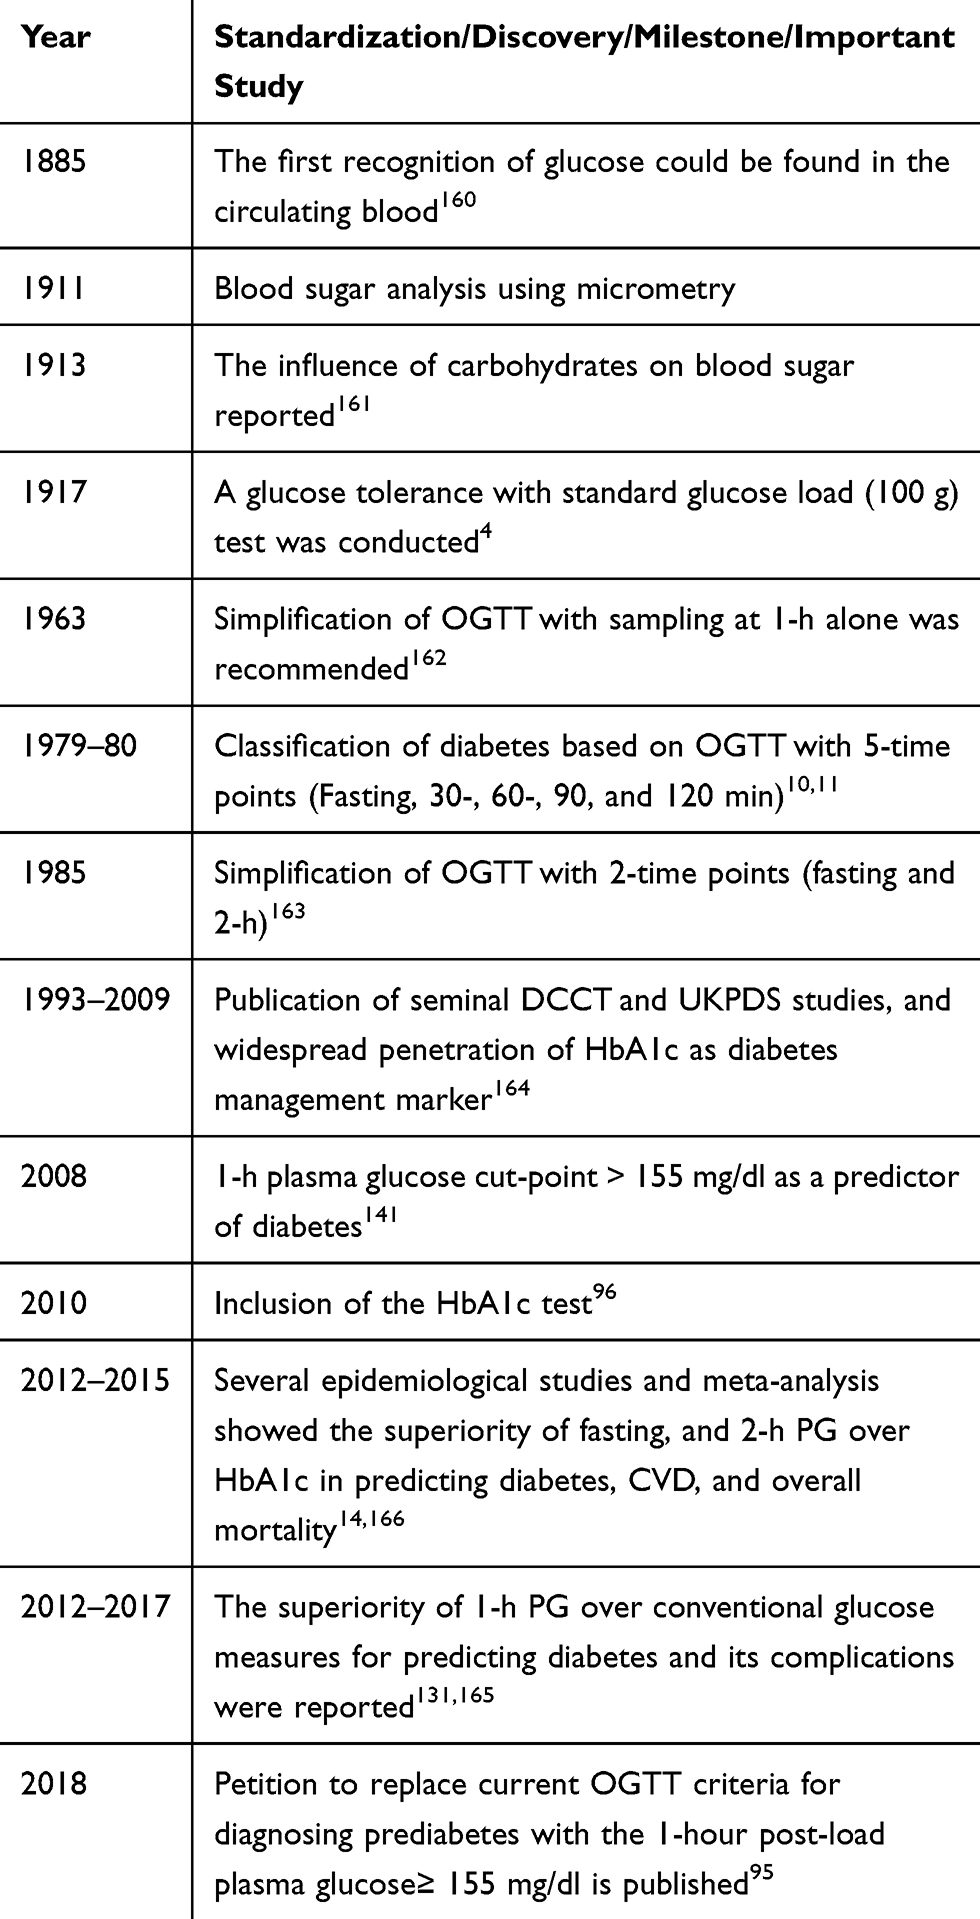 |
Table 2 Overview of the OGTT and the Diagnosis of T2DM |
By the end of the 1960s, it was widely acknowledged that the use of the FPG alone for diagnosis identified individuals too late in the natural history of diabetes. This resulted in the development of at least six different recommendations for oral glucose loads varying from 50 to 100 g with the dosage calculation not based on ideal body weight or body surface.7,8 Subsequently, the American Diabetes Association (ADA) proposed estimation of body surface area to determine the suitable glucose load for the OGTT.9 However, in 1980, the World Health Organization (WHO) recommended global standardization of the OGTT with a 75-g glucose load, which is still currently utilized.10 Concomitantly, data from cross-sectional studies demonstrated a strong linear association between FPG and 2-h PG values with diabetic retinopathy, which led to a commonly agreed-upon protocol, endorsed by the US National Diabetes Data Group (NDDG)11 and the WHO10 for the diagnosis of diabetes (FPG ≥ 7.8 mmol/L) and 2-h PG ≥ 11.1 mmol/L). These cut-points were derived from cross-sectional epidemiological studies that examined retinopathy across a range of glycemic levels. Although the cut-point for 2-h PG is justified based on diabetic retinopathy studies, the optimal value for the diagnosis of FPG has not been adequately standardized. In 1997, an ADA Expert Committee proposed a lower cut-off for the FPG from ≥ 7.8 mmol/L to ≥ 7.0 mmol/L to diagnose diabetes. These thresholds were set to reflect the discrepancy between the 2-h PG and FPG (as many individuals may have a 2-h PG ≥ 11.1 mmol/L and/or an FPG < 7.8 mmol/L as well as to simplify the diagnostic process (FPG versus OGTT).12 Subsequently, in 1999, the WHO also amended the cut-off point of FPG to ≥ 7.0 mmol/L and retained the 2-h PG threshold for diagnosing T2DM. In 2009, glycated hemoglobin (HbA1c) was added for diagnosing diabetes by both the ADA13 and in the following year by the WHO.
Prior to the progression of T2DM, the levels of glucose generally increase to prediabetic states of isolated impaired fasting glycemia (i–IFG), isolated impaired glucose tolerance (i–IGT), or combined glucose intolerance (IFG+IGT).14,15 A recent systematic review and meta-analysis showed that the prevalence of prediabetes and its associations with long-term clinical outcomes differed according to the definition used.16 Several observational and epidemiological studies have examined mechanisms and potential etiological factors leading to the development of the different prediabetic states. Briefly, the pathophysiology of i–IFG encompasses the following key defects: increased hepatic insulin resistance,17 stationary pancreatic ß-cell dysfunction,18 or chronic low ß-cell mass, deranged glucagon-like peptide-1 secretion, and glucagon hypersecretion.19 Conversely, the i–IGT is characterized by heightened peripheral insulin resistance,20 normal hepatic insulin sensitivity, progressive ß-cell dysfunction,18 reduced secretion of the insulinotropic hormones,21 and deranged glucagon secretion.19 Individuals developing combined IFG/IGT exhibit severe defects in both peripheral and hepatic insulin sensitivity as well as a progressive loss of β-cell function.18 Finally, it should be recognized that there are many factors affecting glucose tolerance, and Table 1 describes important considerations for accurately interpreting the OGTT.
Non-Equivalence of FPG and 2-h PG
The diagnosis of T2DM is not established or confirmed based on a single test but rather by repeated measurements of FPG, 2-h PG, or HbA1c. Table 3 describes the advantages and disadvantages of the various traditional diabetes measures such as FPG, OGTT, and HbA1c. The existing glucose-based diagnostic tests, FPG, and the 2-hr PG derived from the OGTT have well-known performance limitations with increased inter-individual variability (FPG (CV: 5.7%; 95% CI: 5.3, 6.1); 2-h PG (CV: 16.7%; 95% CI: 15.0, 18.3); and HbA1c (CV: 3.6%; 95% CI: 3.2, 4.0)).22 As a result, in 1997, the ADA recommended using the FPG instead of the 2-h PG and eliminating the OGTT,23 acknowledging that the FPG cut-point was not equivalent to the 2-h PG value of ≥11.1 mmol/L.24 Subsequently, the WHO advanced similar criteria but was less restrictive about the use of the OGTT. The derived optimal value of FPG of 7.0 mmol/L for diagnosing diabetes was based on a few cross-sectional population studies examining the relationship between the glycemic threshold and diabetic retinopathy.24 Later, it was shown that the association of FPG and 2-h PG was modified by factors such as age, obesity status, sex, and ethnicity. For instance, in a study of Pima Indians, the receiver operating curve (ROC) analysis for diabetic retinopathy identified the optimal FPG cut-off level as 6.8 mmol/L.25 The US National Health and Nutrition Examination Survey III (NHANES III) study also reported that the prevalence of retinopathy increased dramatically with FPG level of 6.7 mmol/L.24 These findings were confirmed by a similar study in Egypt26 in which the optimal FPG cut-off level for detecting diabetic retinopathy was 6.9–7.2 mmol/L. However, these three populations have higher BMI levels compared with Asian populations. In a Japanese study,27 the optimal FPG cut-off values for detecting T2DM (ie, 2-h PG≥ 11.1 mmol/L or diabetic retinopathy was 6.4 mmol/L. Other Asian population studies have reported optimal FPG cut-off levels for retinopathy ranging between 5.6 and 6.0 mmol/L.28–30 These findings suggest that FPG threshold levels are lower in Asian populations. In essence, the strength of association between FPG and 2-h PG is highly variable and affected by various factors. Therefore, revising the diagnostic criteria proposed by the ADA decreasing the need to perform an OGTT not only changed the prevalence of diabetes, but also increased personal and economic consequences.
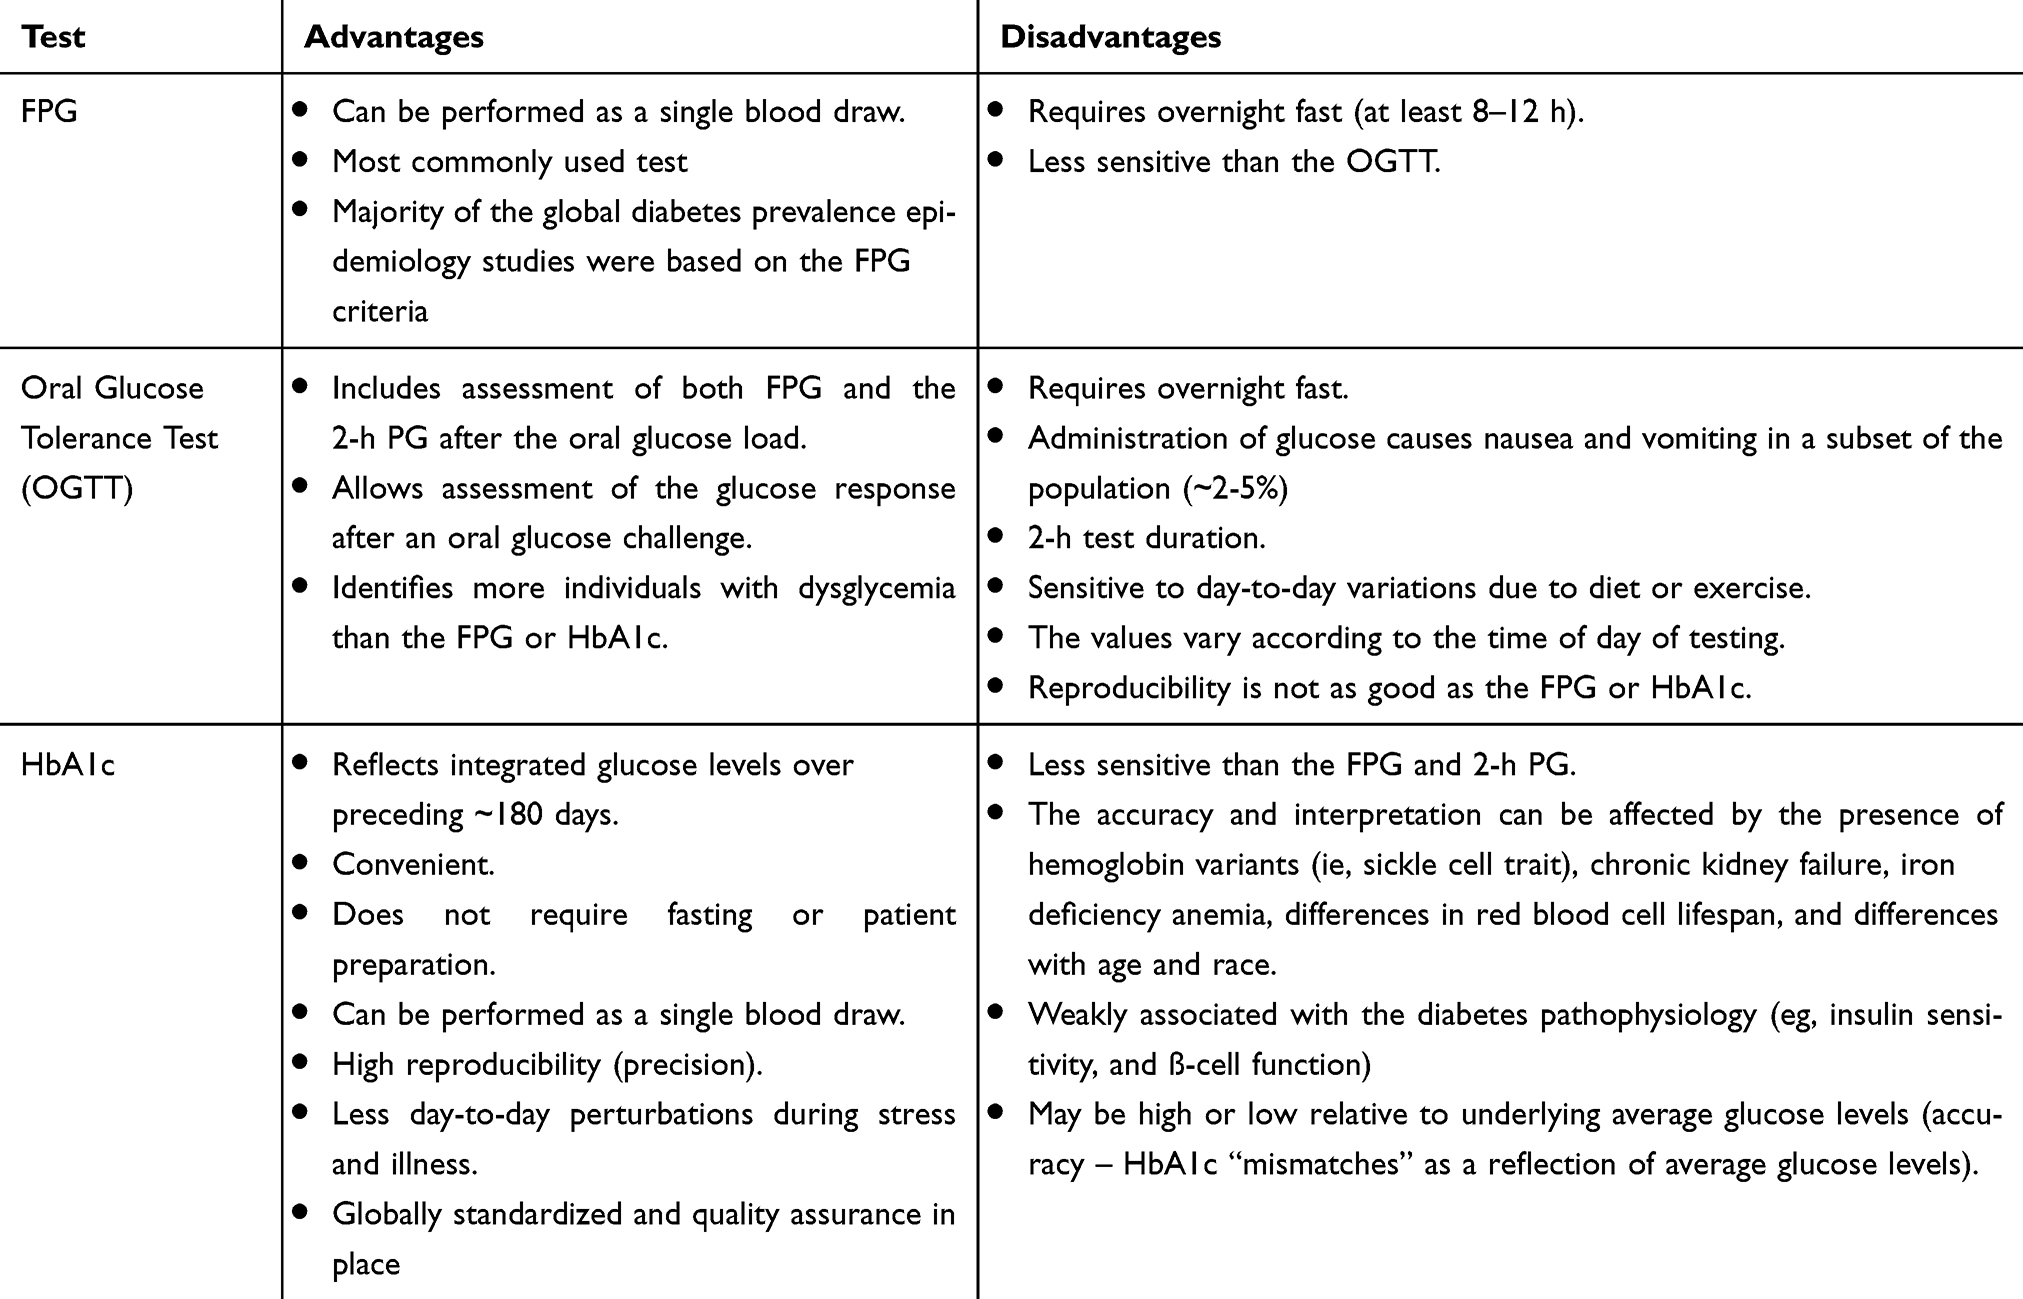 |
Table 3 Advantages and Disadvantages of the Current Diabetes Screening Tests |
HbA1c Not Reliable for Detecting Early Dysglycemia
In 2010, the ADA added the HbA1c measurement to screen and diagnose diabetes in addition to guiding diabetes management. HbA1c has several advantages for the diagnosis of diabetes: a fasting sample collection is not required, performed as a single blood draw, reflects the average glucose level in the last 2–3 months, smaller preanalytical variability than the FPG and 2-h PG measurements, higher reproducibility and is less affected by acute factors (eg, exercise, acute illness) than glucose measurements.31,32 Importantly, it should be noted that HbA1c may not be a sensitive biomarker to detect early dysglycemia. Although HbA1c has become the diagnostic test of choice among most primary care providers to diagnose T2DM and for clinical management in the past two decades,33 it must be emphasized that HbA1c measurement alone is an insensitive biomarker for assessing dysglycemia, particularly in the early stages of prediabetes or T2DM. For instance, analyses of the US NHANES III data from 2005–2006 indicated that the HbA1C cut point ≥ 6.5% identified one-third fewer cases of undiagnosed diabetes than the FPG> 7.0 mmol/L.34 Similar observations were also noted in other studies.35,36 The concordance between HbA1c and OGTT for diagnosis of dysglycemia is low.37,38 In the GENFIEV study, the concordance of HbA1c and OGTT for the determination of prediabetes and diabetes was only 54% and 44%, respectively.38 Different pathophysiological aspects of dysglycemia may be evaluated by the HbA1c and OGTT, as clinical characteristics differ in participants identified by the latter in several studies.38–40 Prediabetes diagnosed with OGTT tends to be associated with more severe metabolic comorbidities38–40 and diabetes-related complications16 than when diagnosed by the HbA1c.
Although the HbA1c range between 5.7%-6.4% is endorsed by ADA for the diagnosis of prediabetes, its ability to predict progression to diabetes is poor in comparison with the 2-h PG during the OGTT.31,41,42 A meta-analysis of 14 studies (n=6410) showed that the relative contribution and strength of association between 2-h PG and HbA1c (r=0.68) was moderate and much weaker than with FPG and HbA1c (r=0.61).43 Importantly, HbA1c is a relatively expensive test, not available in many low- and middle-income countries.44 Furthermore, the prediction of adverse cardiovascular outcomes and all-cause mortality is improved when 2-h PG is used in models including FPG and HbA1c.45
An important consideration in assessing HbA1c for the diagnosis of dysglycemia is the interindividual differences in the correlation between blood glucose levels and HbA1c. The glycation gap refers to the discrepancy in the relationship of HbA1c with glucose or fructosamine46,47 and the hemoglobin glycation index refers to the difference between the measured HbA1c and the level that would be predicted from average blood glucose values.47 Several factors influence the glycation of hemoglobin which may explain the low sensitivity and specificity of HbA1c for the diagnosis of dysglycemia in various settings.48 When the glycation gap is negative or the hemoglobin glycation index is low, HbA1c is lower than the corresponding glucose or fructosamine levels; when the glycation gap is positive or the hemoglobin glycation index is high, the HbA1c is systematically higher. A glycation gap or hemoglobin glycation index corresponding to a difference of 1% of HbA1c or more is found in up to 40% of individuals with diabetes.49 The glycation gap may be partly genetically determined contributing to one-third of the heritability of HbA1c.50 Interindividual differences in intracellular glycation independent of blood glucose appear to be a central mechanism explaining the glycation gap and hemoglobin glycation index.49 The enzyme fructosamine-3-kinase is highly expressed in erythrocytes and promotes deglycation of proteins and is one of the mechanisms contributing to changes in HbA1c not related to glucose levels.51
Several reports have shown that Black individuals have systematically higher HbA1c levels than Whites. Furthermore, HbA1c has been associated with the imprecise classification of T2DM in the Black population than in Whites. In an analysis of the US NHANES 2005–2014 study, the false positive rate for prediabetes or diabetes was 17.6% in the Black population vs 6.3% in Whites.52 A trend for a higher level of HbA1c has also been identified among other ethnic groups, including Hispanics and Asians, even after adjustment for glycemia and other covariates.53,54 In the Mexico City Diabetes Study, 45.5% of participants with a normal OGTT had HbA1c levels ≥6.5%.55
The sensitivity and specificity of HbA1c for the diagnosis of dysglycemia varies with age. HbA1c increases with age independent of glucose tolerance56,57 with both the sensitivity and specificity for diagnosing T2DM decreasing.58 HbA1c performs poorly among children and adolescents in diagnosing prediabetes and T2DM underestimating their prevalence.59
Finally, HbA1c levels can be influenced by various factors (Table 4). Conditions with decreased red cell turnover (eg, iron deficiency, vitamin B12 deficiency, certain hemoglobinopathies) tend to increase HbA1c levels and those with increased turnover of red blood cells (eg, hemolytic anemia, iron/vitamin B12 replacement, treatment with erythropoietin and hemoglobinopathies with increased turnover) are associated with lower HbA1c levels.60,61 Hemoglobinopathies can also interfere with assays for HbA1c measurement.62 Advanced chronic kidney disease is also associated with significant changes in HbA1c. False elevations may be found due to interference from carbamylated hemoglobin and decreased erythropoiesis.63 On the other hand, hemodialysis is typically associated with falsely decreased HbA1c levels due to the uremic environment, decreased erythrocyte lifespan, treatment with erythropoietin or intravenous iron replacement treatment.63,64 Various drugs have also been associated with changes in HbA1c levels independent of blood glucose variations.65–67 HIV patients treated with immunosuppressive agents may have HbA1c discordant with blood glucose levels which therefore results in an underestimation in the prevalence of dysglycemia;68 the HbA1c, therefore, should not be used to assess glycemia in this population.69
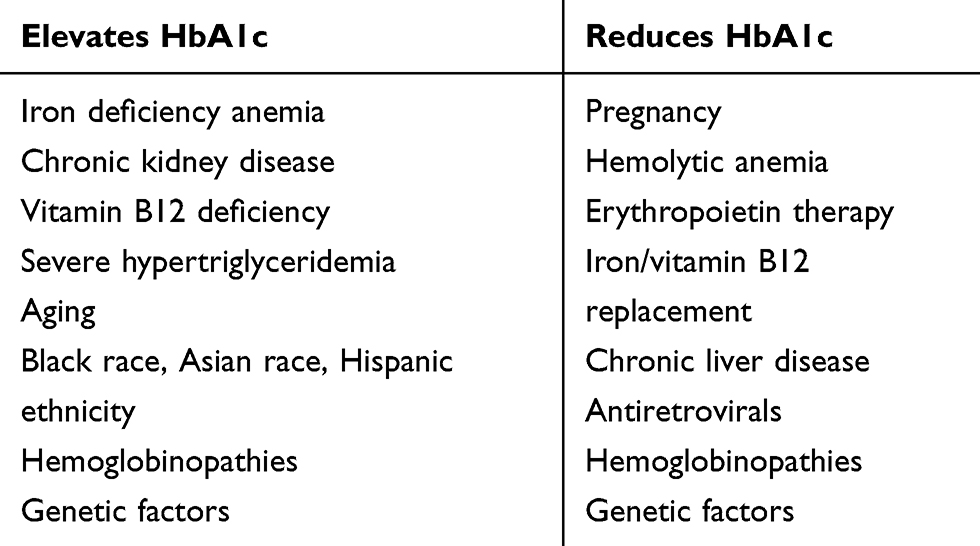 |
Table 4 Main Non-Glycemic Factors Affecting HbA1c Measurement |
To summarize, although HbA1c is a valuable tool for the diagnosis of dysglycemia, screening for high-risk individuals using the HbA1c alone may not be sufficient to substitute for the information derived from OGTT.
OGTT for Detecting Gestational Diabetes Mellitus
The lack of universal consensus for screening and diagnosis of gestational diabetes mellitus (GDM)-a state of glucose intolerance first diagnosed during pregnancy- has led to the use of various diagnostic glucose thresholds internationally.70 Identifying GDM is paramount since maternal and perinatal outcomes of GDM include increased likelihood of maternal (C-section, hypertension, cardiovascular diseases) and neonatal (macrosomia, neonatal hypoglycemia, and perinatal death) risk.71,72
Currently, there are different two-step glucose thresholds that diagnose GDM, such as those defined by the Carpenter and Coustan (CC),73 National Diabetes Data Group (NDDG), and Canadian Diabetes Association (CDA).74 Alternatively, a one-step GDM screening test is recommended by the International Association of Diabetes and Pregnancy Study Groups (IADPSG).75 There has been much debate on whether the one- or two-step GDM screening test should be used. A gold-standard for the screening of GDM is lacking. Screening for undiagnosed T2DM that occurred before conception is suggested at the initiation of prenatal care and for women with increased risk factors such as body mass index (BMI)≥25, history of glucose intolerance, as well as previous pregnancy with GDM, macrosomia, or stillbirth. The best screening test for early GDM or T2DM screening remains unclear with the various testing options and cut-off points the same as in nonpregnant individuals. As discussed in the previous section, although the HbA1c has preanalytical advantages, its clinical utility in the context of GDM has several inadequacies as HbA1c has poor sensitivity for detecting glucose abnormalities, which results in failing to identify many individuals with glucose intolerance.76,77 There have also been concerns with the HbA1c threshold of 6.5% for diagnosis in pregnancy. Fong et al78 found that HbA1c levels 5.7% −6.4% identified individuals at increased risk of GDM. Another study noted that a lower HbA1c cut-off of 5.9% identified all cases of diabetes in pregnancy that was associated with neonatal outcomes such as perinatal death. This criterion is not widely used, although some suggest that HbA1c should be used instead of FPG for the identification of GDM in early pregnancy.79 More studies are needed to select the best early screening test for diabetes in pregnancy.
In 1964, O’Sullivan and Mahan pioneered the diagnostic glucose criteria for GDM using a 100-g 3-h OGTT with whole blood measurements.80 Years later, plasma and serum rather than whole blood glucose levels were analyzed.80 In 1979, the NDDG and then CC in 1982 recommended adjusted values to compensate for the change from whole blood to plasma. The CC glucose thresholds were lower than that of the NDDG (Table 5), which increased GDM prevalence.81 Currently, a 50-gram oral glucose challenge test (GCT) is the traditional two-step screening test for GDM and is initially administered between 24 and 28 weeks of gestation in a non-fasting state. Patients who meet or exceed a screening threshold of 7.2 mmol/L or 7.8 mmol/L after 1-h, depending on the criteria chosen by a clinical site, proceed to a 100-gram oral glucose load in a fasting state. GDM is diagnosed if two or more plasma glucose levels meet or exceed the CC or NDDG values in Table 5. Although the criteria for the two-step test were created to identify women who were at high-risk for diabetes after pregnancy, these did not target perinatal outcomes;82 whether the NDDG or CC criterion should be used to remains controversial. The ADA does not recognize NDDG guidelines but recognizes the two-step CC values or one-step approach.83 Although both the American College of Obstetricians and Gynecologists (ACOG) and the National Institute of Health (NIH) consensus statement endorses the two-step GDM screening, neither endorses a specific criterion (CC vs NDDG) for diagnosing GDM.83 A recent systematic review and content analysis identified 14 guidelines from various international organizations for diagnosing GDM.84 The recommendations of GDM were developed in five domains such as diagnosis of GDM, prenatal care, intrapartum care, neonatal care and postpartum care. The study found that although commonality in ~50% of the recommendations existed, there were still some discrepancies between guidelines. Among all guidelines included, the National Institute for Health and Care Excellence (NICE) guidelines showed the best average score of consistency in each aspect.85
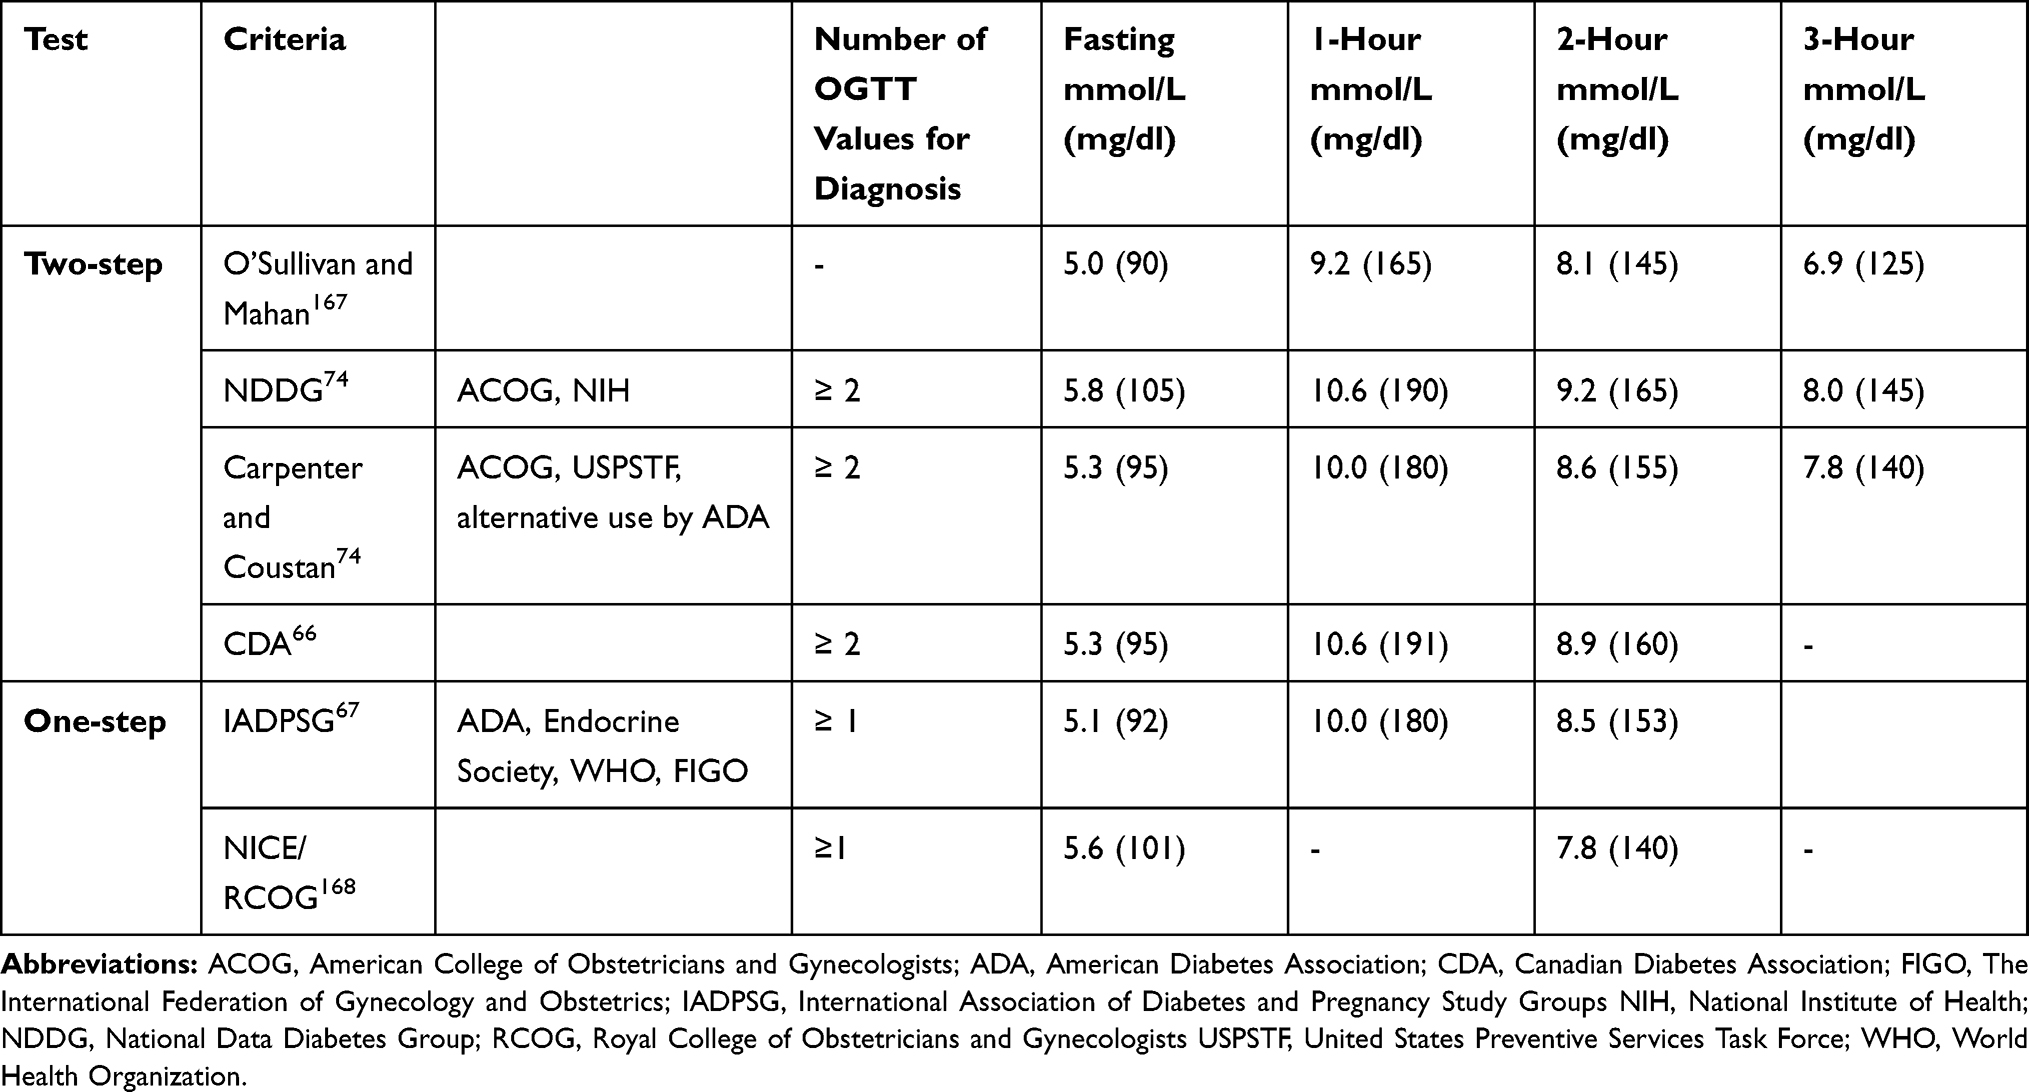 |
Table 5 Diagnostic Criteria Proposed for Gestational Diabetes |
In 2008, the Hyperglycemia and Adverse Pregnancy Outcome (HAPO) study using a 75 g OGTT discovered a continuous relationship between maternal fasting, 1-h, and 2-h PG with primary outcomes that included birth weight >90th percentile, primary C-section delivery, neonatal hypoglycemia, and cord C-peptide >90th percentile. Maternal glucose levels were also associated with secondary outcomes, including preeclampsia, preterm delivery, shoulder dystocia/birth injury, hyperbilirubinemia, and intensive neonatal care. The HAPO study had limitations since there was not a clear glucose threshold that was associated with maternal and neonatal complications.86 Importantly, the risk of the worse perinatal outcome associated with hyperglycemia below the traditional glucose threshold used for diabetes in pregnancy has been controversial. Some believe that other confounding characteristics such as BMI, medical conditions, and advanced maternal age contribute to poor outcomes such as large-for-gestational-age and higher odds of C-section deliver, rather than glucose levels.82
In 1998, the International Association of Diabetes and Pregnancy Study Groups (IADPSG) held an International Workshop-Conference on Gestational Diabetes Diagnosis and Classification and reviewed the published results of the HAPO study. The IADPSG Consensus Panel used findings from the HAPO study to define glucose thresholds during a 75 g OGTT and recommended screening for diabetes in all high-risk women during the first prenatal visit. If a diagnosis of diabetes in pregnancy is made, clinicians should proceed with management and treatment. The IADPSG criteria for GDM were based on the average glucose values observed with FPG, and 1-h or 2-h PG after a 75 g OGTT that were ~1.75 times the odds (compared to the HAPO cohort mean) for birth weight, cord C-peptide, and percentage body fat above the 90th percentile. Glucose thresholds recommended by the IADPSG included FPG≥ 5.1 mmol/L, 1-h PG ≥ 10.0 mmol/L, and 2-h PG≥ 8.5 mmol/L; lower glucose thresholds than recommended by the CC criteria. By these criteria, the incidence of GDM was 17.8%, which is higher than reported by many countries. Also, there were strong associations between maternal glucose with preeclampsia and shoulder dystocia/birth injury with the IADPG glucose thresholds. Furthermore, the frequency of preterm delivery and primary C-section increased with the IADPG criteria. Thus, it was thought that IADPG criteria were better at predicting these outcomes.75
The IADPSG criteria have been endorsed by all major organizations such as WHO, IDF, ADA, and the Endocrine Society.82 However, the US NIH and ACOG, and societies from some countries have not endorsed the IADPG criteria since it would increase the prevalence of GDM, healthcare costs, and interventions, without clear evidence of improvement in maternal and neonatal outcomes.87
Several studies have attempted to address some of these concerns. A secondary analysis of the HAPO study found that the IADPSG criteria identified a significantly higher frequency of birth weight above the 90th percentile, neonatal hypoglycemia, and maternal C-sections.88 In another prospective study, the prevalence of GDM by CC criteria was 10.6% (185 of 1750) and by IADPSG, 35.5% (542 of 1526). Use of IADPSG criteria resulted in significant reductions in rates of prematurity, Cesarean section, large for gestational age, small for gestational age (SGA), and admissions to the neonatal intensive care unit. The one-step IADPSGC was associated with cost-savings compared with the two-step CC criteria because of the reduction in the rate of C-sections and neonatal intensive care unit admissions. There was also no difference in the percentage of patients needing insulin therapy when IADPSG criteria were used. This study indicates that although the new IADPSG criteria were associated with an increased prevalence of GDM, there was an improvement in pregnancy outcomes because of the increased number of women at risk for pregnancy complications who were treated.89
The increase in GDM prevalence and global cost-effectiveness remains a concern and are some of the reasons why the IADPSG criteria have not been universally adopted. Also, a gold-standard screening test may be complicated since there are population differences in the frequency of elevated plasma glucose levels in pregnancy. A more costly examination may not be warranted in certain regions with low rates of GDM.90 More robust studies are needed for the establishment of universal screening criteria for GDM.
The 50g Glucose Challenge Test (GCT): Screening for Dysglycemia in the Nonpregnant Population
The evidence for missed opportunities for diabetes screening91–94 – even in individuals who have had contact with a healthcare system93 – underscores the need for opportunistic screening approaches performed at the point of care which are sensitive, specific, and convenient. Currently, none of the recommended screening tests95,96 fully meet all of these characteristics (see Table 3). However, GCT, a standard component of the two-step screening approach for gestational diabetes (GDM)97,98 described in detail in the previous section, maybe a potential candidate as an optimal screening test given its accuracy and precision in identifying dysglycemia,99,100 and its convenience as a point of care assessment (ie, can be conducted at any time of day, without prior fasting).
The 50g GCT as the initial screening test for GDM has been shown to reduce the required number of confirmatory OGTTs by over 50%.101 Despite its long history in the detection of GDM, the GCT in the nonpregnant population has not been given much consideration, which may be related in part to the small number of studies investigating its clinical utility and to the 1-h test duration. Two studies have evaluated the GCT as a screening test for prediabetes or diabetes in distinct nonpregnant populations without a known diagnosis of diabetes.99,100 In both studies, when compared to the OGTT as the diagnostic standard for analysis, the 50g GCT 1-h PG performed better than HbA1c in detecting either dysglycemia or diabetes99,100 and similarly to FPG99 – findings that were not altered by differences in age, sex, race, BMI, and other risk factors, including the time of day of testing. A GCT 1-h PG cut-off of 8.9 mmol/L had a sensitivity of 82% and specificity of 81% for identifying diabetes in the community-based cohort,100 and a sensitivity of 76% and specificity of 79% in the Veteran cohort.99 A lower cut-off of 7.8 mmol/L provided improved sensitivities of 92% and 87% for diabetes in the latter studies, respectively, but had reduced respective specificities of 63% and 61%.99,100 The 7.8 mmol/L threshold identified 40% of the at-risk population requiring a follow-up OGTT for confirmatory diagnosis, among whom 45% had either diabetes or prediabetes, which represented 18% of the initial screening cohort.100 As such, this approach would allow targeted diagnostic testing in a high-risk subset of the at-risk population.
Compared to the direct costs for screening, the cost of this stepwise approach was lower than that of standard screening recommendations and was deemed cost-effective.99,100 From a healthcare system perspective, GCT-based screening was projected to be cost-saving over three years compared to no testing, particularly in higher-risk individuals with greater age or BMI.102 Furthermore, a recent population-level modeling analysis, using the US NHANES 2013–2014 cohort, demonstrated support for the use of the GCT as part of a two-step approach, similar to that used in the diagnosis of GDM.103 This analysis showed that a GCT followed by an OGTT or FPG identified diabetes more accurately than FPG+OGTT and HbA1c+any standard second test (FPG or 2-h PG), and that lifetime costs and quality-adjusted life-years (QALY) were comparable to those associated with the current recommended screening guidelines (requiring any two positive test results).
Since the 50g GCT is accurate, cost-effective, and relatively convenient, its implementation in the clinical setting as an alternate method for diabetes screening should be considered. One possible approach for implementation into clinical practice might include: i) administration of the 50g glucose drink by clinic staff shortly after patient check-in for individuals meeting ADA screening criteria, ii) glucose sample collection 1-h later, likely after the provider visit, with minimal, if any, increase in appointment duration (national average for visits, 84 minutes),104 and iii) follow-up OGTT or FPG only in individuals with elevated GCT 1-h PG level. However, reluctance to use the GCT as the initial screening test – due to the need for ingestion of the glucose load and the 1-h PG test duration in many at-risk individuals – may pose a barrier despite its accuracy and point of care convenience. As such, uptake of the GCT for routine screening may not be as high as that observed in the pregnant population who are likely highly motivated by concern for maternal/fetal health. Nevertheless, educating primary care providers and patients on the importance of diabetes screening at least every three years, and emphasizing point of care testing, convenience, and accuracy of the GCT,104 should help achieve the necessary buy-in to incorporate its use in many practices. GCT for screening may be particularly helpful in identifying a subgroup of patients with high-risk or with preexisting prediabetes who would benefit most from additional OGTT testing. Therefore, the GCT in a two-step screening approach may maximize the identification of high-risk individuals, while limiting the number requiring further confirmatory testing.
Alternative OGTT-Derived Markers to Identify High-Risk Individuals
Given the limitations of current diagnostic procedures for detecting glucose disorders, it is essential to identify novel biological markers that are inexpensive, feasible, and widely adaptable. Recent studies have demonstrated the shape of the glucose curve as a prognostic marker of T2DM and heightened sensitivity of intermediary measurements during the OGTT, including the 30-min PG or 1-h PG, for predicting progression to diabetes, associated complications, and mortality.105,106
Interpretation of OGTT Using Advanced Mathematical Techniques
A dynamic understanding of OGTT by measuring glucose levels at various intermediary time points has been an active area of interest reflecting insulin sensitivity, secretion, and potential for risk stratification.107–110 Even though the levels of FPG and 2-h PG may be similar amongst individuals, the shape and area-under- the curve (AUC) of their glucose curves might differ, and it accurately reflects the glucose dysmetabolism.
The Area Under the Curve
The Area Under the Curve (AUC) is derived from the OGTT, which is widely used to diagnose dysglycemia and for calculating insulin sensitivity, insulin secretion, and ß-cell dysfunction. The calculation, use, and abuse of AUCGlucose are described in detail elsewhere.111,112 Several epidemiological studies have demonstrated the superiority of the AUCglucose for identifying individuals at high risk for progression to T2DM.113,114 Furthermore, in the Botnia Study and Malmö Prevention Project, total AUCglucose and 1-h PG emerged as the best predictors for identifying incident T2DM in the middle (5-years) and long-term (24- years).114 Due to variations in FPG, the incremental AUC (iAUC) was developed, which has been widely criticized as it provides negative values in ~20% of the population.112 The application of AUC in clinical practice is limited, and a more robust understanding of the integrated OGTT measures is warranted.
The OGTT Shape Index
The shape of the glucose curve during an OGTT was first described over 70 years ago when Engelhardt et al systematically documented the rise and fall of the venous blood glucose after a fixed glucose load that followed a 3-day consistent carbohydrate meal.115 With standardization, patterns in glucose excursion could be easily detected, and the continuous rise in glucose was associated with significant glucosuria and diabetes.116 These and many other studies led to the harmonization of glucose criteria recommended by the NDDG in 1979 and the use of 2-h PG criteria for the diagnosis of diabetes. Although the shape of the OGTT was initially described in the 1950s, it was not until the last two decades that the morphology of the curve has been increasingly appreciated as a prognostic marker of diabetes and a dynamic summary of insulin resistance and secretion.107–110 Since the OGTT is a standard clinical tool, finding additional ways to utilize the information derived from the OGTT makes shape characterization an attractive candidate biomarker with widespread clinical and epidemiological applicability.
The shape of the glucose curve is characterized by the pattern of rising and fall in venous glucose after a fixed glucose intake, most commonly after a 2-h 75 g OGTT. Most studies have defined glucose curve shapes by using at least four prespecified timepoints, but more recent analyses have used modeling to create shape indices that account for the complexity and biological variability of glucose excursions. Characterizing the curve shape is most useful for improving early risk stratification in high-risk individuals who have a fasting and 2-h PG concentrations below the prediabetes and diabetes thresholds, but who have marked postprandial hyperglycemia and would benefit from early interventions.117,118 Broadly, the curve shape can be grouped into 3 main categories when using glucose values collected at fixed time points (eg, 0, 15, 30, 60, 90, 120 minutes) –monophasic (a gradual increase in glucose with a single peak and then fall), biphasic (a gradual rise to a peak, fall in glucose to nadir and subsequent rise), unclassified (a continuous rise without a peak). The rationale for using these definitions stems from the association of the curve shapes with pathological features of T2DM and ease of categorization. Defining the shape of the glucose curve into monophasic vs biphasic shapes was a straightforward means to identify children and adults at the highest risk for progression to diabetes.107–110 The monophasic and unclassified, compared to the biphasic curve, is associated with lower insulin sensitivity and decreased β-cell function across a range of populations.117,119–125 Moreover, compared to the biphasic curve, the monophasic and unclassified curves were better predictors of prediabetes in individuals at high risk for type 1 diabetes, T2DM, or GDM.118,126–128 More recently, the shape of the OGTT curve has also been used as a predictor of treatment outcomes.129 In a randomized controlled treatment trial in youths with T2DM, those with unclassified or monophasic compared to the biphasic shape were more likely to have higher HbA1c and require insulin therapy.129 In another study of healthy participants, response to an anti-diabetic agent was more pronounced in individuals with a monophasic curve at baseline.130 Conversely, Kramer et al, in a healthy volunteer study showed that time to maximal glucose peak during the OGTT displayed reliable reproducibility (ᵏ = 0.76) compared with other morphological features of the OGTT glucose curve such as time to insulin peak, the shape of the glucose curve, glucose nadir below baseline, and 1-h PG.131 A recent comparative analysis by Chung et al122 showed superiority in the ability of the glucose peak >30 mins to predict prediabetes and β-cell function versus the OGTT curve shape.
However, the use of simple shape classifications as a diagnostic and prognostic tool for prediabetes and diabetes is limited.122,132,133 The monophasic shape is the predominant shape in individuals with NGT, resulting in high false-positive rates, especially those with prediabetes.120,122,123,126,132,134 Besides, there is no consistent time factor for categorization, and curve classification may vary depending on the duration of the OGTT.108 The implications of having a monophasic curve during a 2-h test but a biphasic curve after a 3-h test are unknown.108 Overall, the strongest associations of the monophasic curve with prediabetes and diabetes are in the individuals who have large glucose excursions (greater glucose area under the curve), and less complex glucose curve shapes.114,128 Therefore, to help resolve the heterogeneity in glucose curve shape, various statistical and epidemiological modeling techniques have been employed.114,135,136 One example, functional data analysis, utilizes the entire glucose curve to identify typical temporal morphologies instead of single glucose measurements at specific time points. Compared to simple shape classifications, functional component analysis improved risk classification for GDM in their first trimester of pregnancy.133 Latent class trajectory analysis is another statistical tool that gives probabilities for grouping individuals into different morphological classes while considering measurement error intra-individual variability.137 The technique is most robust when using shape classification as a prognostic marker as the assessments have high reproducibility with good discrimination over time. Four distinct patterns have been described-Class 1–4 that correspond to increasing glucose excursions and declining insulin sensitivity and secretion with time.136,138 Class 1 and 2 are associated with the lowest and 3 and 4 the highest diabetes risk. The glucose curve pattern “Class 3” characterized by a high 30-min PG glucose but normal fasting and 2-h PG is notable because it was associated with a ~4-fold increased risk for diabetes over an average of 12 years and higher all-cause mortality rate in a large study of >1000 participants at risk for diabetes and heart disease.139
The morphology of the glucose curve gives summary information of insulin sensitivity and secretion on venous glucose concentrations after a fixed glucose load. The potential for its diagnostic use has been appreciated for many years, but limitations related to increased cost and patient burden associated with collecting blood at 1–3 additional time points and expertise required to assess heterogeneity in curve shapes have limited its widespread clinical use.140 Using a simplified, integrated model that is freely available online will increase accessibility (https://steno.shinyapps.io/grc2 h/). However, before these indices can be adopted as a mainstream prognostic tool, longitudinal analyses comparing shape indices with standard tools for improving diabetes screening and outcomes need to be performed. Future efforts are warranted on the application of sophisticated mathematical and statistical methods such as machine learning algorithms to extract features from OGTT glucose curves in predicting diabetes.141
Glucose Measurements at 30-Min and 1-h During OGTT as a Novel Screening Strategy
The use of traditional biomarkers such as FPG, 2-h PG, and HbA1c levels with limited diagnostic accuracy and high specificity may inadvertently have contributed to the increasing prevalence of glycaemic disorders. As the β-cell function is already substantially impaired in prediabetes based on current definitions, attention should, therefore, be focused on identifying individuals even earlier in the trajectory. As shown in Figure 1, current prediabetes criteria remain inadequate as these identify individuals rather late in the dysglycemic continuum thereby missing a potential opportunity for earlier intervention when the β-cell function is relatively more intact.142 Studies have consistently shown the heightened sensitivity of 30-min and 1-h PG levels for detecting T2DM than established criteria. Shortening the OGTT to 30-min or 1-h should facilitate its use in clinical practice to avoid underdiagnosing high-risk individuals. As Figure 1 illustrates, although historically intermediate time points have long been eliminated from the OGTT to diagnose glucose disorders, accruing evidence supports their reinstitution, particularly the 1-h PG. These values, in retrospect, may have been prematurely eliminated. Thus, it is timely that the pendulum assumes an intermediary position between earlier and more recent positions on the OGTT diagnostic arc. There will always be a necessity to define disease in quantifiable terms so any threshold criteria will inevitably be arbitrary. Nonetheless, redefining threshold values with the 30-min or 1-h PG during the OGTT will improve sensitivity and represents an opportunity to potentially prevent diabetes and its complications.
Prevalence of Elevated 1-h PG
Evidence from large-scale observational studies in a multi-ethnic population has consistently shown that the 1-h PG ≥ 8.6 mmol/L during the OGTT may identify incident T2DM and associated complications better than conventional glycemic markers (FPG, 2-h PG, and HbA1c).143,144 A recent systematic review showed that the prevalence of NGT with a 1-h PG ≥8.6 mmol/L varied based on the study design, ranging from 11–16% in population-based observational studies to ~25-42% in high-risk cohorts with at least one cardiovascular risk factor.144 All of these studies consistently showed that the prevalence of an elevated 1-h PG increases as glucose tolerance deteriorates, with >50% individuals with combined IFG+IGT and >90% of newly diagnosed T2DM having a 1-h PG ≥8.6 mmol/L.
1-h PG and Pathophysiology
Non-diabetic, healthy adults in the Relationship between Insulin Sensitivity and Cardiovascular Risk (RISC) study demonstrated that the association between 1-h PG and insulin action was similar to the 2-h PG determined by the hyperinsulinemic-euglycemic clamp as a reference standard.145 The EUGENE study showed that individuals with NGT and a 1-h PG>8.6 mmol/L had reduced peripheral insulin sensitivity and acute insulin response compared to those with NGT and 1-h PG < 8.6 mmol/L. Furthermore, the study found that there were no apparent differences in insulin sensitivity and ß-cell function levels between those with NGT and 1-h PG >8.6 mmol/L and IGT.145 Recently, in a non-diabetic Native American cohort, Paddock et al146 showed a stronger association of 1-h PG> 8.6 mmol/L with acute insulin response and insulin-stimulated glucose disposal compared with lower values. Similar to the San Antonio Heart Study,147 other studies have confirmed the association between 1-h PG with insulin sensitivity and pancreatic β-cell function.148–150 In a real-world clinical setting, we observed a stronger association of 1-h PG with surrogate insulin sensitivity and pancreatic β-cell function compared with conventional traditional measures such as FPG, 2-h PG, and HbA1c.151 To summarize, higher 1-h PG values were strongly associated with diabetes pathophysiological features and the strength of association was more reliable than IFG or HbA1c-based prediabetic criteria and comparable to that of the IGT phenotype.
Association of 1-h PG with Incident Diabetes
Several studies in different ethnic groups have shown that intermediary glucose values at 30-min152 and 1-h PG105 predicted an increased risk of incident T2DM. Furthermore, the effect of an elevated 1-h PG was more pronounced in NGT and isolated IFG (i–IFG) than those with IGT. Abdul Ghani et al113 demonstrated in the San Antonio Heart Study cohort of Mexican American individuals that the 30-min and 1-h PG were superior to FPG, 2-h PG, and HbA1c levels for predicting incident diabetes over eight years. The addition of 1-h PG to existing multivariable models and risk scores comprised of age, parental history of diabetes, BMI, use of hypertensive medications, and lipid measurements led to significant improvements in the area under the ROC curve (risk score model: 0.65; risk score + 1-h PG: 0.81). They also suggested the potential benefit of combining 1-h PG≥ 8.6 mmol/L with ATP III criteria for the metabolic syndrome to stratify individuals at risk of developing T2DM (metabolic syndrome + 1-h PG: 0.81). Subsequently, the superiority of 1-h PG versus the 2-h PG during OGTT in predicting T2DM was replicated in the longitudinal Botnia Study153 in Finland and the Malmö Preventive Project154 in Sweden. Large scale epidemiological studies conducted in other populations including Korea,155 Israel,156 Japan,148 China,149 Native Americans,146 Asian Indians,157 Peruvian,158 and Thailand159 confirmed a strong and independent association of 1-h PG with incident diabetes. Furthermore, using real-world clinical data, we have successfully tested the accuracy of HbA1c and the 1-h PG versus the FPG and 2-h PG from the OGTT as a reference standard. This study found that the level of agreement was twofold higher for the 1-h PG ≥ 8.6 mmol/L (95% CI: 0.40[0.28–0.53)]) than HbA1c categories defined by the ADA [HbA1c: 5.7% −6.4%; 0.1(0.03–0.16)] and the IEC [HbA1c: 6.0–6.4%; 0.17(0.04–0.30)].160 Recently, modified derivation of Diabetes Prevention Trial-Type 1 risk score (DPTRS), by replacing 2-h OGTT information with 1-h OGTT data (DPTRS60) has accurately predicted Type 1 Diabetes.161
Elevated 1-h PG and Cardiovascular Risk Factors
Several studies have reported that those with NGT and 1-h PG> 8.6 mmol/L levels displayed an adverse cardiovascular risk profile, akin to prediabetic individuals.105 For instance, NGT individuals with 1-h PG >8.6 mmol/L were found to have higher BMI, abdominal obesity, and a detrimental atherogenic lipid pattern, uric acid, apolipoprotein levels, and elevated levels of inflammatory and coagulation factors compared with NGT individuals with 1-h PG levels< 8.6 mmol/L. A series of epidemiologic analyses from the CATAnzaro Metabolic RIsk factors (CATAMERI) study provided mechanistic insights into the association of 1-h PG with various cardiovascular risk factors. This cohort has demonstrated an association between an elevated 1-h PG in individuals with NGT and subclinical target organ damage such as carotid atherosclerosis,162 cardiac insulin resistance,163 fatty liver,164,165 and impaired kidney function.166 Similar observations were also noted in other cohort studies.167–169 Overall, these data provide evidence associating the 1-h PG >8.6 mmol/L and a plethora of cardiovascular risk factors and support its utility as a tool to identify a subgroup of individuals with NGT at increased risk not only for T2DM but also for cardiovascular disease.
Elevated 1-h PG and Diabetes-Related Complications and Mortality
Several longitudinal studies have evaluated the impact of 1-h PG on cardiovascular adverse events and all-cause mortality. In the population-based Chicago Heart Association Detection Project in Industry Study, an elevated baseline 1-h PG was an independent risk factor for coronary heart disease, stroke, and overall mortality.170 Similar findings were also observed in the Erfurt Male Cohort Study in Germany, Helsinki Businessmen Study,171 in Finland.171 In the Israel GOH study, an elevated 1-h PG in those with NGT was found to predict CVD and all-cause mortality during a 33-year follow-up. Recently, 39-year follow-up data from the Malmö Study found that an elevated 1-h PG was an independent predictor of cardiovascular and all-cause mortality in NGT individuals. The risk of death was even higher in those with an elevated 1-h PG than in IGT. Furthermore, those with an elevated 1-h PG and IGT had worse cardiovascular and mortality outcomes.
In summary, identifying high‐risk individuals with 1‐h PG is an important and novel strategy to avert the development of T2DM and cardiovascular disease. Recently, the retrospective analysis from the STOP Diabetes Study showed the clinical effectiveness of tailoring pharmacotherapy by stratifying individuals based on 1-h PG levels.172
30-Minute-Plasma Glucose and Diabetes
In a cross-sectional analysis in Chinese adults, Zhou et al identified a 30-min PG >9.7 mmol/L as a threshold for prediabetes and >11.2 mmol/L as a cut-off for diabetes using ROC analysis.173 Additionally, a randomized controlled study among Asian Indians showed that 30-min PG values in the upper tertile (>10.5 mmol/L) were independently associated with an increased risk of developing diabetes compared with values in the lowest tertile (<9.05 mmol/L) with an aHR of 1.44 (95% CI: 1.01–2.06).130 Furthermore, a recent secondary analysis from randomized controlled trials among South Asians with prediabetes at baseline showed an independent association between 30-min PG with the incidence of diabetes.106,152 Finally, we demonstrated that the addition of the 30-min PG values to a traditional glucose biomarker such as FPG and 2-h PG values significantly improved the net reclassification improvement and was able to discriminate individuals with prediabetes into low-, and high-risk groups.106 Additional longer-term, population-based studies are needed to expand our understanding of the role of 30-min PG with diabetes and its associated complications.
Conclusions
A shift to diagnosing high-risk individuals even earlier than current screening modalities offers the potential opportunity for further reducing progression to diabetes, development of microvascular complications, and mortality, thereby advancing benefit beyond what has been demonstrated in global diabetes prevention programs. Extant diagnostic tests, as the FPG, 2-h PG, and HbA1c, have performance limitations and are not adequate to identify high-risk individuals. Consistent epidemiologic evidence from diverse populations substantiates the conclusion that 1-h PG>8.6 mmol/L appears to be a better alternative for identifying high-risk individuals at a stage when the pancreatic ß-cell function is substantially more intact. The elevated 1-h PG level has been associated with adverse biologic properties and shown to be a marker for subclinical target organ damage which may explain the increased risk for cardiovascular disease and mortality in addition to the risk for progression to T2DM. Therefore, aggregate findings support the proposal that a 1-h PG level ≥ 8.6 mmol/L should be considered for adoption into clinical practice.105 Identifying high-risk individuals using the 1-h PG is a novel strategy for the prevention of T2DM. If consensus by national and international organizations can be achieved, the1-h PG levels could eventually replace the 2-h OGTT making it more acceptable in clinical practice.
Disclosure
STC is supported by the Intramural Research Program of the NIH, The National Institute of Diabetes and Digestive and Kidney Diseases. Dr Mary Rhee reports clinical trial, site co-investigator for Boehringer Ingelheim, grants from National Institutes of Health, research support from Veterans Affairs (VA), outside the submitted work. MKR is supported in part by the NIH (U01 DK091958, U01 DK2U01DK098246, R03 AI133172, P30 DK111024, R21 AI156161), VA (VA I01 CX001737, IK2 RX002928), and Boehringer Ingelheim. MKR is also supported in part by the Veterans Health Administration (VA); this work is not intended to reflect the official opinion of the VA or the US government. The authors report no other potential conflicts of interest for this work.
References
1. Centers for Disease Control and Prevention. (2017). National diabetes statistics report, 2017.
2. Kahn R, Davidson MB. The reality of type 2 diabetes prevention. Diabetes Care. 2014;37:943–949.
3. Unwin N, Shaw J. Zimmet P and Alberti KG. Impaired glucose tolerance and impaired fasting glycaemia: the current status on definition and intervention. Diabet Med. 2002;19:708–723.
4. Bang. Der Blutzucker. J F Bergmann, Wiesbaden; 1913.
5. Wong TY, Liew G, Tapp RJ, et al. Zimmet P and Shaw J. Relation between fasting glucose and retinopathy for diagnosis of diabetes: three population-based cross-sectional studies. Lancet. 2008;371:736–743.
6. Siperstein MD. The glucose tolerance test: a pitfall in the diagnosis of diabetes mellitus. Adv Intern Med. 1975;20:297–323.
7. de Nobel E, Van’t Laar A. The size of the loading dose as an important determinant of the results of the oral glucose tolerance test: a study in subjects with slightly impaired glucose tolerance. Diabetes. 1978;27:42–48.
8. Toeller M, Knussmann R. Reproducibility of oral glucose tolerance tests with three different loads. Diabetologia. 1973;9:102–107.
9. Standardization of the oral glucose tolerance test. Report of the Committee on Statistics of the American Diabetes Association June 14, 1968. Diabetes. 1969;18:299–307.
10. WHO Expert Committee. Diabetes Mellitus: second report. World Health Organ Tech Rep Ser. 1980;646:1–80.
11. National Diabetes Data Group. Classification and diagnosis of diabetes mellitus and other categories of glucose intolerance. Diabetes. 1979;28(12):1039–1057. doi:10.2337/diab.28.12.1039
12. Gavin III JR, Alberti K, Davidson MB. Report of the expert committee on the diagnosis and classification of diabetes mellitus. Diabetes care. 1997;20:1183.
13. care IECJD. International Expert Committee report on the role of the A1C assay in the diagnosis of diabetes. Diabetes care. 2009;32:1327–1334.
14. Færch K, Borch-Johnsen K. Holst JJ and Vaag A. Pathophysiology and aetiology of impaired fasting glycaemia and impaired glucose tolerance: does it matter for prevention and treatment of type 2 diabetes? Diabetologia. 2009;52:1714–1723.
15. Meigs JB, Muller DC, Nathan DM. The Natural History of Progression From Normal Glucose Tolerance to Type 2 Diabetes in the Baltimore Longitudinal Study of Aging. Diabetes. 2003;52:1475–1484.
16. Cai X, Zhang Y, Li M, et al. Association between prediabetes and risk of all cause mortality and cardiovascular disease: updated meta-analysis. bmj. 2020;370:m2297.
17. Bock G, Chittilapilly E, Basu R, et al. Contribution of hepatic and extrahepatic insulin resistance to the pathogenesis of impaired fasting glucose: role of increased rates of gluconeogenesis. Diabetes. 2007;56:1703–1711.
18. Weir GC, Bonner-Weir SJD. Five stages of evolving beta-cell dysfunction during progression to diabetes. Diabetes. 2004;53:S16–S21.
19. Færch K, Torekov SS, Vistisen D, et al. Response to oral glucose is reduced in prediabetes, screen-detected type 2 diabetes, and obesity and influenced by sex: the ADDITION-PRO study. Diabetes. 2015;64:2513–2525.
20. Kim SH, Reaven GM. Isolated Impaired Fasting Glucose and Peripheral Insulin Sensitivity. Not a Simple Relationship. 2008;31:347–352.
21. Rask E, Olsson T, Söderberg S, Holst JJ, Tura A. Insulin secretion and incretin hormones after oral glucose in non-obese subjects with impaired glucose tolerance. Metabolism. 2004;53:624–631.
22. Selvin E, Crainiceanu CM, Brancati FL, Coresh J. Short-term variability in measures of glycemia and implications for the classification of diabetes. Arch internal med. 2007;167:1545–1551.
23. Shaw JE. Zimmet PZ and Alberti KG. Point: impaired fasting glucose: the case for the new American Diabetes Association criterion. Diabetes Care. 2006;29:1170–1172.
24. Herman WH. Report of the Expert Committee on the Diagnosis and Classification of Diabetes Mellitus. Diabetes Care. 1997;20:1183–1197.
25. Hanson RL, Nelson RG, McCance DR, Beart JA, Charles MA. Pettitt DJ and Knowler WC. Comparison of screening tests for non-insulin-dependent diabetes mellitus. Arch Intern Med. 1993;153:2133–2140.
26. Engelgau MM, Thompson TJ, Herman WH, et al. Sous ES and Ali MA. Comparison of fasting and 2-hour glucose and HbA1c levels for diagnosing diabetes. Diagnostic criteria and performance revisited. Diabetes Care. 1997;20:785–791.
27. Doi Y, Kubo M, Yonemoto K. Fasting plasma glucose cutoff for diagnosis of diabetes in a Japanese population. J Clin Endocrinol Metab. 2008;93:3425–3429.
28. Ko GT, Chan JC, Lau E. Woo J and Cockram CS. Fasting plasma glucose as a screening test for diabetes and its relationship with cardiovascular risk factors in Hong Kong Chinese. Diabetes Care. 1997;20:170–172.
29. Ramachandran A, Snehalatha C. Vijay V and Viswanathan M. Fasting plasma glucose in the diagnosis of diabetes mellitus: a study from southern India. Diabet Med. 1993;10:811–813.
30. Chang CJ, Wu JS, Lu FH, Lee HL. Yang YC and Wen MJ. Fasting plasma glucose in screening for diabetes in the Taiwanese population. Diabetes Care. 1998;21:1856–1860.
31. Bergman M, Abdul-Ghani M, DeFronzo RA, et al. Ibrahim N and Buysschaert M. Review of methods for detecting glycemic disorders. Diabetes Res Clin Pract. 2020;165:108233.
32. Sacks DB. A1C versus glucose testing: a comparison. Diabetes Care. 2011;34:518–523.
33. Day A. HbA1c and diagnosis of diabetes. The test has finally come of age. Ann Clin Biochem. 2012;49:7–8.
34. Olson DE, Rhee MK, Herrick K, Ziemer DC. Twombly JG and Phillips LS. Screening for diabetes and pre-diabetes with proposed A1C-based diagnostic criteria. Diabetes Care. 2010;33:2184–2189.
35. Mostafa SA, Davies MJ, Webb D, Gray LJ, Srinivasan BT. Jarvis J and Khunti K. The potential impact of using glycated haemoglobin as the preferred diagnostic tool for detecting Type 2 diabetes mellitus. Diabet Med. 2010;27:762–769.
36. Zhou X, Pang Z, Gao W, Wang S, Zhang L. Ning F and Qiao Q. Performance of an A1C and fasting capillary blood glucose test for screening newly diagnosed diabetes and pre-diabetes defined by an oral glucose tolerance test in Qingdao, China. Diabetes Care. 2010;33:545–550.
37. Chatzianagnostou K, Vigna L, Di Piazza S, et al. Traghella I and Vassalle C. Low concordance between HbA1c and OGTT to diagnose prediabetes and diabetes in overweight or obesity. Clin Endocrinol (Oxf). 2019;91:411–416.
38. Bianchi C, Miccoli R, Bonadonna RC, et al. Leonetti F and Del Prato S. Pathogenetic mechanisms and cardiovascular risk: differences between HbA(1c) and oral glucose tolerance test for the diagnosis of glucose tolerance. Diabetes Care. 2012;35:2607–2612.
39. Iskandar S, Migahid A, Kamal D, et al. Glycated hemoglobin versus oral glucose tolerance test in the identification of subjects with prediabetes in Qatari population. BMC Endocr Disord. 2019;19:87.
40. Hutchinson MS, Joakimsen RM, Njølstad I, Schirmer H. Figenschau Y and Jorde R. Glycated hemoglobin in diagnosis of diabetes mellitus and pre-diabetes; validation by oral glucose tolerance test. The Tromsø OGTT Study. J Endocrinol Invest. 2012;35:835–840.
41. Peddinti G, Bergman M. Tuomi T and Groop L. 1-Hour Post-OGTT Glucose Improves the Early Prediction of Type 2 Diabetes by Clinical and Metabolic Markers. J Clin Endocrinol Metab. 2019;104:1131–1140.
42. Morris DH, Khunti K, Achana F, Srinivasan B, Gray LJ. Davies MJ and Webb D. Progression rates from HbA1c 6.0-6.4% and other prediabetes definitions to type 2 diabetes: a meta-analysis. Diabetologia. 2013;56:1489–1493.
43. Ketema EB, Kibret KT. Correlation of fasting and postprandial plasma glucose with HbA1c in assessing glycemic control; systematic review and meta-analysis. Arch Public Health. 2015;73:43.
44. Park PH, Pastakia SD. Access to Hemoglobin A1c in Rural Africa: A Difficult Reality with Severe Consequences. J Diabetes Res. 2018;2018:6093595.
45. Lu J, He J, Li M, et al. Wang W and Bi Y. Predictive Value of Fasting Glucose, Postload Glucose, and Hemoglobin A(1c) on Risk of Diabetes and Complications in Chinese Adults. Diabetes Care. 2019;42:1539–1548.
46. Nayak AU, Holland MR, Macdonald DR. Nevill A and Singh BM. Evidence for consistency of the glycation gap in diabetes. Diabetes Care. 2011;34:1712–1716.
47. Cohen RM, Holmes YR. Chenier TC and Joiner CH. Discordance between HbA1c and fructosamine: evidence for a glycosylation gap and its relation to diabetic nephropathy. Diabetes Care. 2003;26:163–167.
48. Welsh KJ. Kirkman MS and Sacks DB. Role of Glycated Proteins in the Diagnosis and Management of Diabetes: research Gaps and Future Directions. Diabetes Care. 2016;39:1299–1306.
49. Nayak AU. Singh BM and Dunmore SJ. Potential Clinical Error Arising From Use of HbA1c in Diabetes: effects of the Glycation Gap. Endocr Rev. 2019;40:988–999.
50. Cohen RM, Snieder H, Lindsell CJ, et al. Spector TD and Leslie RD. Evidence for independent heritability of the glycation gap (glycosylation gap) fraction of HbA1c in nondiabetic twins. Diabetes Care. 2006;29:1739–1743.
51. Dunmore SJ, Al-Derawi AS, Nayak AU, et al. Brown JE and Singh BM. Evidence That Differences in Fructosamine-3-Kinase Activity May Be Associated With the Glycation Gap in Human Diabetes. Diabetes. 2018;67:131–136.
52. Ford CN, Leet RW, Kipling LM, Rhee MK, Jackson SL, Wilson PWF. Phillips LS and Staimez LR. Racial differences in performance of HbA(1c) for the classification of diabetes and prediabetes among US adults of non-Hispanic black and white race. Diabetic Med. 2019;36:1234–1242.
53. Avilés-Santa ML, Hsu LL, Arredondo M, et al. Talavera GA and Cowie CC. Differences in Hemoglobin A1c Between Hispanics/Latinos and Non-Hispanic Whites: an Analysis of the Hispanic Community Health Study/Study of Latinos and the 2007-2012 National Health and Nutrition Examination Survey. Diabetes Care. 2016;39:1010–1017.
54. Cohen RM. A1C: does one size fit all? Diabetes Care. 2007;30:2756–2758.
55. López López R, Fuentes García R, González-Villalpando ME, González-Villalpando C. Diabetic by HbA1c, Normal by OGTT: A Frequent Finding in the Mexico City Diabetes Study. J Endocr Soc. 2017;1:1247–1258.
56. Davidson MB, Schriger DL. Effect of age and race/ethnicity on HbA1c levels in people without known diabetes mellitus: implications for the diagnosis of diabetes. Diabetes Res Clin Pract. 2010;87:415–421.
57. Lipska KJ, De Rekeneire N, Van Ness PH, et al. Gill TM and Inzucchi SE. Identifying dysglycemic states in older adults: implications of the emerging use of hemoglobin A1c. J Clin Endocrinol Metab. 2010;95:5289–5295.
58. Wu L, Lin H, Gao J, et al. Pan B and Gao X. Effect of age on the diagnostic efficiency of HbA1c for diabetes in a Chinese middle-aged and elderly population: the Shanghai Changfeng Study. PLoS One. 2017;12:e0184607.
59. Nowicka P, Santoro N, Liu H, et al. Rose P and Caprio S. Utility of hemoglobin A(1c) for diagnosing prediabetes and diabetes in obese children and adolescents. Diabetes Care. 2011;34:1306–1311.
60. Hardikar PS, Joshi SM, Bhat DS, et al. Fall CH and Yajnik CS. Spuriously high prevalence of prediabetes diagnosed by HbA(1c) in young indians partly explained by hematological factors and iron deficiency anemia. Diabetes Care. 2012;35:797–802.
61. Attard SM, Herring AH, Wang H, et al. Implications of iron deficiency/anemia on the classification of diabetes using HbA1c. Nutr Diabetes. 2015;5:e166.
62. Rhea JM, Molinaro R. Pathology consultation on HbA(1c) methods and interferences. Am J Clin Pathol. 2014;141:5–16.
63. Speeckaert M, Van Biesen W, Delanghe J, et al. Vanholder R and Nistor I. Are there better alternatives than haemoglobin A1c to estimate glycaemic control in the chronic kidney disease population? Nephrol Dial Transplant. 2014;29:2167–2177.
64. Vos FE, Schollum JB, Coulter CV, Doyle TC. Duffull SB and Walker RJ. Red blood cell survival in long-term dialysis patients. Am j Kidney Dis. 2011;58:591–598.
65. Albright ES. Ovalle F and Bell DS. Artificially low hemoglobin A1c caused by use of dapsone. Endocr Pract. 2002;8:370–372.
66. Diop ME, Bastard JP, Meunier N, Thévenet S, Maachi M, Capeau J. Pialoux G and Vigouroux C. Inappropriately low glycated hemoglobin values and hemolysis in HIV-infected patients. AIDS Res Hum Retroviruses. 2006;22:1242–1247.
67. Robertson M. Artificially low HbA1c associated with treatment with ribavirin. BMJ. 2008;336:505.
68. Bergman M, Abdul-Ghani M, Neves JS, Monteiro MP, Medina JL. Dorcely B and Buysschaert M. Pitfalls of HbA1c in the Diagnosis of Diabetes. J Clin Endocrinol Metab. 2020;105:1254.
69. Avari P, Devendra S. Human immunodeficiency virus and type 2 diabetes. London J Prim Care. 2017;9:38–42.
70. Agarwal MM. Gestational diabetes mellitus: an update on the current international diagnostic criteria. World J Diabetes. 2015;6:782–791.
71. Gandhi P, Bustani R. Madhuvrata P and Farrell T. Introduction of metformin for gestational diabetes mellitus in clinical practice: has it had an impact? Eur J Obstet Gynecol Reprod Biol. 2012;160:147–150.
72. Kramer CK. Campbell S and Retnakaran R. Gestational diabetes and the risk of cardiovascular disease in women: a systematic review and meta-analysis. Diabetologia. 2019;62:905–914.
73. Harper LM, Mele L, Landon MB, et al. Eunice Kennedy Shriver National Institute of Child H and Human Development Maternal-Fetal Medicine Units N. Carpenter-Coustan Compared With National Diabetes Data Group Criteria for Diagnosing Gestational Diabetes. Obstet Gynecol. 2016;127:893–898.
74. Feig DS, Berger H, Donovan L, et al. Pregnancy. Canadian j Diabetes. 2018;42(Suppl 1):S255–s282.
75. International Association of D, Pregnancy Study Groups Consensus P. International association of diabetes and pregnancy study groups recommendations on the diagnosis and classification of hyperglycemia in pregnancy. Diabetes Care. 2010;33:676–682.
76. Picón MJ, Murri M, Muñoz A, Fernández-García JC. Gomez-Huelgas R and Tinahones FJ. Hemoglobin A1c Versus Oral Glucose Tolerance Test in Postpartum Diabetes Screening. Diabetes. 2012;35:1648–1653.
77. Hughes RC. Rowan J and Florkowski CM. Is There a Role for HbA1c in Pregnancy? Curr Diab Rep. 2016;16:5.
78. Fong A, Serra AE, Gabby L. Wing DA and Berkowitz KM. Use of hemoglobin A1c as an early predictor of gestational diabetes mellitus. Am J Obstet Gynecol. 2014;211:
79. McIntyre HD, Sacks DA, Barbour LA, Feig DS, Catalano PM. Damm P and McElduff A. Issues With the Diagnosis and Classification of Hyperglycemia in Early Pregnancy. Diabetes Care. 2016;39:53.
80. Bhavadharini B, Uma R. Saravanan P and Mohan V. Screening and diagnosis of gestational diabetes mellitus – relevance to low and middle income countries. Clin Diabetes Endocrinol. 2016;2:13.
81. Ferrara A, Hedderson MM. Quesenberry CP and Selby JV. Prevalence of gestational diabetes mellitus detected by the national diabetes data group or the carpenter and coustan plasma glucose thresholds. Diabetes Care. 2002;25:1625–1630.
82. Carreiro MP, Nogueira AI, Oliveira A. Controversies and Advances in Gestational Diabetes-An Update in the Era of Continuous Glucose Monitoring. J Clin Med. 2018;7:125.
83. Zhong J. Classification and Diagnosis of Diabetes: standards of Medical Care in Diabetes—2020. Diabetes Care. 2020;43:S14–S31
84. Zhang M, Zhou Y, Zhong J, Wang K. Ding Y and Li L. Current guidelines on the management of gestational diabetes mellitus: a content analysis and appraisal. BMC Pregnancy Childbirth. 2019;19:200.
85. National Collaborating Centre for Women’s and Children’s Health: Diabetes in pregnancy: Management of diabetes and its complications from preconception to the postnatal period. 2015.
86. Zhong J. Hyperglycemia and Adverse Pregnancy Outcomes. Diabetes Care. 2008;358:1991–2002
87. Vandorsten JP, Dodson WC, Espeland MA, et al. Thomas A and Tita AT. NIH consensus development conference: diagnosing gestational diabetes mellitus. NIH Consens State Sci Statements. 2013;29:1–31.
88. Waters TP, Dyer AR, Scholtens DM, et al. Metzger BE and Catalano PM. Maternal and Neonatal Morbidity for Women Who Would Be Added to the Diagnosis of GDM Using IADPSG Criteria: A Secondary Analysis of the Hyperglycemia and Adverse Pregnancy Outcome Study. Diabetes Care. 2016;39:2204–2210.
89. Duran A, Sáenz S, Torrejón MJ, et al. García de la Torre N, Fernández MD, Montañez C, Familiar C and Calle-Pascual AL. Introduction of IADPSG criteria for the screening and diagnosis of gestational diabetes mellitus results in improved pregnancy outcomes at a lower cost in a large cohort of pregnant women: the St. Carlos Gestational Diabetes Study. Diabetes Care. 2014;37:2442–2450.
90. Donovan L, Hartling L, Muise M, Guthrie A. Vandermeer B and Dryden DM. Screening tests for gestational diabetes: a systematic review for the U.S. Preventive Services Task Force. Ann Intern Med. 2013;159:115–122.
91. Casagrande SS. Cowie CC and Genuth SM. Self-reported prevalence of diabetes screening in the U.S., 2005-2010. Am J Prev Med. 2014;47:780–787.
92. Bullard KM, Ali MK, Imperatore G, et al. Albright A and Gregg EW. Receipt of Glucose Testing and Performance of Two US Diabetes Screening Guidelines, 2007-2012. PLoS One. 2015;10:e0125249.
93. Kiefer MM, Silverman JB. Young BA and Nelson KM. National patterns in diabetes screening: data from the National Health and Nutrition Examination Survey (NHANES) 2005-2012. J Gen Intern Med. 2015;30:612–618.
94. Evron JM. Herman WH and McEwen LN. Changes in Screening Practices for Prediabetes and Diabetes Since the Recommendation for Hemoglobin A1c Testing. Diabetes Care. 2019;42:576–584.
95. World Health Organization and International Diabetes Federation. Definition and Diagnosis of Diabetes Mellitus and Intermediate Hyperglycemia: Report of a WHO/IDF Consultation. 2006:50
96. World Health Organization. Use of Glycated Haemoglobin (Hba1c) in the Diagnosis of Diabetes Mellitus: Abbreviated Report of a WHO Consultation; 2011.
97. Carpenter MW, Coustan DR. Criteria for screening tests for gestational diabetes. Am J Obstet Gynecol. 1982;144:768–773.
98. Committee on Practice B-O. ACOG Practice Bulletin No. 190: gestational Diabetes Mellitus. Obstet Gynecol. 2018;131:e49–e64.
99. Jackson SL, Safo SE, Staimez LR, et al. Tomolo AM and Phillips LS. Glucose challenge test screening for prediabetes and early diabetes. Diabet Med. 2017;34:716–724.
100. Phillips LS, Ziemer DC, Kolm P, et al. Narayan KM and Koch DD. Glucose challenge test screening for prediabetes and undiagnosed diabetes. Diabetologia. 2009;52(9):1798–1807. doi:10.1007/s00125-009-1407-7
101. Benhalima K, Van Crombrugge P, Moyson C, et al. Screening Strategy for Gestational Diabetes Mellitus Based on the 2013 WHO Criteria by Combining the Glucose Challenge Test and Clinical Risk Factors. J Clin Med. 2018;2:7.
102. Chatterjee R, Narayan KM, Lipscomb J, Jackson SL, Long Q. Zhu M and Phillips LS. Screening for diabetes and prediabetes should be cost-saving in patients at high risk. Diabetes Care. 2013;36(7):1981–1987. doi:10.2337/dc12-1752
103. Dadwani RS, Skandari MR, GoodSmith MS, Phillips LS. Rhee MK and Laiteerapong N. Alternative type 2 diabetes screening tests may reduce the number of U.S. adults with undiagnosed diabetes. Diabet Med. 2020;2:125.
104. Ray KN, Chari AV, Engberg J. Bertolet M and Mehrotra A. Opportunity costs of ambulatory medical care in the United States. Am J Manag Care. 2015;21:567–574.
105. Bergman M, Manco M, Sesti G, et al., Olsen MHJDr and practice c. Petition to replace current OGTT criteria for diagnosing prediabetes with the 1-hour post-load plasma glucose≥ 155 mg/dl (8.6 mmol/L). 2018.
106. Jagannathan R, Weber MB, Anjana RM, Ranjani H, Staimez LR, Ali MK. Mohan V and Narayan KMV. Clinical utility of 30-min plasma glucose for prediction of type 2 diabetes among people with prediabetes: ancillary analysis of the diabetes community lifestyle improvement program. Diabetes Res Clin Pract. 2020;161:108075. doi:10.1016/j.diabres.2020.108075
107. Yin C, Zhang H. Xiao Y and Liu W. Shape of glucose curve can be used as a predictor for screening prediabetes in obese children. Acta Paediatr. 2014;103:e199–205.
108. Tura A, Morbiducci U, Sbrignadello S, Winhofer Y, Pacini G, Kautzky-Willer A. Shape of glucose, insulin, C-peptide curves during a 3-h oral glucose tolerance test: any relationship with the degree of glucose tolerance? Am J Physiol Regul Integr Comp Physiol. 2011;300(4):R941–8. doi:10.1152/ajpregu.00650.2010
109. Tschritter O, Fritsche A, Shirkavand F, Machicao F, Haring H, Stumvoll M. Haring H and Stumvoll M. Assessing the shape of the glucose curve during an oral glucose tolerance test. Diabetes Care. 2003;26(4):1026–1033. doi:10.2337/diacare.26.4.1026
110. Nolfe G, Spreghini MR, Sforza RW, Morino G, Manco M. Morino G and Manco M. Beyond the morphology of the glucose curve following an oral glucose tolerance test in obese youth. Eur J Endocrinol. 2012;166(1):107–114. doi:10.1530/EJE-11-0827
111. Allison DB, Paultre F, Maggio C, Mezzitis N, Pi-Sunyer FX. Mezzitis N and Pisunyer FX. The Use of Areas under Curves in Diabetes Research. Diabetes Care. 1995;18(2):245–250. doi:10.2337/diacare.18.2.245
112. Cheng KC, Li Y, Cheng J. The Areas Under Curves (AUC) used in diabetes research: update view. Int Obesity Diabetes. 2015;4:1–2.
113. Abdul-Ghani MA, Abdul-Ghani T, Ali N, DeFronzo RA. Ali N and DeFronzo RA. One-hour plasma glucose concentration and the metabolic syndrome identify subjects at high risk for future type 2 diabetes. Diabetes Care. 2008;31(8):1650–1655. doi:10.2337/dc08-0225
114. Alyass A, Almgren P, Akerlund M, et al. Groop L and Meyre D. Modelling of OGTT curve identifies 1 h plasma glucose level as a strong predictor of incident type 2 diabetes: results from two prospective cohorts. Diabetologia. 2015;58:87–97.
115. Engelhardt HT, Greene JA, Baird VC. Greene JA and Baird VC. A new technic for the detection of hidden diabetes: induction of hyperglycemia by feeding glucose after dietary preparation. Diabetes. 1953;2(4):299–301. doi:10.2337/diab.2.4.299
116. Bennett PH, Rushforth NB. Miller M and LeCompte PM. Epidemiologic studies of diabetes in the Pima Indians. Recent Prog Horm Res. 1976;32:333–376.
117. Kim J, Michaliszyn S, Nasr A, et al. Bacha F and Arslanian S. The Shape of the Glucose Response Curve During an Oral Glucose Tolerance Test Heralds Biomarkers of Type 2 Diabetes Risk in Obese Youth. Diabetes Care. 2016;39(8):1431–1439. doi:10.2337/dc16-0352
118. Tänczer T, Svébis MM, Domján B. Horváth VJ and Tabák AG. The Effect of Prior Gestational Diabetes on the Shape of the Glucose Response Curve during an Oral Glucose Tolerance Test 3 Years after Delivery. J Diabetes Res. 2020;2020:4315806.
119. Kim J, Coletta D, Mandarino LJ, Shaibi GQ. Mandarino L and Shaibi G. Glucose response curve and type 2 diabetes risk in Latino adolescents. Diabetes Care. 2012;35(9):1925–1930. doi:10.2337/dc11-2476
120. Kanauchi M, Kimura K, Kanauchi K, Saito Y. Kanauchi K and Saito Y. Beta-cell function and insulin sensitivity contribute to the shape of plasma glucose curve during an oral glucose tolerance test in non-diabetic individuals. Int J Clin Pract. 2005;59(4):427–432. doi:10.1111/j.1368-5031.2005.00422.x
121. Bervoets L. Mewis A and Massa G. The shape of the plasma glucose curve during an oral glucose tolerance test as an indicator of Beta cell function and insulin sensitivity in end-pubertal obese girls. Hormone Metab Res. 2015;47:445–451.
122. Chung ST, Ha J, Onuzuruike AU, Kasturi K. Galvan-De La Cruz M, Bingham BA, Baker RL, Utumatwishima JN, Mabundo LS, Ricks M, Sherman AS and Sumner AE. Time to glucose peak during an oral glucose tolerance test identifies prediabetes risk. Clin Endocrinol (Oxf). 2017;87(5):484–491. doi:10.1111/cen.13416
123. Kasturi K, Onuzuruike AU, Kunnam S, Shomaker LB. Yanovski JA and Chung ST. Two- vs one-hour glucose tolerance testing: predicting prediabetes in adolescent girls with obesity. Pediatr Diabetes. 2019;20:154–159.
124. Cheng X, Yang N, Li Y. The shape of the glucose response curve during an oral glucose tolerance test heralds β-cell function in a large Chinese population. BMC Endocr Disord. 2019;19(1):119. doi:10.1186/s12902-019-0446-4
125. Kaga H, Tamura Y, Takeno K, et al. Kawamori R and Watada H. Shape of the glucose response curve during an oral glucose tolerance test is associated with insulin clearance and muscle insulin sensitivity in healthy non-obese men. J Diabetes Investig. 2020;11(4):874–877. doi:10.1111/jdi.13227
126. Manco M, Nolfe G, Pataky Z, Monti L, Porcellati F, Gabriel R. Mitrakou A and Mingrone G. Shape of the OGTT glucose curve and risk of impaired glucose metabolism in the EGIR-RISC cohort. Metabolism. 2017;70:42–50. doi:10.1016/j.metabol.2017.02.007
127. Ismail HM, Xu P, Libman IM, et al. Type 1 Diabetes TrialNet Study G. The shape of the glucose concentration curve during an oral glucose tolerance test predicts risk for type 1 diabetes. Diabetologia. 2018;61(1):84–92. doi:10.1007/s00125-017-4453-6
128. Abdul-Ghani MA, Lyssenko V, Tuomi T, DeFronzo RA, Groop L. Defronzo RA and Groop L. The shape of plasma glucose concentration curve during OGTT predicts future risk of type 2 diabetes. Diabetes Metab Res Rev. 2010;26(4):280–286. doi:10.1002/dmrr.1084
129. Arslanian S, El Ghormli L, Young Kim J, et al. White NH and Group TS. The Shape of the Glucose Response Curve During an Oral Glucose Tolerance Test: forerunner of Heightened Glycemic Failure Rates and Accelerated Decline in beta-Cell Function in TODAY. Diabetes Care. 2019;42(1):164–172. doi:10.2337/dc18-1122
130. Lim WXJ, Chepulis L, von Hurst P. An Acute, Placebo-Controlled, Single-Blind, Crossover, Dose-Response, Exploratory Study to Assess the Effects of New Zealand Pine Bark Extract (Enzogenol(®)) on Glycaemic Responses in Healthy Participants. Nutrients. 2020;1:12.
131. Kramer CK, Vuksan V, Choi H. Zinman B and Retnakaran R. Emerging parameters of the insulin and glucose response on the oral glucose tolerance test: reproducibility and implications for glucose homeostasis in individuals with and without diabetes. Diabetes Res Clin Pract. 2014;105:88–95.
132. Cree-Green M, Xie D, Rahat H, et al. Oral glucose tolerance test glucose peak time is most predictive of pre-diabetes and hepatic steatosis in obese girls. J Endocrine Soc. 2018;2018:1254.
133. Froslie KF, Roislien J, Qvigstad E, Godang K, Bollerslev J, Voldner N. Henriksen T and Veierod MB. Shape information from glucose curves: functional data analysis compared with traditional summary measures. BMC Med Res Methodol. 2013;13:6.
134. Van de Velde FP, Dierickx A, Depypere H, Delanghe JR. Kaufman JM and Lapauw B. Reproducibility and least significant differences of oral glucose tolerance test-derived parameters in a postmenopausal population without diabetes. Diabetes Metab. 2017;43:484–487.
135. Contreras S, Medina-Ortiz D, Conca C, Olivera-Nappa Á. A Novel Synthetic Model of the Glucose-Insulin System for Patient-Wise Inference of Physiological Parameters From Small-Size OGTT Data. Fron Bioeng Biotech. 2020;8:195.
136. Hulman A, Gujral UP, Narayan KMV, et al. Faerch K and Witte DR. Glucose patterns during the OGTT and risk of future diabetes in an urban Indian population: the CARRS study. Diabetes Res Clin Pract. 2017;126:192–197.
137. Hulman A, Simmons RK, Vistisen D, et al. Witte DR and Faerch K. Heterogeneity in glucose response curves during an oral glucose tolerance test and associated cardiometabolic risk. Endocrine. 2017;55:427–434.
138. Hulman A, Witte DR, Vistisen D, et al. Faerch K and Manco M. Pathophysiological Characteristics Underlying Different Glucose Response Curves: A Latent Class Trajectory Analysis From the Prospective EGIR-RISC Study. Diabetes Care. 2018;41:1740–1748.
139. Hulman A, Vistisen D, Glumer C, Bergman M. Witte DR and Faerch K. Glucose patterns during an oral glucose tolerance test and associations with future diabetes, cardiovascular disease and all-cause mortality rate. Diabetologia. 2018;61:101–107.
140. Hulman A, Wagner R, Vistisen D. Glucose Measurements at Various Time Points During the OGTT and Their Role in Capturing Glucose Response Patterns. Diabetes Care. 2019;1:15.
141. Abbas HT, Alic L, Erraguntla M, Ji JX, Abdul-Ghani M. Abbasi QH and Qaraqe MK. Predicting long-term type 2 diabetes with support vector machine using oral glucose tolerance test. PLoS One. 2019;14:e0219636.
142. Stefan N, Staiger H, Wagner R, Machann J, Schick F. Haring HU and Fritsche A. A high-risk phenotype associates with reduced improvement in glycaemia during a lifestyle intervention in prediabetes. Diabetologia. 2015;58:2877–2884.
143. Jagannathan R, Buysschaert M, Medina JL, et al. 1-h post-load plasma glucose as a novel biomarker for diagnosing dysglycemia. Acta Diabetol. 2018;55:519–529.
144. Fiorentino TV, Marini MA, Succurro E, et al. Hyperglycemia: implications for Prediction and Prevention of Type 2 Diabetes. J Clin Endocrinol Metab. 2018;103:3131–3143.
145. Fiorentino TV, Marini MA, Andreozzi F, et al. Hyperglycemia Is a Stronger Predictor of Type 2 Diabetes Than Impaired Fasting Glucose. J Clin Endocrinol Metab. 2015;100:3744–3751.
146. Paddock E, Hohenadel MG, Piaggi P, Vijayakumar P, Hanson RL, Knowler WC. Krakoff J and Chang DC. One-hour and two-hour postload plasma glucose concentrations are comparable predictors of type 2 diabetes mellitus in Southwestern Native Americans. Diabetologia. 2017;60:1704–1711.
147. Abdul-Ghani MA, Williams K. DeFronzo RA and Stern M. What is the best predictor of future type 2 diabetes? Diabetes Care. 2007;30:1544–1548.
148. Oka R, Aizawa T, Miyamoto S. Yoneda T and Yamagishi M. One-hour plasma glucose as a predictor of the development of Type 2 diabetes in Japanese adults. Diabet Med. 2016;33:1399–1405.
149. Kuang L, Huang Z, Hong Z. Chen A and Li Y. Predictability of 1-h postload plasma glucose concentration: A 10-year retrospective cohort study. J Diabetes Investig. 2015;6:647–654.
150. Tfayli H, Lee SJ. Bacha F and Arslanian S. One-hour plasma glucose concentration during the OGTT: what does it tell about beta-cell function relative to insulin sensitivity in overweight/obese children? Pediatr Diabetes. 2011;12:572–579.
151. Jagannathan R, Sevick MA, Li H, et al. Elevated 1-hour plasma glucose levels are associated with dysglycemia, impaired beta-cell function, and insulin sensitivity: a pilot study from a real world health care setting. Diabetes. 2016;52:172–175.
152. Chamukuttan S, Ram J, Nanditha A, et al. Ramachandran AJDmr and reviews. Baseline level of 30‐min plasma glucose is an independent predictor of incident diabetes among Asian Indians: analysis of two diabetes prevention programmes. Diabetes. 2016;32:762–767.
153. Abdul-Ghani MA, Lyssenko V, Tuomi T. DeFronzo RA and Groop L. Fasting versus postload plasma glucose concentration and the risk for future type 2 diabetes: results from the Botnia Study. Diabetes Care. 2009;32:281–286.
154. Pareek M, Almgren P, Jagannathan R, Nielsen M, Groop L, Nilsson P. Bergman M and Olsen M. Clinical utility of a 1-hour oral glucose tolerance test for prediction of type 2 diabetes. Diabetologia. 2016;59:S107–S108.
155. Oh TJ, Lim S, Kim KM, et al. Jang H and Cho NH. One-hour postload plasma glucose concentration in people with normal glucose homeostasis predicts future diabetes mellitus: a 12-year community-based cohort study. Clin Endocrinol (Oxf). 2017;86:513–519.
156. Bergman M, Chetrit A, Roth J, Jagannathan R. Sevick M and Dankner R. One-hour post-load plasma glucose level during the OGTT predicts dysglycemia: observations from the 24year follow-up of the Israel Study of Glucose Intolerance, Obesity and Hypertension. Diabetes Res Clin Pract. 2016;120:221–228.
157. Sai Prasanna N, Amutha A, Pramodkumar TA, et al. 1h post glucose value best predicts future dysglycemia among normal glucose tolerance subjects. J Diabetes Complications. 2017;31:1592–1596.
158. Lizarzaburu-Robles JC, Torres-Aparcana L, Mansilla R. A Cross-Sectional Study of the Association between the 1-Hr Oral Glucose Tolerance Test and the Metabolic Syndrome in a High-Risk Sample with Impaired Fasting Glucose. Endocr Pract. 2020:12.
159. Thewjitcharoen Y, Elizabeth Jones A, Butadej S, et al. Elevated 1-h post-load plasma glucose levels in Thai people with normal glucose tolerance associated with high diabetes and cardiovascular risk. Diabet Med. 2019;1:1548.
160. Jagannathan R, Sevick MA, Fink D, et al. The 1-hour post-load glucose level is more effective than HbA1c for screening dysglycemia. Acta diabetologica. 2016;53:543–550.
161. Simmons KM, Sosenko JM, Warnock M, Geyer S, Ismail HM. Larsson HE and Steck AK. One-Hour Oral Glucose Tolerance Tests for the Prediction and Diagnostic Surveillance of Type 1 Diabetes. J Clin Endocrinol Metab. 2020:124.
162. Succurro E, Marini MA, Arturi F, et al. Perticone F and Sesti G. Elevated one-hour post-load plasma glucose levels identifies subjects with normal glucose tolerance but early carotid atherosclerosis. Atherosclerosis. 2009;207:245–249.
163. Succurro E, Pedace E, Andreozzi F, et al. Cascini GL and Sesti G. Reduction in Global Myocardial Glucose Metabolism in Subjects With 1-h Postload Hyperglycemia and Impaired Glucose Tolerance. Diabetes Care. 2020.
164. Sesti G, Hribal ML, Fiorentino TV, Sciacqua A, Elevated PF. 1 h postload plasma glucose levels identify adults with normal glucose tolerance but increased risk of non-alcoholic fatty liver disease. BMJ Open Diabetes Res Care. 2014;2:e000016.
165. Succurro E, Arturi F, Grembiale A, et al. Perticone F and Sesti G. One-hour post-load plasma glucose levels are associated with elevated liver enzymes. Nutr Metab Cardiovasc Dis. 2011;21:713–718.
166. Succurro E, Arturi F, Lugara M, et al. Perticone F and Sesti G. One-hour postload plasma glucose levels are associated with kidney dysfunction. Clin j Am Soc Nephrol. 2010;5:1922–1927.
167. Bianchi C, Miccoli R, Trombetta M, et al. 1-hour postload plasma glucose levels identify subjects with normal glucose tolerance but impaired beta-cell function, insulin resistance, and worse cardiovascular risk profile: the GENFIEV study. J Clin Endocrinol Metab. 2013;98:2100–2105.
168. Shimodaira M, Niwa T, Nakajima K, Kobayashi M. Hanyu N and Nakayama T. Correlation between serum lipids and 1-hour postload plasma glucose levels in normoglycemic individuals. J Clin Lipidol. 2014;8:217–222.
169. Cao L, Wang P, Luan H, et al. 1-h postload plasma glucose levels identify coronary heart disease patients with greater severity of coronary artery lesions and higher risk of 1-year re-admission. Diab Vasc Dis Res. 2020;17:1479164119896978.
170. Orencia AJ, Daviglus ML, Dyer AR, Walsh M, Greenland P, One-Hour Postload SJ. Plasma Glucose and Risks of Fatal Coronary Heart Disease and Stroke among Nondiabetic Men and Women: the Chicago Heart Association Detection Project in Industry (CHA) Study. J Clin Epidemiol. 1997;50:1369–1376.
171. Strandberg TE, Pienimäki T, Strandberg AY, et al. One-hour glucose, mortality, and risk of diabetes: a 44-year prospective study in men. Acta diabetologica. 2011;171:941–954.
172. Armato JP, DeFronzo RA. Abdul-Ghani M and Ruby RJ. Successful treatment of prediabetes in clinical practice using physiological assessment (STOP DIABETES). Lancet Diabetes Endocrinol. 2018;6:781–789.
173. Zhou W, Li H, Gu Y, et al. ROC analysis for different time points during oral glucose tolerance test. Acta diabetologica Res Clin Pract. 2006;72:88–92.
 © 2020 The Author(s). This work is published and licensed by Dove Medical Press Limited. The full terms of this license are available at https://www.dovepress.com/terms.php and incorporate the Creative Commons Attribution - Non Commercial (unported, v3.0) License.
By accessing the work you hereby accept the Terms. Non-commercial uses of the work are permitted without any further permission from Dove Medical Press Limited, provided the work is properly attributed. For permission for commercial use of this work, please see paragraphs 4.2 and 5 of our Terms.
© 2020 The Author(s). This work is published and licensed by Dove Medical Press Limited. The full terms of this license are available at https://www.dovepress.com/terms.php and incorporate the Creative Commons Attribution - Non Commercial (unported, v3.0) License.
By accessing the work you hereby accept the Terms. Non-commercial uses of the work are permitted without any further permission from Dove Medical Press Limited, provided the work is properly attributed. For permission for commercial use of this work, please see paragraphs 4.2 and 5 of our Terms.