")
Back to Journals » Journal of Hepatocellular Carcinoma » Volume 9
The Oncogenic and Diagnostic Potential of Stanniocalcin 2 in Hepatocellular Carcinoma
Authors Wu Z, Cheng H , Liu J, Zhang S, Zhang M, Liu F, Li Y, Huang Q, Jiang Y, Chen S, Lv L, Li D, Zeng JZ
Received 17 December 2021
Accepted for publication 26 February 2022
Published 8 March 2022 Volume 2022:9 Pages 141—155
DOI https://doi.org/10.2147/JHC.S351882
Checked for plagiarism Yes
Review by Single anonymous peer review
Peer reviewer comments 4
Editor who approved publication: Dr Ahmed Kaseb
Zhixian Wu,1,2,* Hongwei Cheng,1,* Jie Liu,1,* Shuaishuai Zhang,1 Minda Zhang,1 Fangzhou Liu,1 Yinghui Li,2 Qian Huang,2 Yi Jiang,3 Shaohua Chen,3 Lizhi Lv,3 Dongliang Li,2 Jin-Zhang Zeng1
1Fujian Provincial Key Laboratory of Innovative Drug Target Research and State Key Laboratory of Cellular Stress Biology, School of Pharmaceutical Sciences, Xiamen University, Xiamen, People’s Republic of China; 2Department of Hepatobiliary Disease, Dongfang Hospital, Xiamen University, Fuzhou, People’s Republic of China; 3Department of Hepatobiliary Surgery, Dongfang Hospital, Xiamen University, Fuzhou, People’s Republic of China
*These authors contributed equally to this work
Correspondence: Jin-Zhang Zeng; Dongliang Li, Email [email protected]; [email protected]
Purpose: Early detection and prognostic prediction of hepatocellular carcinoma (HCC) remain a great challenge. In this study, we explored the role and diagnostic significance of stanniocalcin 2 (STC2), recently identified as a secretory protein, in HCC.
Methods: STC2 mRNA and protein in HCC tissues were examined by qRT-PCR and immunohistochemistry. The regulatory role of HCC growth by STC2 was evaluated in vitro and in vivo. Serum STC2 levels were determined in HCC patients and compared to those with liver cirrhosis (LC) and normal controls (NC). The difference and significance of STC2 levels between groups were analyzed by Mann–Whitney U-test. The diagnostic value of serum STC2 in detecting early HCC was assayed with receiver operating characteristics (ROC). The association of STC2 with overall survival (OS) was determined with Kaplan–Meier method.
Results: STC2 was elevated in about 77.1% HCC patients and correlated with advanced tumor progression. Overexpression or knockdown of STC2 stimulated or suppressed HCC colony formation and xenograft tumor growth. AKT activation played a critical role in tumor-promoting effect of STC2. The median level of serum STC2 in HCC patients (n = 98, 2086.6 ng/L) was 2.6-fold and 4.2-fold that in LC patients (n = 42, 801.9 ng/L) and NC (n = 26, 496.9 ng/L), respectively. A cut-off value 1493 ng/L for STC2 could distinguish early HCC from LC with a sensitivity of 76.9% and a specificity of 76.2%, both of which were superior to AFP at 20 μg/L (sensitivity 69.2%, specificity 52.4%). STC2 was positive in 77.8% (14/18) AFP-negative patients. High STC2 level was correlated with poor overall and disease specific survival.
Conclusion: STC2 is upregulated in both tumor and serum of HCC patients, and its overexpression promotes HCC via AKT pathway. STC2 possesses a diagnostic significance and may serve as an auxiliary biomarker of AFP for detecting early HCC.
Keywords: biological marker, serological diagnosis, early diagnosis, prognosis
Introduction
Hepatocellular carcinoma (HCC) is the sixth most common malignancy and the third leading cause of cancer-related death worldwide, with approximately 906,000 new cases and 830,000 deaths in 2020.1–3 Early intervention would be expected to yield excellent therapeutic response. Unfortunately, approximately 2/3 of HCC patients present at an advanced stages when diagnosed. Now the standard therapy for advanced HCC is atezolizumab plus bevacizumab therapy.4 Other choice includes sorafenib, a new multiple tyrosine kinase inhibitor.5 However, the therapeutic response and resistance remain a major problem.6 Since early detection of HCC offers a better opportunity of receiving curative treatments, there is an unmet need for finding effective biomarker.7
Alpha-fetoprotein (AFP) is widely used to screen HCC in combination of ultrasound imaging.8 However, the clinical utility of AFP in early HCC detection is unsatisfactory.9 Approximately 30–40% of HCC patients are AFP-negative.10 In small HCC with diameter of <3 cm, the positive rate of AFP is even less than 20%.11 Since AFP is significantly increased in chronic liver diseases, its diagnostic specificity is unsatisfactory (approximately 50% at a cut-off value of 20 μg/L).12 AFP is described as a useful tool to monitor HCC activity postoperatively. However, it is still controversial whether AFP is beneficial for predicting prognosis.11 Thus, several new biomarkers such as MDK, DKK1 and Glypican-3 are emerging as potential utility in early detection, diagnosis, and prognosis of HCC.13–16
To find more early serum biomarkers for HCC diagnosis especially for those AFP-negative HCC, we searched for those tumor-associated proteins, among which we focused on the secretory proteins of stanniocalcin family. Stanniocalcin was firstly discovered from corpuscles of Stannius in fish and identified as a regulator of cellular calcium/phosphate homeostasis.17 Its human homologue genes, STC1 and STC2, constituting a family of hormones that retain functions in calcium/phosphate regulation and cell metabolism among others.18,19 STC2 is upregulated in different tumor types.20–23 The overexpression of STC2 could promote cell proliferation, epithelial-mesenchymal transition and angiogenesis and stimulate various survival signaling pathways.24–27 STC2 was a target and an effector of HIF-1α in breast and ovarian cancer under hypoxia.28 In HCC, STC2 could mediate Mus81-dependent proliferation and survival and its expression was associated with poor prognosis.29 Although STC2 was suggested to be implicated in development and progression of various malignancies including HCC, the role and diagnostic potential of STC2 in HCC remain unexplored.
In this study, we determined the serum and tissue expression levels of STC2 in HCC with clinical samples and investigated its tumor-promoting effect in vitro and in vivo. Our findings demonstrate that STC2 is highly expressed in most HCC patients and possibly an independent biomarker for diagnosing HCC and predicting patient’s prognosis.
Materials and Methods
Patients and Volunteers
Candidates enrolled in this study included 98 patients with HCC, 42 with LC and 26 healthy volunteers at Dongfang Hospital of Fuzhou. All of them should meet the following inclusion criteria: not receiving any treatments before enrollment and without other serious diseases. The healthy volunteers were from those with routine physical examination. The detailed clinical and biochemical data of patients with HCC and LC were collected (Supplementary Table 1).
Sample Collection
Blood samples were collected from healthy volunteers, LC patients and HCC patients before surgery. Fresh tumor and adjacent liver tissues were respectively harvested from 48 HCC-resected specimens. Paired paraffin slides were collected together.
Pathological Examination
HCC and LC were diagnosed pathologically. TNM clinical stages were classified according to the 6th edition TNM classification of the American Joint Committee on Cancer.30 Early HCC was defined as TNM stage I, namely, single tumor ≤2cm or single tumor >2cm without vascular invasion.
Ethics Statement
The study was conducted in accordance with the principles of the Declaration of Helsinki.31 All participants gave written informed consents. The collection procedure was approved by the Hospital Ethics Committee. The investigation was approved by Medical Research Ethics Committee of Xiamen University.
Immunohistochemistry (IHC)
Immunohistochemistry (IHC) was used to assess the expression of STC2 according to the instruction of IHC protocol. The specimens were probed with anti-STC2 (1:200). Antibodies against STC2 (Cat# 60063-1-Ig) and PCNA (Cat# 10205-2-AP) were acquired from Proteintech technology. HRP-labeled goat anti-rabbit antibody and HRP-labeled goat anti-mouse antibody were purchased from Thermo Fisher Scientific.
qRT-PCR
Total RNA was extracted with Trizol reagent and dissolved in DEPC-treated water. The cDNA was synthesized by SuperScript Reverse Transcriptase and examined the quality with Nanodrop (ND-2000) at the rate of 260/280. Quantitative PCR (qPCR) was conducted using HieffTM qPCR SYBR Green Master Mix (High Rox Plus, Yeasen Biotechnology, Shanghai, China). The amplification was carried out under the following conditions: denaturation for 10 sec at 95 °C, annealing for 20 sec at 55 °C, extension for 20 sec at 72 °C, 40 cycles. The data was normalized with GAPDH and calculated with 2−ΔΔCT method. The specific primers as followed: STC2 (forward: 5’- TCT TGT GAG ATT CGG GGC TT −3’; reverse: 5’- ACA GGT CGT GCT TGA GGT AG −3’), GAPDH (forward: 5’-AGG TCG GAG TCA ACG GAT TT −3’; reverse: 5’- ATC TCG CTC CTG GAA GAT GG-3’). All primers were synthesized by Sangon Biotech.
Enzyme-Linked Immunosorbent Assay (ELISA)
Serum STC2 concentrations were determined by ELISA using a commercial kit (Proteintech Corp.). The assays were conducted according to the manufacturer’s instructions. Briefly, 50 μL serum samples were diluted and incubated in microplate wells pre-coated with polyclonal anti-human STC2 antibody for 2 h at 37°C. After washing three times, biotin-labeled anti-human STC2 antibody was added and incubated with captured STC2 for 60 min at room temperature. After another washing, 100 μL aliquots of streptavidin-HRP conjugate were added and allowed to react for 30 min. Finally, substrate solutions TMB were added to the wells for a 10 min reaction, and the absorbance at 450 nm was detected using a multiplate reader. All specimens were tested blindly and in triplicate.
Cell Lines and Culture
HepG2 (HB-8065) and HEK293T (ACS 4500) were purchased from ATCC (American Type Culture Collection), while Bel-7402, and QGY-7703 from Institute of Biochemistry and Cell Biology (SIBS, CAS). All cell lines were obtained between 2008 and 2013 and authenticated by the vendors. Bel-7402 was cultured in RPMI-1640 medium, while HepG2 and QGY-7703 were grown in Dulbecco’s Modified Eagle’s Medium. The cells were cultured with 10% fetal bovine serum. Sub-confluent cells with exponential growth were used throughout the experiments.
Construction of Vectors
The open reading frame (ORF) of STC2 was sub-cloned into the lentiviral vector of pCDH-CMV-MCS-EF1-puro (Addgene, Cambridge, MA) for overexpression of STC2. To knock down its expression, a short hairpin RNA (shRNA) specifically targeting at the sequence of 5’-GAA CAG TCT GAG TAT TCT GAT-3’ of STC2 was constructed into pLKO.1 lentivirus system (Addgene, Cambridge, MA), which was reported to be able to effectively silence STC2 expression.32
Stable Cell Lines
HEK293T cells were transfected with pCDH-CMV-MCS-EF1-puro-STC2 or pCDH-CMV-MCS-EF1-puro-Vector together with envelope plasmid pCMV-dR8.91 (Addgene, Cambridge, MA) and packaging vector pCMV-VSV-G (Addgene, Cambridge, MA) by polyethylenimine (PEI, Polysciences Inc., Warrington, PA). Retroviral supernatant was harvested at 48 h after initial plasmid transfection. The collected lentivirus was used to infect HepG2 cells, which was then selected with 1 μg/mL puromycin (Amresco) in complete medium for 4–5 days. The stable knockdown of STC2 was conducted similarly with pLKO.1-shSTC2 plus pCMV-dR8.91 and pCMV-VSV-G.
Colony Formation
HepG2 cells stably transfected with STC2 (HepG2/STC2) or STC2 shRNA (HepG2/shSTC2) were cultured in six-well plates (500 cells/well) for 15 days. The cells were fixed in 4% paraformaldehyde and stained with 0.5% crystal violet solution for analysis.
MTT Assay
HepG2/STC2 and HepG2/V cells were seeded in 96-well plates (5000 cells/well) and cultured for 1, 2 or 3 days. The cells were stained with 0.05 mg/mL 3-(4,5-dimethylthiazol-2-yl)-2,5-diphenyltetrazolium bromide (MTT) and measured at 520 nm with an automated microplate reader (Thermo).
Western Blot
The cell lysis buffer contained 10 mM Tris-HCl, 2 mM EDTA and 1% SDS. Equal amounts of cell lysates were separated by 10% sodium dodecyl sulfate–polyacrylamide gel electrophoresis. Proteins were electro-transferred to nitrocellulose membranes and incubated with primary antibodies against STC2 (CST), p-AKT (Ser473, CST), total AKT (CST), Cyclin D1 (CST) or GAPDH (Santa Cruz). All the antibodies were used at the dilution of 1:1000. The membranes were incubated with appropriate horseradish peroxidase-conjugated secondary antibodies (Bio-Rad). The protein bands were visualized using enhanced chemiluminescence detection reagents (Thermo). The densities of bands were measured using Image J. Relative quantification was achieved by normalization to the amount of GAPDH.
Xenograft Mice Model
Male BALB/c nude mice were subcutaneously injected with HepG2/STC2 or HepG2/V cells (2×10⁶ cells) in the posterior flanks. Tumor volume was measured with a caliper every three day from Day 3 of post-implantation. After 24-day of implantation, the mice were sacrificed and the tumors were collected for further analysis.
All mice were handled in accordance with the “Guide for the Care and Use of Laboratory Animals” and the “Principles for the Utilization and Care of Vertebrate Animals”. The protocols were approved by Animal Care and Use Committee of Xiamen University.
Nomogram Prognostic Analysis
Nomogram prognostic analysis is conducted based on the univariate and multivariate Cox regression analysis.33 A total of 374 cases HCC patients were included to prognostic analysis through 10-year survival probability of OS and DSS. The tumor stage, pathologic stage, histologic grade, AFP level and STC2 level were evaluated using univariate and multivariate Cox regression analysis. The low and high STC2 groups were divided based on the median level.
Statistical Analysis
Statistical analysis was performed using SPSS 21.0 (Chicago, USA) and GraphPad Prism 5 (GraphPad Software Inc, USA) software. The Mann–Whitney U-test was used to compare the levels of serum STC2 between HCC patients and non-HCC controls. Receiver operating characteristic curves (ROC) was used to analyze diagnostic potential. The relationship between serum STC2 levels and clinicopathological parameters was analyzed by chi-square test. A total survival curve was plotted using the Kaplan–Meier method. Univariate and multivariate Cox’s proportional hazard models were employed to identify prognostic factors for determining survival time.
Receiver operating characteristics (ROC) curves were constructed to assess sensitivity, specificity, and respective areas under the curves (AUCs) with 95% confidence level (CI). The optimal cut-off was determined by Youden Index, at which the sensitivity plus specificity is equal to a maximum value.34
For cell proliferation and colony formation assays, data represent the average of three independent experiments ± S.D. p < 0.05 was determined to be statistically significant.
Results
STC2 is Highly Expressed and Associated with Advanced TNM Stages of HCC
Since few reports are available on the expression and roles of STC2 in HCC, this study collected 48 paired specimens of fresh tumors (T) and adjacent non-tumorous liver tissues (N) for qRT-PCR analysis, while their corresponding paraffin slides for immunostaining. The ratio of T/N was used as a measure of increased (T/N ≥ 1.25), decreased (T/N < 0.75), or no changed expression of STC2 (1.25 > T/N ≥ 0.75). We showed that STC2 was significantly increased in 77.1% (37/48) HCC patients, among whom 43.8% (21/48) were upregulated by 4-fold (T/N > 5). Decreased STC2 was found in 14.6% (7/48), while no significant change in 8.3% (4/48) (Figure 1A). The median value of STC2 was about 1.5-fold higher in TNM stages III/IV than that in stages I/II (Figure 1B). High expression of STC2 in HCC was also evident in IHC analysis on paired paraffin slides (Figure 1C). Consistently, analysis of TCGA-LIHC database showed that STC2 mRNA was highly expressed in HCC tissues (n=374) by comparing to normal tissues (n=50) (Figure 1D). When comparing to the paired non-tumorous tissues, we consistently observed STC2 mRNA was increased in tumors (n=50) (Figure 1E). Furthermore, higher STC2 was related to higher stages and lower differentiated grades of tumors (Figure 1F and G). Thus, we demonstrated that STC2 is overexpressed in most of HCC and closely associated with advanced disease.
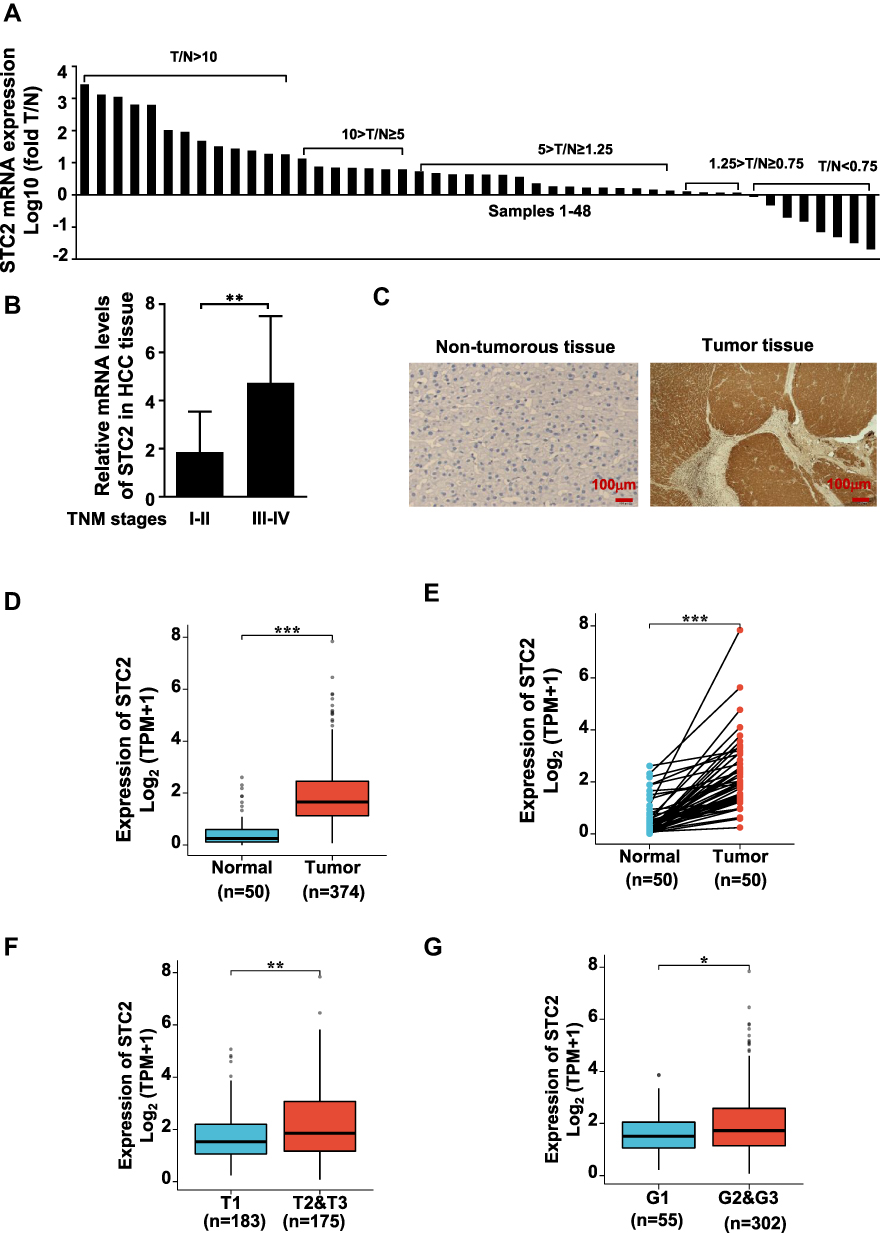 |
Figure 1 STC2 was highly expressed in HCC and correlated with HCC progression. (A) STC2 mRNA levels were determined by qRT-PCR and compared between tumor (T) and adjacent non-tumorous tissues (N). The ratio of T/N was used as a measure of increased (T/N ≥ 1.25), decreased (T/N < 0.75), or no changed expression of STC2 (1.25 > T/N ≥ 0.75). (B) The mRNA levels of STC2 were compared between TNM stages III–IV and stages I–II. (C) STC2 protein in tumor and non-tumorous liver tissues was stained with immunohistochemistry with anti-STC2 antibody (1:100). (D) TCGA-LIHC database was used to explore the difference of STC2 mRNA between HCC tumor tissues (n=374) and normal tissues (n=50). (E) STC2 mRNA expression levels in HCC tumor tissues were compared to their corresponding non-tumorous tissues (n=50) based on TCGA-LIHC cohort. (F and G) Relationship analysis of STC2 mRNA expression levels with tumor stages and differentiated degrees of HCC on TCGA-LIHC tissue samples. *p<0.05; **p<0.01; ***p<0.001. |
The Oncogenic Potential of STC2 in HCC
The impact of STC2 on HCC growth was then evaluated. For this purpose, we generated different HepG2 stable cell lines including HepG2/STC2 (overexpression) and HepG2/shSTC2 (knockdown). Comparing to the controls, HepG2/STC2 gained enhanced abilities to promote cell proliferation and colony formation, whereas HepG2/shSTC2 displayed significantly reduced proliferative rate and greatly lost colony-forming capability (Figure 2A and B). Overexpression of STC2 also strongly stimulated tumor growth in mice (Figure 2C). STC2-harbored xenografts grew more quickly than did those controls. The tumor weight in HepG2/STC2 was almost doubled to that in control over a 24-day period of development. In addition, the expression of PCNA, a proliferative index, was largely increased in STC2-overexpressed tumors (Figure 2D). In contrast, HepG2/shSTC2 cells grew more slowly and had lower PCNA expression level comparing to controls (Figure 2C and D). Thus, we demonstrated that STC2 acted as a critical HCC promoter.
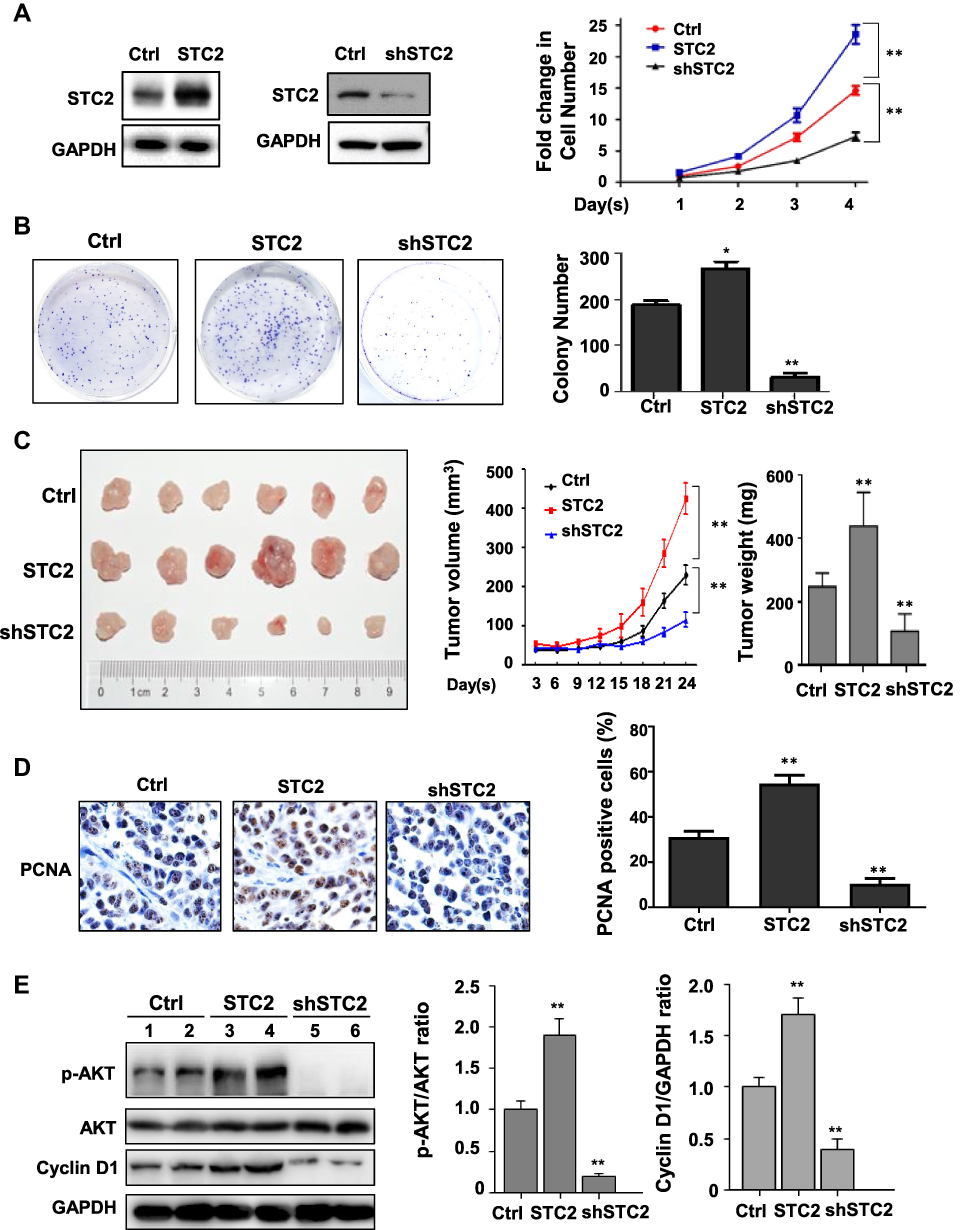 |
Figure 2 Oncogenic potential of STC2 in HCC. (A) Cell proliferation assays. STC2 was overexpressed or knocked down in HepG2. Altered STC2 expression was confirmed by Western blotting (left panel). The cell proliferation was determined by MTT. **p<0.01 (vs control). (B) Colony formation. HepG2, HepG2/STC2 (overexpression) and HepG2/shSTC2 (knockdown) cells were seeded in 6-well plates and incubated at 37°C, 5% CO2 for two weeks to grow discrete colonies. The number of foci containing >50 cells was counted and statistically analyzed. *p<0.05 and **p<0.01 (vs control). (C) Xenograft model. HepG2, HepG2/STC2 and HepG2/shSTC2 (2 × 10⁶ cells) were subcutaneously transplanted into the posterior flanks of mice (n=6 in each group). Tumor volume were recorded every 3 days. After 24 days, the mice were sacrificed. The tumors were collected and analyzed. **p<0.01 (vs control). (D) PCNA expression. The tumor slides were stained with anti-PCNA antibody (1:200). The positive rates of PCNA were calculated and analyzed. **p<0.01 (vs control). (E) The protein expression p-AKT, total AKT, Cyclin D1 and internal loading control GAPDH were examined by Western blotting, and the expression ratio of p-AKT/AKT and Cyclin D1 normalized GAPDH were quantified and analyzed. **p<0.01 (vs control). |
AKT Activation Mediates STC2-Driven HCC Growth
STC2 was described to be associated with elevated AKT signaling in certain malignant tumors.26 However, it remains unknown whether AKT activation is essential for the tumor-promoting effect of STC2. We thus proceeded to determine whether AKT signaling is required for STC2 to drive HCC growth. In HepG2 xenograft tumor tissues, we showed that overexpression of STC2 was associated with increased AKT activity, while silencing of STC2 resulted in strikingly inactivation of AKT (Figure 2E). Consistently, overexpression of STC2 could dose-dependently promote AKT activity (Figure 3A), which was accompanied by increased Cyclin D1 expression. Such phenomenon was reproducible in several HCC cell lines including HepG2, Bel7402 and QGY7703 (Figure 3A), suggesting that AKT/Cyclin D1 is possibly involved in STC2-driven HCC growth. In order to verify the impact of AKT pathway on STC2-driven HCC growth, an AKT inhibitor MK2206 was used. Our data showed that STC2-enhanced HCC cell growth was greatly impaired in all three HCC cell lines upon treatment of MK2206 (Figure 3B). Consistently, STC2-dependent induction of Cyclin D1 was inhibited by MK2206 (Figure 3C). Thus, AKT activation relayed the oncogenic signal of STC2 in HCC.
 |
Figure 3 STC2 promoted HCC cell growth by activation of AKT. (A) HepG2, Bel7402 and QGY7703 were transiently transfected with increasing concentrations of Myc-STC2 plasmid. After 24 h of transfection, cell lysates were analyzed for expression of STC2, AKT and its phosphorylated form, Cyclin D1. The expression of GAPDH was served as a loading control. The protein expression was determined by Western blotting. (B and C) HepG2, Bel7402 and QGY7703 were transiently transfected with Myc-STC2 plasmid and treatment with AKT inhibitor MK2206 (1 μM). The cell growth was detected with MTT (B). The cell lysates were analyzed for expression of STC2, Cyclin D1, AKT and its phosphorylated form (C). **p<0.01 (vs respective controls). |
The Diagnostic Potential of Serum STC2 Levels in HCC
Since STC2 protein is secretory, we asked if increased STC2 in serum could be a diagnostic biomarker. Thus, 98 patients with HCC, 42 with LC and 26 healthy controls were enrolled in the test (Supplementary Table 2). The median level of serum STC2 in HCC was about 2086.6 ng/L (range 1002.2–5743.5 ng/L), which was 2.6-fold and 4.2-fold that in LC (median 801.9 ng/L, range 45.6–2362.8 ng/L, p<0.0001) and healthy controls (median 496.9 ng/L, range 53.4–1751.3 ng/L, p<0.0001) respectively (Figure 4A). Consistent with its expression pattern in HCC tissues, increased serum STC2 was observed in advanced TNM stages compared with non-advanced ones (Figure 4B). The serum level of STC2 in early HCC (median 1972 ng/L, range 1002.2–2841.6 ng/L, p=0.002) was about 1.5-fold higher than that in LC (Figure 4C). It was noted that STC2 was also significantly elevated in LC comparing to healthy controls (p=0.025). As shown in Supplementary Table 2, serum STC2 levels were correlated with several clinicopathological parameters including TNM stage, lymph node metastasis and metastasis, but not with age, sex, alanine aminotransferase, hepatitis B virus infection, liver cirrhosis, tumor size, tumor encapsulation, number of tumor, T stage and portal invasion.
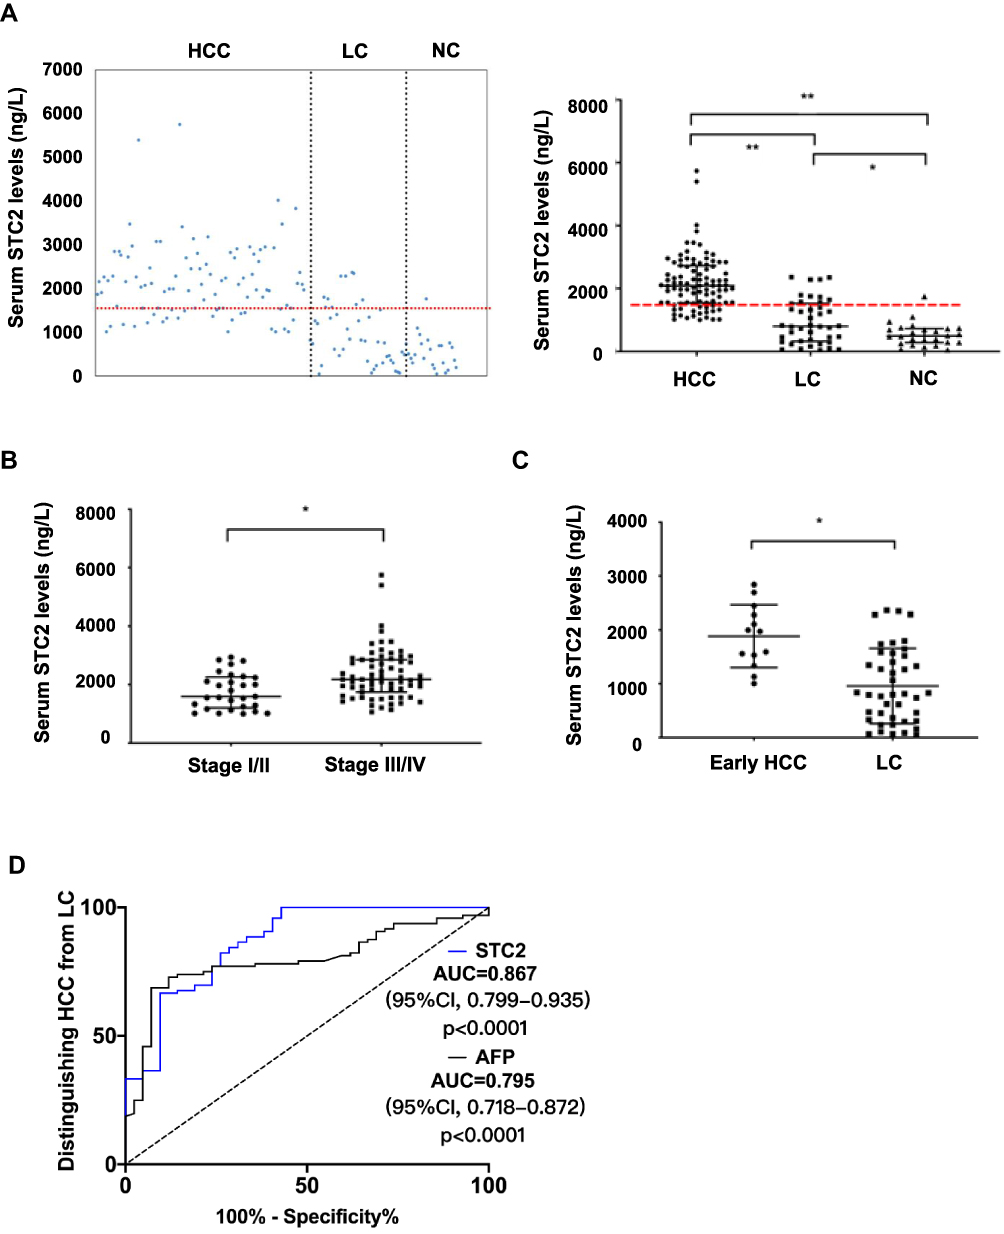 |
Figure 4 Diagnostic value of serum STC2. (A) The serum levels of STC2 were determined by ELISA. Scatter plots indicated the expression patterns of serum STC2 in HCC (n=98), LC (n=42) and NC (n=26) groups (left panel). The median levels of STC2 were compared among different groups (right panel). The dashed line represents the cutoff value of 1493 ng/L for STC2. (B) The median levels of STC2 were compared between tumor stages I/II and stages III/IV. (C) The median level of STC2 in HCC patients at early stage was compared to that of LC patients. For (A–C), *p<0.05 and **p<0.01. (D) ROC curves for STC2 and in distinguishing HCC from LC. |
The diagnostic value of serum STC2 was then explored. According to Youden Index,34 a cut-off value for STC2 in HCC diagnosis was set at 1493 ng/L. With this threshold, STC2 could distinguish HCC from LC with a sensitivity of 79.2% (positive predictive value [PPV], 87.4%) and a specificity of 73.8% (negative predictive value [NPV], 60.8%). The AUC for STC2 in HCC detection was 0.867 (95% CI, 0.799–0.935, p<0.0001), which was higher than that for AFP (AUC 0.795, 95% CI, 0.718–0.872, p=0.0001). At a clinical cut-off value of 20 μg/L, AFP had a sensitivity of 79.2% (PPV, 79.5%) and specificity of 52.4% (NPV, 51.9%), both of which were lower than those for STC2 in HCC diagnosis (Figure 4D).
The Capability of STC2 in Early HCC Diagnosis
AFP was currently a practical diagnostic biomarker of HCC in clinic. Our results consistently showed that the serum AFP level was higher in HCC than that in LC and healthy controls (Figure 5A). The ROC analysis was used to compare the potential of STC2 to that of AFP in diagnosing early HCC (Figure 5B). The AUC for AFP was 0.756 (95% CI, 0.597–0.916, p=0.0055). With a clinical cut-off value of 20 μg/L, AFP had a sensitivity of 69.2% (PPV, 31.0%) and specificity of 52.4% (NPV, 84.6%) for early HCC diagnosis. The AUC for STC2 was 0.832 (95% CI, 0.720–0.941, p=0.0003). With a cut-off value of 1493 ng/L, STC2 could distinguish HCC from LC with a sensitivity of 76.9% (positive predictive value [PPV], 50.0%) and specificity of 76.2% (negative predictive value [NPV], 91.4%) (Figure 5B).
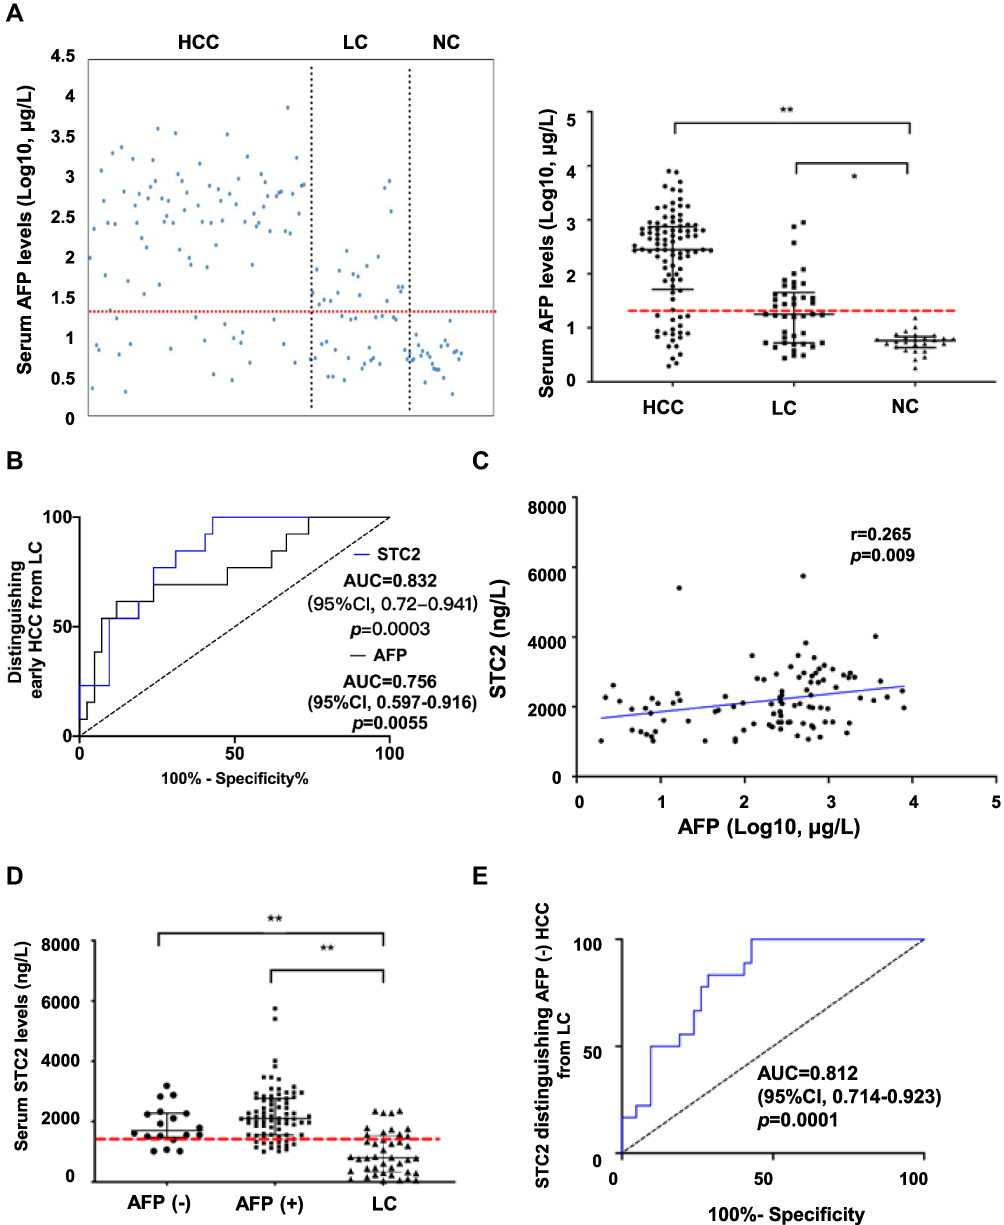 |
Figure 5 The diagnostic performance of AFP. (A) The serum levels of AFP were determined by ELISA. Scatter plots indicated the expression patterns of serum AFP in HCC, LC and NC groups (left panel). The median levels of AFP were compared among different groups (right panel). The dashed line represents the cutoff value of 20 μg/L for AFP. **p<0.01 (vs NC). (B) ROC curves for STC2 and AFP in distinguishing early HCC from LC. (C) The relationship between STC2 and AFP was analyzed by Pearson correlation. The coefficient r was used to determine the correlation. (D) Analysis of serum STC2 levels in AFP-negative HCC, AFP-positive HCC, and LC group. **p<0.01 (vs LC). (E) ROC curve of STC2 for diagnosis of AFP-negative HCC patients. |
The Auxiliary Diagnostic Value of STC2 in AFP-Negative HCC
The Pearson correlation coefficient between STC2 and AFP was 0.265 (p=0.009), suggesting a poor correlationship between these two markers (Figure 5C). The serum STC2 levels were not different between AFP-positive and AFP-negative patients, suggesting that STC2 may be an independent diagnostic factor (Figure 5D). Among 18 AFP-negative patients, STC2 was able to detect 14 cases (77.8%) (AUC=0.812, 95% CI, 0.714–0.923, p=0.0001), suggesting that STC2 might act as an AFP auxiliary diagnostic tool (Figure 5E).
The Prognostic Potential of STC2 in HCC
We finally explored the prognostic potential of STC2 in HCC. Univariate regression analysis indicated that age, sex, STC2 levels, TNM stage and metastasis potential prognostic factors for HCC patients, while AFP levels, liver cirrhosis, tumor size, lymphatic invasion and portal invasion were not prognostic. Subsequent multivariate analysis showed that serum STC2 levels were an independent predictor for HCC (HR=2.41[1.20–4.85], p=0.014, Supplementary Table 3). The median STC2 level (2086.6 ng/L) was used to divide HCC patients into high (STC2high) and low (STC2low) groups. As a result, we showed that STC2high patients had a poorer OS than those with STC2low (p=0.002, Figure 6A). In contrast, when using the median of AFP (543.7μg/L) as a grouping factor, the OS was not different between AFPhigh and AFPlow patients (p=0.829, Figure 6B). The correlation of STC2 with OS and disease specific survival (DSS) was also analyzed with TCGA database, showing that higher STC2 was closely correlated with both poorer rates of OS and DSS (Figure 6C and D). We finally performed correlation analysis of STC2 with several clinicopathological parameters, including tumor stages (T), histological grades (G) and AFP levels in the evaluation of OS and DSS. As expected, higher tumor stages and lower differentiated degrees could be a useful predictor of poor OS and DSS, while AFP was not. Comparing to AFP, tumor staging and differentiating, STC2 was a better prognostic marker of OS and DSS (Figure 6E). Thus, our results demonstrated that STC2 was potentially a promising prognostic biomarker for HCC.
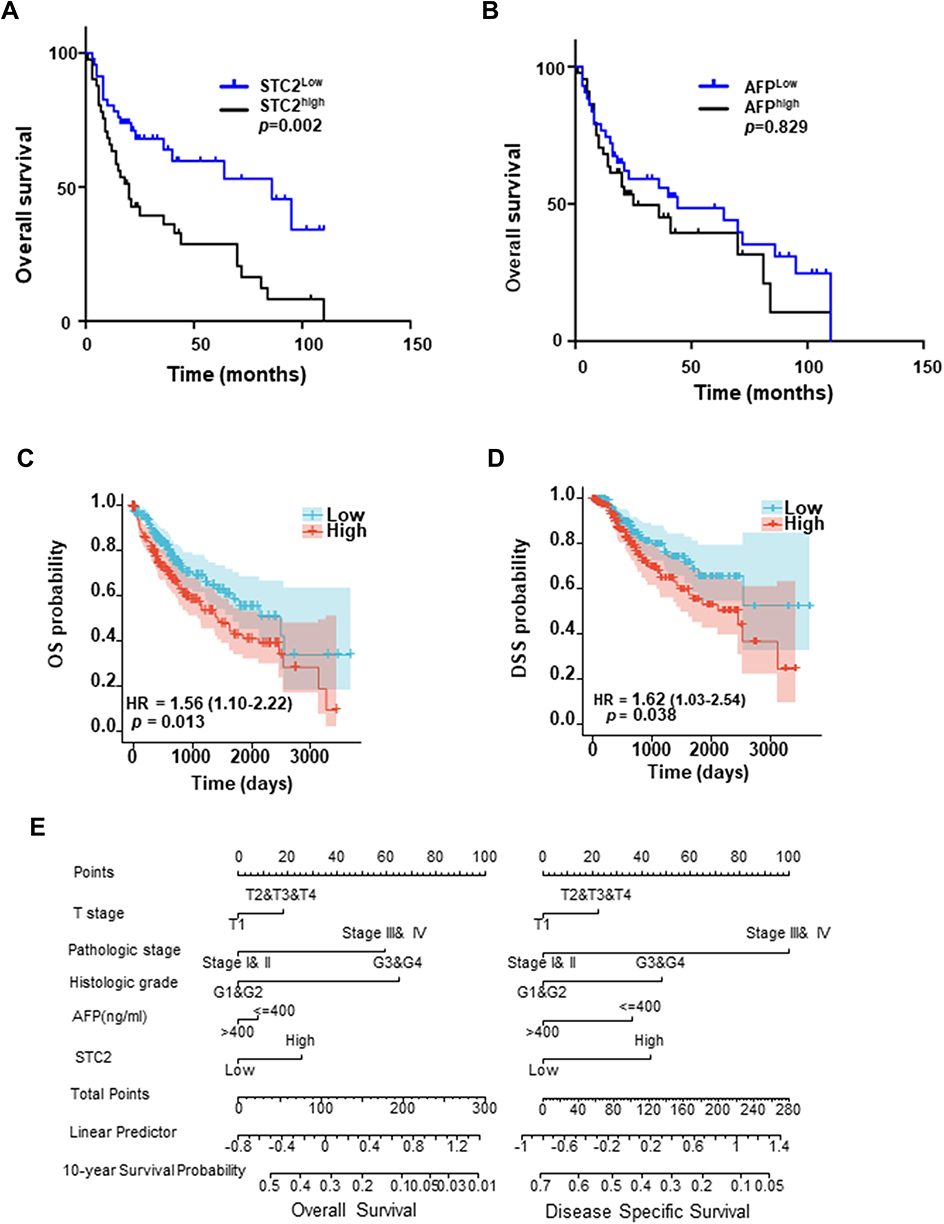 |
Figure 6 Prognostic value of serum STC2. (A and B) Kaplan–Meier overall survival (OS) curves. HCC patients were divided into different groups based on the median level of STC2 (2086.6 ng/L) (A) or AFP (543.7 μg/L) (B). (C and D) Cox analysis of STC2 association with OS and DSS on TCGA-LIHC database. (E) Nomogram prognostic analysis of STC2, AFP and pathological features in the prognosis of HCC. The variables in final model includes T stage, pathologic stage, histologic grade, AFP, and STC2. Each variable has different levels such as “T1” “T2” “T3” “T4” in T stage and “Stage I& II” “Stage III& IV” in pathologic stage. The reader should locate corresponding patients in different variables and draw a line straight upward to the “Points” axis to determine the score. Add each points and locate this sum on the “Total Points” axis and draw a line straight down to the “10-year Survival Probability” axis to find out the final predicted probability. Linear prediction analysis provides a set of predictor coefficients for reader to find out the predictor precision. |
Discussion
STC2 was shown to be associated with poor prognosis of HCC. However, the role of STC2 in HCC remains to be explored. In this study, we showed that STC2 was highly expressed in most tumor tissues (77.1%) and closely associated with disease progression in HCC (Figure 1). Overexpression or knockdown of STC2 promoted or suppressed HCC cell proliferation and xenograft tumor growth in mice, suggesting that STC2 acts as an oncogenic protein in HCC (Figure 2). Consistently, STC2 could mediate epithelial-mesenchymal transition in colon cancer27 and could promote tumor metastasis in head and neck squamous carcinoma.26 It was shown that STC2 overexpression was associate with increased AKT activity.26,27 However, it remains disclosed whether AKT activation is essential for the oncogenic activity of STC2. We demonstrated that overexpression or silencing of STC2 increased or decreased AKT activity. Upon inactivation of AKT with MK2206, the tumor-promoting effect of STC2 was greatly abrogated, indicating that STC2-AKT axis is involved in HCC (Figure 3B). STC2 activation of AKT was followed by induction of Cyclin D1 (Figure 3A). Intriguingly, STC2 was described be associated with Mus81, an endonuclease implicated in DNA double-strand breaks (DSBs), in HCC,29 while overexpression of Cyclin D1 was essential for Mus81-created DSBs.35 It remains interesting to explore the role of STC2-dependent network of Mus81, AKT and Cyclin D1 in the oncogenesis and progression of HCC.
Increased STC2 expression in tumor tissues was correlated with its elevated serum levels in HCC patients (Figure 4), supporting that detection of serum STC2 is of clinical significance for tumor diagnosis (14). Based on the analysis of receiver operating characteristics (ROC), we generated a cut-off value at 1493 ng/L for STC2 in HCC diagnosis. This threshold could distinguish early HCC from LC with a sensitivity of 76.9% and a specificity of 76.2%, which were both superior to those for AFP (69.2% and 52.4%). Among AFP-negative patients, STC2 remained capable of detecting 77.8% HCC with an accuracy of 73.8%. Since about 30–40% HCC patients are AFP-negative,10 this finding is important. Our results suggest that STC2 can supplement AFP in HCC diagnosis (Figure 5). STC2 had also prognostic value, acting as a predictor of poor OS and DSS, while AFP is not a satisfactory monitor of both (Figure 6).
AFP remains currently the major biomarker for HCC screening.8 Given its many limitations, there have been tremendous efforts in searching novel HCC biomarkers, which led to identification of candidates like MDK, DDK1 and glypican-3.13–15 Among them, only DDK1 has been investigated and confirmed in a large-scale multicenter study.15 We did not compare STC2 to the promising candidate DDK1. Since DDK1 is negative in most AFP-positive patients,15 high positive rate of STC2 in AFP-positive patients may compensate for DDK1 in HCC diagnosis. Thus, it is warranted to explore how to combine different biomarkers to improve early HCC diagnosis. Of note, STC2 may not be specific for HCC as it is also increased in other human malignancies.23,36,37 In this study, most of the HCC patients we recruited were HBV positive and had cirrhosis. We could not exclude whether these pathological statuses would affect the serum levels and the role of STC2 in HCC, which remains to be explored.
In summary, we demonstrated that STC2 was highly expressed in most HCC patients and overexpression of STC2 could promote HCC growth through STC2-AKT axis. The most significance of this study is that the serum STC2 is potentially a promising candidate for HCC diagnosis and prognosis. An ELISA-based cut-off value of STC2 set in this study could effectively distinguish early HCC from chronic cirrhosis. Especially, STC2 is a useful diagnostic biomarker for those AFP-negative HCC patients. The clinical value of STC2 for HCC diagnosis is awaiting further investigation in large-scale studies.
Funding
This work was supported by grants from Natural Science Foundation of China (Grant Numbers 82073866, 81673467, 31471273, 31461163002/N_HKU 740/14), Natural Science Foundation of Fujian Province (2019I0002, 2020J011131), China Postdoctoral Fund (2016M590597), Guiding Projects of Fujian Provincial Science and Technology Department (2015Y5007), and Leading Talents in Scientific and Technological Innovation, Double Hundred Talents Program of Fujian Province.
Disclosure
The authors have declared no conflicts of interest for this work.
References
1. Frager SZ, Schwartz JM. Hepatocellular carcinoma: epidemiology, screening, and assessment of hepatic reserve. Curr Oncol. 2020;27(13):138–143. doi:10.3747/co.27.7181
2. Forner A, Reig M, Bruix J. Hepatocellular carcinoma. Lancet. 2018;391(10127):1301–1314. doi:10.1016/S0140-6736(18)30010-2
3. Sung H, Ferlay J, Siegel RL, et al. Global cancer statistics 2020: GLOBOCAN estimates of incidence and mortality worldwide for 36 cancers in 185 countries. CA Cancer J Clin. 2021;71(3):209–249. doi:10.3322/caac.21660
4. Finn RS, Qin S, Ikeda M, et al. Atezolizumab plus bevacizumab in unresectable hepatocellular carcinoma. N Engl J Med. 2020;382(20):1894–1905. doi:10.1056/NEJMoa1915745
5. Zhang S, Gao W, Tang J, et al. The roles of GSK-3beta in regulation of retinoid signaling and sorafenib treatment response in hepatocellular carcinoma. Theranostics. 2020;10(3):1230–1244. doi:10.7150/thno.38711
6. Wang Y, Lu LC, Guan Y, et al. Atezolizumab plus bevacizumab combination enables an unresectable hepatocellular carcinoma resectable and links immune exclusion and tumor dedifferentiation to acquired resistance. Exp Hematol Oncol. 2021;10(1):45. doi:10.1186/s40164-021-00237-y
7. Jiang Y, Sun A, Zhao Y, et al. Proteomics identifies new therapeutic targets of early-stage hepatocellular carcinoma. Nature. 2019;567(7747):257–261. doi:10.1038/s41586-019-0987-8
8. Chen DS, Sung JL, Sheu JC, et al. Serum alpha-fetoprotein in the early stage of human hepatocellular carcinoma. Gastroenterology. 1984;86(6):1404–1409. doi:10.1016/S0016-5085(84)80151-1
9. Zhang K, Song P, Gao J, Li G, Zhao X, Zhang S. Perspectives on a combined test of multi serum biomarkers in China: towards screening for and diagnosing hepatocellular carcinoma at an earlier stage. Drug Discov Ther. 2014;8(3):102–109. doi:10.5582/ddt.2014.01026
10. Shu H, Li W, Shang S, Qin X, Zhang S, Liu Y. Diagnosis of AFP-negative early-stage hepatocellular carcinoma using Fuc-PON1. Discov Med. 2017;23(126):163–168.
11. Debruyne EN, Delanghe JR. Diagnosing and monitoring hepatocellular carcinoma with alpha-fetoprotein: new aspects and applications. Clin Chim Acta. 2008;395(1–2):19–26. doi:10.1016/j.cca.2008.05.010
12. Trevisani F, D’Intino PE, Morselli-Labate AM, et al. Serum alpha-fetoprotein for diagnosis of hepatocellular carcinoma in patients with chronic liver disease: influence of HBsAg and anti-HCV status. J Hepatol. 2001;34(4):570–575. doi:10.1016/S0168-8278(00)00053-2
13. Han HH, Qiu YJ, Shi YY, et al. Glypican-3-targeted precision diagnosis of hepatocellular carcinoma on clinical sections with a supramolecular 2D imaging probe. Theranostics. 2018;8(12):3268–3274. doi:10.7150/thno.24711
14. Zhu WW, Guo JJ, Guo L, et al. Evaluation of midkine as a diagnostic serum biomarker in hepatocellular carcinoma. Clin Cancer Res. 2013;19(14):3944–3954. doi:10.1158/1078-0432.CCR-12-3363
15. Shen Q, Fan J, Yang XR, et al. Serum DKK1 as a protein biomarker for the diagnosis of hepatocellular carcinoma: a large-scale, multicentre study. Lancet Oncol. 2012;13(8):817–826. doi:10.1016/S1470-2045(12)70233-4
16. Ofuji K, Saito K, Yoshikawa T, Nakatsura T. Critical analysis of the potential of targeting GPC3 in hepatocellular carcinoma. J Hepatocell Carcinoma. 2014;1:35–42. doi:10.2147/JHC.S48517
17. Wagner GF, Jaworski EM, Haddad M. Stanniocalcin in the seawater salmon: structure, function, and regulation. Am J Physiol. 1998;274(4):R1177–1185. doi:10.1152/ajpregu.1998.274.4.R1177
18. Chang AC, Jeffrey KJ, Tokutake Y, et al. Human stanniocalcin (STC): genomic structure, chromosomal localization, and the presence of CAG trinucleotide repeats. Genomics. 1998;47(3):393–398. doi:10.1006/geno.1997.5120
19. Yeung BH, Law AY, Wong CK. Evolution and roles of stanniocalcin. Mol Cell Endocrinol. 2012;349(2):272–280. doi:10.1016/j.mce.2011.11.007
20. Joensuu K, Heikkila P, Andersson LC. Tumor dormancy: elevated expression of stanniocalcins in late relapsing breast cancer. Cancer Lett. 2008;265(1):76–83. doi:10.1016/j.canlet.2008.02.022
21. Wang Y, Gao Y, Cheng H, Yang G, Tan W. Stanniocalcin 2 promotes cell proliferation and cisplatin resistance in cervical cancer. Biochem Biophys Res Commun. 2015;466(3):362–368. doi:10.1016/j.bbrc.2015.09.029
22. Wu J, Lai M, Shao C, Wang J, Wei JJ. STC2 overexpression mediated by HMGA2 is a biomarker for aggressiveness of high-grade serous ovarian cancer. Oncol Rep. 2015;34(3):1494–1502. doi:10.3892/or.2015.4120
23. Na SS, Aldonza MB, Sung HJ, et al. Stanniocalcin-2 (STC2): a potential lung cancer biomarker promotes lung cancer metastasis and progression. Biochim Biophys Acta. 2015;1854(6):668–676. doi:10.1016/j.bbapap.2014.11.002
24. Law AY, Wong CK. Stanniocalcin-2 promotes epithelial-mesenchymal transition and invasiveness in hypoxic human ovarian cancer cells. Exp Cell Res. 2010;316(20):3425–3434. doi:10.1016/j.yexcr.2010.06.026
25. Law AY, Wong CK. Stanniocalcin-1 and −2 promote angiogenic sprouting in HUVECs via VEGF/VEGFR2 and angiopoietin signaling pathways. Mol Cell Endocrinol. 2013;374(1–2):73–81. doi:10.1016/j.mce.2013.04.024
26. Yang S, Ji Q, Chang B, et al. STC2 promotes head and neck squamous cell carcinoma metastasis through modulating the PI3K/AKT/Snail signaling. Oncotarget. 2017;8(4):5976–5991. doi:10.18632/oncotarget.13355
27. Chen B, Zeng X, He Y, et al. STC2 promotes the epithelial-mesenchymal transition of colorectal cancer cells through AKT-ERK signaling pathways. Oncotarget. 2016;7(44):71400–71416. doi:10.18632/oncotarget.12147
28. Law AY, Ching LY, Lai KP, Wong CK. Identification and characterization of the hypoxia-responsive element in human stanniocalcin-1 gene. Mol Cell Endocrinol. 2010;314(1):118–127. doi:10.1016/j.mce.2009.07.007
29. Wu F, Li TY, Su SC, et al. STC2 as a novel mediator for Mus81-dependent proliferation and survival in hepatocellular carcinoma. Cancer Lett. 2017;388:177–186. doi:10.1016/j.canlet.2016.11.039
30. Edge SB, Compton CC. The American Joint Committee on Cancer: the 7th edition of the AJCC cancer staging manual and the future of TNM. Ann Surg Oncol. 2010;17(6):1471–1474. doi:10.1245/s10434-010-0985-4
31. World Medical Association. World Medical Association Declaration of Helsinki: ethical principles for medical research involving human subjects. JAMA. 2013;310(20):2191–2194. doi:10.1001/jama.2013.281053
32. Li J, Zhang Z, Feng X, et al. Stanniocalcin-2 promotes cell EMT and glycolysis via activating ITGB2/FAK/SOX6 signaling pathway in nasopharyngeal carcinoma. Cell Biol Toxicol. 2021. doi:10.1007/s10565-021-09600-5
33. Balachandran VP, Gonen M, Smith JJ, DeMatteo RP. Nomograms in oncology: more than meets the eye. Lancet Oncol. 2015;16(4):e173–180. doi:10.1016/S1470-2045(14)71116-7
34. Suner A, Carr BI, Akkiz H, et al. C-Reactive protein and platelet-lymphocyte ratio as potential tumor markers in low-alpha-fetoprotein hepatocellular carcinoma. Oncology. 2019;96(1):25–32. doi:10.1159/000492473
35. Shimura T, Ochiai Y, Noma N, Oikawa T, Sano Y, Fukumoto M. Cyclin D1 overexpression perturbs DNA replication and induces replication-associated DNA double-strand breaks in acquired radioresistant cells. Cell Cycle. 2013;12(5):773–782. doi:10.4161/cc.23719
36. Hu L, Zha Y, Kong F, Pan Y. Prognostic value of high stanniocalcin 2 expression in solid cancers: a meta-analysis. Medicine (Baltimore). 2019;98(43):e17432. doi:10.1097/MD.0000000000017432
37. Aydin HA, Toptas T, Bozkurt S, et al. Stanniocalcin-2 may be a potentially valuable prognostic marker in endometrial cancer: a preliminary study. Pathol Oncol Res. 2019;25(2):751–757. doi:10.1007/s12253-018-00576-y
 © 2022 The Author(s). This work is published and licensed by Dove Medical Press Limited. The full terms of this license are available at https://www.dovepress.com/terms.php and incorporate the Creative Commons Attribution - Non Commercial (unported, v3.0) License.
By accessing the work you hereby accept the Terms. Non-commercial uses of the work are permitted without any further permission from Dove Medical Press Limited, provided the work is properly attributed. For permission for commercial use of this work, please see paragraphs 4.2 and 5 of our Terms.
© 2022 The Author(s). This work is published and licensed by Dove Medical Press Limited. The full terms of this license are available at https://www.dovepress.com/terms.php and incorporate the Creative Commons Attribution - Non Commercial (unported, v3.0) License.
By accessing the work you hereby accept the Terms. Non-commercial uses of the work are permitted without any further permission from Dove Medical Press Limited, provided the work is properly attributed. For permission for commercial use of this work, please see paragraphs 4.2 and 5 of our Terms.