")
Back to Journals » OncoTargets and Therapy » Volume 12
The Nuclear Export Inhibitor Selinexor Inhibits Hypoxia Signaling Pathways And 3D Spheroid Growth Of Cancer Cells
Authors Depping R , von Fallois M, Landesman Y , Kosyna FK
Received 24 April 2019
Accepted for publication 11 September 2019
Published 11 October 2019 Volume 2019:12 Pages 8387—8399
DOI https://doi.org/10.2147/OTT.S213208
Checked for plagiarism Yes
Review by Single anonymous peer review
Peer reviewer comments 2
Editor who approved publication: Professor Gaetano Romano
Reinhard Depping,1 Moritz von Fallois,1,2 Yosef Landesman,3 Friederike Katharina Kosyna1
1Center for Structural and Cell Biology in Medicine, Institute of Physiology, Working Group Hypoxia, University of Lübeck, Lübeck D-23562, Germany; 2Clinic for Radiotherapy, University Hospital Schleswig-Holstein, Lübeck D-23562, Germany; 3Karyopharm Therapeutics, Newton, MA, USA
Correspondence: Friederike Katharina Kosyna
Center for Structural and Cell Biology in Medicine, Institute of Physiology, Working Group Hypoxia, University of Lübeck, Ratzeburger Allee 160, Lübeck D-23562, Germany
Tel +49 451 3101 7322
Fax +49 451 3101 7304
Email [email protected]
Purpose: The nucleocytoplasmic transport of macromolecules is critical for both cell physiology and pathophysiology. Exportin 1 (XPO1), the major nuclear export receptor, is involved in the cellular adaptation to reduced oxygen availability by controlling the nuclear activity of the hypoxia-inducible factors (HIFs). Recently, a specific inhibitor of XPO1, selinexor (KPT-330), has been identified that inhibits nuclear export of cargo proteins by binding to the XPO1 cargo-binding pocket.
Patients and methods: We used different cancer cell lines from human tissues and evaluated the physiological activity of selinexor on the hypoxia response pathway in two-dimensional (2D) monolayer cell cultures in quantitative real-time (qRT)-PCR experiments and luciferase reporter gene assays. A three-dimensional (3D) tumor spheroid culture model of MCF-7 breast cancer cells was established to analyze the effect of selinexor on 3D tumor spheroid structure, formation and viability.
Results: Selinexor treatment reduces HIF-transcriptional activity and expression of the HIF-1 target gene solute carrier family 2 member 1 (SLC2A1). Moreover, 3D tumor spheroid structure, formation and viability are inhibited in response to selinexor-induced nuclear export inhibition.
Conclusion: Here, we demonstrate the effect of specific XPO1-inhibition on the hypoxic response on the molecular level in 2D and 3D culture models of MCF-7 cells.
Keywords: nuclear transport, HIF, hypoxia, XPO1, selinexor, tumor growth
Introduction
In eukaryotic cells, nuclear-cytoplasmic shuttling of proteins is a key step in the regulation of intracellular signaling and the adaptation of cell homeostasis to the environment. Proteins are translated in the cytoplasm, but many proteins, especially transcription factors, need to be localized to the nucleus to exert their specific function.1 The nuclear envelope separates the nucleus and the cytoplasm and defines two specialized compartments. Nuclear pore complexes (NPCs) enable passive passage of proteins with a molecular mass up to a size of ~40 kDa, whereas the nuclear-cytoplasmic transport of larger macromolecules is energy-dependent and requires nuclear transport receptors called karyopherins or importins/exportins.2 Importins recognize their cargo proteins in the cytoplasm via nuclear localization signals (NLS) and mediate nuclear import through the NPC. Inside the nuclear compartment, disassembly of the import complex is achieved by binding of RanGTP.3 In contrast, exportins bind their cargo proteins in the nucleus via nuclear export signals (NES) together with RanGTP. In the cytoplasm, the trimeric export complex disassembles upon GTP hydrolysis of RanGTP.4 The main mediator of nuclear export is Exportin 1 (XPO1).5 XPO1 binds a short leucine-rich or hydrophobic nuclear export signal of the cargo protein and directly interacts with nucleoporins in the NPC.6
In recent years, XPO1 turned out to be responsible for the nuclear export of more than 200 cargo proteins including many of the major (proto-) oncoproteins and tumor suppressors such as BRCA1,7 p53,8 cyclin D19 and the FoxO subfamily of Forkhead transcription factors.10 Deregulation of nuclear export processes causes mislocalization, inactivation or aberrant activation of cancer-related proteins and has been implicated in uncontrolled cancer cell growth and radio- and drug resistance.11,12 For example, inactivation of p53 during tumor development is caused by cytoplasmic accumulation of p53 and depends on MDM2-mediated ubiquitination efficient nuclear export of nuclear p53.13 Moreover, in esophageal cancer samples, several mutations were identified that disrupt phosphorylation-dependent nuclear export of cyclin D1 suggesting that nuclear accumulation of cyclin D1 contributes to the genesis and progression of neoplastic growth.14 The promising potential of XPO1 as a valid target for therapeutic intervention is further underlined by the fact that XPO1 protein expression is increased in various solid tumors such as ovarian,15 osteosarcoma,16 pancreatic,17 cervical18 and gastric19 cancers and hematological malignancies.20,21 In addition, poor clinical outcome, increased metastasis, increased tumor size and decreased progression-free and overall survival is associated with XPO1 overexpression.
Although XPO1 inhibition affects all XPO1 cargo proteins bearing an NES, malignant cells are more affected by nuclear export inhibition. Tumor cells have to adapt to their surrounding microenvironment which may result in a higher dependence on nuclear-cytoplasmic transport.22 This makes nuclear transport receptors promising targets for therapeutic intervention for several disease states and especially in cancer.
Previously, the anti-fungal antibiotic leptomycin B (LMB) has been reported to be a potent compound for the inhibition of XPO1-dependent nuclear export.23 However, LMB showed systemic toxicity in both animals and humans in phase I clinical studies resulting in discontinuation of clinical development.24 More recently, novel, orally bioavailable, small-molecule selective inhibitor of nuclear export (SINE) compounds such as selinexor have been described. These compounds form covalent bonds with cysteine-528 of the XPO1 cargo-binding pocket, thereby inhibiting interaction between XPO1 and its cargo proteins.25 Selinexor is currently under evaluation in phase II and III clinical trials. Thereby, promising antitumor activity in both solid and hematological cancer types was demonstrated.26–28 In July 2019, the U.S. Food and Drug Administration (FDA) has approved selinexor (XPOVIOTM) in combination with dexamethasone for the treatment of adult patients with relapsed or refractory multiple myeloma (NCT02336815).
Hypoxia is a characteristic feature of solid tumors evolving due to an imbalance between oxygen availability and consumption. Cancer cells induce metabolic changes and develop a metabolic flexibility to survive and proliferate in low oxygen tension conditions. The transcription factor hypoxia-inducible factor (HIF) is a master regulator in the adaptation to hypoxia and the regulation of cancer cell metabolism since HIF specific target genes are involved in the activation of numerous cellular processes including cell survival, glycolytic energy metabolism, erythropoiesis, vascular remodeling and angiogenesis.29 Accordingly, a strong correlation between the nuclear accumulation of HIF and malignant cancer phenotype, poor patient prognosis and tumor resistance has been described.30,31 Since the activity of HIF depends on its correct spatial arrangement, intracellular localization of HIF plays a major role for the broad metabolic reprogramming of cancer cells and involves nuclear export by XPO1.32,33
The heterodimeric transcription factor HIF consists of one of the three different oxygen-labile α-subunits (primarily HIF-1α) and a constitutive β-subunit. In contrast, protein expression of HIF-1α is tightly regulated by oxygen-dependent post-translational modifications.34 In normoxia, HIF-1α is hydroxylated by one of the three cellular oxygen sensors prolyl hydroxylase domain (PHD) proteins PHD1, PHD2 or PHD3 resulting in recognition by von Hippel–Lindau protein followed by ubiquitination and proteasomal degradation.35 Under hypoxic conditions, lack of oxygen inhibits PHD activity and results in HIF-1α stabilization and subsequent translocation to the nucleus. The knowledge about the pattern of regulation of HIF was extended by a recent publication showing that the scaffold protein LIM Domain-Containing Protein 1 (LIMD1) is also involved in HIF-1 regulation in normoxia as well as in hypoxia.36 LIMD1 was identified to be a HIF-1 target gene acting via a so far unknown negative feedback mechanism involving PHD2‐LIMD1‐VHL complex formation.
We set out to address the biological and physiological activity of the XPO1-inhibitor selinexor on the HIF-signaling pathway in 2D monolayer and 3D tumor spheroid culture models. Upon selinexor treatment, 2D monolayer-cultured cells show a decrease in HIF-1α protein expression, HIF transcriptional activity and HIF-1 target gene expression in hypoxic conditions. Moreover, we investigated the basic mechanism underlying selinexor-dependent HIF-inhibition in the same model demonstrating that it does not depend on the HIF-LIMD1 negative feedback mechanism. Utilizing 3D tumor spheroid culture models, we determined that selinexor decreases cell viability, 3D tumor spheroid growth and HIF-1α protein expression in a model representing in vivo physiological conditions. We demonstrate the molecular mechanistic effect of the XPO1-inhibitor selinexor on the HIF-dependent signaling pathway in 2D and 3D culture models of MCF-7 breast cancer cells.
Materials And Methods
Cell Culture, DNA Transfection And Selinexor Treatment
Human cell lines were purchased from the ATCC or the DSMZ. All cell lines used were regularly tested for contaminations by mycoplasma (Mycoplasma Detection Kit, Southern Biotech, Birmingham, USA). MCF-7 (human breast adenocarcinoma), Hep3B (hepatocellular carcinoma) and U2OS (human osteosarcoma) cells were grown in DMEM (Gibco, Darmstadt, Germany) culture medium. Ten percent fetal calf serum (Gibco), 100 IU/mL penicillin and 100 mg/mL streptomycin (PAA Laboratories, Coelbe, Germany) were added to the culture medium. Cells were grown in an incubator at 37°C and 5% CO2. For hypoxic culture conditions, a hypoxia workstation (InvivO2 400, Baker Ruskinn, I&L Biosystems, Königswinter, Germany) was used containing 1% O2, 94% N2 and 5% CO2 for 24 hrs. Normoxic control cells were placed in an incubator (5% CO2, 21% O2, and 74% N2) for the same period of time. Semi-confluent cell cultures were transiently transfected using GeneJuice transfection reagent (Merck, Darmstadt, Germany) for 24 hrs as described by the manufacturer. Where indicated, cells were pre-treated with selinexor (Karyopharm Therapeutics Inc., Newton, MA, USA) dissolved in dimethyl-sulfoxide (DMSO) at the concentrations between 0.01 and 2.0 μm for 1 hr before starting the experiment. Selinexor was obtained from Karyopharm Therapeutics. After addition of selinexor, culture medium was not changed until normoxic or hypoxic incubation was started. As control, DMSO was added to the culture medium.
3D Tumor Spheroid Cell Culture On Polydimethylsiloxane (PDMS)
Dow Corning’s Sylgard 184 silicone elastomer kit (VWR, Darmstadt, Germany) was used in a 10 to 1 ratio of base to curing agent (w/w) to cast PDMS in flat-bottom, tissue culture-treated multiwell cell culture plates (Sarstedt, Nümbrecht, Germany). The PDMS pre-polymer components were manually mixed with a pipette tip in a 50 mL tube for 30 s. Of the pre-polymer, 300 μL or 60 µL was pipetted into each well of a 24-well or 96-well plate, respectively. After settling of the pre-polymer at room temperature (20°C–25°C) for 30 mins, the plates were cured at 40°C for 4 hrs. The PDMS-cured plates were used for 3D tumor spheroid cell culture. Monolayer cultured MCF-7 cells were dislodged from cell culture T75-flasks (Sarstedt) by 0.05% Trypsin-EDTA (Gibco). Cells were centrifuged at 1100 rpm for 5 mins and resuspended in DMEM culture medium. For a single well of a 24-well or 96-well plate cured with PDMS, 50,000 or 10,000 cells were used, respectively. Culture medium was changed twice, at day 4 and day 8 after seeding. Before used for any of the assays/treatment conditions, 3D tumor spheroids were allowed to grow for at least 3 days. 3D tumor spheroids were treated with selinexor at day 4 or day 8 after seeding. Eleven days after seeding cell viability and cytotoxic effects were assessed in 3D tumor spheroids having a size of ~350μm. The size and morphology of tumor spheroids were analyzed with an inverted tissue culture microscope (Axiovert 25, Zeiss, Zaventem, Belgium) with a 10x objective lens. Pictures were taken using a digital camera and an appropriate photo adapter (Olympus Camedia C-3040, Olympus, Hamburg, Germany).
3-(4,5-Dimethylthiazol-2-yl)-2,5-Diphenyltetrazolium Bromide (MTT) Cytotoxicity Assay
Cytotoxicity of selinexor on MCF-7, Hep3B and U2OS cells was analyzed using the colorimetric 3-(4,5-dimethylthiazol-2-yl)-2,5-diphenyl tetrazolium bromide (MTT, Sigma-Aldrich, München, Germany) assay. Cells were seeded in 96-well plates and treated with selinexor in the range of 0.01–2.0 μM or DMSO. After 24 hrs, cells were incubated with MTT solution (5 g/l) for 24 hrs and then lysed with DMSO. The optical density represents the cellular metabolic activity and was detected with a microplate reader (Thermo Fisher Scientific, Bonn, Germany) at 570 nm. Four technical replicates were measured.
Fluorescent Microscopy
U2OS cells were grown in 24-well plates to semi-confluency. Cells were pre-treated for 1 hr with 1.0 μm selinexor or DMSO in normoxic conditions (20% O2). Activity of PHD proteins was inhibited by addition of 1 mM Dimethyloxaloylglycine (DMOG) for 4 hrs stabilizing HIF-1α. Selinexor/DMSO treatment was continued during incubation with DMOG. Afterwards, cells were washed with PBS and fixed with 250 µL of 3.7% formaldehyde in PBS for 15 mins. Permeabilization was achieved by treatment with 0.1% Triton-X 100 and non-specific staining was blocked with 0.2% gelatin from cold water fish skin in PBS overnight. Cells were incubated with mouse anti-HIF-1α antibody diluted 1:100 in 0.2% gelatin from cold water fish skin in PBS overnight (Cat No 610959, BD Transduction Laboratories, Heidelberg, Germany). After washing with PBS, cells were incubated with an Alexa 488-labelled goat anti-mouse secondary antibody diluted 1:500 in 0.2% gelatin from cold water fish skin in PBS (Cat No A-11017, Thermo Fisher Scientific). For mounting, cells were treated with ProLong Gold antifade reagent with DAPI on glass slides (Invitrogen, Darmstadt, Germany). Samples were allowed to dry for 1 day before they were observed under an all-in-one Type Fluorescence Microscope (BZ-8000, Keyence, Osaka, Japan) with a 20x objective lens using the BZ Analyzer Software (Keyence). Two technical replicates were analyzed.
RNA Isolation And Quantitative Real-Time PCR
MCF-7, Hep3B and U2OS cells were grown in 24-well plates and pre-treated with 0.1 or 1.0 µM selinexor 1 hr before normoxic (20% O2) or hypoxic (1% O2) incubation. After 4 hrs of incubation, total RNA was extracted using the total RNA Purification Kit (Jena Bioscience, Jena, Germany) according to the manufacturer’s protocol. cDNA of total RNA (100–300 ng) was synthesized with the M-MuLV reverse transcriptase (New England Biolabs, Frankfurt, Germany) and random hexamer primers (Thermo Fisher Scientific) following the instructions of the manufacturer. Quantitative RT-PCR was performed in the Eco48 qPCR System (PCRmax Limited Beacon Road, Staffordshire, United Kingdom) with 1 μL cDNA and the SensiMix SYBR Kit (Bioline, Luckenwalde, Germany) in a total volume of 12.5 μL. PCR primer sequences can be provided upon request by the authors. Expression values were normalized to relative expression of ribosomal protein L28 (RPL28) and four technical replicates were measured.
Luciferase Reporter Gene Assay
MCF-7, Hep3B and U2OS cells were used to measure HIF-1 activity in reporter gene studies. Cells were allowed to grow on 24-well plates before they were transiently transfected with a hypoxia-responsive luciferase plasmid which contains six HIF-1 binding sites from the transferrin 3′ enhancer.37 Empty control vector (pGL4 vector, Promega, Mannheim, Germany) served as transfection control. Medium was renewed 24 hrs after transient transfection. Cells were pre-treated with 0.1 or 1.0 µM selinexor or DMSO for 1 hr before incubation in normoxia (20% O2) or hypoxia (1% O2) for 24 hrs. After incubation, lysis was performed using Reporter Lysis 5X Buffer (Promega). Luminescent signal intensities were analyzed with the Luciferase Assay System (Promega) using a MicroLumat LB 96P Plate Reader (Berthold Technologies, Bad Wildbad, Germany). Bio-Rad DC Protein Assay (Bio-Rad, München, Germany) was used for determination of protein concentrations. Firefly luciferase (FL) activities were normalized to protein concentrations. Three technical replicates were analyzed.
Protein Extraction And Immunoblot Analysis
3D tumor spheroids were extracted from their 3D culture environment for protein extraction. Therefore, culture medium was carefully resuspended and pooled in a single falcon tube per sample. PDMS-cured plates were rinsed with 1 medium-volume of ice-cold PBS. The rinse was transferred to the same tube. The solution was centrifuged at 170 × g for 10 mins so that the tumor spheroids collected at the bottom without forming a tight pellet. The supernatant was removed and the tumor spheroids were gently washed with 1 mL ice-cold PBS and transferred to a new reaction tube. Again, tumor spheroids were centrifuged at 170 × g for 5 mins. Supernatant was removed and tumor spheroids were extracted with UREA lysis buffer containing 10 mM Tris-HCl (pH 6.8), 6.7 M Urea, 10 M Glycerin, 1% SDS and 5 mM DTT. Protein extracts were supplemented with protease inhibitor cocktail (Roche, Mannheim, Germany). Protein concentrations were analyzed with the Bio-Rad DC Protein Assay (Bio-Rad, Munich, Germany). A total of 100 µg protein lysate were subjected to 7.5% SDS-PAGE and transferred by semidry blotting onto nitrocellulose membrane (Amersham Hybond-ECL, GE Healthcare). Membranes were blocked by incubation in 5% nonfat dry milk powder in PBS for at least 2 hrs at 4°C. Membranes were treated with a monoclonal mouse anti-HIF-1α antibody (Cat. No. 610959, BD Biosciences, Heidelberg, Germany) diluted 1:1000 in 3% nonfat dry milk powder in PBS with cautious shaking overnight at 4°C and a polyclonal goat anti-mouse peroxidase (HRP)-conjugated secondary antibody diluted 1:2000 in 3% nonfat dry milk powder in PBS (Cat. No. P0447, Dako, Hamburg, Germany). Incubation with a monoclonal rabbit anti-β-Actin antibody (Cat. No. 4970, Cell Signaling) diluted 1:1000 in 3% nonfat dry milk powder in PBS for 1 hr followed by incubation with a polyclonal goat anti-rabbit antibody diluted 1:2000 in 3% nonfat dry milk powder in PBS (Cat. No. P0448, Dako, Hamburg, Germany) was performed to ensure equal protein loading and transfer. Immunoreactive proteins were detected using ECL detection reagents (Amersham ECL Western Blotting Detection Reagents, GE Healthcare, Freiburg, Germany) for 1 min followed by exposure to X-ray films (Amersham Hyperfilm MP, GE Healthcare, Freiburg, Germany).
3D Tumor Spheroid Cell Viability And Cytotoxicity Assays
After 11 days, cytotoxic effects of selinexor treatment and 3D tumor spheroid cell viability were determined using the CellTox Green fluorescent cytotoxicity and CellTiter-Glo 3D luminescent cell viability assay kits (Promega) according to the manufacturer’s instructions. Due to their spectrally distinct measures, these assays can be multiplexed. Defined numbers of cells were seeded for 3D tumor spheroid culture. However, medium change and the removal of dead cells could result in different cell numbers and misinterpreting results. CellTox Green Dye binds DNA in compromised cells and enhances fluorescent properties and was used to assess membrane integrity and cytotoxicity of selinexor treatment. After 15 mins of incubation, supernatant was transferred to an opaque-walled multiwell plate and fluorescence was measured at 485nmEx/535nmEm before cell lysis (RLU BL). Supernatant was transferred back to the PDMS-cured plate and CellTiter-Glo cell viability assay was performed including cell lysis of 3D tumor spheroidal cells. CellTiter-Glo reagent was added, mixed by shaking for 5 mins and incubated for 25 mins at room temperature. Again, supernatant was transferred to an opaque-walled multiwell plate. Luminescence which associated with ATP levels and viability of the 3D tumor spheroids was recorded (RLU). Finally, fluorescence was measured as described above for overall cell number determination after cell lysis (RFU AL). Relative ATP levels were determined according to the following formula. Numbers of disintegrated cells before starting ATP level measurement were subtracted from the overall cell numbers after total cell lysis. Then, luminescence (RLU) was normalized to fluorescence (RFU) for each of the four technical replicates.

Statistical Analysis
Experiments were conducted by a mixture of technical and biological replicates. Due to differences in the experimental setting, the numbers of technical replicates differ and are mentioned in the corresponding sections. Results are shown as mean ± standard deviation of the mean of at least n=3 independent biological replicates. The number of biological replicates varied according to experimental efforts and study design. One-way analysis of variance and Bonferroni’s post-test was used to calculate statistical differences of means between treated and control groups. Significance was accepted at p < 0.05* (*p <0.05; **p<0.01; ***p<0.001). For statistical calculations, GraphPad Prism 5 software (GraphPad Software, La Jolla, CA, USA) was used.
Results
No Cytotoxic Effects Of Selinexor At Concentrations Up To 1.0 μm
Using the MTT cytotoxicity assay, cell viability of MCF-7, Hep3B and U2OS cells was tested after 24 hrs of selinexor treatment at the indicated concentrations in normoxia and hypoxia. Cellular metabolic activity upon selinexor treatment for 24 hrs at concentrations up to 2.0 μm did not decrease by more than 24% compared to DMSO-treated control cells in MCF-7 cells (Figure 1). In Hep3B and U2OS cells, selinexor treatment resulted in a reduction of cellular metabolic activity by up to 22%. Based on these results, we decided to treat cells with 0.1 µM and 1.0 µM selinexor in our experiments. No differences in cytotoxicity regarding treatment with medium versus medium supplemented with low concentrations of DMSO could be detected (data not shown).
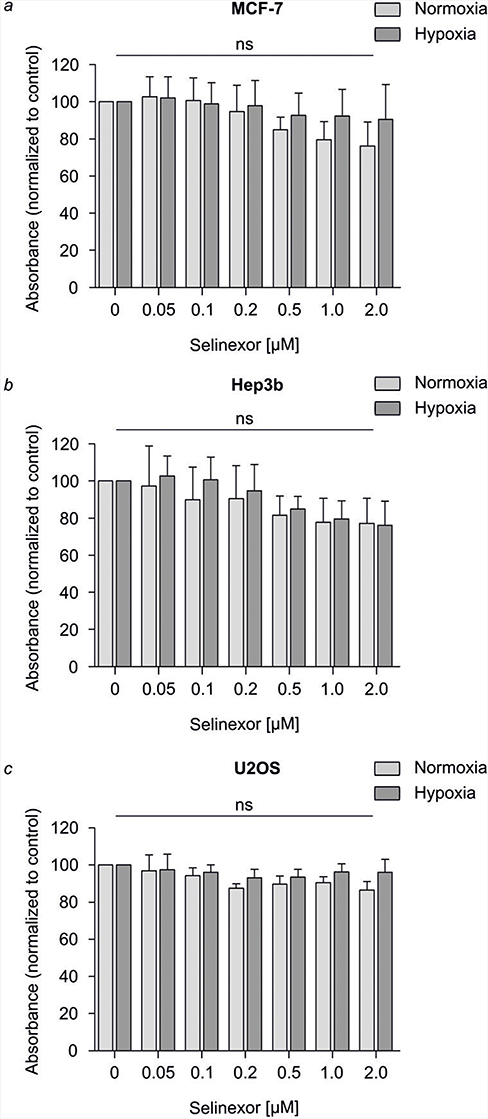 |
Figure 1 Cytotoxic effects of selinexor in 2D-cultured MCF-7 cells. Defined numbers of MCF-7 (A), Hep3B (B), and U2OS (C) cells were incubated in normoxia (light gray) and hypoxia (gray) for 24 hrs and treated with selinexor (Sel) at the indicated concentrations in the range of 0.05 µM to 2.0 µM. DMSO treatment served as control. Cytotoxicity was analyzed by MTT cytotoxicity assay. Cellular metabolic activity of selinexor-treated cells is represented by relative absorbance normalized to the control. For all three cell lines tested, cytotoxic effects of selinexor treatment that inhibit cellular metabolic activity are represented by a decrease in relative absorbance. Cytotoxicity does not increase significantly at all selinexor concentrations tested. Data are mean±SD; n = 3. |
Effects Of Selinexor Treatment On The HIF-Dependent Hypoxia Response Pathway
We investigated whether selinexor affects stabilized HIF-1α nuclear localization after PHD inhibition by DMOG treatment. Immunofluorescence staining of HIF-1α in U2OS cells was performed. The subcellular distribution of HIF-1α was analyzed by fluorescence microscopy and quantified. DAPI fluorescence was used for single-cell discrimination. DMOG treatment resulted in nuclear accumulation of HIF-1α. The presence of DMSO in the culture media had no effect on the response to DMOG. HIF-1α accumulated in the nucleus with or without the presence of 0.1 µM and 1.0 µM selinexor (Figure 2A).
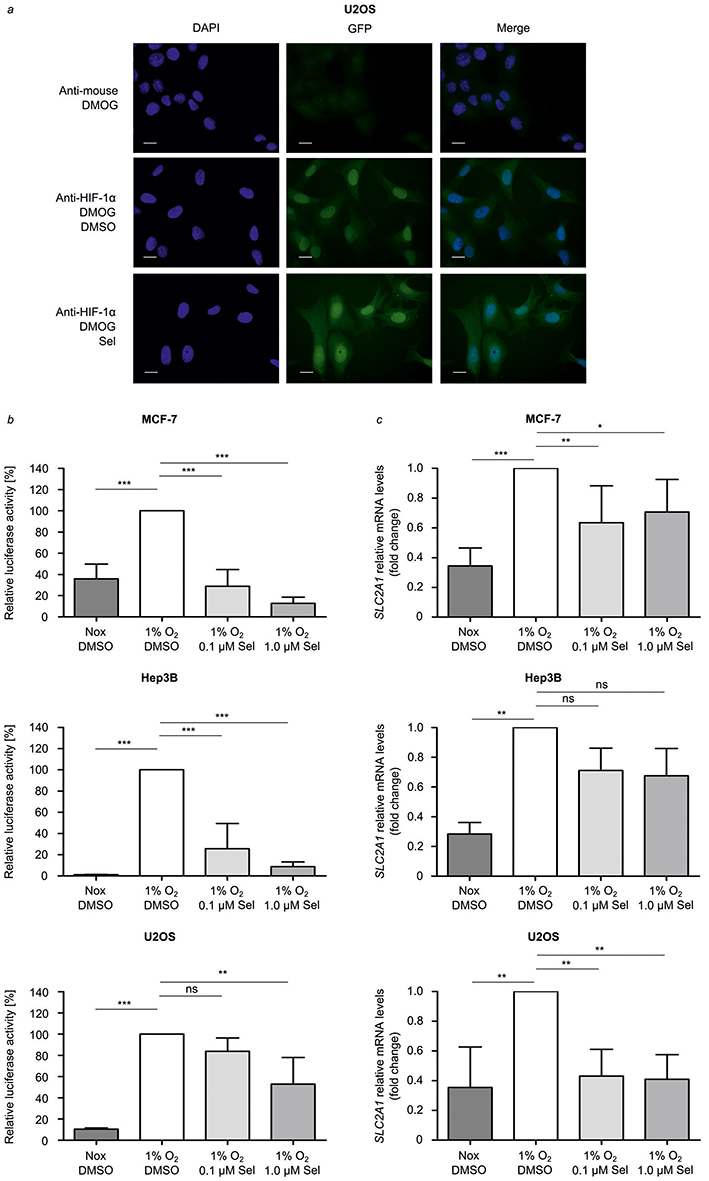 |
Figure 2 Selinexor treatment inhibits HIF-signaling. (A) For localization studies, U2OS cells were grown in 24-well plates to 50% confluence. Cells were pre-treated with 1.0 µM selinexor (Sel) or DMSO for 1 hr. PHD activity was inhibited by addition of 1 mm DMOG for 4 hrs and resulted in HIF-1α stabilization. HIF-1α was detected with a monoclonal anti-HIF-1α antibody by immunofluorescence analysis. Samples were observed under an all-in-one Type Fluorescence Microscope with a 20 x objective lens. Representative microscopic images are shown. Scale bar: 20 µm. (B) Defined numbers of MCF-7, Hep3B and U2OS cells were seeded in 24-well plates. A HIF-dependent firefly luciferase gene was transiently transfected. Cells were pre-treated for 1 hr with selinexor at 0.1 µM and 1.0 µM or DMSO and then exposed to hypoxia (1% O2) for 24 hrs. A normoxic (20% O2) control was conducted to analyze hypoxic induction. The transcriptional HIF-activity is represented by the firefly reporter activity. Firefly luciferase (FL) activities were normalized to protein concentrations. (C) Defined numbers of MCF-7, Hep3B and U2OS cells were treated with DMSO, 0.1 µM or 1.0 µM selinexor for 1 hr, before incubation in normoxia (20% O2) or hypoxia (1% O2) for 4 hrs. Afterwards, total mRNA was reverse-transcribed and analyzed by qRT-PCR for SLC2A1 expression. Normalized ratios for mRNA encoding SLC2A1 to that of mRNA encoding RPL28 are shown. Differences of means between treated and control groups were assessed using repeated-measures ANOVA and Bonferroni’s post-test. Data are mean±SD; n = 3–4; *p<0.05, **p < 0.01, ***p<0.001, ns=not significant. |
Next, we investigated the effect of selinexor treatment on HIF-transactivation playing a pivotal role for its functional in vivo relevance since hypoxia is a hallmark of solid tumor formation. HIF-dependent reporter gene assays were performed in MCF-7, Hep3B and U2OS cells. Cells were transiently transfected with a HIF-dependent reporter gene construct. In hypoxia, HIF-dependent transcriptional activity was 2.5-50-fold higher than in normoxic conditions. Treatment with selinexor (0.1 and 1.0 µM, 25 hrs) significantly reduced the hypoxic luciferase activity in a dose-dependent manner to 25.6% and 8.6% (Hep3B), 83.8% and 52.9% (U2OS) and 28.9% and 12.7% (MCF-7) (Figure 2B). DMSO-treated cells served as controls. These findings indicate that the blockage of nuclear export via XPO1 has a major influence on HIF-transactivation.
To further analyze the role of selinexor in the HIF-dependent transcriptional regulation, total RNA was isolated from MCF-7, Hep3B and U2OS cells treated with or without selinexor. mRNA levels of the specific HIF-1 target gene SLC2A1 were analyzed by qRT-PCR. Hypoxia significantly induced expression of the HIF-1 target gene SLC2A1. DMSO in the culture media did not alter the expression of the HIF-1 target gene (data not shown). In comparison to control cells treated with DMSO, treatment with selinexor significantly reduced mRNA expression of SLC2A1 in a dose-dependent manner in MCF-7 and U2OS cells (Figure 2C). These results indicate that nuclear export inhibition by selinexor inhibits HIF-1 target gene expression.
Since HIF-α-degradation in hypoxia is mediated by a negative feedback mechanism involving PHD2-LIMD1-VHL complex formation (24). In order to investigate a possible involvement of LIMD1 in the inhibition of HIF-signaling upon selinexor treatment, we analyzed LIMD1 expression in MCF-7 cells. To test this, MCF-7 cells were treated with 0.1 µM and 1.0 µM selinexor and cultured in hypoxic conditions. The expression of LIMD1 mRNA was analyzed by qRT-PCR and showed that relative LIMD1 mRNA levels are not affected by inhibition of nuclear export using selinexor in different concentrations (data not shown).
Selinexor Treatment At A Concentration Of 1.0 µm Is Cytotoxic For MCF-7 3D Tumor Spheroids And Affects ATP Levels
Membrane integrity of 3D tumor spheroid cells treated with selinexor was measured using the CellTox Green fluorescent cytotoxicity assay. Therefore, fluorescent signal intensities were measured before cell lysis at 485nmEx/535nmEm. High signal intensities correlated with a high number of cells that had been damaged by selinexor treatment. Treatment with 0.01, 0.05 µM and 0.1 µM selinexor had no significant cytotoxic effects in 3D conditions during the course of 4 and 8 days of treatment. However, treatment with 1.0 µM selinexor significantly increased fluorescent signal intensities in the CellTox Green fluorescent cytotoxicity assay (Figure 3A). These results indicate that selinexor at a concentration of 1.0 µM may damage membrane integrity in MCF-7 3D tumor spheroids.
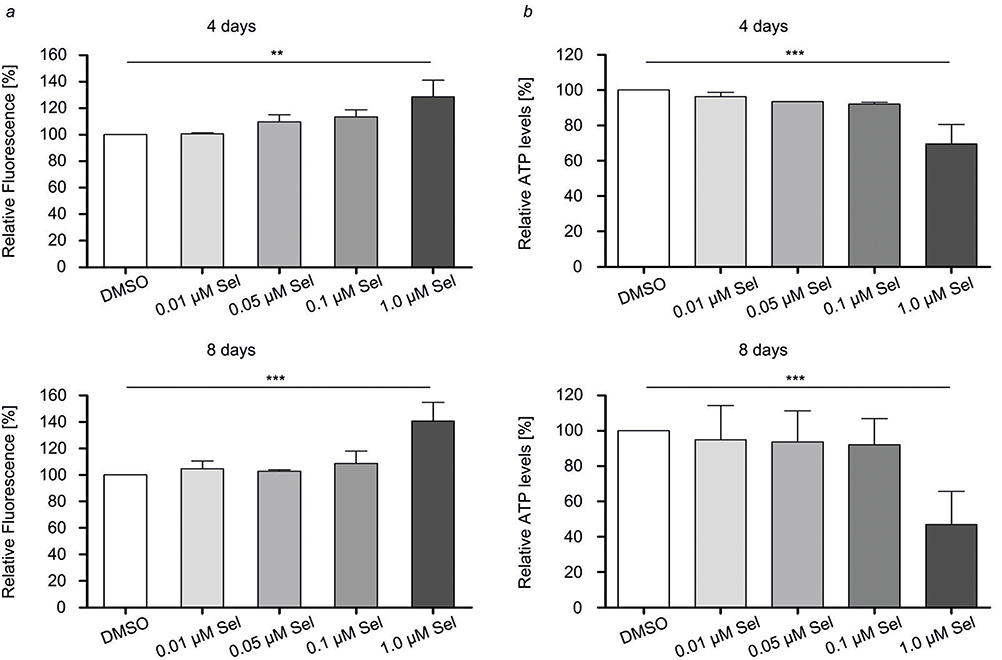 |
Figure 3 Membrane integrity and ATP levels are decreased in selinexor-treated 3D tumor spheroids. Defined numbers of MCF-7 cells were seeded on PDMS cured 96-well plates. 3D tumor spheroids were allowed to grow for 3 days before they were treated with selinexor (Sel) at concentrations of 0.1 µM and 1.0 µM at day 4 or day 8 after seeding. At day 11, cytotoxic effects and 3D tumor spheroid cell viability after selinexor treatment were determined. (A) CellTox green dye was combined with appropriate assay buffer and added. After 15 mins, fluorescence was measured. (B) CellTiter-Glo substrate was mixed with appropriate buffer and added to experimental wells by which cell lysis was induced. Luminescence was recorded to measure intracellular ATP levels. Fluorescence was recorded and represents the number of cells. ATP levels are normalized to the amount of cells after lysis. Differences of means between treated and control groups were assessed using repeated-measures ANOVA and Bonferroni’s post-test. Data are mean±SD; n = 4; **p < 0.01, ***p<0.001. |
We furthermore analyzed the effect of selinexor treatment on ATP levels in MCF-7 3D spheroids. CellTiter-Glo 3D luminescent cell viability assays were performed. Luminescence was measured representing ATP levels in 3D tumor spheroids. The CellTiter-Glo 3D cell viability assay was multiplexed with the CellTox Green fluorescent cytotoxicity assay to calculate ATP levels in 3D tumor spheroidal cells. Treatment with 1.0 µM selinexor resulted in lower luminescent signal intensities after 4 and 8 days of treatment indicating that selinexor decreased ATP levels in 3D tumor spheroids at a concentration of 1.0 µM (Figure 3B).
3D Tumor Spheroid Formation And Growth Is Inhibited By Selinexor
In order to assess the capacity of MCF-7 cells to form and maintain 3D tumor spheroids after XPO1-blockage, the morphology of 3D tumor spheroids was investigated after selinexor treatment. Morphologically, 3D tumor spheroids changed at 8 days of selinexor treatment at 0.1 µM and 1.0 µM. The size of the selinexor-treated 3D tumor spheroids was reduced resulting in very small spheroids (Figure 4A). Moreover, morphology of 3D tumor spheroids changed from round and spherical to irregular formed small spheroids and single-cell morphology.
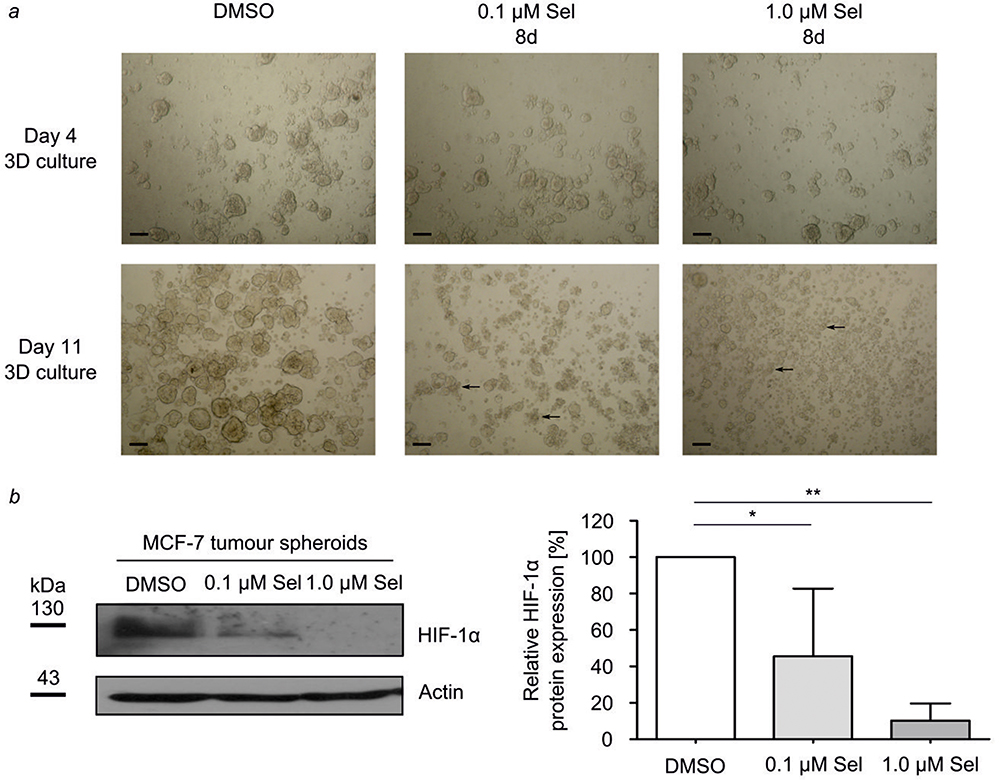 |
Figure 4 Selinexor induces disaggregation of 3D tumor spheroids. Defined numbers of MCF-7 cells were grown on PMDS cured plates to form 3D tumor spheroids. On day 4, 3D tumor spheroids were treated with DMSO or 0.1 µM or 1.0 µM selinexor (Sel). (A) Pictures were taken using an inverted tissue culture microscope with a 10X objective lens with a digital camera and an appropriate photo adapter. Black arrows indicate examples of 3D tumor spheroid disaggregation. Scale bar: 100 µm. (B) MCF-7 3D tumor spheroids were analyzed for HIF-1α protein expression on day 11. Immunoblot analysis was performed using a monoclonal anti-HIF-1α antibody. The anti-actin antibody served as control for equal protein loading and transfer. The immunoblots shown are representative for three independent experiments. Analysis of densitometry was performed using Image J software. Relative HIF-1α protein expression was calculated after normalization to actin protein levels. Data are mean±SD; n=3; *p<0.05, **p < 0.01. |
Selinexor Inhibits HIF-1α Protein Levels In 3D Tumor Spheroids
Ischemic hypoxia occurs frequently in solid tumors and is associated with HIF-1 activation, thereby modulating gene expression, tumor angiogenesis, and growth.38 We therefore aimed to investigate HIF-1α protein expression in MCF-7 3D tumor spheroids cultured in normoxic conditions. HIF-1α protein could be detected in MCF-7 3D tumor spheroids cultured for 11 days. Next, we analyzed the effect of XPO1 inhibition on HIF-1α protein expression in 3D tumor spheroids. Therefore, 3D tumor spheroids were treated with 0.1 µM and 1.0 µM selinexor for 8 days. HIF-1α protein expression decreased dose-dependently in comparison to DMSO-treated control tumor spheroids (Figure 4B).
Discussion
The increased expression of nuclear transport receptors in cancer cells causes a deregulation in nucleo-cytoplasmic transport and has been linked to poor patient prognosis, cancer proliferation, tumor size and chemoresistance. For example, high expression of the import receptor importin-β promotes non-small cell lung cancer proliferation and chemoresistance.39 Moreover, high XPO1 expression associates with poor patient outcome in various cancers such as acute myeloid leukemia and ovarian cancer.15,20 Such data suggest that the targeted mislocalization of proteins may be a global, but promising strategy in cancer therapy. Progress in the development of drugs altering transport processes has been made.40 Accordingly, in July 2019, the first and only nuclear export inhibitor has been approved by the FDA. The accelerated FDA approval of Selinexor (XPOVIOTM) is based on a 25.3% response rate seen in the Phase 2b Selinexor Treatment of Refractory Myeloma (STORM) trial (NCT02336815). In combination with dexamethasone, Selinexor (XPOVIOTM) is now commercially available in the US for the treatment of adult patients with multiple myeloma whose disease is refractory to proteasome inhibitors, immunomodulatory agents, and an anti-CD38 monoclonal antibody.
Our results indicate the importance of active nuclear transport in the regulation of hypoxia-related pathways. Many XPO1 cargo proteins have been described so far including HIF-1α and HIF-2α.41,42 However, continuous active transport might be less important for the maintenance of nuclear and cytoplasmic proteome than expected, given that in frog oocytes only ~3% of the proteome responds significantly to XPO1 inhibition.43 Thus, our findings clearly indicate that HIF-dependent signaling belongs to a small group of signaling pathways that depend on continuous nuclear protein import and export.
Different studies underline that appropriate subcellular localization of the proteins involved in the hypoxia-related pathways is crucial for the regulation of HIF-dependent transcription. Localization studies revealed that the major proteins involved in hypoxia-related pathways show distinct intracellular localization patterns. HIF-α can be detected in the nucleus in hypoxia and nuclear import depends on classical NLS sequence motifs involving several importins.44,45 HIF-1β is permanently located in the nucleus. Furthermore, PHD1 is located almost exclusively in the nucleus, the vast majority of PHD2 is restricted to the cytoplasm and PHD3 can be detected in both compartments.46,47 However, HIF-1α as well as the three PHD isoforms shuttle between nucleus and cytoplasm and belong to the cargo proteins of exportin XPO1. Herein, we inhibited XPO1-dependent nuclear protein export by the SINE compound selinexor. We further investigated the effect of XPO1-inhibition on the HIF-dependent hypoxia response pathway. We show, that HIF-1α protein expression, HIF-transcriptional activity as well as HIF-dependent target gene expression is inhibited by selinexor treatment. Since HIF is a transcription factor, one could expect that inhibition of nuclear HIF export results in amplified activation of the HIF pathway. However, previous studies underlined the importance of the tightly regulated nuclear transport of the oxygen sensor proteins and the dependence of HIF-1α hydroxylation and ubiquitination on the nuclear translocation. Wotzlaw et al presented data obtained from FRET measurements demonstrating that PHD1 and HIF-1α exclusively interact in the nucleus.48 Activity of PHD2, the key regulator of HIF-1α stability, depends on the intranuclear localization and thus the subcellular microenvironment of the nucleus.47 Moreover, Groulx and Lee detected ubiquitinated forms of HIF-α, as well as VHL/ubiquitinated HIF-α complexes, solely in the nuclear compartment.49 These findings are in line with our data and contribute to a model in which nuclear accumulation of HIF-1α and the PHDs caused by XPO1-inhibition results in higher PHD hydroxylation activity and increased rates of ubiquitination and degradation of HIF-1α in the nucleus.
Recently, Foxler et al detected a so far unknown role of the scaffold protein LIMD1 in the regulation of the HIF-pathway. LIMD1 simultaneously binds the PHDs and VHL and enables efficient degradation of HIF-1α.50 Moreover, LIMD1 itself could be identified as a HIF-1 target gene mediating a negative regulatory feedback mechanism for hypoxic HIF-1α degradation.36 Since LIMD1 is an XPO1 cargo substrate that accumulates in the nucleus upon LMB treatment and shuttles between both compartments, nuclear export inhibition could result in nuclear accumulation of LIMD1 and increased activity of the HIF-LIMD1 negative feedback mechanism.51 Therefore, the effect of selinexor treatment on LIMD1 mRNA was investigated. As expected, LIMD1 accumulates in the nucleus after treatment with selinexor (data not shown). However, our data show that LIMD1 mRNA was not affected by treatment with 0.1 µM or 1.0 µM selinexor. Thus, we can hypothesize that selinexor inhibits HIF activity in a mechanism that is independent of PHD2-LIMD1-VHL complex formation.
The important contributions of the HIF-pathway in key cellular processes elucidate its crucial role in the pathophysiology of cardiovascular disease, chronic lung disease and cancer, which represent the major causes of mortality among industrialized societies. Strikingly, the expression patterns, as well as the subcellular localization of HIF and the PHDs, have been linked with tumorigenesis. HIF-1 is activated in cancer cells as a result of intratumoral hypoxia or genetic alterations and increased nuclear HIF-1 expression promotes tumor progression, increases radioresistance of cancer cells and correlates with increased malignancy.52 Moreover, nuclear localization of the PHD isoforms correlates with less differentiating and strongly proliferating tumors and predicts radiation resistance.53,54 Based on these findings, the targeted mislocalization of HIF and the PHDs seems to represent a promising strategy to modulate hypoxia-dependent signaling in cancer cells. Therefore, we investigated the potential of selinexor for the development of new anticancer strategies in cancer cells grown as 3D tumor spheroids. 3D culture models are regarded as more authentic realistic and representative models that recapitulate human solid tumor architecture and physiology more accurately than immortalized cancer cells in 2D monolayer cell cultures. 3D tumor spheroids possess features that mimic in vivo growth conditions of tumors such as cell–cell interaction, drug penetration, treatment response and, most important for investigating the HIF-signaling pathway, hypoxia.55–61 Therefore, MCF-7 tumor spheroids were grown on PDMS coated cell culture plates for 4 or 8 days until they were treated with selinexor for 4 or 8 more days. Treatment with 1.0 µM selinexor significantly damaged membrane integrity of 3D tumor spheroids and reduced intracellular ATP levels (Figure 3). In comparison, MTT assays in 2D-cultured monolayer cells showed that selinexor treatment at concentrations of up to 2.0 μm did not decrease cell viability by more than 10–25% compared to DMSO-treated control cells (Figure 1). Moreover, 3D tumor spheroid growth and morphology were sensitive to selinexor treatment at concentrations of 0.1 µM and 1.0 µM in our study. Spheroid morphology was dramatically changed by selinexor treatment. The 3D tumor spheroids changed from round and spherical to irregular formed small spheroids and single-cell morphology (Figure 4). In accordance with these findings, HIF-1α protein expression was affected by selinexor treatment in 3D tumor spheroids at the same concentrations. As expected, strong HIF-1α protein levels were detected in DMSO-treated 3D tumor spheroids which can be explained by the development of a hypoxic core region in the spheroids. Treatment with selinexor resulted in disintegration of 3D tumor spheroids which was reflected by a decrease in HIF-1α protein expression. Taken together, these results indicate that 3D tumor spheroids are more sensitive towards selinexor treatment than cells cultured in 2D monolayers. This observation underlines the therapeutic benefit of nuclear transport inhibition and can be explained by increased proliferative and metabolic demands of 3D tumor spheroids and an increased dependence on the nuclear transport machinery. Interestingly, Kuusisto and Jans identified a so-called hypersensitivity of malignant cell types towards the inhibition of the nuclear import receptor importin β.62 Moreover, as mentioned earlier, the overexpression of nuclear transport receptors in cancer cells indicates an increased dependence of cancer cells on specific proteins which is referred to as tumor cell addiction.63 In consequence, 3D tumor spheroids show great potential for studying the HIF-dependent hypoxic response and should be considered in future research.
Conclusion
In conclusion, our results demonstrate the significant impact of the nuclear transport machinery for the regulation of the hypoxic response in cancer cells. Nuclear export inhibition results in decreased transcriptional HIF-activity and disaggregation of 3D tumor spheroids. By this, our study underlines the promising potential of nuclear transport inhibition by selinexor for therapeutic intervention in cancer.
Abbreviations
ARNT, aryl hydrocarbon nuclear translocator; DMOG, dimethyloxalylglycine; DMSO, dimethylsulfoxide; HIF, hypoxia-inducible factor; IVM, ivermectin; LMB, leptomycin B; LIMD1, LIM domain-containing protein 1; NES, nuclear export signal; NLS, nuclear localization signal; PHD, prolyl hydroxylase domain protein; PMDS, polydimethylsiloxane; RPL28, ribosomal protein L28; SLC2A1, solute carrier family 2 member 1; XPO1, Exportin 1.
Acknowledgments
We thank S. G. Schindler, B. Rudzewski, T. Svensson and P. Rouina for excellent technical work. The authors also thank J. Dunst and D. Rades for their support.
Disclosure
Yosef Landesman is an employee of Karyopharm Therapeutics and holds patents, equity and stocks and has received both major and minor remunerations from Karyopharm. The authors report no other conflicts of interest in this work.
References
1. Raices M, D’Angelo MA. Nuclear pore complexes and regulation of gene expression. Curr Opin Cell Biol. 2017;46:26–32. doi:10.1016/j.ceb.2016.12.006
2. Gorlich D, Kutay U. Transport between the cell nucleus and the cytoplasm. Annu Rev Cell Dev Biol. 1999;15:607–660. doi:10.1146/annurev.cellbio.15.1.607
3. Gorlich D, Pante N, Kutay U, Aebi U, Bischoff FR. Identification of different roles for RanGDP and RanGTP in nuclear protein import. Embo J. 1996;15:5584–5594.
4. Dong X, Biswas A, Suel KE, et al. Structural basis for leucine-rich nuclear export signal recognition by CRM1. Nature. 2009;458:1136–1141. doi:10.1038/nature07975
5. Fornerod M, Ohno M, Yoshida M, Mattaj IW. CRM1 is an export receptor for leucine-rich nuclear export signals. Cell. 1997;90:1051–1060. doi:10.1016/s0092-8674(00)80371-2
6. Cook A, Bono F, Jinek M, Conti E. Structural biology of nucleocytoplasmic transport. Annu Rev Biochem. 2007;76:647–671. doi:10.1146/annurev.biochem.76.052705.161529
7. Rodriguez JA, Henderson BR. Identification of a functional nuclear export sequence in BRCA1. J Biol Chem. 2000;275:38589–38596. doi:10.1074/jbc.M003851200
8. Stommel JM, Marchenko ND, Jimenez GS, Moll UM, Hope TJ, Wahl GM. A leucine-rich nuclear export signal in the p53 tetramerization domain: regulation of subcellular localization and p53 activity by NES masking. Embo J. 1999;18:1660–1672. doi:10.1093/emboj/18.6.1660
9. Benzeno S, Diehl JA. C-terminal sequences direct cyclin D1-CRM1 binding. J Biol Chem. 2004;279:56061–56066. doi:10.1074/jbc.M411910200
10. de LP L, Pepin A, Assaf-Vandecasteele H, et al. Glucocorticoid-induced leucine zipper (GILZ) promotes the nuclear exclusion of FOXO3 in a Crm1-dependent manner. J Biol Chem. 2010;285:5594–5605. doi:10.1074/jbc.M109.068346
11. Turner JG, Marchion DC, Dawson JL, et al. Human multiple myeloma cells are sensitized to topoisomerase II inhibitors by CRM1 inhibition. Cancer Res. 2009;69:6899–6905. doi:10.1158/0008-5472.CAN-09-0484
12. Engel R, Valkov NI, Gump JL, Hazlehurst L, Dalton WS, Sullivan DM. The cytoplasmic trafficking of DNA topoisomerase IIalpha correlates with etoposide resistance in human myeloma cells. Exp Cell Res. 2004;295:421–431. doi:10.1016/j.yexcr.2004.01.012
13. Lu W, Pochampally R, Chen L, Traidej M, Wang Y, Chen J. Nuclear exclusion of p53 in a subset of tumors requires MDM2 function. Oncogene. 2000;19:232–240. doi:10.1038/sj.onc.1203262
14. Benzeno S, Lu F, Guo M, et al. Identification of mutations that disrupt phosphorylation-dependent nuclear export of cyclin D1. Oncogene. 2006;25:6291–6303. doi:10.1038/sj.onc.1209644
15. Noske A, Weichert W, Niesporek S, et al. Expression of the nuclear export protein chromosomal region maintenance/exportin 1/Xpo1 is a prognostic factor in human ovarian cancer. Cancer. 2008;112:1733–1743. doi:10.1002/cncr.23354
16. Yao Y, Dong Y, Lin F, et al. The expression of CRM1 is associated with prognosis in human osteosarcoma. Oncol Rep. 2009;21:229–235.
17. Huang WY, Yue L, Qiu WS, Wang LW, Zhou XH, Sun YJ. Prognostic value of CRM1 in pancreas cancer. Clin Invest Med. 2009;32:E315.
18. van der Watt PJ, Maske CP, Hendricks DT, et al. The Karyopherin proteins, Crm1 and Karyopherin beta1, are overexpressed in cervical cancer and are critical for cancer cell survival and proliferation. Int J Cancer. 2009;124:1829–1840. doi:10.1002/ijc.24146
19. Zhou F, Qiu W, Yao R, et al. CRM1 is a novel independent prognostic factor for the poor prognosis of gastric carcinomas. Med Oncol. 2013;30:726.
20. Kojima K, Kornblau SM, Ruvolo V, et al. Prognostic impact and targeting of CRM1 in acute myeloid leukemia. Blood. 2013;121:4166–4174. doi:10.1182/blood-2012-08-447581
21. Schmidt J, Braggio E, Kortuem KM, et al. Genome-wide studies in multiple myeloma identify XPO1/CRM1 as a critical target validated using the selective nuclear export inhibitor KPT-276. Leukemia. 2013;27:2357–2365. doi:10.1038/leu.2013.172
22. Gouirand V, Guillaumond F, Vasseur S. Influence of the tumor microenvironment on cancer cells metabolic reprogramming. Front Oncol. 2018;8:117.
23. Wolff B, Sanglier JJ, Wang Y. Leptomycin B is an inhibitor of nuclear export: inhibition of nucleo-cytoplasmic translocation of the human immunodeficiency virus type 1 (HIV-1) Rev protein and Rev-dependent mRNA. Chem Biol. 1997;4:139–147.
24. Newlands ES, Rustin GJ, Brampton MH. Phase I trial of elactocin. Br J Cancer. 1996;74:648–649. doi:10.1038/bjc.1996.415
25. Parikh K, Cang S, Sekhri A, Liu D. Selective inhibitors of nuclear export (SINE)–a novel class of anti-cancer agents. J Hematol Oncol. 2014;7:78.
26. Senapedis WT, Baloglu E, Landesman Y. Clinical translation of nuclear export inhibitors in cancer. Semin Cancer Biol. 2014;27:74–86. doi:10.1016/j.semcancer.2014.04.005
27. Gandhi UH, Senapedis W, Baloglu E, et al. Clinical implications of targeting XPO1-mediated nuclear export in multiple myeloma. Clin Lymphoma Myeloma Leuk. 2018;18:335–345. doi:10.1016/j.clml.2018.03.003
28. Talati C, Sweet KL. Nuclear transport inhibition in acute myeloid leukemia: recent advances and future perspectives. Int J Hematol Oncol. 2018;7:IJH04.
29. Semenza GL. Hypoxia-inducible factors in physiology and medicine. Cell. 2012;148:399–408. doi:10.1016/j.cell.2012.01.021
30. Semenza GL. HIF-1 mediates metabolic responses to intratumoral hypoxia and oncogenic mutations. J Clin Invest. 2013;123:3664–3671. doi:10.1172/JCI67230
31. Bao Y, Wang Z, Liu B, et al. A feed-forward loop between nuclear translocation of CXCR4 and HIF-1alpha promotes renal cell carcinoma metastasis. Oncogene. 2019;38:881–895. doi:10.1038/s41388-018-0452-4
32. Mylonis I, Chachami G, Samiotaki M, et al. Identification of MAPK phosphorylation sites and their role in the localization and activity of hypoxia-inducible factor-1alpha. J Biol Chem. 2006;281:33095–33106. doi:10.1074/jbc.M605058200
33. Mylonis I, Chachami G, Paraskeva E, Simos G. Atypical CRM1-dependent nuclear export signal mediates regulation of hypoxia-inducible factor-1alpha by MAPK. J Biol Chem. 2008;283:27620–27627. doi:10.1074/jbc.M803081200
34. Ratcliffe PJ. Oxygen sensing and hypoxia signalling pathways in animals: the implications of physiology for cancer. J Physiol. 2013;591:2027–2042. doi:10.1113/jphysiol.2013.251470
35. Appelhoff RJ, Tian YM, Raval RR, et al. Differential function of the prolyl hydroxylases PHD1, PHD2, and PHD3 in the regulation of hypoxia-inducible factor. J Biol Chem. 2004;279:38458–38465. doi:10.1074/jbc.M406026200
36. Foxler DE, Bridge KS, Foster JG, et al. A HIF-LIMD1 negative feedback mechanism mitigates the pro-tumorigenic effects of hypoxia. EMBO Mol Med. 2018;10:e8304
37. Wanner RM, Spielmann P, Stroka DM, et al. Epolones induce erythropoietin expression via hypoxia-inducible factor-1 alpha activation. Blood. 2000;96:1558–1565.
38. Maxwell PH, Dachs GU, Gleadle JM, et al. Hypoxia-inducible factor-1 modulates gene expression in solid tumors and influences both angiogenesis and tumor growth. Proc Natl Acad Sci U S A. 1997;94:8104–8109. doi:10.1073/pnas.94.15.8104
39. Wang H, Wang D, Li C, Zhang X, Zhou X, Huang J. High Kpnbeta1 expression promotes non-small cell lung cancer proliferation and chemoresistance via the PI3-kinase/AKT pathway. Tissue Cell. 2018;51:39–48. doi:10.1016/j.tice.2018.02.003
40. Kosyna FK, Depping R. Controlling the gatekeeper: therapeutic targeting of nuclear transport. Cells. 2018;7:E221.
41. Guttler T, Gorlich D. Ran-dependent nuclear export mediators: a structural perspective. Embo J. 2011;30:3457–3474. doi:10.1038/emboj.2011.287
42. Steinhoff A, Pientka FK, Mockel S, et al. Cellular oxygen sensing: importins and exportins are mediators of intracellular localisation of prolyl-4-hydroxylases PHD1 and PHD2. Biochem Biophys Res Commun. 2009;387:705–711. doi:10.1016/j.bbrc.2009.07.090
43. Wuhr M, Guttler T, Peshkin L, et al. The nuclear proteome of a vertebrate. Curr Biol. 2015;25:2663–2671. doi:10.1016/j.cub.2015.08.047
44. Depping R, Steinhoff A, Schindler SG, et al. Nuclear translocation of hypoxia-inducible factors (HIFs): involvement of the classical importin alpha/beta pathway. Biochim Biophys Acta. 2008;1783:394–404. doi:10.1016/j.bbamcr.2007.12.006
45. Chachami G, Paraskeva E, Mingot JM, Braliou GG, Gorlich D, Simos G. Transport of hypoxia-inducible factor HIF-1alpha into the nucleus involves importins 4 and 7. Biochem Biophys Res Commun. 2009;390:235–240. doi:10.1016/j.bbrc.2009.09.093
46. Metzen E, Berchner-Pfannschmidt U, Stengel P, et al. Intracellular localisation of human HIF-1 alpha hydroxylases: implications for oxygen sensing. J Cell Sci. 2003;116:1319–1326. doi:10.1242/jcs.00318
47. Pientka FK, Hu J, Schindler SG, et al. Oxygen sensing by the prolyl-4-hydroxylase PHD2 within the nuclear compartment and the influence of compartmentalisation on HIF-1 signalling. J Cell Sci. 2012;125:5168–5176. doi:10.1242/jcs.109041
48. Wotzlaw C, Gneuss S, Konietzny R, Fandrey J. Nanoscopy of the cellular response to hypoxia by means of fluorescence resonance energy transfer (FRET) and new FRET software. PMC Biophys. 2010;3:5.
49. Groulx I, Lee S. Oxygen-dependent ubiquitination and degradation of hypoxia-inducible factor requires nuclear-cytoplasmic trafficking of the von Hippel-Lindau tumor suppressor protein. Mol Cell Biol. 2002;22:5319–5336. doi:10.1128/mcb.22.15.5319-5336.2002
50. Foxler DE, Bridge KS, James V, et al. The LIMD1 protein bridges an association between the prolyl hydroxylases and VHL to repress HIF-1 activity. Nat Cell Biol. 2012;14:201–208. doi:10.1038/ncb2424
51. Sharp TV, Munoz F, Bourboulia D, et al. LIM domains-containing protein 1 (LIMD1), a tumor suppressor encoded at chromosome 3p21.3, binds pRB and represses E2F-driven transcription. Proc Natl Acad Sci U S A. 2004;101:16531–16536. doi:10.1073/pnas.0407123101
52. Schito L, Semenza GL. Hypoxia-inducible factors: master regulators of cancer progression. Trends Cancer. 2016;2:758–770. doi:10.1016/j.trecan.2016.10.016
53. Jokilehto T, Rantanen K, Luukkaa M, et al. Overexpression and nuclear translocation of hypoxia-inducible factor prolyl hydroxylase PHD2 in head and neck squamous cell carcinoma is associated with tumor aggressiveness. Clin Cancer Res. 2006;12:1080–1087. doi:10.1158/1078-0432.CCR-05-2022
54. Luukkaa M, Jokilehto T, Kronqvist P, et al. Expression of the cellular oxygen sensor PHD2 (EGLN-1) predicts radiation sensitivity in squamous cell cancer of the head and neck. Int J Radiat Biol. 2009;85:900–908. doi:10.1080/09553000903074104
55. Froehlich K, Haeger JD, Heger J, et al. Generation of multicellular breast cancer tumor spheroids: comparison of different protocols. J Mammary Gland Biol Neoplasia. 2016;21:89–98. doi:10.1007/s10911-016-9359-2
56. Leong DT, Ng KW. Probing the relevance of 3D cancer models in nanomedicine research. Adv Drug Deliv Rev. 2014;79-80:95–106. doi:10.1016/j.addr.2014.06.007
57. Kang YP, Yoon JH, Long NP, et al. Spheroid-induced epithelial-mesenchymal transition provokes global alterations of breast cancer lipidome: a multi-layered omics analysis. Front Oncol. 2019;9:145.
58. Tevis KM, Colson YL, Grinstaff MW. Embedded spheroids as models of the cancer microenvironment. Adv Biosyst. 2017;1:1700083.
59. Wartenberg M, Ling FC, Muschen M, et al. Regulation of the multidrug resistance transporter P-glycoprotein in multicellular tumor spheroids by hypoxia-inducible factor (HIF-1) and reactive oxygen species. Faseb J. 2003;17:503–505. doi:10.1096/fj.02-0358fje
60. Zanoni M, Piccinini F, Arienti C, et al. 3D tumor spheroid models for in vitro therapeutic screening: a systematic approach to enhance the biological relevance of data obtained. Sci Rep. 2016;6:19103.
61. Kimlin LC, Casagrande G, Virador VM. In vitro three-dimensional (3D) models in cancer research: an update. Mol Carcinog. 2013;52:167–182. doi:10.1002/mc.21844
62. Kuusisto HV, Jans DA. Hyper-dependence of breast cancer cell types on the nuclear transporter Importin beta1. Biochim Biophys Acta. 2015;1853:1870–1878. doi:10.1016/j.bbamcr.2015.05.002
63. van der Watt PJ, Chi A, Stelma T, et al. Targeting the nuclear import receptor Kpnbeta1 as an anticancer therapeutic. Mol Cancer Ther. 2016;15:560–573. doi:10.1158/1535-7163.MCT-15-0052
 © 2019 The Author(s). This work is published and licensed by Dove Medical Press Limited. The full terms of this license are available at https://www.dovepress.com/terms.php and incorporate the Creative Commons Attribution - Non Commercial (unported, v3.0) License.
By accessing the work you hereby accept the Terms. Non-commercial uses of the work are permitted without any further permission from Dove Medical Press Limited, provided the work is properly attributed. For permission for commercial use of this work, please see paragraphs 4.2 and 5 of our Terms.
© 2019 The Author(s). This work is published and licensed by Dove Medical Press Limited. The full terms of this license are available at https://www.dovepress.com/terms.php and incorporate the Creative Commons Attribution - Non Commercial (unported, v3.0) License.
By accessing the work you hereby accept the Terms. Non-commercial uses of the work are permitted without any further permission from Dove Medical Press Limited, provided the work is properly attributed. For permission for commercial use of this work, please see paragraphs 4.2 and 5 of our Terms.