")
Back to Journals » Cancer Management and Research » Volume 11
The novel sugar transporter SLC50A1 as a potential serum-based diagnostic and prognostic biomarker for breast cancer
Authors Wang Y, Shu Y, Gu C, Fan Y
Received 12 October 2018
Accepted for publication 17 December 2018
Published 17 January 2019 Volume 2019:11 Pages 865—876
DOI https://doi.org/10.2147/CMAR.S190591
Checked for plagiarism Yes
Review by Single anonymous peer review
Peer reviewer comments 3
Editor who approved publication: Dr Kenan Onel
Yu Wang,1 Yao Shu,2 Congyang Gu,3 Yu Fan4
1Department of Health Examination, The Affiliated Hospital of Southwest Medical University, Luzhou, Sichuan Province, China; 2Department of Geriatrics, The Affiliated Hospital of Southwest Medical University, Luzhou, Sichuan Province, China; 3Department of Pathology, The First People’s Hospital of Neijiang City, Neijiang, Sichuan Province, China; 4Department of Oncology, The Affiliated Hospital of Southwest Medical University, Luzhou, Sichuan Province, China
Background: The novel sugar transporter and membrane protein SLC50A1 has been identified as a potential candidate biomarker for breast cancer; however, its potential as a serum biomarker for breast cancer detection and prognosis is unclear. The aim of this study was to investigate the serum expression profile of SLC50A1 and to determine its diagnostic and prognostic significance in breast cancer.
Materials and methods: Bioinformatics analysis was conducted, and data for SLC50A1 expression in human breast cancer were collected. Semi-quantitative real-time PCR and ELISA were performed to compare SLC50A1 expression in several breast cancer cell lines, one paired tissue cohort (n=20) and two independent cohorts of human breast cancer patients (n=85) and healthy individuals (n=30). The results were analyzed statistically, and associations between clinicopathological and survival data were evaluated by multivariate Cox regression analysis.
Results: SLC50A1 was confirmed as a candidate breast cancer gene by bioinformatics analysis. SLC50A1 mRNA expression levels were significantly upregulated in breast cancer (P<0.001). Serum SLC50A1 levels were able to discriminate between women with breast cancer and healthy women with a sensitivity of 75.3% and a specificity of 100.0% (P<0.001; area under the curve=0.915). Interestingly, SLC50A1 protein expression was associated with estrogen receptor (P=0.016) and HER2 status (P=0.037). Furthermore, SLC50A1 levels were positively related to unfavorable 3-year outcomes in patients with high-grade breast cancer (HR =1.823, P=0.01), indicating its potential use as an independent prognostic factor.
Conclusion: SLC50A1 can be used as a serum-based diagnostic and prognostic biomarker in breast cancer. However, further studies are needed to clarify its potential role as a therapeutic target.
Keywords: breast cancer, SLC50A1, biomarker, serum, prognosis
Introduction
Breast cancer is one of the most common malignancies in women in China and the leading cause of mortality in western countries.1,2 Although biomarkers may provide an effective tool for diagnostic screening and therapeutic targeting in breast cancer, few biomarkers have yet been validated for clinical application.3 The limitations of mammography, ultrasound, and magnetic resonance imaging indicate the need for additional, minimally invasive tests.4 Measurement of serum biomarkers constitutes a promising tool for detecting and monitoring breast cancer. However, mucin 1 and carcinoembryonic antigen levels are currently the only circulating biomarkers recommended as supplementary tests for monitoring patients with metastatic breast cancer.3 New serum biomarkers for screening and predicting prognosis are therefore needed to improve the treatment of patients with breast cancer.
Sugars are the main source of energy and cells employ numerous transporter proteins to introduce sugars through the plasma membrane. Cancer cells display enhanced sugar uptake and consumption, and sugar transporters have been shown to be deregulated in cancer cells, leading to increased sugar accumulation.5 Three classes of eukaryotic sugar transporters have been characterized to date, including glucose transporters (GLUTs), sodium–glucose symporters (SGLTs), and a new class of sugar transporters (SWEETs). For example, overexpression of GLUT1 was identified as a prognostic indicator for cancer,6 while GLUT3 has been shown to activate oncogenic signaling pathways, including EGFR, MEK, and AKT, leading to loss of tissue polarity and increased growth in non-malignant breast cells.7 Understanding sugar transport also has important therapeutic implications, such as in limiting access of cancer cells to sugars.8
The new SWEET class of glucose uniporters, SLC50, is represented by a single member in the human genome, SLC50A1 (RAG1AP1).9 Analysis of a data set including 730 breast cancer and 82 adjacent normal samples identified new biomarker candidates for breast cancer development (PTF1A, RABIF, RAG1AP1, TIMM17A, and LOC148145) and progression (SERPINE3 and ZNF706).10 However, the value of serum SLC50A1 for predicting the diagnosis and prognosis of breast cancer is unclear. In this study, we measured serum SLC50A1 levels in patients with breast cancer and normal controls by ELISA and speculated that serum SLC50A1 might be a useful diagnostic and prognostic biomarker in breast cancer patients.
Materials and methods
Cell lines and clinical specimens
Breast cancer cell lines (BT-549, MDA-MB-231, MDA-MB-468, MCF7, T-47D, and SK-BR-3) were obtained from American Type Culture Collection (The Global Bioresource Center, ATCC, Manassas, VA, USA) and were maintained as described previously.11 Twenty paired breast cancer and normal adjacent tissues were obtained from patients who underwent surgery at the Department of Breast Surgery, the Affiliated Hospital of Southwest Medical University. All participants provided written informed consent, and the study was approved by the ethics committee of the Affiliated Hospital of Southwest Medical University (approval no KY2014-037) and was conducted in accordance with the principles of the Declaration of Helsinki. After resection, the material was immediately snap-frozen in liquid nitrogen. The patients’ characteristics are shown in Table S1.
Serum samples
Serum samples from breast cancer patients (n=85) and cancer-free healthy individuals (n=30) were obtained from the Department of Breast Surgery and the Department of Health Management of the Affiliated Hospital of Southwest Medical University. All individuals gave written informed consent for the retention and analysis of the samples, and the study was approved by the ethics committees of the Affiliated Hospital of Southwest Medical University (approval no KY2014-037). Peripheral blood was drawn immediately after a definitive diagnosis and before receiving any treatment. The obtained blood samples (5 mL per patient) were centrifuged at 600× g for 5 minutes at room temperature, and the isolated serum (2–3 mL) was aliquoted (1–1.5 mL) and stored at –80°C until use. Clinicopathological variables in the breast cancer patients are summarized in Table S2.
Bioinformatics analysis
Because of the importance of cell membrane proteins as therapeutic targets, we screened for potential novel membrane proteins as breast cancer biomarkers using Oncomine (https://www.oncomine.org/)12 and Genecard (https://www.genecards.org/).13 Based on the GEO dataset (GSE7904 and GSE21422), SLC50A1 mRNA levels were confirmed to be increased in breast cancer compared with normal tissues. Furthermore, we analyzed the possible relationship between SLC50A1 and clinical parameters of breast cancer using the analytical tool, GOBO (http://co.bmc.lu.se/gobo/).14
RNA extraction and reverse transcription-PCR (RT-PCR)
Total RNA was isolated from cell lines and cryopreserved specimens (20–30 mm3 each) using the standard TRIzol (Thermo Fisher Scientific, Waltham, MA, USA) procedure for RNA extraction. Extracted RNA was quantified using a NanoDrop ND2000 spectrophotometer (Thermo Fisher Scientific). The 260/280 nm ratio was generally between 1.6 and 1.9. cDNA was subsequently synthesized using 1 µg of total RNA with a reverse transcription system (Promega Corporation, Fitchburg, WI, USA) and stored at –20°C until use. Semi-quantitative RT-PCR was performed using cell lines, as described previously.15 RT products were amplified using Go-Taq® (Promega Corporation), with 32 cycles for SLC50A1 and 23 cycles for glyceraldehyde 3-phosphate dehydrogenase (GAPDH).
Semi-quantitative real-time PCR
Semi-quantitative real-time PCR was carried out using clinical tissues, with SYBR® Green Master Mix (Thermo Fisher Scientific) and a 7500 Real-Time PCR System (Thermo Fisher Scientific), as described previously.16 Gene-specific primer sets for SLC50A1 and the reference β-actin gene were designed using the NCBI Primer-Blast Tool (https://www.ncbi.nlm.nih.gov/tools/primer-blast/). All reactions were performed in triplicate, including negative controls without cDNA. The specificity of the products was confirmed by determining their size on agarose gels and by melting curve analysis. The obtained data were analyzed using the comparative Ct (threshold cycle) method, and relative target gene expression was calculated by 2−ΔΔCt.17 Reaction conditions, primer sequences, and lengths of the products are listed in Table S3.
ELISA
Serum levels of SLC50A1 protein were assessed quantitatively using commercially available ELISA kits (Human SLC50A1 ELISA Kit; AndyGene Biotechnology Co., Ltd., Beijing, China), according to the manufacturer’s instructions. Final SLC50A1 serum concentrations were obtained based on the dilution of samples that corresponded to the linear portion of the standard curve. The locations of patient and control serum samples on the ELISA plate were randomized to eliminate plate bias.
Statistical analysis
Statistical analysis was carried out using SPSS 13.0 (SPSS Inc., Chicago, IL, USA) and GraphPad Prism 5.0 (GraphPad Software, Inc., La Jolla, CA, USA). Differences were considered significant if the two-sided P value was<0.05. Differences between two groups were compared using the non-parametric Mann–Whitney U-test, and clinicopathological parameters were correlated with SLC50A1 protein expression using Fisher’s exact test. Receiver operating characteristic (ROC) curves were calculated to evaluate the diagnostic performance of SLC50A1, and its prognostic value was analyzed by univariate Kaplan–Meier survival analysis. The independent prognostic value of SLC50A1 protein expression was determined by multivariate Cox regression analysis including only those prognostic factors that showed statistical significance in univariate tests. Data on prognostic significance are available from The Human Protein Atlas (https://www.proteinatlas.org/).18
Results
SLC50A1 mRNA expression was increased in breast cancer compared with adjacent normal tissues
Bioinformatics analysis identified SLC50A1 as a candidate gene encoding a potential therapeutic target and biomarker in breast cancer. We compared microarray data for mRNA expression in invasive breast cancer and normal tissues based on Oncomine and identified overexpressed candidate genes including RAG1AP1 (also known as SLC50A1) (Figure 1A and B). SLC50A1 was confirmed to be localized to the plasma membrane, Golgi apparatus, and nucleus, using Genecard (Figure 1C). mRNA expression levels of SLC50A1 were upregulated in breast cancer compared with normal controls, according to GEO dataset (GSE7904 and GSE21422) (P<0.001 and P=0.001, respectively) (Figure 2A and B). Furthermore, GOBO online analysis indicated that SLC50A1 expression was positively related to histological grade and estrogen receptor (ER) status (Figure 2C).
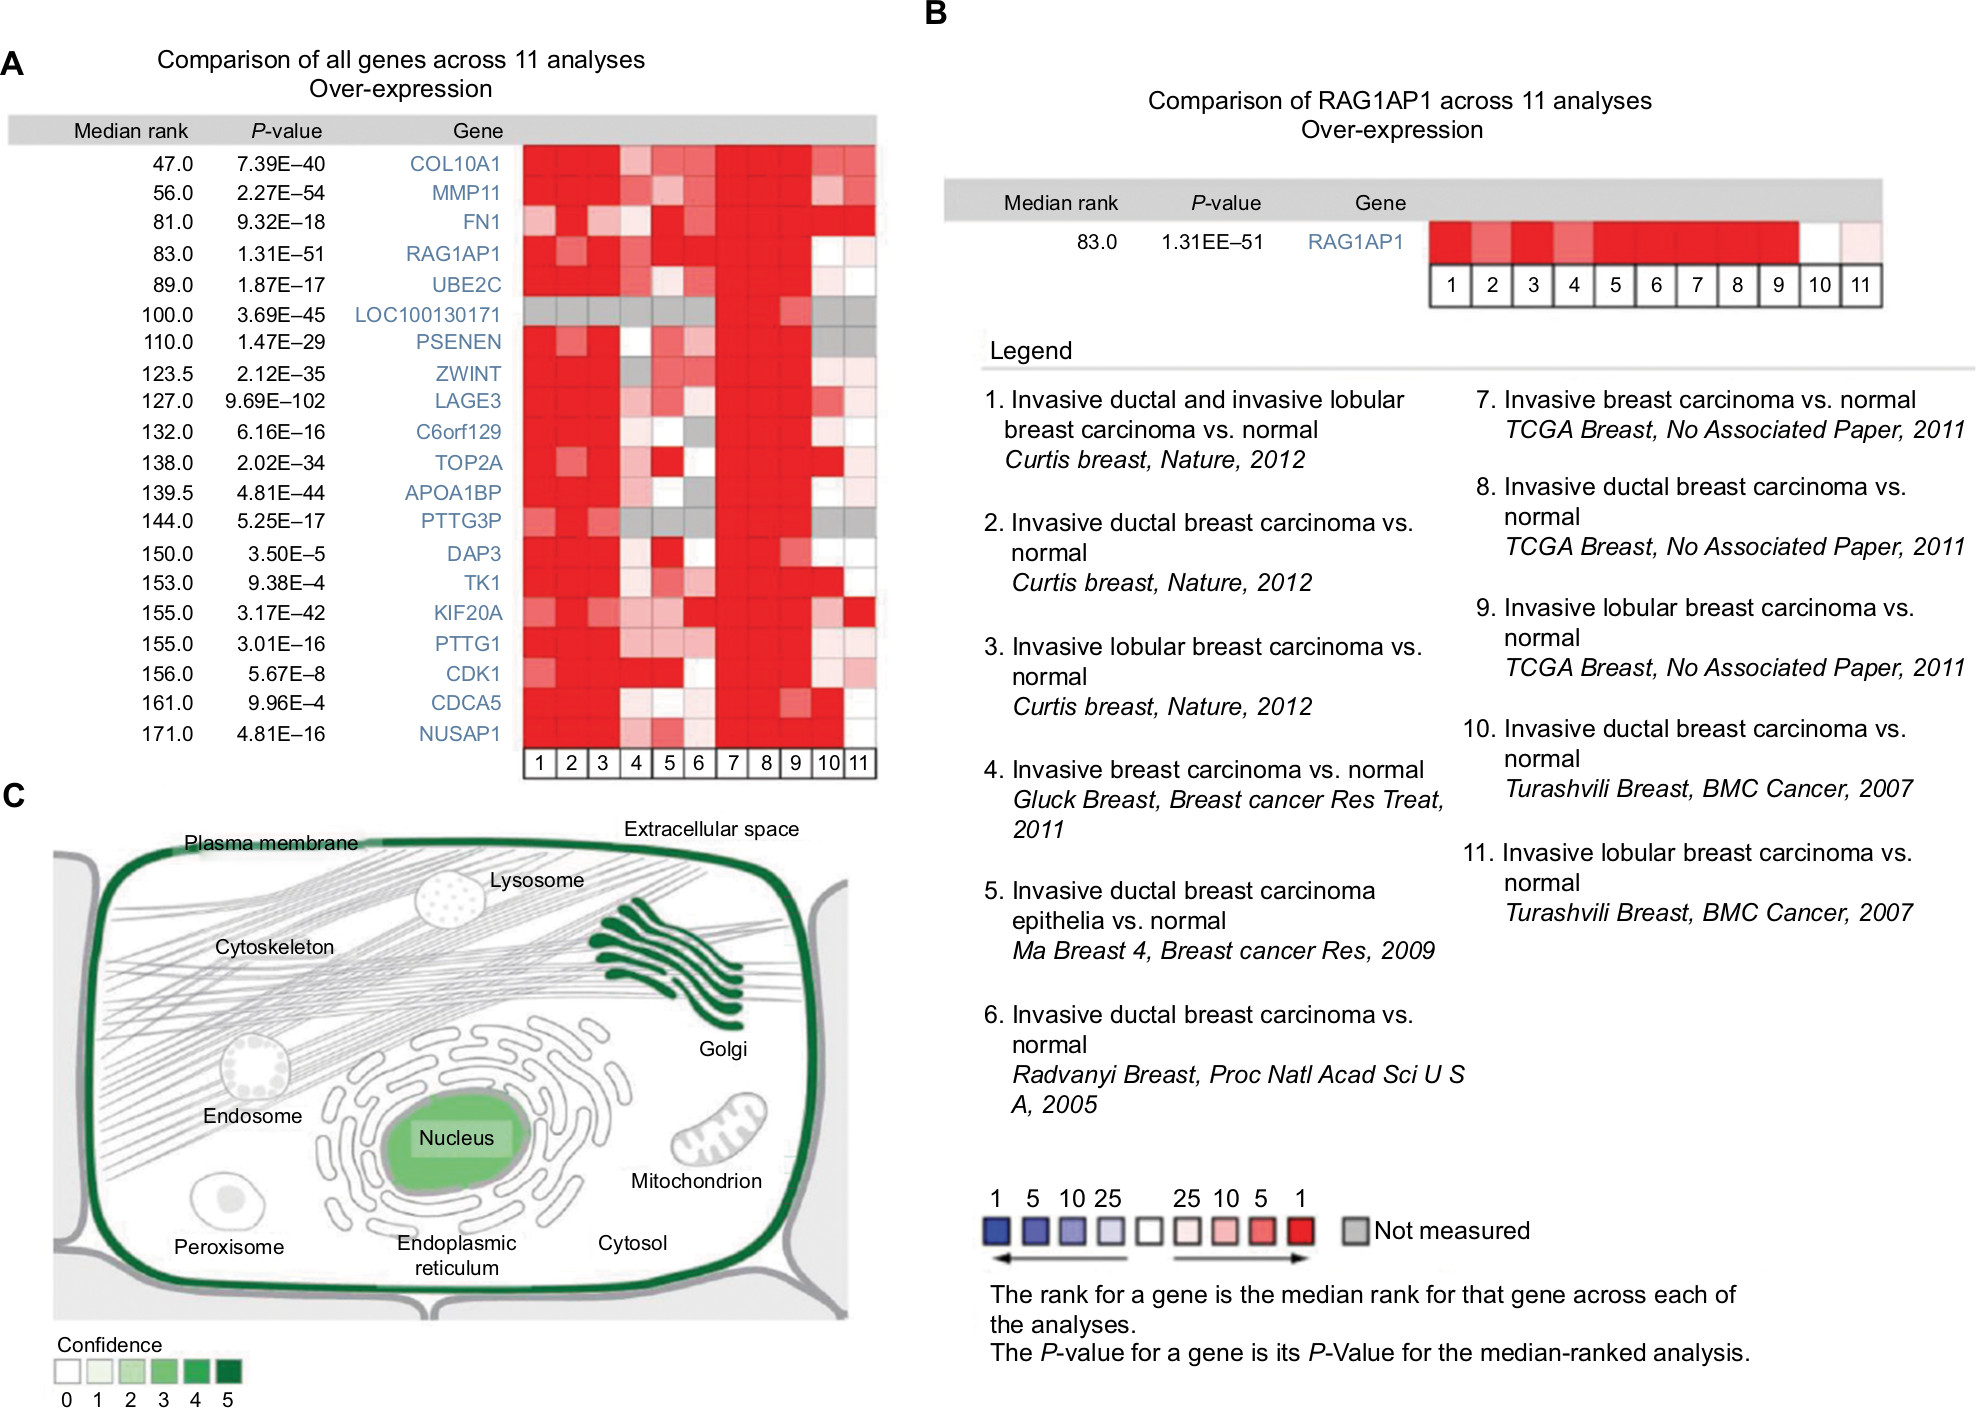 | Figure 1 Screening for SLC50A1 in breast cancer and its subcellular localization. Notes: (A) The RAG1AP1 (SLC50A1) was one of the candidates upregulated in invasive breast cancer microarray mRNA data by using Oncomine; (B) the mRNA expression of RAG1AP1 (SLC50A1) in eleven compared analyses. Legend: based on data from several articles and The Cancer Genome Atlas breast data; red: overexpression; blue: underexpression. (C) The predicted subcellular locations of SLC50A1 (Genecard). Confidence: 5-plasma membrane, 5-Golgi apparatus, and 3-nucleus. |
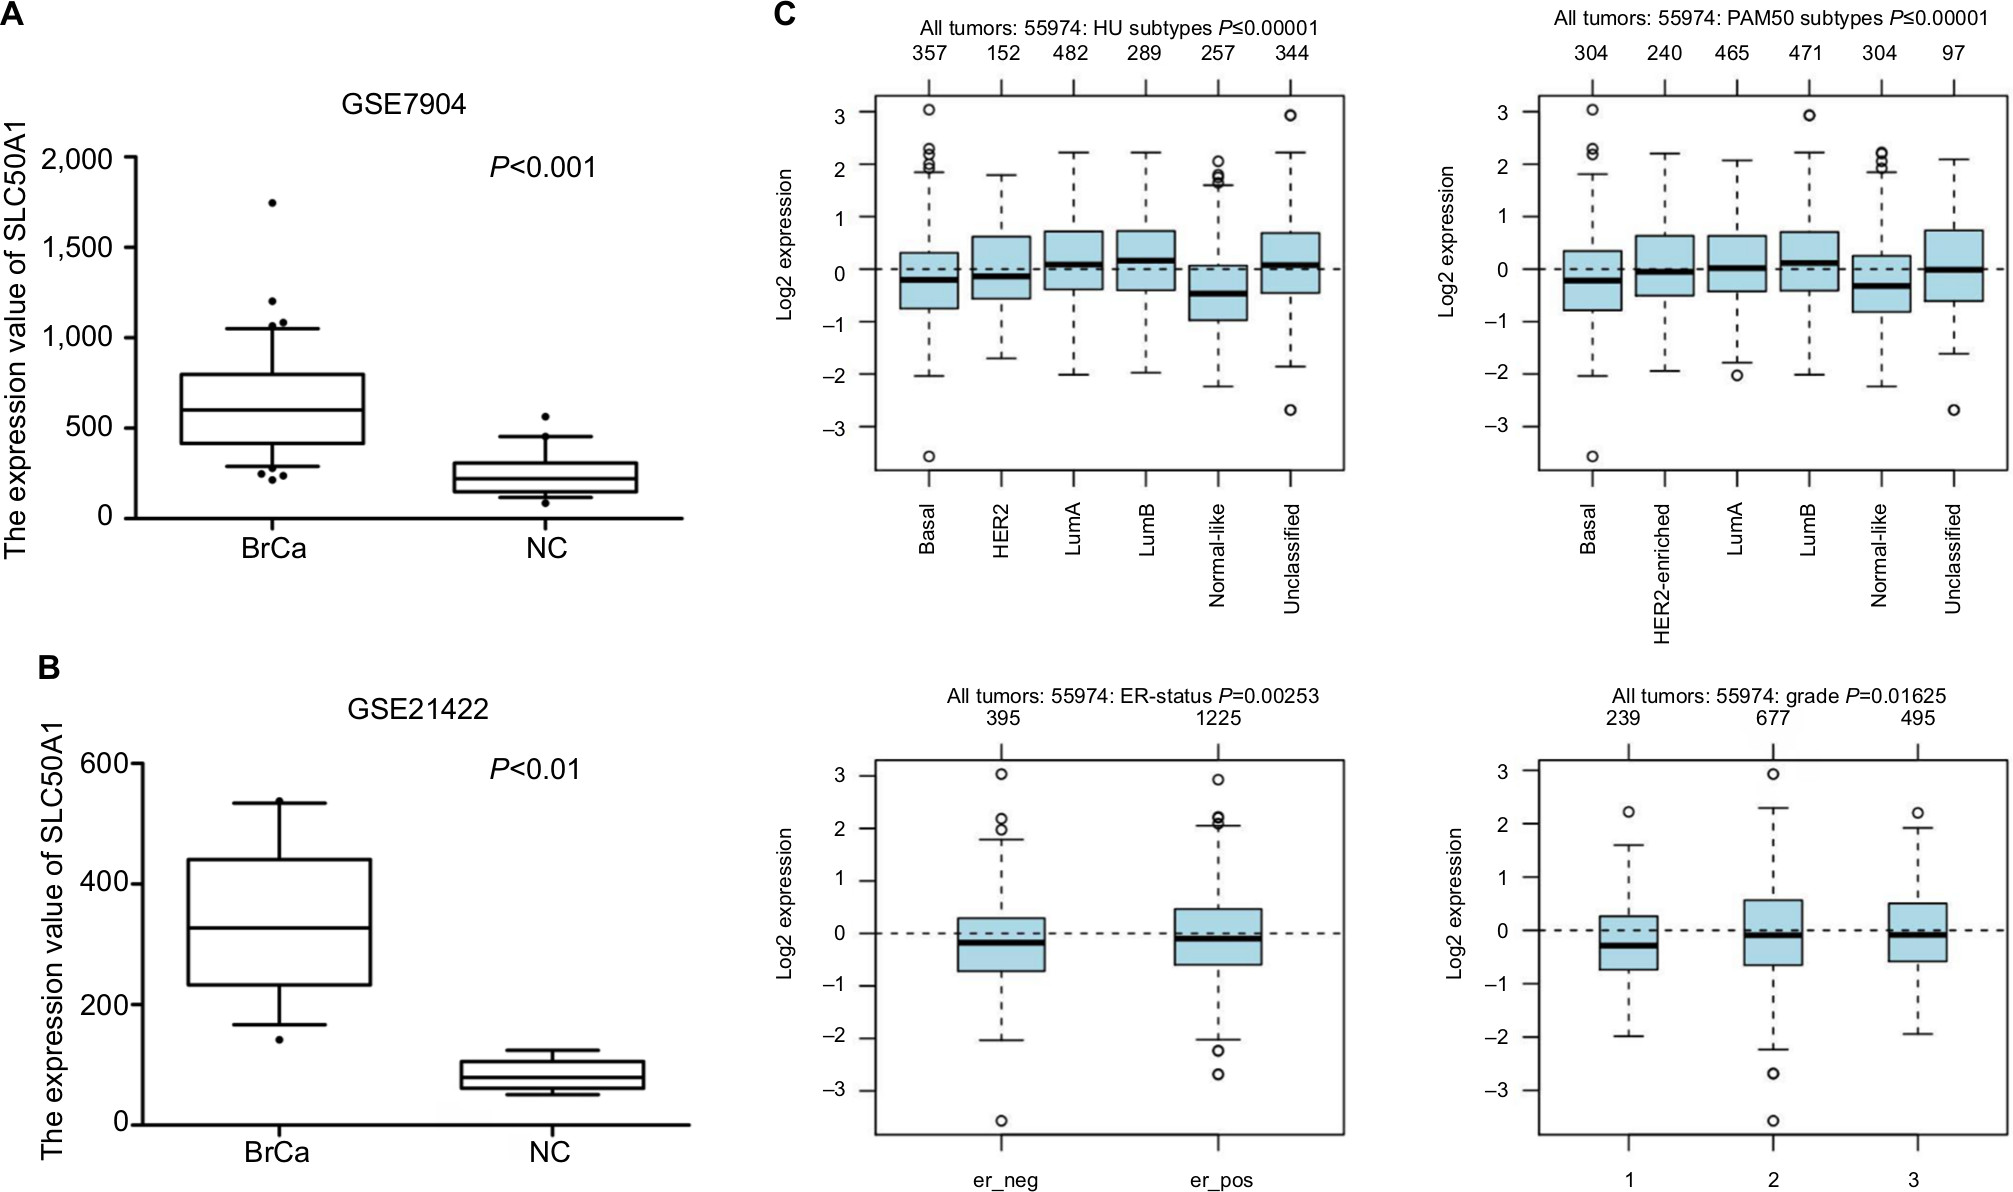 | Figure 2 Bioinformatics analysis for candidate SLC50A1 in breast cancer. Notes: (A) The expression of SLC50A1 mRNA was upregulated in breast cancer (n=43) compared with normal controls (n=19) (P<0.001) in GSE dataset (#GSE7904); (B) the upregulated SLC50A1 mRNA was seen in ductal carcinoma in situ and invasive ductal carcinoma (n=14) compared with healthy breast (n=5) (P=0.001, <0.01) in GSE dataset (#GSE21422). (C) The SLC50A1 was positively associated with histological grade (G1–G3) and estrogen receptor and was upregulated in all molecular subtypes of breast cancer (LumA, LumB, HER2-enriched, and Basal) compared with normal-like from an analysis of GOBO. Abbreviations: BrCa, breast cancer; NC, normal control. |
We initially assessed SLC50A1 expression by semi-quantitative real-time PCR analysis of 20 paired breast cancer and adjacent normal breast tissues. The cohort characteristics of the analyzed patients are shown in Table S1. We verified that SLC50A1 expression was increased in primary breast cancer samples compared with adjacent normal tissues (median fold change: 1.8) (non-parametric Wilcoxon signed rank test, P<0.001) (Figure 3A). There was no significant (P>0.05) difference in SLC50A1 mRNA expression levels according to tumors classified by subtype (“luminal”, “HER2-enriched”, or “triple-negative” breast cancer,19 molecular subtype, or other parameters, according to Fisher’s exact test; Table S4). Furthermore, detection of SLC50A1 mRNA expression in breast cancer cell lines by RT-PCR showed that SLC50A1 was expressed in several cell lines (Figure 3B).
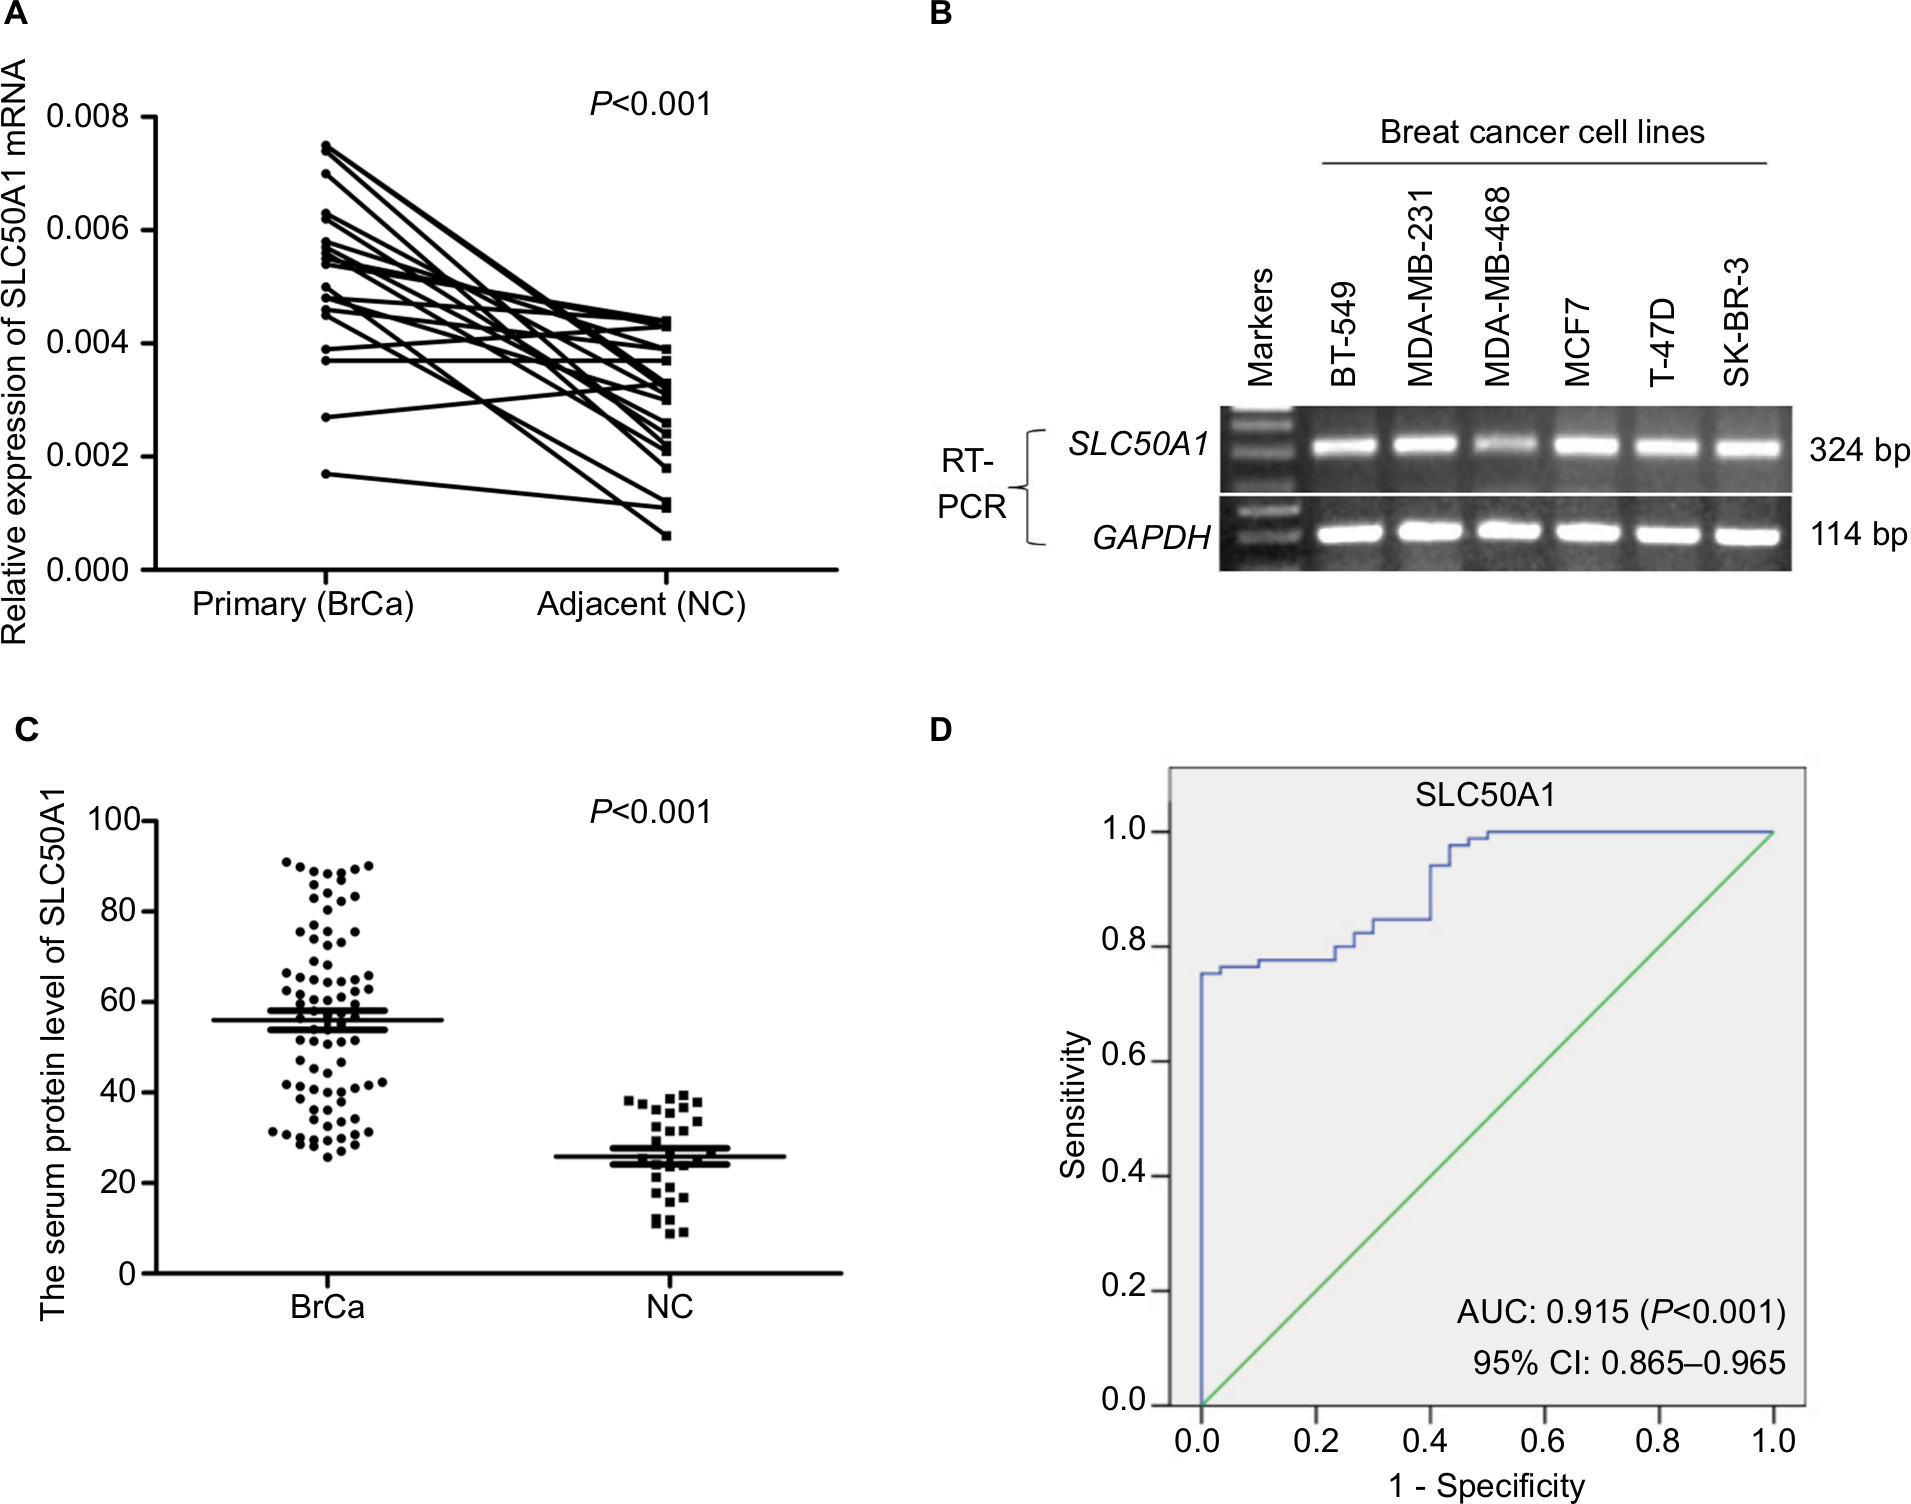 | Figure 3 Evaluation of the diagnostic role of biomarker SLC50A1 in breast cancer. Notes: (A) Increased SLC50A1 mRNA in primary breast cancer compared to adjacent normal tissues by semi-quantitative real-time PCR (n=20) (P<0.001). (B) The SLC50A1 mRNA was expressed in several breast cancer cell lines by RT-PCR. Internal reference: GAPDH. (C) Increased SLC50A1 serum protein level in breast cancer patients (n=85) compared with normal control from healthy donors (n=30) (P<0.001). (D) ROC curve analysis for SLC50A1. Abbreviations: AUC, area under the curve; BrCa, breast cancer; NC, normal control; ROC, receiver operating characteristic; RT-PCR, reverse transcription PCR. |
SLC50A1 may be a potential serum biomarker for breast cancer detection
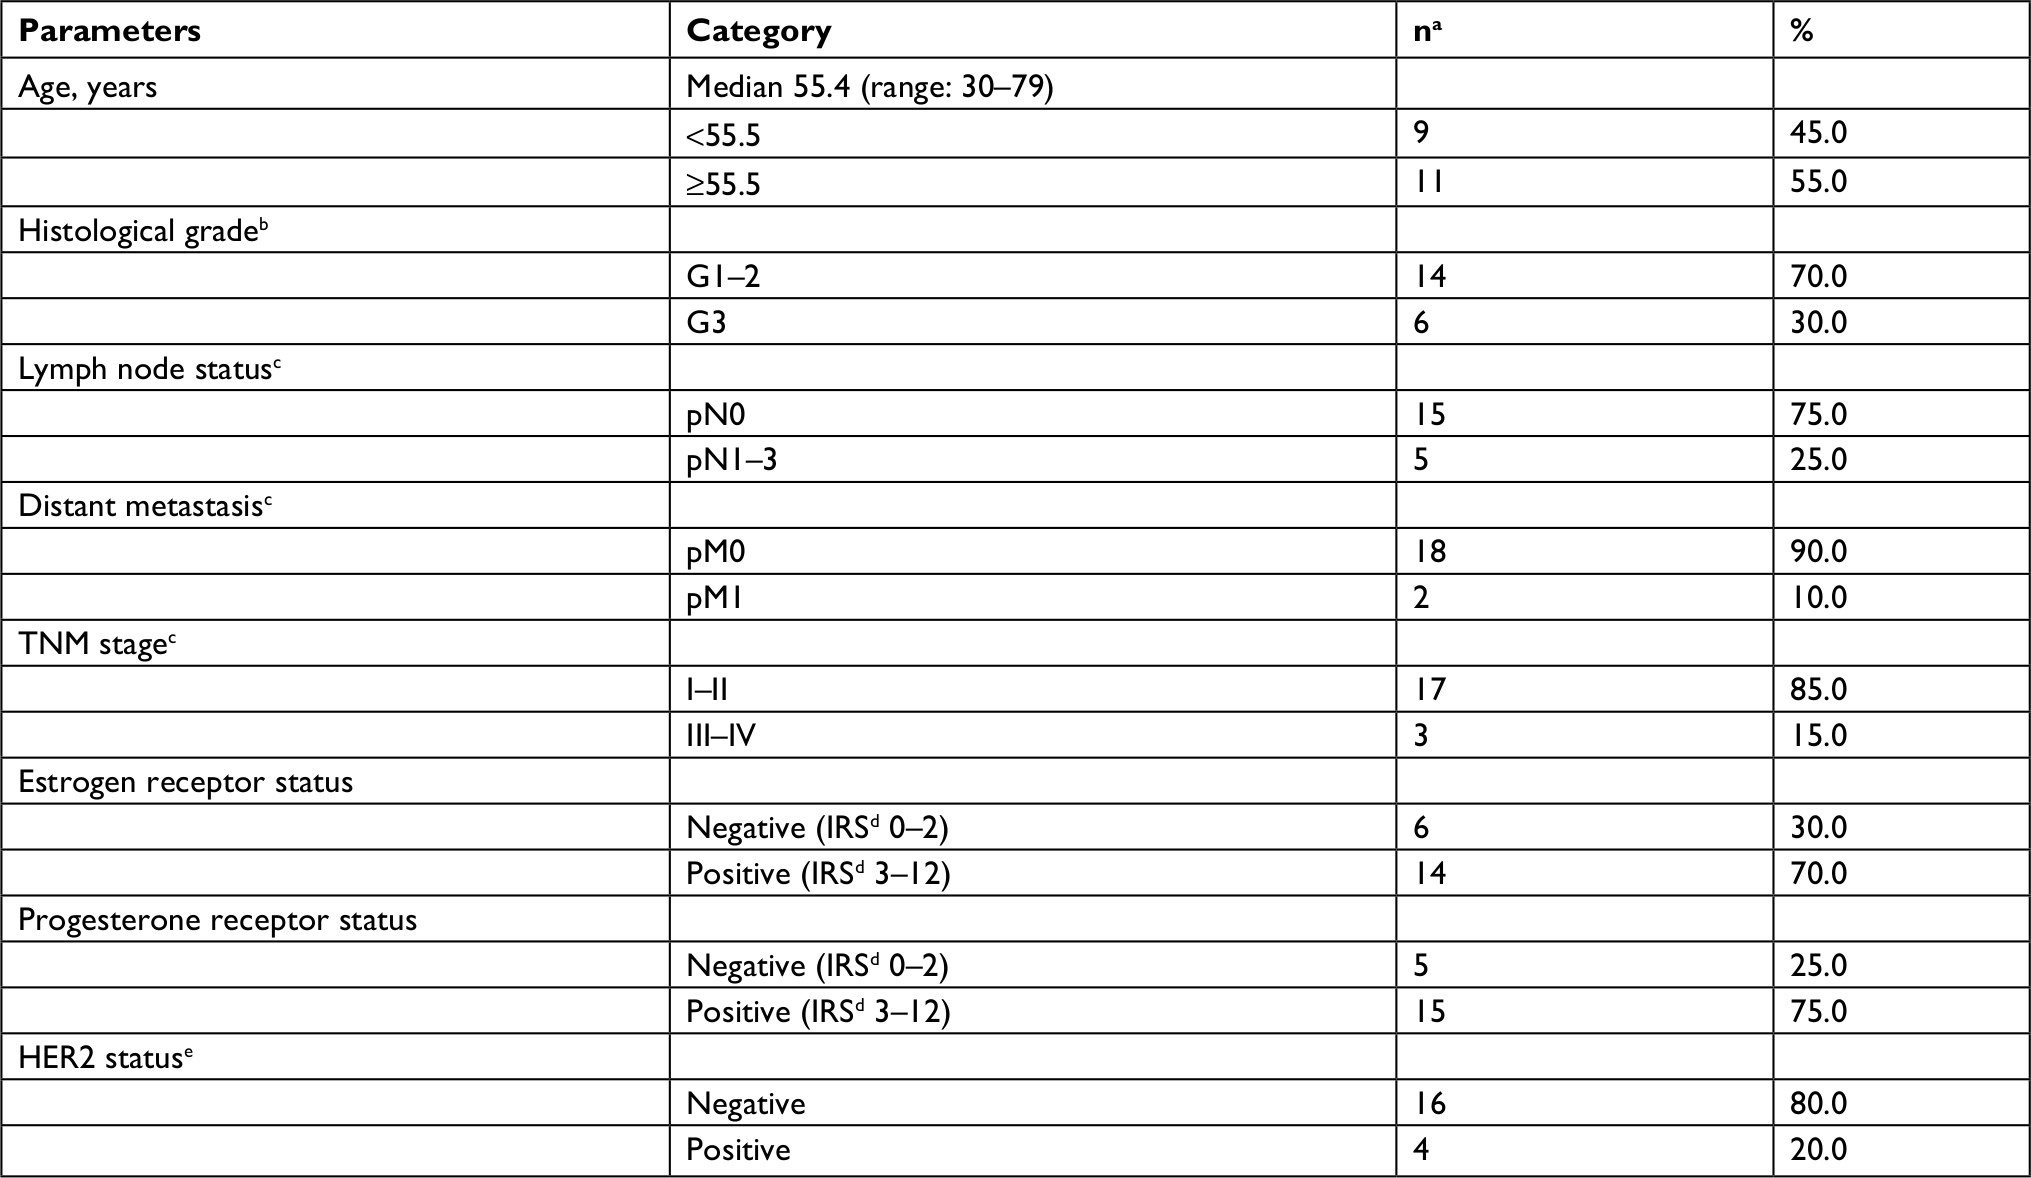
We determined serum SLC50A1 protein levels in an age-matched cohort of 85 breast cancer patients and 30 healthy individuals by ELISA. The patients’ characteristics are shown in Table S2. Serum SLC50A1 levels were significantly increased in breast cancer (median: 56.018 ng/mL) compared with control serum samples (median: 25.894 ng/mL) (P<0.001, median fold change: 2.2) (Figure 3C). ROC statistics were used to clarify the clinical performance of serum as a potential diagnostic biomarker for breast cancer. Serum SLC50A1 could discriminate between women with breast cancer and healthy women, with an optimal cutoff value of 39.679 ng/mL, a sensitivity of 75.3%, and a specificity of 100.0% (P<0.001; area under the curve: 0.915; 95% CI, 0.865–0.965) (Figure 3D). We further analyzed the associations between clinicopathological parameters and serum SLC50A1 levels using the Mann–Whitney U-test and demonstrated that ER and HER2 status were positively associated with serum SLC50A1 protein levels in serum (P=0.016 and 0.037, respectively) (Table 1).
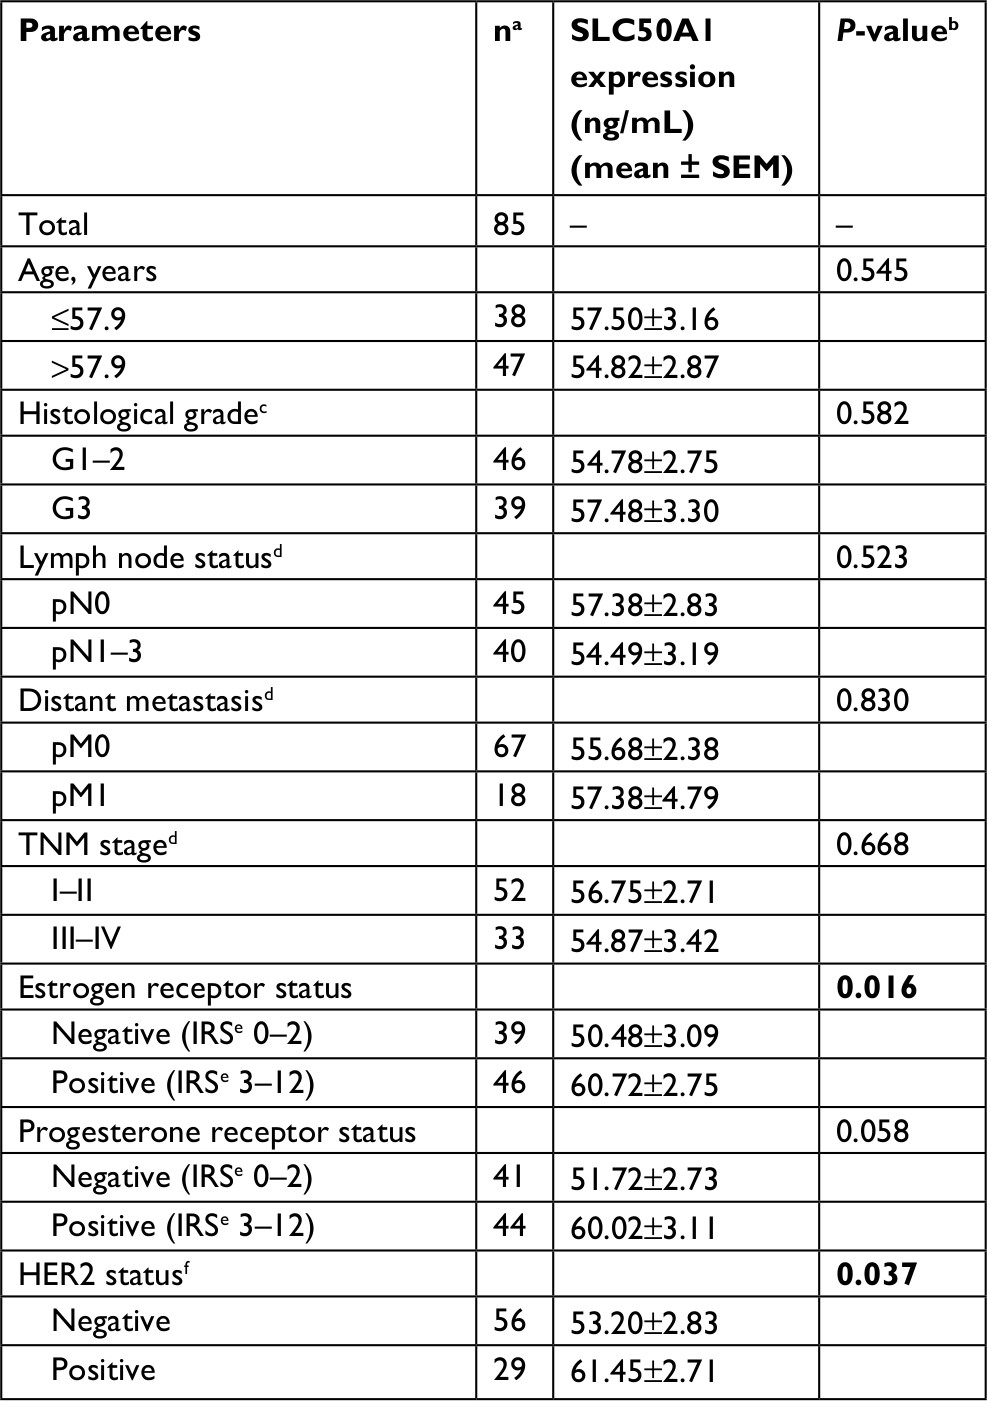 | Table 1 Clinicopathological parameters in relation to serum SLC50A1 protein expression in breast cancer patients Notes: aFemale patients with primary, unilateral breast cancer were included. bNon-parametric Mann–Whitney U-test. cAccording to Bloom and Richardson and modified by Elston and Ellis.27 dAccording to UICC TNM classification in breast cancer.28 eIRS according to Remmele and Stegner.29 fOverexpression of the ERBB2 gene (Her-2/neu) was diagnosed to the threshold of the DAKO score system based on the IHC assay. Uncertain cases were additionally validated by the FISH assay. Significant P-values are marked in bold face. Abbreviations: FISH, fluorescence in situ hybridization; IHC, immunohistochemistry; IRS, immunoreactive score. |
Serum SLC50A1 protein level predicted tumor-specific survival in breast cancer patients
Based on The Cancer Genome Atlas (TCGA) data and optimal cutoff value, the 5-year survival rate was significantly lower in breast cancer patients (n=220) with high expression of SLC50A1 mRNA compared with those with lower expression (n=855) (https://www.proteinatlas.org/) (Figure 4A). The prognostic impact of SLC50A1 in breast cancer has not yet been investigated. In view of the potential of serum SLC50A1 as a biomarker in breast cancer, we subsequently assessed if it was increased in serum samples from breast cancer patients with relatively short survival. We analyzed the impact of SLC50A1 protein expression on patient outcome in the 85 patients with available serum samples. There was no significant association (P=0.173) between SLC50A1 expression and 3-year tumor-specific survival (Figure 4B). After subgroup analysis, SLC50A1 was identified as a significant (P=0.004) prognostic factor in high-grade (G3) tumors (Figure 4C and Table 2) but not in low- (G1) or intermediate-grade (G2) cases (Figure 4D). Patients with high-grade tumors and high SLC50A1 serum protein levels had unfavorable outcomes (mean 3-year tumor-specific survival: 26.27 months ±1.94; 95% CI: 22.48–30.06) compared with patients with low SLC50A1 levels (mean 3-year tumor-specific survival: 33.88 months ±1.19; 95% CI: 31.55–36.22). We validated the relationship between SLC50A1 protein expression and patient survival by Cox’s multivariate analysis, including only those variables that were significant in univariate analysis (Table 3). The Cox regression model confirmed that SLC50A1 was a putative independent marker of unfavorable prognosis in patients with high-grade breast tumors (multivariate HR: 1.823, 95% CI: 1.559–24.567, P=0.01).
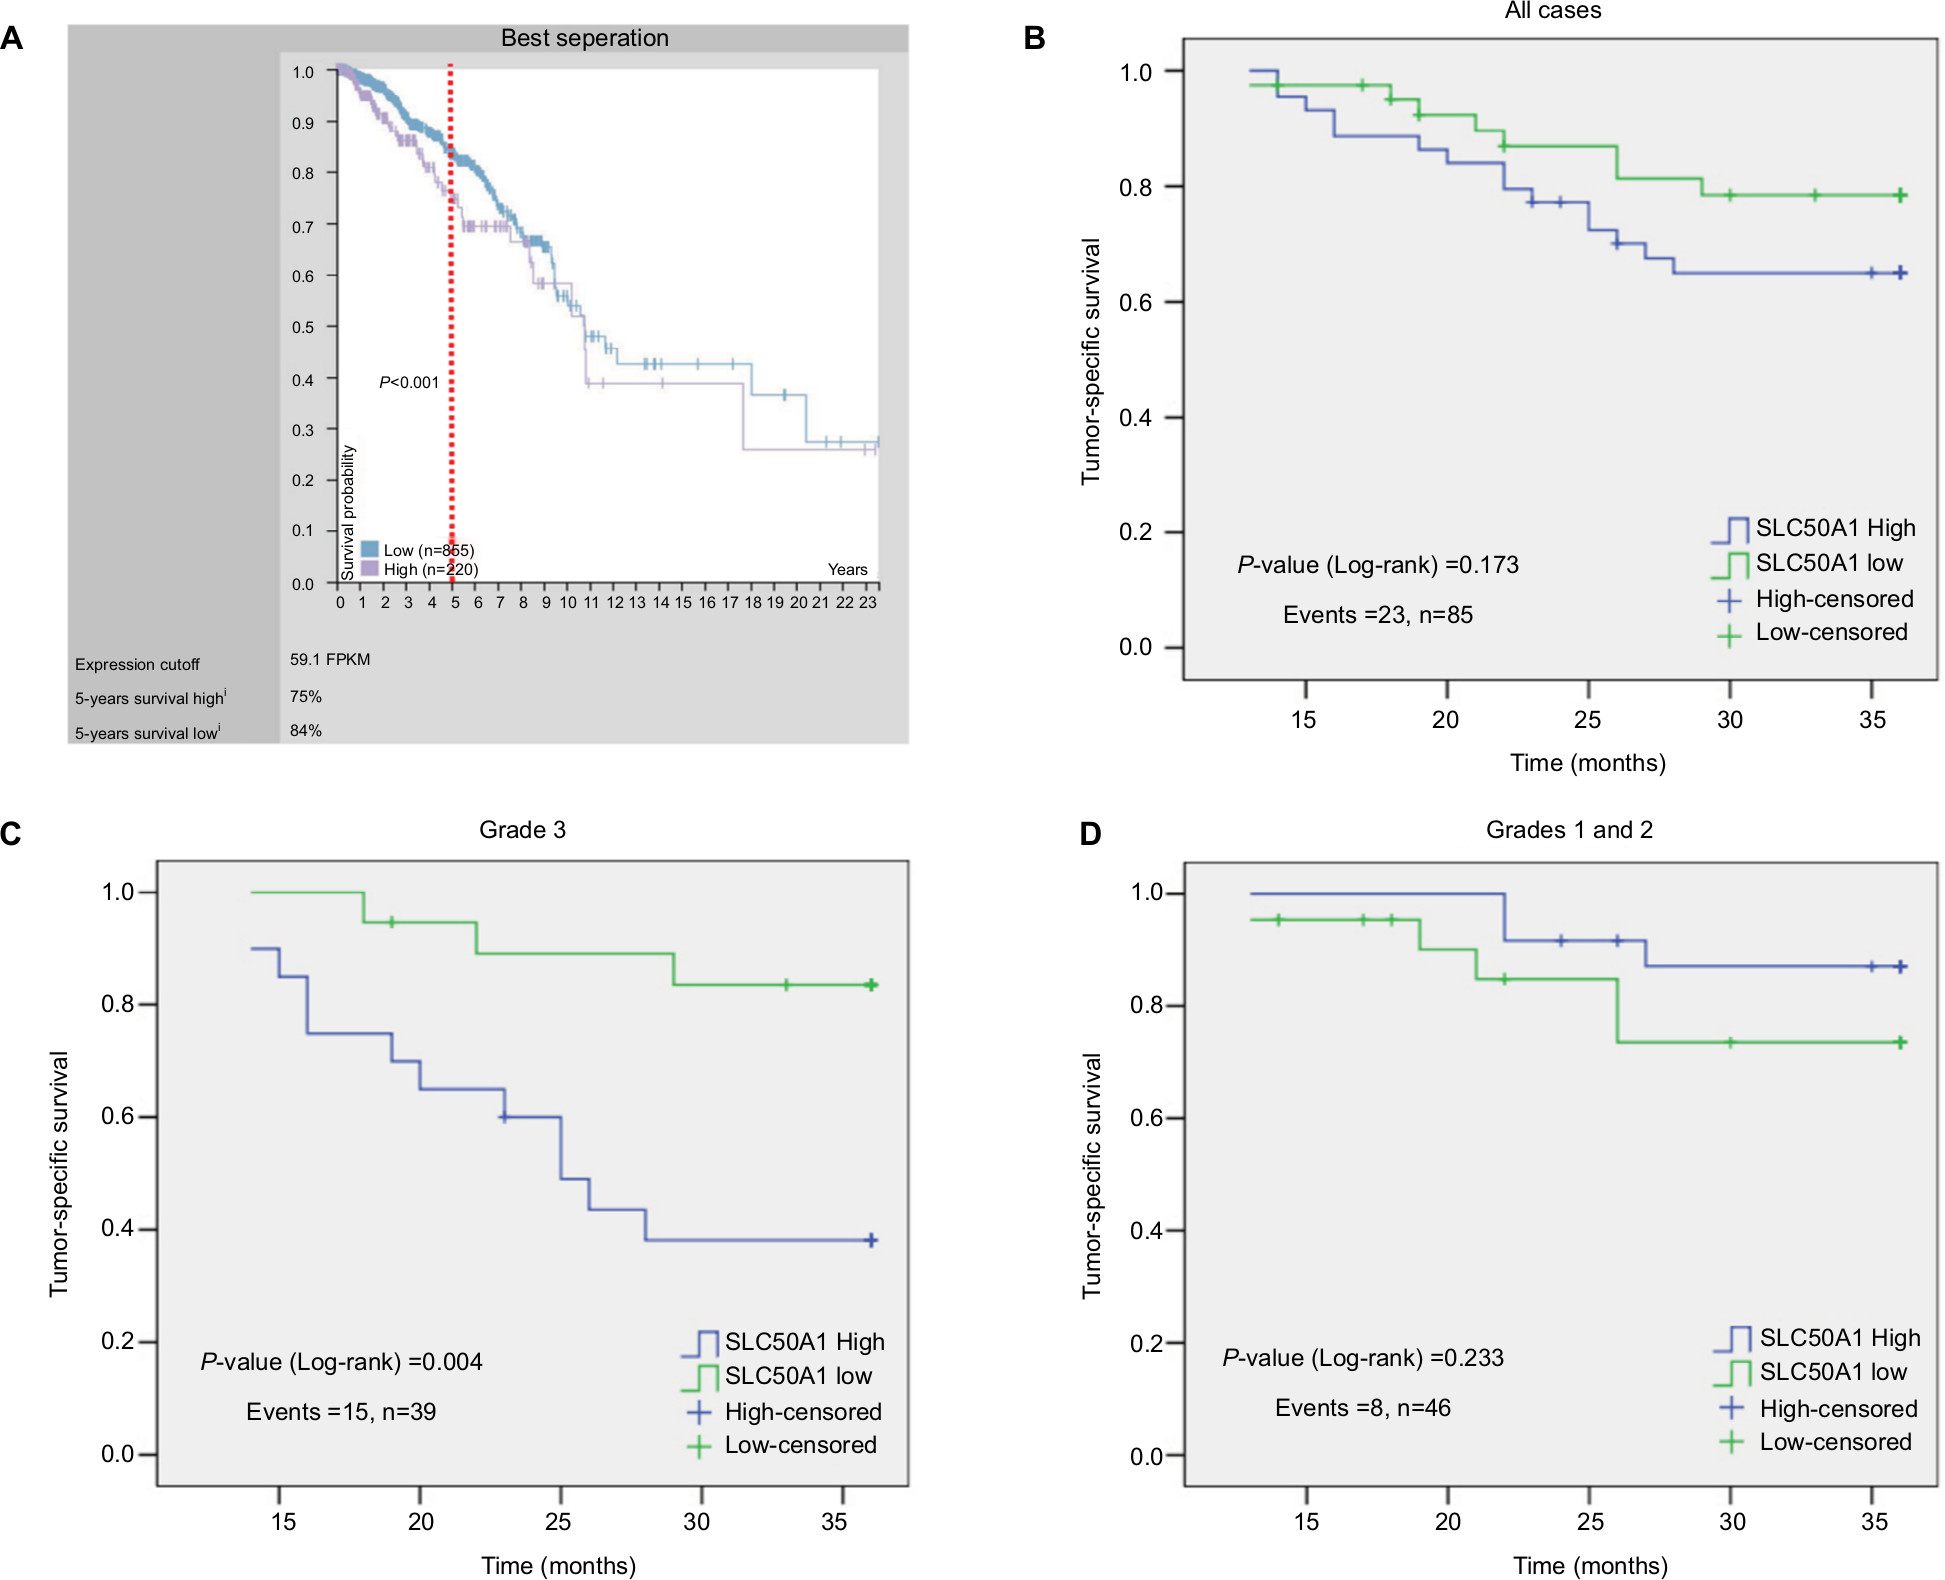 | Figure 4 Increased serum SLC50A1 protein level was associated with poor 3-year tumor-specific survival in G3 breast cancer. Notes: (A) The 5-year survival rate of breast cancer patients (n=220) with high SLC50A1 mRNA (75%) was poorer than patients (n=855) with low expression (84%) (P<0.001). Univariate Kaplan–Meier survival curves displaying 3-year tumor-specific survival of patients with low SLC50A1 expression (green line) in relation to high expression (blue line) in (B) all, (C) Grade 3, and (D) Grades 1 and 2 breast cancer cases. |
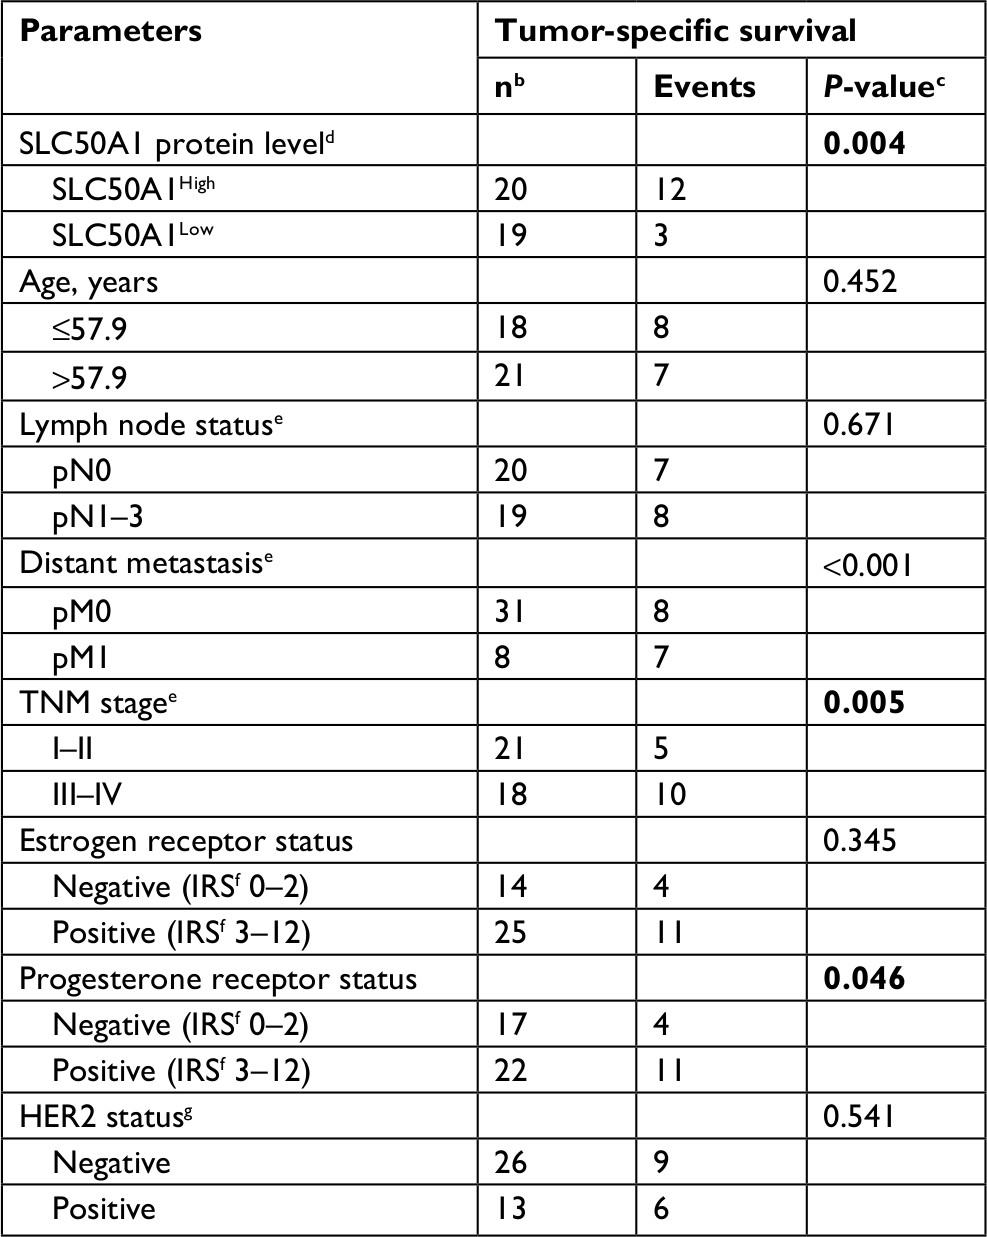 | Table 2 Univariate analysis of clinicopathological parameters in relation to tumor-specific survival in Gradea 3 breast cancer Notes: aAccording to Bloom and Richardson and modified by Elston and Ellis.27 bFemale patients with primary, unilateral breast cancer and follow-up of 3 years were included. cLog-rank test. dSLC50A1 high expression: >median primary breast cancer expression. eAccording to UICC TNM classification in breast cancer.28 fIRS according to Remmele and Stegner.29 gOverexpression of the ERBB2 gene (Her-2/neu) was diagnosed to the threshold of the DAKO score system based on the IHC assay. Uncertain cases were additionally validated by the FISH assay. Significant P-values are marked in bold face. Abbreviations: FISH, fluorescence in situ hybridization; IHC, immunohistochemistry; IRS, immunoreactive score. |
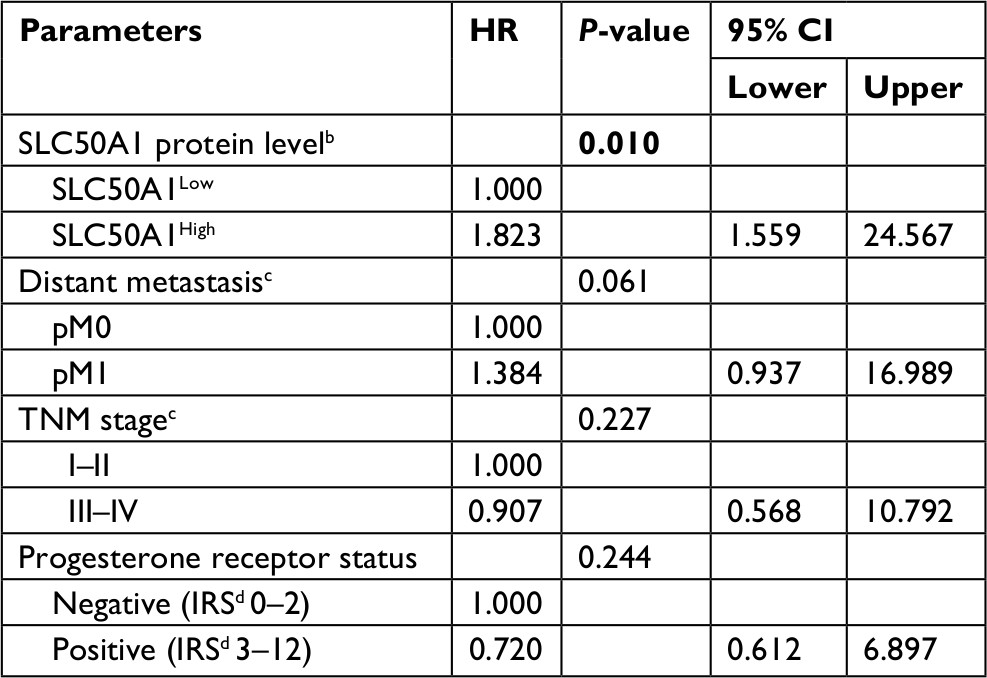 | Table 3 Multivariate Cox regression analysis including factors potentially associating tumor-specific survival in Gradea 3 breast cancer Notes: aAccording to Bloom and Richardson and modified by Elston and Ellis.27 bSLC50A1 high expression: > median primary breast cancer expression. cAccording to UICC TNM classification in breast cancer.28 dIRS according to Remmele and Stegner.29 Significant P-value was marked in bold face. Abbreviation: IRS, immunoreactive score. |
Discussion
Increasing numbers of membrane-associated proteins specific to cancer cells are being discovered and are of particular interest because of their display of potential antibody targets. These membrane proteins include potential biomarkers for cancer diagnosis, prognosis, and treatment.20 For example, the development of the anti-HER2 class of drugs initially represented by trastuzumab, followed by lapatinib, pertuzumab, and T-DM1, has dramatically improved the outcomes of breast cancer patients.21 However, HER2 gene amplification is only detectable in 20%–25% of the cases.22
A previous study uncovered several new candidate biomarkers for breast cancer development and progression, including SLC50A1 (RAG1AP1), based on the probabilistic integration of cancer genomics data for combined evaluation of RNA-seq gene expression and 450 k array DNA methylation measurements of promoters and gene bodies.10 In this study, bioinformatics screening showed that SLC50A1 mRNA was overexpressed in a breast cancer microarray and that SLC50A1 was mainly localized to the plasma membrane. Moreover, the extracellular domain of HER-2 is known to be cleaved and shed into the circulation, where it can be measured in serum.23 Although the SWEETs are predicted to have an extracellular N-terminus and a cytosolic C-terminus, it was unclear if SLC50A1 had an extracellular domain similar to HER-2 that could be detected in serum.8 However, we showed that SLC50A1 protein levels were upregulated in serum from breast cancer patients. Because this study involved several independent cohorts, we were unfortunately unable to examine the association between tissue and serum levels of SLC50A1. However, serum SLC50A1 protein level showed an unexpectedly high specificity (100%) but relatively low sensitivity (75%) for distinguishing between women with and without breast cancer in this study. These results suggest that SLC50A1 may represent a novel serum-based biomarker for diagnosing breast cancer; however, further multicenter studies with large sample sizes are needed to investigate the factors affecting serum-based detection. Moreover, SLC50A1 is potentially detectable in other tumors owing to the fact that its expression is basically not conclusive for breast cancer but could be utilized in addition to other markers.
Furthermore, we demonstrated associations between serum SLC50A1 and HER2 and ER after stratification of the clinicopathological parameters of breast cancer. This was in line with the results of GOBO analysis. Data from breast cancer cell lines with amplification of the synthetic lethality (SL) partner gene SLC50A1 of ABL1 showed that significantly lower drug concentrations were required for 50% cell growth inhibition compared with wild-type cells for ABL1-targeted bosutinib.24 Wang et al24 suggested that the alteration status of SLC50A1 should be taken into account when considering using bosutinib for breast cancer, because of its potential influence on the therapeutic effect. We thus speculate that overexpression of SLC50A1 may be related to the effects of HER2- and ER-targeted therapies in HER2- and ER-positive breast cancer patients. The underlying mechanism of drug sensitivity in HER2- and ER-positive breast cancer cell lines in relation to SLC50A1 amplification deserves further investigation.
This study also investigated the putative prognostic relevance of SLC50A1 in breast cancer. Although the TCGA data supported a relationship between high SLC50A1 expression and low survival rate in breast cancer patients, our results failed to support the TCGA analysis. However, univariate analysis demonstrated that patients with high-grade tumors and high SLC50A1 protein expression had significantly lower 3-year tumor-specific survival than those with low and intermediate expression levels. Cox regression analysis confirmed SLC50A1 as a potential independent biomarker of unfavorable prognosis in patients with G3 breast cancer. To the best of our knowledge, there have been no previous reports of the prognostic value of SLC50A1 in human cancer, although other eukaryotic sugar transporters have been characterized. For example, GLUT1 has been indicated to be a prognostic indicator for human cancer.6
The SWEETs represent a recently discovered class of sugar transporters that mediate glucose uptake in the intestine and mammary glands. SWEET1 reduced glucose absorption in goat mammary gland epithelial cells in line with increasing expression of GLUT1, GLUT4, and GLUT12, possibly due to a glucose efflux,25 and human SWEET1 may also supply glucose for lactose synthesis in mammary glands.9 However, the transport mechanism of SWEETs has not yet been characterized, and although the current data are compatible with uniport/facilitated diffusion,26 more complex mechanisms may be responsible and the possibility that SWEETs are cotransporters cannot be excluded.
Conclusion
This study proposed a potential pro-oncogenic impact of SLC50A1 in human breast cancer, at least in poorly differentiated breast cancer. However, studies of the function and molecular mechanisms of SLC50A1 in human cancer are currently lacking, and further detailed research is urgently needed to uncover its biologic role in breast cancer. Moreover, we demonstrated that SLC50A1 was detectable by ELISA at significantly elevated levels in serum from breast cancer patients compared with age-matched healthy women. These data thus provide the first evidence for the potential usability of SLC50A1 as a biomarker for the non-invasive detection and prognostic prediction of human breast cancer. Further studies are warranted to determine the direct and/or indirect role of SLC50A1 in the sugar transport mechanism and other functional signaling pathways.
Acknowledgments
This work was supported by Research Foundation of Southwest Medical University for Youth (grant number 0903-00030685), Funded Project of Affiliated Hospital of Southwest Medical University for Doctor (grant number 17135), National Natural Science Foundation of China (grant number 81201784), and Health and Family Planning Commission of Sichuan Province (grant number 17PJ557).
Disclosure
The authors report no conflicts of interest in this work.
References
Siegel RL, Miller KD, Jemal A. Cancer statistics, 2018. CA Cancer J Clin. 2018;68(1):7–30. | ||
Chen W, Zheng R, Baade PD, et al. Cancer statistics in China, 2015. CA Cancer J Clin. 2016;66(2):115–132. | ||
Harris L, Fritsche H, Mennel R, et al. American society of clinical oncology 2007 update of recommendations for the use of tumor markers in breast cancer. J Clin Oncol. 2007;25(33):5287–5312. | ||
Hooley RJ, Andrejeva L, Scoutt LM. Breast cancer screening and problem solving using mammography, ultrasound, and magnetic resonance imaging. Ultrasound Q. 2011;27(1):23–47. | ||
Calvo MB, Figueroa A, Pulido EG, Campelo RG, Aparicio LA. Potential role of sugar transporters in cancer and their relationship with anticancer therapy. Int J Endocrinol. 2010;2010:205357. | ||
Deng D, Xu C, Sun P, et al. Crystal structure of the human glucose transporter GLUT1. Nature. 2014;510(7503):121–125. | ||
Onodera Y, Nam JM, Bissell MJ. Increased sugar uptake promotes oncogenesis via EPAC/RAP1 and O-GlcNAc pathways. J Clin Invest. 2014;124(1):367–384. | ||
Chen LQ, Cheung LS, Feng L, Tanner W, Frommer WB. Transport of sugars. Annu Rev Biochem. 2015;84(1):865–894. | ||
Wright EM. Glucose transport families SLC5 and SLC50. Mol Aspects Med. 2013;34(2–3):183–196. | ||
Świtnicki MP, Juul M, Madsen T, Sørensen KD, Pedersen JS. PINCAGE: probabilistic integration of cancer genomics data for perturbed gene identification and sample classification. Bioinformatics. 2016;32(9):1353–1365. | ||
Yin X, Xiang T, Li L, et al. DACT1, an antagonist to Wnt/β-catenin signaling, suppresses tumor cell growth and is frequently silenced in breast cancer. Breast Cancer Res. 2013;15(2):R23. | ||
Rhodes DR, Yu J, Shanker K, et al. ONCOMINE: a cancer microarray database and integrated data-mining platform. Neoplasia. 2004;6(1):1–6. | ||
Stelzer G, Rosen N, Plaschkes I. The genecards suite: from gene data mining to disease genome sequence analyses. Curr Protoc Bioinformatics. 2016;54:1.30.1–1.30.33. | ||
Ringnér M, Fredlund E, Häkkinen J, Borg Å, Staaf J. GOBO: gene expression-based outcome for breast cancer online. PLoS One. 2011;6(3): e17911. | ||
Ye L, Xiang T, Fan Y. The 19q13 KRAB Zinc-finger protein ZFP82 suppresses the growth and invasion of esophageal carcinoma cells through inhibiting NF-kappaB transcription and inducing apoptosis. Epigenomics. Epub 2018 Sep 13. | ||
Fan Y, Zhan Q, Xu H, et al. Epigenetic identification of ZNF545 as a functional tumor suppressor in multiple myeloma via activation of p53 signaling pathway. Biochem Biophys Res Commun. 2016;474(4):660–666. | ||
Livak KJ, Schmittgen TD. Analysis of relative gene expression data using real-time quantitative PCR and the 2(-Delta Delta C(T)) Method. Methods. 2001;25(4):402–408. | ||
Uhlén M, Björling E, Agaton C, et al. A human protein atlas for normal and cancer tissues based on antibody proteomics. Mol Cell Proteomics. 2005;4(12):1920–1932. | ||
Guiu S, Michiels S, André F, et al. Molecular subclasses of breast cancer: how do we define them? The IMPAKT 2012 Working Group Statement. Ann Oncol. 2012;23(12):2997–3006. | ||
Grimm D, Bauer J, Pietsch J, et al. Diagnostic and therapeutic use of membrane proteins in cancer cells. Curr Med Chem. 2011;18(2):176–190. | ||
Pondé N, Brandão M, El-Hachem G, Werbrouck E, Piccart M. Treatment of advanced HER2-positive breast cancer: 2018 and beyond. Cancer Treat Rev. 2018;67:10–20. | ||
Owens MA, Horten BC, da Silva MM. HER2 amplification ratios by fluorescence in situ hybridization and correlation with immunohistochemistry in a cohort of 6556 breast cancer tissues. Clin Breast Cancer. 2004;5(1):63–69. | ||
Yuan CX, Lasut AL, Wynn R, et al. Purification of Her-2 extracellular domain and identification of its cleavage site. Protein Expr Purif. 2003;29(2):217–222. | ||
Wang R, Han Y, Zhao Z, et al. Link synthetic lethality to drug sensitivity of cancer cells. Brief Bioinform. Epub 2017 Dec 28. | ||
Zhu LQ, Bao ZK, Hu WW, Lin J, Yang Q, Yu QH. Cloning and functional analysis of goat SWEET1. Genet Mol Res. 2015;14(4):17124–17133. | ||
Lin IW, Sosso D, Chen LQ, et al. Nectar secretion requires sucrose phosphate synthases and the sugar transporter SWEET9. Nature. 2014;508(7497):546–549. | ||
Elston EW, Ellis IO. Method for grading breast cancer. J Clin Pathol. 1993;46(2):189–190. | ||
Uehiro N, Horii R, Iwase T, et al. Validation study of the UICC TNM classification of malignant tumors, seventh edition, in breast cancer. Breast Cancer. 2014;21(6):748–753. | ||
Remmele W, Stegner HE. [Recommendation for uniform definition of an immunoreactive score (IRS) for immunohistochemical estrogen receptor detection (ER-ICA) in breast cancer tissue]. Pathologe. 1987;8(3):138–140. |
Supplementary materials
 | Table S1 Clinicopathological parameters of 20 breast cancer and paired adjacent normal tissues analyzed in this study Notes: aFemale patients with primary, unilateral breast cancer were included. bAccording to Bloom and Richardson and modified by Elston and Ellis.1 cAccording to UICC TNM classification in breast cancer.2 dIRS according to Remmele and Stegner.3 eOverexpression of the ERBB2 gene (Her-2/neu) was diagnosed to the threshold of the DAKO score system based on the IHC assay. Uncertain cases were additionally validated by the FISH assay. Abbreviations: FISH, fluorescence in situ hybridization; IHC, immunohistochemistry; IRS, immunoreactive score. |
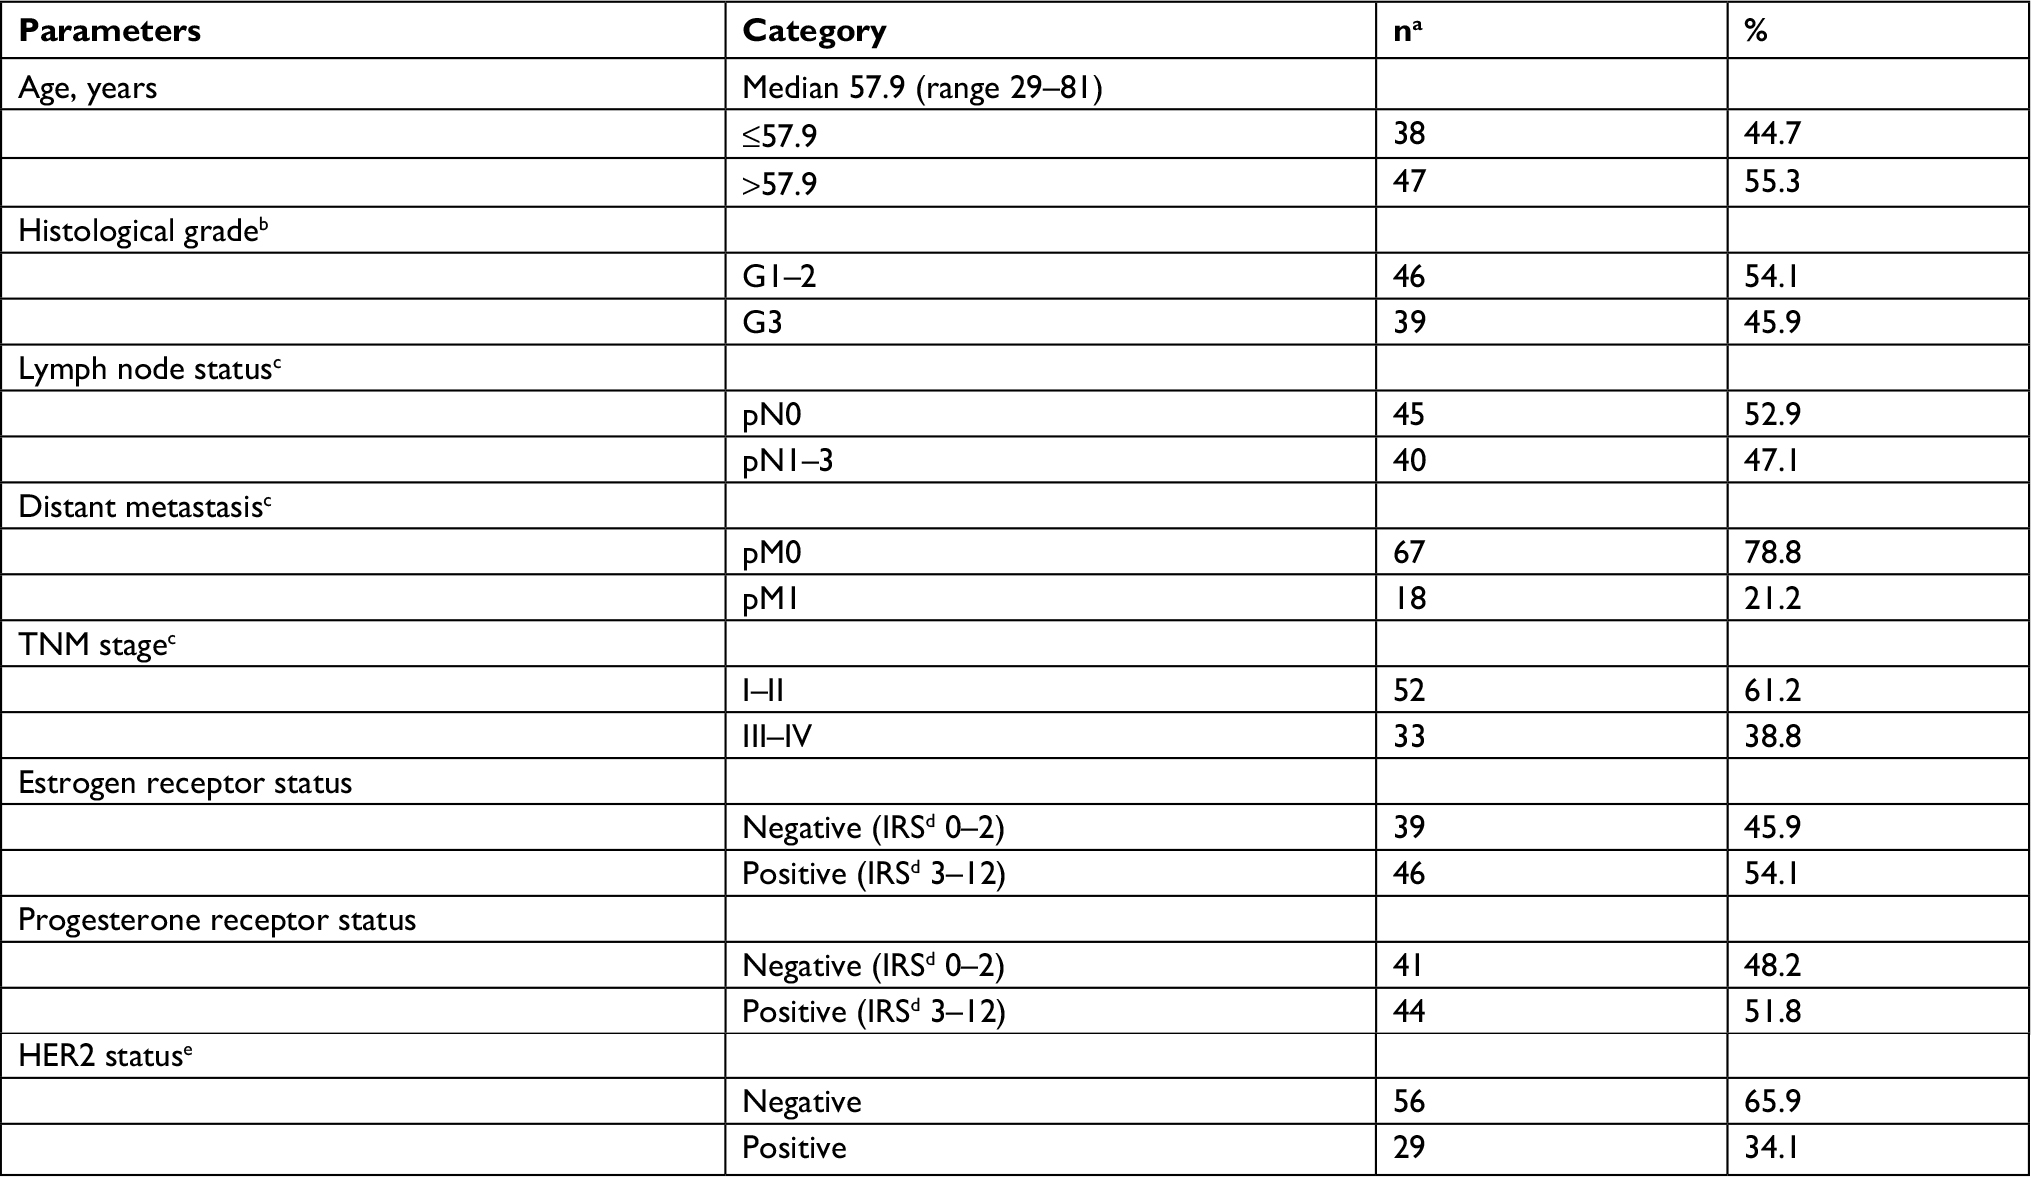 | Table S2 Clinicopathological parameters of 85 breast cancer serum samples analyzed for SLC50A1 protein level Notes: aFemale patients with primary, unilateral breast cancer were included. bAccording to Bloom and Richardson and modified by Elston and Ellis.1 cAccording to UICC TNM classification in breast cancer.2 dIRS according to Remmele and Stegner.3 eOverexpression of the ERBB2 gene (Her-2/neu) was diagnosed to the threshold of the DAKO score system based on the IHC assay. Uncertain cases were additionally validated by the FISH assay. Abbreviations: FISH, fluorescence in situ hybridization; IHC, immunohistochemistry; IRS, immunoreactive score. |
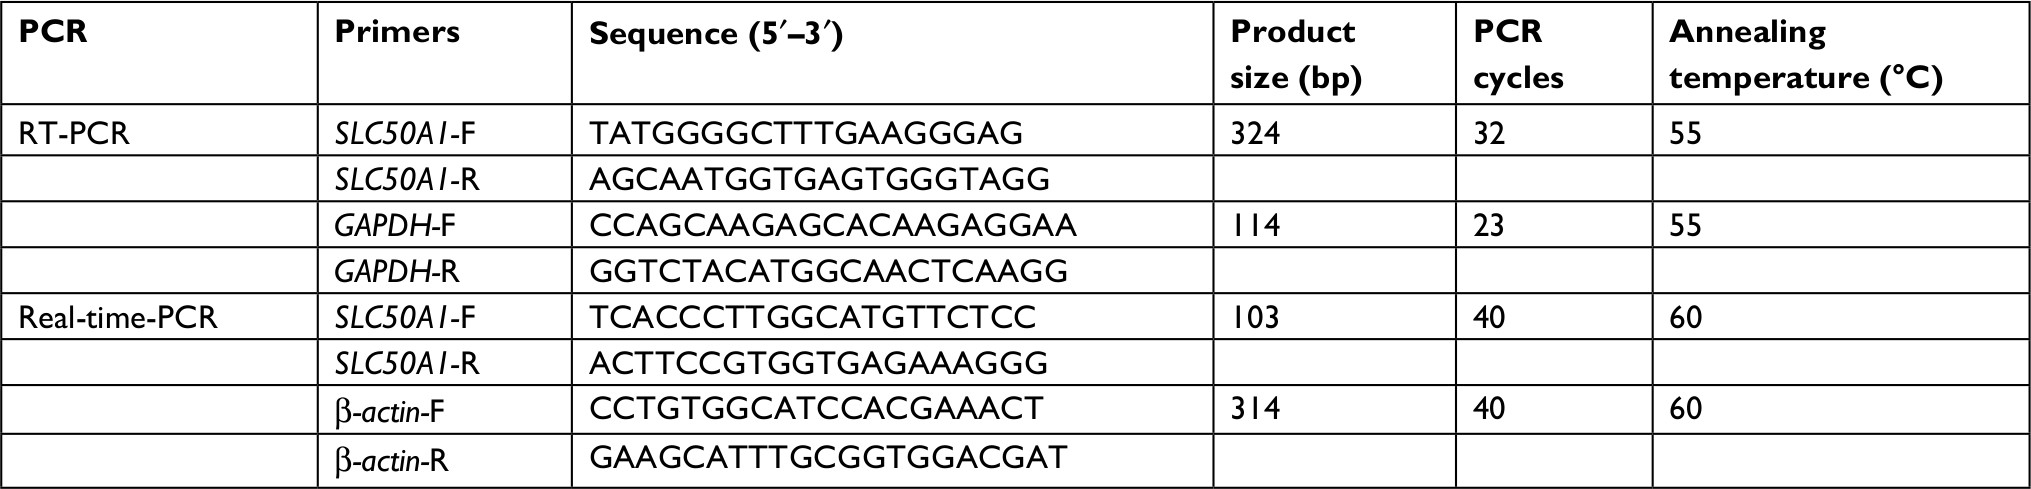 | Table S3 List of primers used in this study Abbreviation: RT-PCR, reverse transcription PCR. |
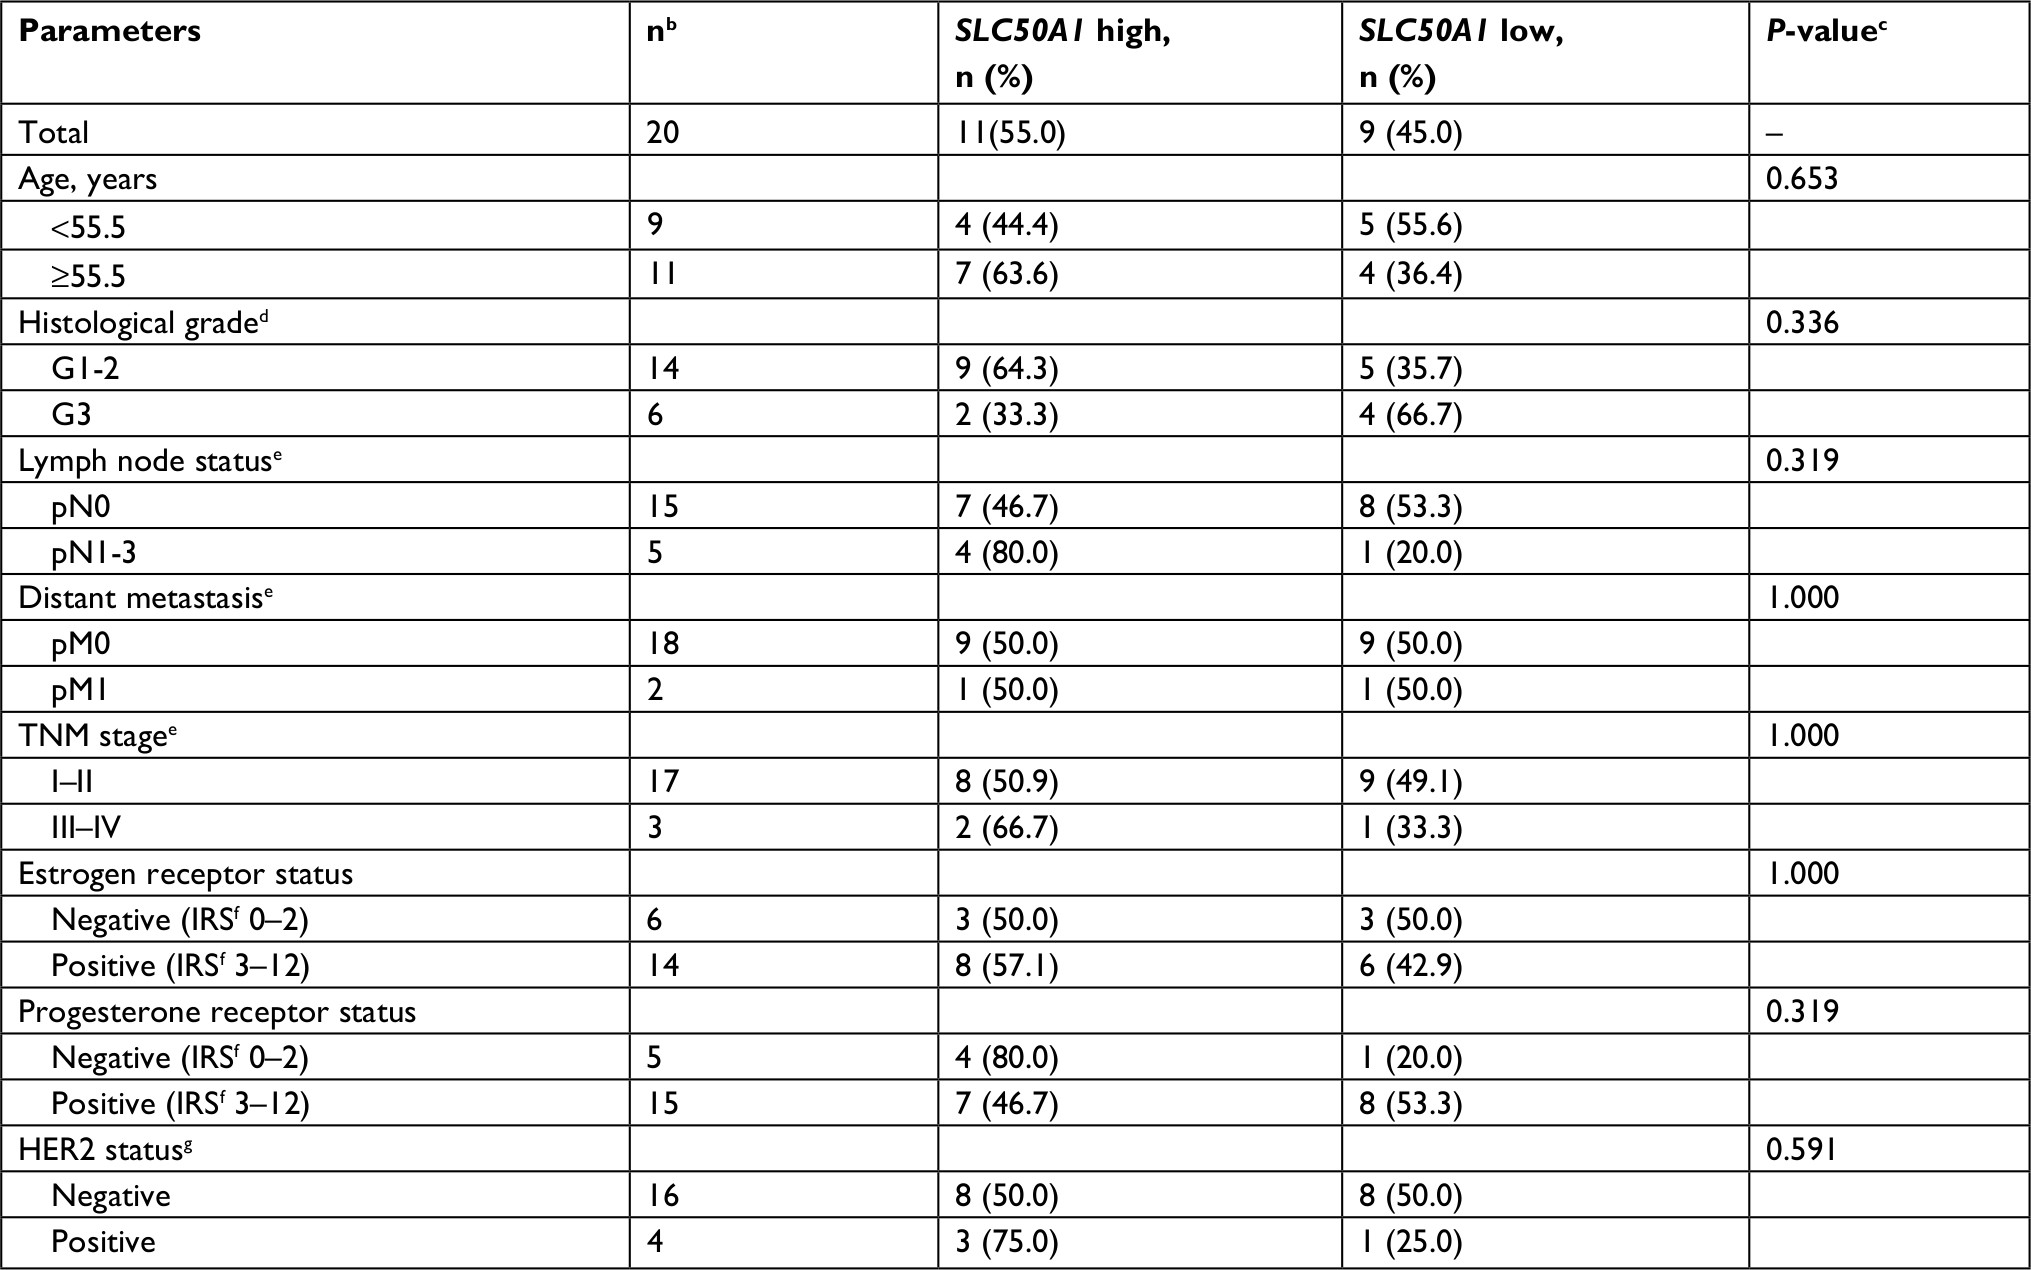 | Table S4 Clinicopathological parameters in relation to SLC50A1 mRNA expressiona Notes: aSLC50A1 high expression: > median primary breast cancer expression. bFemale patients with primary, unilateral breast cancer were included. cFisher’s exact test. dAccording to Bloom and Richardson and modified by Elston and Ellis.1 eAccording to UICC TNM classification in breast cancer.2 fIRS according to Remmele and Stegner.3 gOverexpression of the ERBB2 gene (Her-2/neu) was diagnosed to the threshold of the DAKO score system based on the IHC assay. Uncertain cases were additionally validated by the FISH assay. Abbreviations: FISH, fluorescence in situ hybridization; IHC, immunohistochemistry; IRS, immunoreactive score. |
References
Elston EW, Ellis IO. Method for grading breast cancer. J Clin Pathol. 1993;46(2):189–190. | ||
Uehiro N, Horii R, Iwase T, et al. Validation study of the UICC TNM classification of malignant tumors, seventh edition, in breast cancer. Breast Cancer. 2014;21(6):748–753. | ||
Remmele W, Stegner HE. Recommendation for uniform definition of an immunoreactive score (IRS) for immunohistochemical estrogen receptor detection (ER-ICA) in breast cancer tissue. Pathologe. 1987;8(3):138–140. |
 © 2019 The Author(s). This work is published and licensed by Dove Medical Press Limited. The full terms of this license are available at https://www.dovepress.com/terms.php and incorporate the Creative Commons Attribution - Non Commercial (unported, v3.0) License.
By accessing the work you hereby accept the Terms. Non-commercial uses of the work are permitted without any further permission from Dove Medical Press Limited, provided the work is properly attributed. For permission for commercial use of this work, please see paragraphs 4.2 and 5 of our Terms.
© 2019 The Author(s). This work is published and licensed by Dove Medical Press Limited. The full terms of this license are available at https://www.dovepress.com/terms.php and incorporate the Creative Commons Attribution - Non Commercial (unported, v3.0) License.
By accessing the work you hereby accept the Terms. Non-commercial uses of the work are permitted without any further permission from Dove Medical Press Limited, provided the work is properly attributed. For permission for commercial use of this work, please see paragraphs 4.2 and 5 of our Terms.