")
Back to Journals » Journal of Asthma and Allergy » Volume 15
The Multiomics Analyses of Gut Microbiota, Urine Metabolome and Plasma Proteome Revealed Significant Changes in Allergy Featured with Indole Derivatives of Tryptophan
Authors Zhen J, Zhao P, Li Y, Cai Y, Yu W, Wang W, Zhao L, Wang H , Huang G, Xu A
Received 18 August 2021
Accepted for publication 18 January 2022
Published 29 January 2022 Volume 2022:15 Pages 117—131
DOI https://doi.org/10.2147/JAA.S334752
Checked for plagiarism Yes
Review by Single anonymous peer review
Peer reviewer comments 4
Editor who approved publication: Dr Luis Garcia-Marcos
Jianhua Zhen,1,* Pengfei Zhao,1,2,* Yini Li,1,* Yanan Cai,1,* Wanchen Yu,1,* Wei Wang,1 Lu Zhao,1 Hesong Wang,1 Guangrui Huang,1 Anlong Xu1,3
1School of Life Sciences, Beijing University of Chinese Medicine, Beijing, People’s Republic of China; 2Oncology Department, Dongfang Hospital, Beijing University of Chinese Medicine, Beijing, People’s Republic of China; 3State Key Laboratory of Bio-control, Department of Biochemistry, School of Life Sciences, Sun Yat-Sen University, Guangzhou, People’s Republic of China
*These authors contributed equally to this work
Correspondence: Anlong Xu; Guangrui Huang, Email [email protected]; [email protected]
Objective: To explore changes in the gut microbiota (GM), urine metabolome and plasma proteome in individuals with allergies using multiomics analyses, and identify the key components and mechanism.
Methods: This was a cross-sectional study. All subjects were recruited to collect fecal, urine and blood samples. 16S rDNA sequencing was used to analyze the structure and function of the GM, liquid chromatography mass spectrometry was used to quantify metabolites in the urine, and data-independent acquisition quantitative proteome analysis was used to detect proteins in the plasma. Differences in GM, urine metabolites and plasma proteins between allergic and healthy individuals were displayed using principal component analysis (PCoA) and heatmap, and the co-occurrence network was visualized in Cytoscape using Spearman correlation among differential predominant genera, metabolites and proteins. The functional analysis was performed according to the Kyoto Encyclopedia of Genes and Genomes (KEGG) dataset. The allergy-related cytokines, IL-4, IL-6 and IL-13, were measured to evaluate the effect of indole derivatives on LPS-induced macrophage activation.
Results: GM α indexes, β distances and the relative abundance of the core differential genera in the allergic group were different from those of healthy individuals, which resulted in a separate distribution in the PCoA and enterotypes. Similarly, the concentrations of 393 metabolites and 144 proteins were different between allergic and healthy individuals. Then, 634 significant correlations were identified among 6 predominant differential genera, 24 differential metabolites and 104 differential proteins, 301 of which were negative and 333 of which were positive. Notably, a core network centered on tryptophan metabolites, indole-3-butyric acid (IBA) and indole-3-lactic acid (ILA), displayed high consistency with the results of KEGG pathway analysis. In the LPS-stimulated macrophages, IBA reduced the expression of IL-4 and IL-6, and ILA inhibited the upregulation of IL-6.
Conclusion: The GM, urine metabolome and plasma proteome underwent systematic change in allergic individuals compared to healthy individuals, among which indole derivatives from tryptophan metabolism might play key roles in the progression of allergies and could serve as therapeutic targets of allergy.
Keywords: allergy, multiomics, gut microbiota, urine metabolome, plasma proteome
Corrigendum for this paper has been published
Introduction
As an epidemic disease in modern society, allergies describe adverse health effects induced by specific immune stimulation (allergens) in sensitized individuals and are popular in all age groups, including infants, young adults and aged individuals.1 The most common allergic symptoms in the clinic include sneezing and running nose, itchy eyes and skin, eczema, coughing and wheezing, which appear alone or together during the course of allergic rhinitis, conjunctivitis, atopic dermatitis, and even asthma.1–4 The incidence of allergies has risen sharply in Western countries in recent decades, which might be related to changes in the environment, climate, diet and lifestyle. Exposure to diesel exhaust particulates is considered to be responsible for the increase of allergies.5–8
In the allergy process, the IgE antibody specifically binds to the allergen, which is recognized by receptors in mast cells, and then induces the activation and degranulation of mast cells to release pathological mediators of allergies.9 The gut microbiota (GM) plays an important role in immune regulation and strong correlation between the GM and allergies has been widely reported. It has been demonstrated that GM colonization during early life could directly influence the risk and incidence of allergic disease in childhood, which results from immune imprints of bacterial constituents and metabolites on the maturation of the immune system.10 Notably, Bacteroides-derived penta- or tetraacylated lipopolysaccharides (LPS) could not induce endotoxin tolerance but led to inflammatory responses later in life; therefore, infants exposed to this kind of LPS were more likely to suffer from allergic diseases.11 Another study discovered that infants with a high risk of asthma presented with decreased relative abundances of Lachnospira, Veillonella, Faecalibacterium and Rothia in their fecal samples, as well as decreased concentrations of short-chain fatty acids (SCFAs) that intimately participate in immunocyte development by increasing the levels of dendritic cell precursors and Treg cells in the marrow.11 However, during allergy, the GM experiences absolute dysbiosis, including reductions in bacterial diversity and the relative abundance of certain specific bacteria (eg, Bifidobacterium),12 but the concomitant changes in the human body are still unknown. Therefore, we collected fecal, urine and plasma samples from 27 patients suffering from allergies and 39 healthy individuals to explore changes in the GM, urine metabolome and plasma proteome in allergic individuals using multiomics analyses.
Methods
Subject Recruitment and Sample Collection
All subjects were recruited from the Beijing University of Chinese Medicine in Beijing, China, which were between 18 and 40 years old and did not have any specific medication use (especially antibiotics and antacids) within 3 months before enrolment. Subjects suffering from chronic disease, such as hypertension or cancer, or those infected with HBV/HCV/HIV/Treponema pallidum, or those participating in other clinical studies and female subjects who were pregnant/breastfeeding/planning to become pregnant within 6 months were excluded. The healthy controls had medical reports without any abnormal indices within 3 months, while the allergic subjects were diagnosed using diagnostic criteria, as shown in Supplementary Table S1. This study was conducted in accordance with the Declaration of Helsinki and was approved by the Ethics Committee of the Beijing University of Chinese Medicine Third Affiliated Hospital (protocol number: KTPJ-BZYSY-2017-01). Written informed consent was obtained from all subjects, and all experiments were performed in accordance with the approved guidelines.
According to a well-defined clinical protocol, fecal, urine and blood samples were all collected in hospital and transported to the laboratory within two hours (fecal samples: on dry ice; urine and blood samples: on ice). Urine samples were centrifuged at 3500 rpm for 15 min, and the supernatants were transferred to Eppendorf tubes. Blood samples were collected in 10 mL ethylene diamine tetraacetic acid (EDTA) tubes and added PolymorphPrep (Axis-Shield, Norway) (2/1, v/v), after centrifuged at 500 ×g for 30 min, the supernatants (plasma) were transferred to Eppendorf tubes. All fecal samples, processed urine and plasma samples were stored at −80°C for use.
DNA Extraction, Illumina Sequencing of 16S rDNA and Bioinformatics Analysis
Genomic DNA was extracted from thawed fecal samples using the QIAamp DNA Mini Kit (Qiagen, Hilden, Germany) and used as a template for PCR amplification of bacterial 16S rDNA V3-V4 regions with the universal primers 338F (5’-ACTCCTACGGGAGGCAGCAG-3’) and 806R (5’-GGACTACHVGGGTWTCTAAT-3’). The sequencing library for the Illumina MiSeq platform was constructed with the same amount of amplicons after purification (Ampure XP beads, Agency, Kraemer, CA) and quantification (Qubit dsDNA Assay Kit, Thermo Fisher Scientific, Ma, USA). The original DNA fragments were merged using Fast Length Adjustment of Short Reads (FLASH) software (v1.2.11), the sequences were clustered into OTUs at 97% similarity using Quantitative Insights Into Microbial Ecology (QIIME) software (v2.0), and the representative sequence of each OTU were assigned to the SILVA 128/16S rDNA bacterial database with a 97% cut-off value in the Bayesian approach to obtain taxonomic data for downstream analysis.
Bacterial richness, evenness and diversity across samples were assessed using the following α indexes and β distances: Shannon, Simpson, Bergerparker, Shannoneven, Simpsonneven, Enclidean, Hellinger, Bray-Curtis, Unweighted-UniFrac and Weighted-UniFrac. The Wilcoxon rank-sum test was used to compare bacterial diversity. Principal coordinate analysis (PCoA) and analysis of similarities (Adonis) using Bray-Curtis distance metrics were performed to visualize the interactions among bacterial communities in different samples. Relative abundances of the top 20 genera in each sample were displayed in a bar chart, and then enterotypes of each sample were determined by the distribution of the predominant genera using a cluster based on Weighted-UniFrac distance. MetagenomeSeq, Wilcoxon rank-sum test and LEfSe were employed to identify distinguishing genera between the two groups, and the results were visualized using a bar chart. Functional compositions of the bacterial communities were predicted using Tax4Fun according to the Kyoto Encyclopedia of Genes and Genomes (KEGG) dataset, and differentially related pathways were screened out using the Wilcoxon rank-sum test.
Urine Sample Processing, Construction of Metabolite Profiles and Bioinformatics Analysis
Urine samples were thawed at 4°C, and aliquots of 100 μL urine were added to 300 μL ice-cold solutions containing methanol (Thermo Fisher Scientific, USA) and acetonitrile (Thermo Fisher Scientific, USA, 2/1, v/v) as well as 10 μL metabolic markers 1 (D3-L-Methionine: 100 ppm, TRC, Canada; 13C9-Phenylalanine: 100 ppm, CIL, USA; D6-L-2-Aminobutyric Acid: 100 ppm, TRC, Canada; D4-L-Alanine: 100 ppm, TRC, Canada; 13C4-L-Threonine: 100 ppm, CIL, USA; D3-L-Aspartic Acid: 100 ppm, TRC, Canada; 13C6-L-Arginine: 100 ppm, CIL, USA) and 10 μL metabolic markers 2 (SPLASH: 330707, SPLASHTM Lipidomix Mass Spec Standard, Avanti Polar Lipids, USA; LPC 18:1 (d7): 25 μg/mL; LPE 18:1 (d7): 5 μg/mL; PC 15:0–18:1 (d7): 160 μg/mL; PE 15:0–18:1 (d7): 5 μg/mL; PG 15:0–18:1 (d7): 30 μg/mL; PS 15:0–18:1 (d7): 5 μg/mL; PI 15:0–18:1 (d7): 10 μg/mL; PA 15:0–18:1 (d7): 7 μg/mL; SM d18:1–18:1 (d9): 30 μg/mL; cholesterol (d7): 100 μg/mL; CE 18:1 (d7): 350 μg/mL; MG 18:1 (d7): 2 μg/mL; DG 15:0–18:1 (d7): 10 μg/mL; TG 15:0–18:1 (d7)–15:0: 55 μg/mL). Subsequently, all mixtures were vortexed for 1 min, incubated at −20°C for 120 min and centrifuged at 4000 ×g for 20 min at 4°C. Then, 300 μL supernatants were dried in a freeze concentration centrifugal dryer and dissolved in 150 μL solutions containing methanol and water (1/1, v/v). All mixtures were vortexed for 1 min and centrifuged at 4000 ×g for 30 min at 4°C. All supernatants were transferred to LC vials. Quality control (QC) samples were prepared by mixing aliquots of all samples to form a pooled sample.
All samples in LC vials, including QC samples, were then transferred to the sample manager of an ultra-performance liquid chromatography (LC) system (Waters, USA) coupled with a Q ExactiveTM PLUS high-resolution mass spectrometer (MS) (Thermo Fisher Scientific, USA), in which metabolic profiling was analyzed in both electrospray injection (ESI)-positive and ESI-negative ion modes. The temperature was maintained at 45°C on an ACQUITY UPLC BEH C18 column (1.7 μm, 2.1 × 100 mm, Waters, USA) during chromatography. In ESI-positive ion mode, water and methanol, both containing 0.1% formic acid (CNW, Germany), were used as mobile phases A and B, respectively, while in ESI-negative ion mode, water and 95% methanol, both containing 10 mM ammonium formate (Honeywell Fluka, USA), were used as mobile phases A and B, respectively. The linear gradient was as follows: 0~1 min, 2% B; 1~9 min, 2%~98% B; 9~12 min, 98% B; 12~12.1 min, 98% ~2% B; 12.1~15 min, 2% B. All samples were kept at 4°C during the analysis, and the injection volume was 5 μL.
Data acquisition was performed in full scan mode (m/z ranges from 70 to 1050) with the resolution set at 70,000 for the full MS scans and 17,500 for MS/MS scans. The NCE/Stepped NCE was set at 20, 40 and 60 eV. MS conditions were spray voltage 3800 V (+) and 3200 V (-), capillary temperature 320°C, probe heater temperature 350°C, sheath gas flow rate 40 arbitrary units, aux gas flow rate 10 arbitrary units. The QCs were injected at regular intervals (every 10 samples) throughout the analytical run to provide a set of data from which repeatability could be assessed. Based on public databases, including the BGI Library (private standard metabolites constructed by BGI company), mzCloud-Advanced Mass Spectral Database (https://www.mzcloud.org/), ChemSpider-Search and share chemistry (http://www.chemspider.com/), HMDB (The Human Metabolome Database, http://www.hmdb.ca/), LIPID MAPS Lipidomics Gateway (http://www.lipidmaps.org/) and KEGG (Kyoto Encyclopedia of Genes and Genomes, https://www.kegg.jp/), data were processed prior to multivariate analysis using Compound Discoverer 3.0 (Thermo Fisher Scientific, USA). The differential metabolites between the two groups were screened under the following criteria:|Log2 fold change (FC)| > 1 and P < 0.05 (in a two-tailed Student’s t-test on the normalized peak areas). PCoA and Adonis using Bray-Curtis distance metrics were performed, and an R package was used to visualize the interactions among metabolite profiles in different samples. The related KEGG pathways were screened on MetaboAnalyst (https://www.metaboanalyst.ca/).
Plasma Sample Processing, Construction of Protein Profiles and Bioinformatics Analysis
Plasma samples were thawed at 4°C, and aliquots of 40 μL plasma were added to 360 μL binding buffer (Thermo Fisher Scientific, USA) for dilution. Then, 10 μL dilutions were directly added to the resin slurry in the columns with binding buffer, and another 600 μL binding buffers were added to the columns to collect the filtrates. Then, the albumin- and IgG-removed samples were vacuum freeze-dried for further processing. The dried samples were dissolved in SDS lysis buffer (Beyotime, China) and centrifuged at 12,000 ×g for 10 min twice to collect the supernatants. Then, the protein concentrations were measured using BCA (bicinchoninic acid) kits (Thermo Fisher Scientific, USA) following the manufacturer’s instructions. Fifty micrograms of protein from each sample was acquired and diluted to the same volume and concentration, and then DTT (Sangon Biotech, China) was added to the protein dilutions at a final concentration of 4.5 mM. After incubation at 55°C for 30 min, all samples were cooled to room temperature directly on ice, and then the same volume of iodoacetamide (Sangon Biotech, China) was added at a final concentration of 9 mM, mixed well, and kept in the dark at room temperature for 15 min. Six volumes of acetone (Sangon Biotech, China) were added to the above solutions, and the tubes were placed at −20°C overnight to precipitate the proteins. Then, all solutions were centrifuged at 8000 ×g and 4°C for 10 min to collect the protein sediments, 100 μL TEAB2 (Sangon Biotech, China) was added to dissolve the proteins, and 1 μg Trypsin-TPCK (Hualishi, China) was added for digestion at 37°C overnight. Finally, H3PO4 (Sinopharm Chemical Reagent, China) was added to each sample to adjust the pH value to 3 to stop digestion. The digested peptides were desalted using a C18-Reverse-Phase SPE Column (Thermo Fisher Scientific, USA). First, the column was washed with 1 mL methanol (Sangon Biotech, China) containing 0.1% TFA (Sangon Biotech, China) once, 1 mL 90% acetonitrile-H2O containing 0.1% TFA once and H2O containing 0.1% TFA once. Then, 1 mL H2O was added to each sample to dissolve it, and the solutions were loaded onto the column 3 times. Then, the column was washed with 0.1%TFA/H2O 3 times. Finally, the peptides were eluted using 90% acetonitrile-H2O (containing 0.1% TFA) 3 times, lyophilized and redissolved in 60 μL 0.1% formic acid-H2O.
All aliquots of peptide samples were acquired for separation at pH 10 on an 1100 HPLC system (Agilent, USA) using an Agilent Zorbax Extend-C18 column (5 μm, 2.1 × 150 mm, Agilent, USA) with mobile phases A (2% acetonitrile) and B (98% acetonitrile). The solvent gradient was set as follows: 0~10 min, 2% B; 10~10.01 min, 2%~5% B; 10.01~37 min, 5%~20% B; 37~48 min, 20%~40% B; 48~48.01 min, 40%~90% B; 48.01~58 min, 90% B; 58~58.01 min, 90%~2% B; 58.01~63 min, 2% B. Tryptic peptides were separated at a fluent flow rate of 250 μL/min and monitored at 210 nm and 280 nm. Separated peptides were collected since 10 min, and eluent was collected in 1–10 centrifuge tubes every minute in turn until 10 groups of separated peptides for each plasma sample had been obtained. Samples were recycled in this order, and all separated peptides were lyophilized for mass spectrometry.
All analyses were performed on a Q Exactive HF mass spectrometer (Thermo Fisher Scientific, USA), and all aliquots of separated peptide samples were loaded and separated using a PolySULPHOETHYL A (5 μm, 200 Å) column (200 × 9.4 mm, PolyLC Inc, USA) on an EASY-nLCTM 1200 system (Thermo Fisher Scientific, USA). The flow rate was 300 nL/min, and the linear gradient was 90 min (0~60 min, 8% B; 60~79 min, 25% B; 79~80 min, 45% B; 80~90 min, 100% B; mobile phase A = 0.1% formic acid and B = 0.1% formic acid in 80% acetonitrile). Full MS scans were acquired in the mass range of 350~1650 m/z with a mass resolution of 120,000, and the AGC target value was set at 3e6. The 10 most intense peaks in MS were fragmented with higher-energy collisional dissociation with a collision energy of 27. MS/MS spectra were obtained with a resolution of 30,000, an AGC target of 2e5 and a maximum injection time of 80 ms. The Q Exactive HF dynamic exclusion was set for 30.0 s and run under positive mode. Additionally, all separated peptide samples were analysed on a Q-Exactive HF mass spectrometer using the same LC setups and gradients as described earlier for the Q Exactive-based analysis, except that full MS scans were acquired in the mass range of 350~1250 m/z, MS/MS spectra were obtained with an AGC target of 1e6 and the isolation window was set at 26 m/z. Spectronaut (https://biognosys.com/shop/spectronaut, Biognosys AG, Switzerland) was used to search all of the fusion raw data thoroughly against the sample protein database. The differential proteins between the two groups were screened using the following criteria: |Log2 FC| > 1 and P < 0.05 (in a two-tailed Student’s t-test). Clusters and heatmaps based on Spearman correlation were performed to visualize differences between the two groups. The related KEGG pathways were screened using STRING (https://string-db.org/).
Multiomics Analysis
Predominant genera were defined as genera with a relative abundance >1%, and Spearman correlation among differential predominant genera, metabolites and proteins was calculated based on the relative abundance or concentration from the intersected subjects both in the two omics, of which the significant correlations were defined as |R| > 0.6 (negative correlation: R < −0.6, positive correlation: R > 0.6) and P < 0.05, and were visualized using Cytoscape (v3.8.0, https://cytoscape.org/).
Cell Culture, qPCR and ELISA
THP-1 cells (ATCC TIB-202) were treated with 100 nM PMA (Sigma, MO, USA) to promote the differentiation into macrophages, and then stimulated with LPS (1 μg/mL, Sigma, MO, USA). Indole-3-butyric acid (IBA, APExBIO, Texas, USA) and indole-3-lactic acid (ILA, MCE, Shanghai, China) were added into the culture medium, with the concentrations of 0, 200, 400 and 800 μM, respectively. After 12 h, supernatant and cells were collected for ELISA (Proteintech, Hubei, China) and qPCR (Accurate biology, Hunan, China). The qPCR primers are as follow: IL-4 (5’-CGGCAACTTTGACCACGGACACAAGTGCGATA-3’, 5’- ACGTACTCTGGTTG GCTTCCTTCACAGGACAG-3’), IL-6 (5’-CCTGAACCTTCCAAAGATGGC-3’, 5’-TTCACCAGGCAAGTCTCCTCA-3’) and IL-13 (5’-AAGCTGATCGGCGAGTA TG-3’, 5’-TCTTCAGGCCCAGGATGTAA-3’).
Statistical Analysis
Statistical calculations were performed using SPSS software (v25.0, SPSS Inc., USA). The independent samples t-test or Mann–Whitney U-test was used to analyze the variables after the normality test with the Kolmogorov–Smirnov or Shapiro–Wilk test. The chi-square test was used to analyze the count data. Significance was declared at P < 0.05.
Results
Characteristics of the Study Subjects
Our study population was composed of 39 healthy control subjects (hereafter referred to as HC) and 27 subjects suffering from allergic diseases (hereafter referred to as AL). Detailed information on all subjects is included in Supplementary Table S2. As the fecal, urine and plasma samples were from the different combinations of those subjects (Supplementary Table S2), significant differences in baseline information and blood/urine tests were calculated in different omics analyses (Supplementary Table S3–S8). Notably, calcium (Ca2+) in the blood was significantly decreased in the ALs in all three combinations (GM: P=0.008, metabolomics: P=0.033, proteomics: P=0.046) (Supplementary Tables S4, S6 and S8). Furthermore, ALs participating in the GM and metabolomics analysis preferred less cold food than HCs (GM: P=0.001, metabolomics: P= 0.002) (Supplementary Tables S3 and S5) and exhibited decreased total protein (TP) concentrations in the blood (GM: P=0.004, metabolomics: P=0.002) (Supplementary Tables S4 and S6). Furthermore, significantly increased apolipoprotein A1 (APOA1) was observed in the blood in ALs participating in the GM and proteomics (GM: P=0.032, proteomics: P=0.035) (Supplementary Tables S4 and S8). However, there were other taste preferences, and indices in the blood tests revealed significant alterations between the AL and HC groups merely in one omics analysis, with similar changing trends (but not significant) in the other two omics analyses, such as the sour preference in the GM and glucose (GLU) in the blood in the proteomics (Supplementary Tables S4 and S6).
Structural Characteristics of the GM in the AL Populations
In the present study, 53 fecal samples (30 HC subjects and 23 AL subjects) were sequenced using an Illumina MiSeq platform to explore the GM structural characteristics in the AL populations. As shown in Figure 1A and B, the bacterial community diversity (Shannon, Simpson and Bergerparker indexes) and evenness (Shannoneven and Simpsoneven indexes) in the ALs were significantly different from those in the HCs, ie, the GM α indexes in the ALs were increased (Shannon, Shannoneven and Simpsoneven indexes) or decreased (Simpson and Bergerparker indexes) compared to the HCs. Similarly, β distances between samples in the two groups were also significantly different; for example, Enclidean, Hellinger, Bray-Curtis, Unweighted-UniFrac and Weighted-UniFrac distances in the ALs were shorter than those in the HCs (Figure 1A and B), which resulted in a clearly separate distribution between the two groups in the PCoA (Figure 1C).
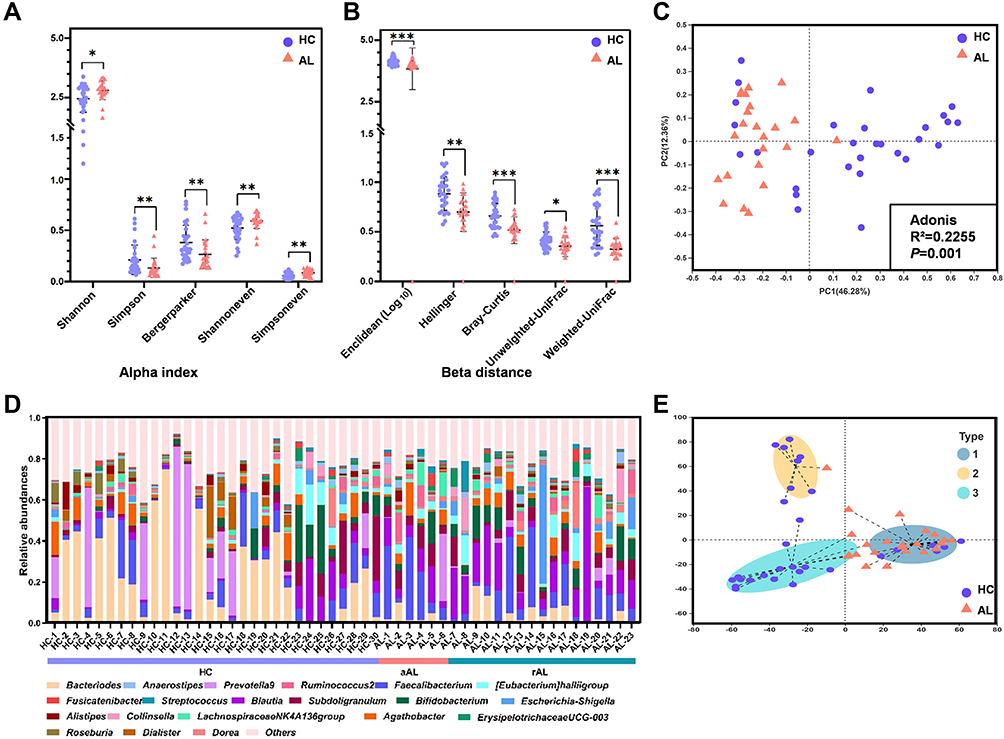 |
Figure 1 GM structure of the ALs and HCs. (A) Significant differences in α indexes between the AL and HC groups. (B) Significant differences in β distances between the AL and HC groups. (C) PCoA and Adonis analysis based on the Bray-Curtis distance at the genus level. (D) Relative abundances of the top 20 genera in each sample. In the bar chart, different colors represent different genera; in the bar under the chart, different colors represent different health stages. (E) Enterotype discrimination at the genus level. Different background colors represent different enterotypes. Type 1, Blautia was the predominant genera; type 2, Prevotella 9 was the predominant genus; type 3, Bacteroides was the predominant genus. *P<0.05, **P<0.01, ***P<0.001. Abbreviations: HC, healthy control; AL, allergic; aAL, acute allergic; rAL, remissive allergic; GM, gut microbiota; PCoA, Principal coordinate analysis; PC1, Principal Component 1; PC2, Principal Component 2; Adonis, analysis of similarities. |
As another index reflecting the GM structure, the relative abundances of the top 20 genera in each subject are shown in Figures 1D, and 3 enterotypes were discriminated according to the proportion of the most predominant genera (Figure 1E and Supplementary Table S9). Blautia were the most predominant genera in samples attributed to enterotype 1, which included most of the AL genera, while Prevotella 9 and Bacteroides were the most predominant genera in the samples attributed to enterotypes 2 and 3, respectively, and these two enterotypes were primarily composed of HC genera.
In addition, the changes in α indexes and β distances between HC, acute allergic subjects (aAL) and remissive allergic subjects (rAL) groups were also explored to determine whether there was a gradual tendency in the GM structure based on the health stage (Supplementary Figure S1A). However, all significant differences in α indexes were distributed between HCs and rALs, and all significant differences in β distances (except for Unweighted-UniFrac distance) were distributed between HCs and rALs or aALs. There was no significant difference in α indexes or β distances between rALs and aALs. Similar phenomena appeared in the PCoA and enterotype discrimination (Supplementary Figure S1B and S1C), and distinctions primarily emerged between HC and all ALs (including rAL and aAL), indicating that there are more similarities in the GM structures between rALs and aALs than difference.
Differential GM Genera/Urine Metabolites/Plasma Proteins Between ALs and HCs
Abundance changes in the GM genera were displayed by multiple methods, and 61 differential genera were identified in the Wilcoxon rank-sum test, 75 differential genera were identified in the MetagenomeSeq analysis and 61 differential genera were identified in the LEfSe analysis (Figure 2A, Supplementary Tables S10–S12). Forty-four core genera were common among all three analyses, including 15 predominant genera, among which Bacteroides, Parabacteroides, Lactobacillus, Sutterella and Lachnoclostridium were decreased in the AL group, while Bifidobacterium, Subdoligranulum, [Eubacterium] hallii group, Dorea, Collinsella, Anaerostipes, Erysipelotrichaceae UCG-003, Ruminococcaceae UCG-013, Streptococcus and unclassified f__Lachnospiraceae were increased in the AL group (Figure 2B).
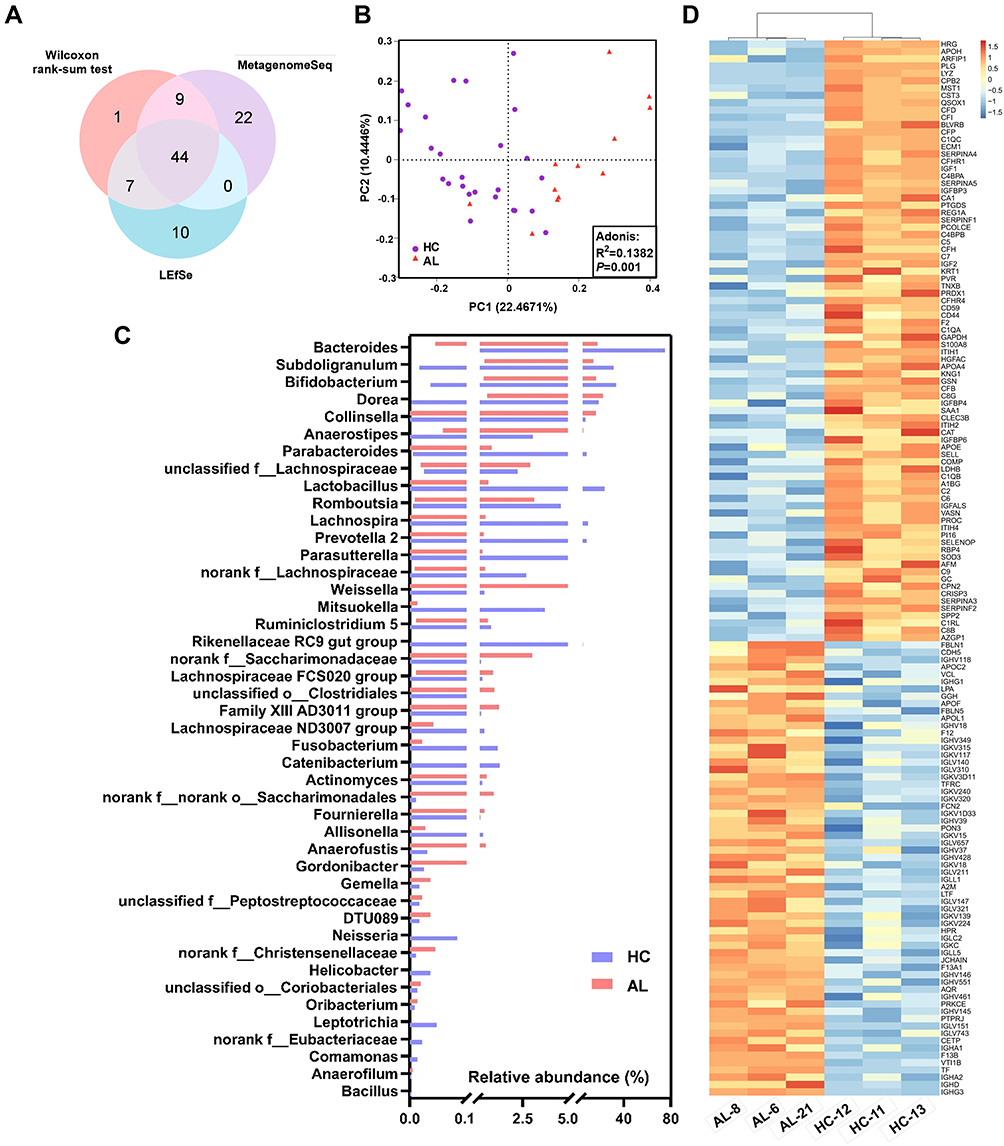 |
Figure 2 Differential GM genera/urine metabolites/plasma proteins between the AL and HC groups. (A) Venn diagram of the differential GM genera in the three analyses. (B) Bar chart of the relative abundances of the core differential GM genera. The bars in the chart represent the data ranges. (C) PCoA and Adonis analysis based on the differential metabolites in the urine between the AL and HC groups. (D), Cluster and heatmap based on the differential proteins in the plasma between the AL and HC groups. In the heatmap, concentrations were scaled from −1.5 (blue) to 1.5 (red). Abbreviations: HC, healthy control; AL, allergic; GM, gut microbiota; PCoA, Principal coordinate analysis; PC1, Principal Component 1; PC2, Principal Component 2; Adonis, analysis of similarities; LEfSe, Linear discriminant analysis Effect Size. |
The differential metabolites and proteins were also screened (Figure 2C and D and Supplementary Tables S13–S14). Among all 393 differential metabolites, 266 metabolites were decreased and 127 metabolites were increased in the ALs, and the differential metabolite profiles exhibited clear separation between the two groups in the PCoA (Figure 2C). There were 82 down-regulated proteins and 62 up-regulated proteins in the ALs, which resulted in a significant difference in the heatmap and the cluster analysis (Figure 2D).
Functional Changes in the ALs
16S rDNA sequences, differential urine metabolites and plasma proteins were all mapped to the KEGG pathways to explore functional changes in the AL populations. There were 153 KEGG pathways that exhibited differences based on 16S rDNA sequences between the AL and HC groups, while 31 KEGG pathways were mapped by the differential urine metabolites and 107 KEGG pathways were mapped by the differential plasma proteins (Figure 3 and Supplementary Tables S15–S17). In all 238 differential KEGG pathways, 112, 7 and 68 pathways were uniquely mapped by 16S rDNA sequences, differential urine metabolites and plasma proteins, respectively (Figure 3). The 51 common pathways included pathways related to hormone biosynthesis in the endocrine system, such as ovarian steroidogenesis and steroid hormone biosynthesis, and cancers in the reproductive system, such as prostate cancer, which was screened out in all three tests, as well as progesterone-mediated oocyte maturation. Notably, the tryptophan metabolism pathway was also significantly changed in the AL group, as well as pathways related to the immune system, such as Fc gamma R-mediated phagocytosis and bacterial invasion of epithelial cells, and the systemic lupus erythematosus pathway (Figure 3).
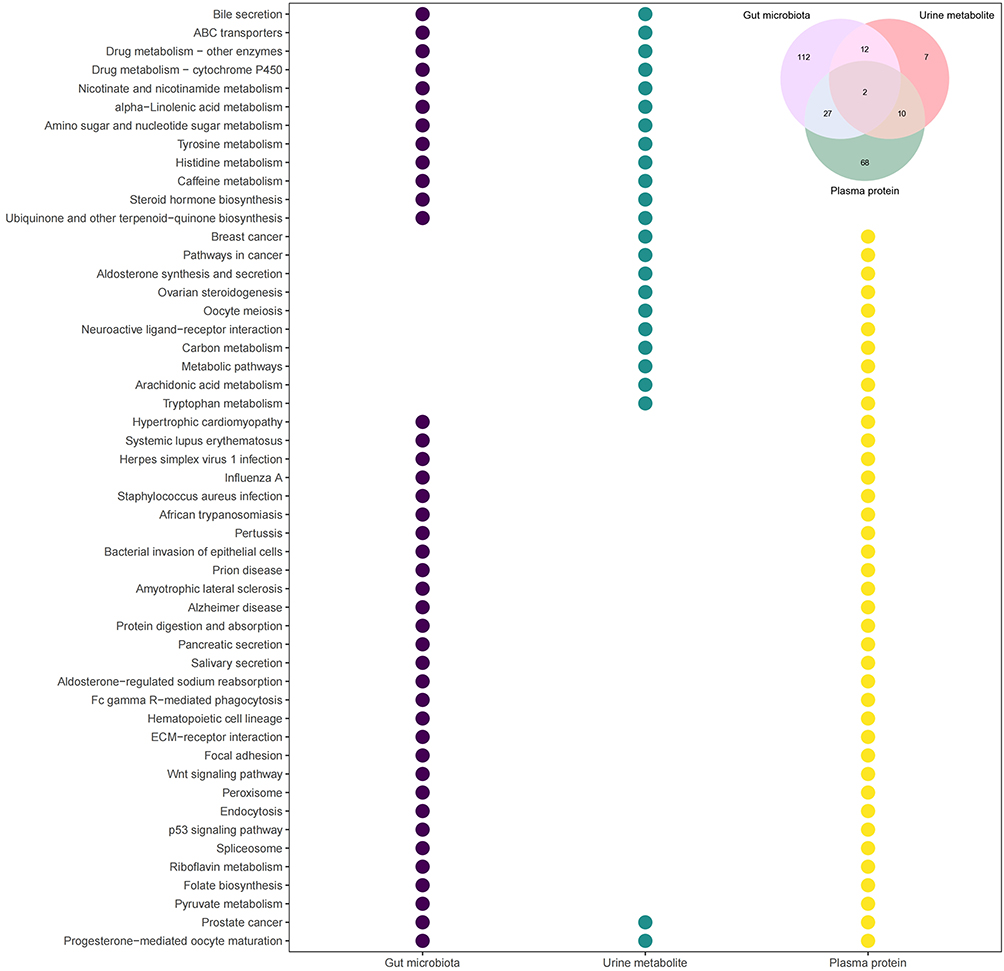 |
Figure 3 Differential KEGG pathways between the AL and HC groups. Different colors represent different tests. The upper right region in the diagram shows the Venn diagram of differential KEGG pathways in the three tests, and the bubble diagram shows the differential KEGG pathways mapped in two or all three tests. Abbreviation: KEGG, Kyoto Encyclopedia of Genes and Genomes. |
The Cooccurrence Network Among the Differential Predominant GM Genera, the Related Urine Metabolites and Plasma Proteins
To explore the internal correlations among the GM genera, urine metabolites and plasma proteins, Spearman correlations were applied and visualized as a network. As shown in Figure 4A, there were 634 significant correlations among 6 predominant differential genera, 24 related differential metabolites and 104 related differential proteins, including 301 negative correlations and 333 positive correlations. In all 6 predominant differential genera, only Bacteroides was enriched in the HC group. Dorea had the most correlations with the differential metabolites and proteins, while Bifidobacterium had the least correlations. There were 18 related differential metabolites and 60 related differential proteins enriched in the HC group, while 6 related differential metabolites and 44 related differential proteins were enriched in the AL group. Notably, the indole derivatives produced in the tryptophan metabolism by the gut microbiota might play important roles in allergy. IBA was positively correlated with Bacteroides and negatively correlated with Collinsella and Cadherin-5 (CDH5), while ILA was negatively correlated with Dorea and positively correlated with Lysozyme C (LYZ), Cystatin-C (CST3), Complement Factor H-related protein 4 (CFHR4), Inter-alpha-trypsin inhibitor heavy chain H4 (ITIH4) and Kininogen-1 (KNG1) (Figure 4B–E).
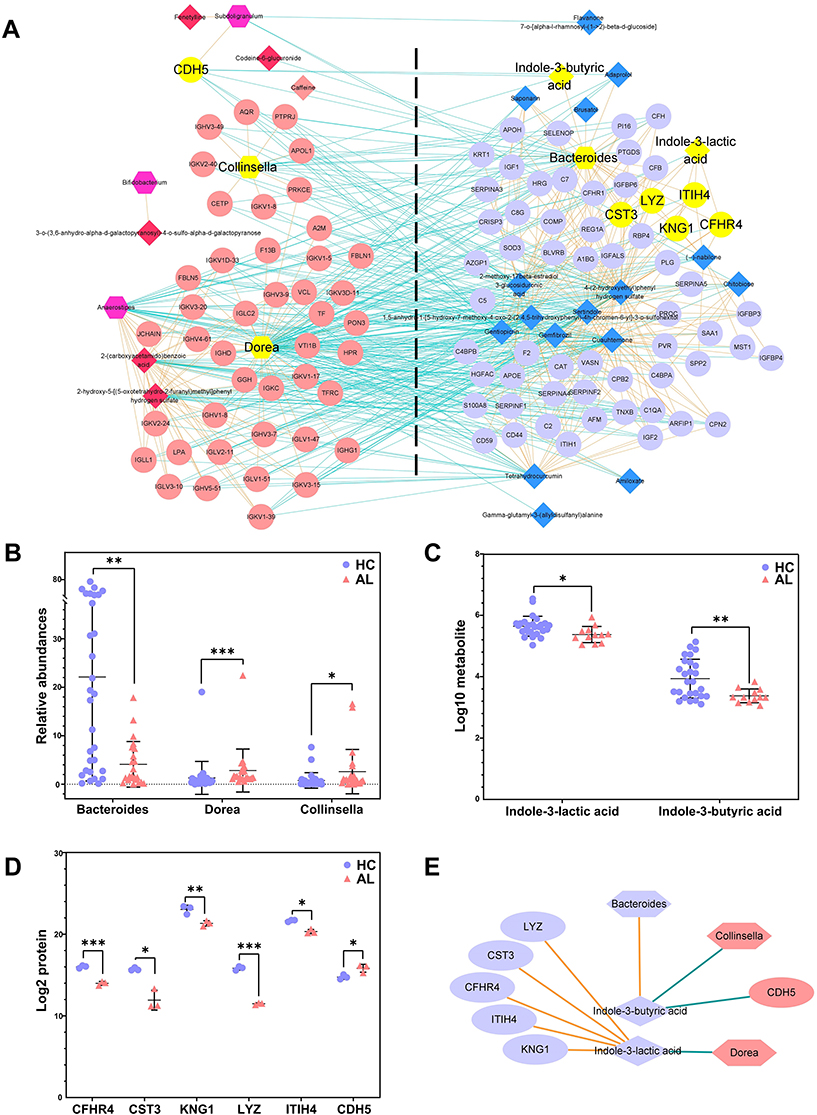 |
Figure 4 The network of the differential predominant GM genera, the related urine metabolites and the related plasma proteins. (A) The cooccurrence network of all differential predominant GM genera, the related urine metabolites and the related plasma proteins. Nodes in different shapes represent the different types of indicators, hexagon represents the GM genus, diamond represents the urine metabolite and ellipse represents the plasma protein. The nodes on the left were enriched in the AL group, while the nodes on the right were enriched in the HC group. The Orange connections represent positive correlations, and the green connections represent negative correlations. The yellow nodes are the key genera/metabolites/proteins. (B) The relative abundances of key genera. (C) The concentrations of presentative metabolites. (D) The concentrations of presentative proteins. (E) The correlations of the key genera, metabolites and proteins. Different shapes represent the different types of indicators, and connections in different colors represent positive (Orange) or negative (green) correlations; different colors in the scatter plot represent different groups. *P<0.05, **P<0.01, ***P<0.001. Abbreviations: HC, healthy control; AL, allergic; GM, gut microbiota. |
IBA and ILA Inhibited the LPS-Induced Upregulation of Allergy-Related Cytokines in Macrophages
To investigate whether IBA and ILA play roles in the pathogenesis of allergy, macrophage differentiated from THP-1 cell line was used to test the impact of indole derivatives on the expression of IL-4, IL-6 and IL-13 after LPS stimulation. We found that IBA significantly inhibited LPS-induced upregulation of IL-4 and IL-6 mRNA, and ILA suppressed the expression of IL-6 mRNA (Figure 5A). IBA and ILA also reduced the protein levels of IL-6 in supernatant of LPS-treated macrophage (Figure 5B).
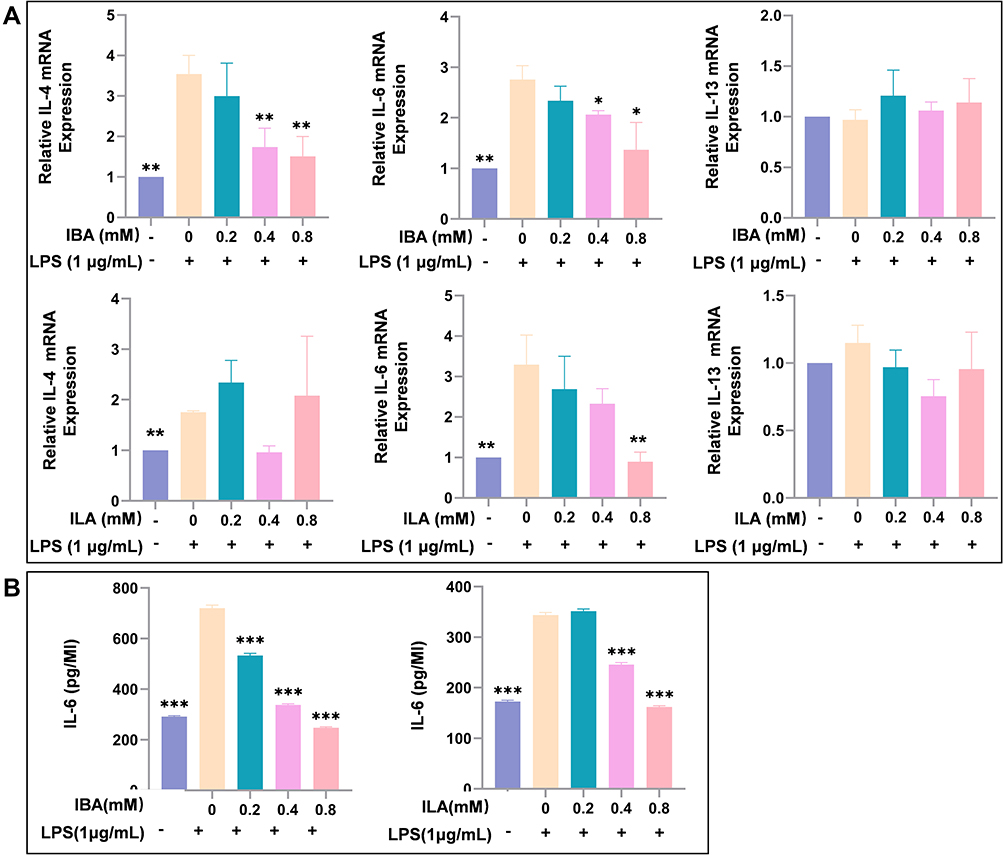 |
Figure 5 IBA and ILA inhibited the LPS-induced upregulation of allergy-related cytokines in macrophages. (A) The IBA and ILA reduced the mRNA expression of allergy-related ILs in LPS-stimulated macrophages. (B) The IBA and ILA reduced the secretion of IL-6 in the cell supernatants of macrophages. Compared to LPS-induced group, *P < 0.05, **P < 0.01, ***P < 0.001. Abbreviations: LPS, lipopolysaccharides; IBA, indole-3-butyric acid; ILA, indole-3-lactic acid; IL-4, Interleukin 4; IL-6, Interleukin 6; IL-13, Interleukin 13. |
Discussion
In the present study, we found that the GM structure in individuals with allergies was significantly different from that of healthy controls, with most α indexes (except for the Simpson index and Berger-parker index) increasing and β distances decreasing in allergic individuals. However, there was no significant difference between the acute and remissive allergic groups (Figure 1A–C and Supplementary Figure S1A and S1B). Three enterotypes were defined according to the predominant genera and there was a distribution difference between two groups. Type 1 (Blautia enterotype) was primarily distributed in the allergic group; while type 2 (Prevotella enterotype) and type 3 (Bacteroides enterotype) were mainly distributed in healthy individuals (Figure 1E and Supplementary Figure S1C), which were consistent with previous studies. Thus, in this study, we identified a significant difference in GM structure between allergic and healthy subjects; however, no difference was observed between allergic stages, which needs to be confirmed in a larger population study in the future.
The differential GM/urine metabolite/plasma protein profiles were constructed using multistatistical methods and could distinguish allergic individuals from healthy individuals, which included 44 core differential genera, 393 differential urine metabolites and 144 differential plasma proteins (Figure 2). Notably, some predominant genera that accounted for more than 10% of the total relative abundance, such as Bacteroides and Bifidobacterium, were also screened out as core differential genera. Generally, all of these differential genera, urine metabolites and plasma proteins might be outcomes or causes of allergies. The differences in the GM might be influenced by sex (or sex hormones), diet preferences (such as sour/cold/toast preference), metabolites/proteins in the plasma and possible allergy medications (Supplementary Tables S3 and S4). Furthermore, the difference in urine metabolites might result from GM metabolites or the metabolism of plasma proteins, and the differential plasma proteins might be the direct result of different diet preferences (cold preference) or could be the indirect result of differences in the GM and its metabolites (Supplementary Tables S7 and S8). However, previous studies have shown that the GM and its metabolites regulate the immune response in organisms. For example, SCFAs inhibit the synthesis and secretion of inflammatory cytokines by reducing the generation of 5-hydroxytryptamine through G-protein receptors on the membrane of enterochromaffin cells.13,14 So, alterations in GM and urine metabolites in allergies might influence the production of plasma proteins. The cooccurrence network among the three differential profiles was displayed in this study, and 634 significant correlations of the predominant genera, whose relative abundance was more than 1%, were visualized in Figure 4. There were complex networks among the metabolites, proteins and Bacteroides, which were enriched in the healthy subjects. In the allergic subjects, complex networks also existed among the metabolites, proteins and 5 other predominant genera, of which the core networks centered on ILA and IBA, and these two indole derivatives were further analyzed in the multiomics and cell experiments (Figures 4 and 5). IBA and ILA inhibited the LPS-induced upregulation of IL-4 and IL-6 in macrophages, which suggested that the decrease of indole derivatives might be involved in the pathogenesis of allergy (Figure 5).
As well-known metabolites in tryptophan metabolism in the GM, indole derivatives regulate the immune response by participating in the differentiation of immunocytes and the synthesis of cytokines via aryl hydrocarbon receptors.14 Indole acetic acid (IAA) and ILA can be produced by Bacteroides, Bifidobacterium, Clostridium and other predominant genera. IAA has been proven to promote the synthesis of IL-22, and ILA plays an important role in the balance of Th17/Treg cells by reprogramming CD4+ Th cells into CD4+CD8+ Treg cells and inhibiting the polarization of Th17 cells.15 In this study, ILA was decreased in the allergic group and negatively correlated with Dorea, which was significantly increased in patients with obesity, inflammatory bowel disease and autism, but its biological functions are still unknown.16–18 Anaerostipes appeared to be involved in tryptophan metabolism and ILA synthesis,15 although there was no significant correlations between this bacteria and ILA.
ILA was also positively correlated with LYZ, CST3, CFHR4, ITIH4 and KNG1 in the plasma. As an important participant in innate immunity, LYZ suppressed the proliferation of both Gram-negative and Gram-positive bacteria by catalyzing the hydrolysis of bacterial mucopolysaccharide and blocked viral replication during the late stage of infection by hydrolyzing structural proteins. However, the role LYZ plays in allergies is still unclear. Consistent with this study, it was reported that LYZ was decreased in nasal lavage from patients with chronic rhinitis sinusitis.19 Thus, the down-regulation of LYZ might be a feature of immunologic dissonance in allergic individuals. CST3 protects organisms from viruses, bacteria and parasites by regulating the antigen presentation process through inhibition of cysteine protease and modulating the functions of neutrophils and dendritic cells, which also affect allergies by regulating the classical complement pathway via C4 and activating mast cells.20 A decrease in CST3 in the allergic group was also observed in this study. CFHR4 recruits C-reactive proteins via its N-terminus to opsonize necrotic cells.21 CFHR4 also activates mast cells to promote allergies by activating the complement pathway as a platform for the assembly of an alternative C3 convertase pathway.22 As a key inhibitor of proteolytic enzymes, ITIH4 plays an important role in maintaining the reticular framework of the extracellular matrix and is used as a prognostic biomarker of various cancers in the clinic due to its correlation with the migration of tumour cells.23,24 We speculate that ITIH4 might also participate in the migration and infiltration of immune cells in allergies. KNG1 is synthesized in hepatocytes and functions as a precursor of the kallikrein kinin system to regulate cardiovascular and renal function by regulating blood pressure. KNG1 also inhibits the proliferation of colorectal cancer and glioma cells by inhibiting angiogenesis and promoting apoptosis.25,26 In the present study, we found that KNG1 was downregulated in allergic subjects, which might be related to the antiapoptotic status of immune cells in allergies.27
As the long chain modality of IAA, IBA has mostly been studied as a plant growth hormone. Luis et al identified IBA in the medium supernatant of Azospirillum brasilense UAP 154 culture but did not further explore the synthesis mechanism.28 However, except for involving in severe hypoglycemia in mice,29 the comprehensive biological activity of IBA is still unclear, and it is presumable that IBA might be a ligand of the aryl hydrocarbon receptors. In this study, IBA was positively correlated with Bacteroides and negatively correlated with Collinsella. Bacteroides has been confirmed to produce IAA,15 but no evidence has shown that it can produce IBA. Collinsella is a lactic acid producer,30 but it is unknown whether Collinsella can produce IBA. IBA was negatively correlated with CDH5, which plays important roles in the angiogenesis, maturation, stabilization and migration of various tumours, such as melanoma and breast cancer, as a major regulator of the adhesion of vascular endothelial cells.31 However, the correlation mechanism between CDH5 and IBA is still unknown, as well as the role of CDH5 in allergies.
In summary, tryptophan metabolism is significantly altered in individuals with allergies, which was confirmed by KEGG pathway mapping analysis (Figure 3), but the mechanism needs to be further explored in future studies.
Conclusions
The α indexes of GM structure in allergic individuals were increased and β distances were decreased. The levels of hundreds of urine metabolites and serum proteins were also different between allergic and healthy individuals, among which indole derivatives from tryptophan metabolism might play key roles in the progression of allergies and could serve as therapeutic targets of allergy.
Prospects
In this study, the 16S rDNA sequencing, metabolomics and proteomics analyses were performed based on different combinations of subjects, as the systematic collections of fecal, urine and plasma samples were very difficult, and the Spearman correlation between the two omics was constructed based on the subjects in common, which made most use of the related data. However, larger and more systematic studies still needed to be explored in the future.
Abbreviations
AL, allergic subjects; HC, healthy Control; BMI, body mass index; LPS, lipopolysaccharides; SCFAs, short-chain fatty acids; WBC, white blood cell; RBC, red blood cell; HGB, hemoglobin; HCT, red blood cell specific volume; PLT, platelet; MPV, mean platelet volume; MCV, mean corpuscular volume; PCT, Plateletcrit; MCH, mean corpuscular hemoglobin; MCHC, mean corpuscular hemoglobin concentration; NEUT, neutrophil; MONO, monocyte; EO, eosinophil; BASO, Basophils; RDW-SD, red cell distribution width-standard deviation; RDW-CV, red cell distribution width-coefficient variations; PDW, platelet distribution width; P-LCR, platelet-larger cell ratio; DH, lactate dehydrogenase; hsCRP, high sensitivity C-reactive protein; GM, gut microbiota; GLU, glutamate; TBA, total Bile Acid; CST3, Cystatin-C; β2-MG, β2-microglobulin; TP, total Protein; IgE, immunoglobulin-E; ITIH4, inter-alpha-trypsin inhibitor heavy chain H4; KNG1, Kininogen-1; IL-4, interleukin-4; IL-6, interleukin-6; IL-13, interleukin-13; LP (a), lipoprotein (a); IBA, indole-3-butyric acid; ILA, Indole-3-lactic acid; ALT, alanine aminotransferase; AST, aspartate aminotransferase; PCoA, principal component analysis; CK, creatine kinase; Ca2+, calcium; P, phosphorus; LYZ, lysozyme C; APOA1, apolipoprotein A1; ALB, albumin; KEGG, Kyoto Encyclopedia of Genes and Genomes; PCR, polymerase chain reaction; qPCR, real-time quantitative PCR detecting system; ELISA, enzyme-linked immunosorbent assay; PMA, 1-methoxy-2-propyl acetate; PFA, polyfluoroalkoxy.
Acknowledgments
For recruiting subjects, we are grateful to the physicians and nurses at the physical examination center, the Beijing University of Chinese Medicine Third Affiliated Hospital (Beijing, China). In addition, part of the research was conducted using the free online platform of Majorbio Cloud Platform (https://cloud.majorbio.com/, Shanghai Majorbio Bio-pharm Technology, Shanghai, China).
The authors acknowledge grants from National Key Research and Development Project (2019YFC1710104), National Natural Science Foundation of China (91942301, 82004249), the 111 Project (B21028) and Research Program from Beijing University of Chinese Medicine (2019-JYB-TD013).
Disclosure
All authors declare they have no conflicts of interest for this work.
References
1. Johanna P, Pinja I, Jasmin H, et al. Age-specific incidence of allergic and non-allergic asthma. BMC Pulm Med. 2020;20:9. doi:10.1186/s12890-019-1040-2
2. Leo G, Incorvaia C, Cazzavillan A, Consonni D, Zuccotti GV. Could seasonal allergy be a risk factor for acute rhinosinusitis in children. JLO. 2018;132(2):150–153. doi:10.1017/S0022215118000038
3. Mari S, Emi M, Koichi Y, Yuichi A, Hiroshi O, Akira A. The change in the prevalence of wheeze, eczema and rhino-conjunctivitis among Japanese children: findings from 3 nationwide cross-sectional surveys between 2005 and 2015. Allergy. 2019;74(8):1572–1575. doi:10.1111/all.13773
4. Jeng-Dau T, I-Chung W, Te-Chun S, Cheng Li L, Chang-Ching W. A 8-year population-based cohort study of irritable bowel syndrome in childhood with history of atopic dermatitis. J Invest Med. 2018;66(4):755–761. doi:10.1136/jim-2017-000631
5. Mohammad S, Vahab MN, Bita E, Jayran Z, Amirmohsen J. Association between papillary thyroid cancer and allergy: a case-control study. Int J Cancer. 2018;e69512. doi:10.5812/ijcm.69512
6. Joseph B, Russell S. Genetics, epigenetics, and allergic disease: a gun loaded by genetics and a trigger pulled by epigenetics. Allergy Asthma Proc. 2019;40(2):73–75. doi:10.2500/aap.2019.40.4206
7. Julge K, Vasar M, Bjorksten B. Development of allergy and IgE total serum during the first 5 years of life in Estonian children. Clin Exp Allergy. 2002;31(12):1854–1861. doi:10.1046/j.1365-2222.2001.01235.x
8. Jeffrey GD. Climate change and the impact on respiratory and allergic disease: 2018. Curr Allergy Asthm Rep. 2018;18(4):22. doi:10.1007/s11882-018-0777-7
9. Ian K, Raymond P. Household chemicals, immune function, and allergy: a commentary. J Immunotoxicol. 2013;10(2):169–172. doi:10.3109/1547691X.2012.707696
10. Bjorksten B, Sepp E, Julge K, Voor T, Mikelsaar M. Allergy development and the intestinal microflora during the first year of life. J Allergy Clin Immunol. 2001;108(4):516–520. doi:10.1067/mai.2001.118130
11. Lieke WJE, Johan G, Remy B, Valerie V. Shaping the gut microbiota by breastfeeding: the gateway to allergy prevention. Front Pediatr. 2019;7:47. doi:10.3389/fped.2019.00047
12. Pannipa K, Pantipa C, Anchalee S, et al. Alteration of gut microbiota and microbial products in distinct allergic phenotypes: data from an Asian birth cohort study. J Allergy Clin Immunol. 2020;145(2):AB64. doi:10.1016/j.jaci.2019.12.725
13. Christopher SR, Charles ES, John FR, et al. Gut microbes promote colonic serotonin production through an effect of short-chain fatty acids on enterochromaffin cells. FASEB J. 2015;29(4):1395–1403. doi:10.1096/fj.14-259598
14. Allison A, Julien P, Harry S. Gut microbiota regulation of tryptophan metabolism in health and disease. Cell Host Microbe. 2018;23(6):716–724. doi:10.1016/j.chom.2018.05.003
15. Henrik MR, Tine RL. Microbial tryptophan catabolites in health and disease. Nat Commun. 2018;9(1):3294. doi:10.1038/s41467-018-05470-4
16. Filip O, Louise B, Ulrika E, et al. Connection between BMI-related plasma metabolite profile and gut microbiota. J Clin Endocrinol Metab. 2018;103(4):1491–1501. doi:10.1210/jc.2017-02114
17. Eleco CB, Laenen Y, Wijk F, Zoete M, Oldenburg B. IgA coating of intestinal microbiota is associated with inflammatory bowel disease in twin pairs discordant for inflammatory bowel disease. J Crohns Colitis. 2020;14(Suppl 1):S010–S011. doi:10.1093/ecco-jcc/jjz203.009
18. Xue D, Yiran X, Xiaoli Z, et al. Gut microbiota changes in patients with autism spectrum disorders. J Psychiatr Res. 2020;129:149–159. doi:10.1016/j.jpsychires.2020.06.032
19. Marc AT, Martin L, Marcos RD, Mark S. Proteomics of nasal mucus in chronic rhinosinusitis. Am J Rhinol. 2007;21(6):680–685. doi:10.2500/ajr.2007.21.3103
20. Natalia W, Ewa M. Cystatin C–modulator of immune processes. Przegl Lek. 2010;67(7):484–487.
21. Michael M, Hebecker M, Huber-Lang M, Dahse R, Peter FZ. Human factor H-related protein 4 (CFHR4) recruits C-reactive protein to the surface of necrotic cells. Wien Klin Wochenschr. 2008;120:56–57.
22. Mario H, Mihaly J. Factor H-related protein 4 activates complement by serving as a platform for the assembly of alternative pathway C3 convertase via its interaction with C3b protein. J Biol Chem. 2012;287(23):19528–19536. doi:10.1074/jbc.M112.364471
23. Xiao J, Xiao-Yan B, Bowen L, et al. Plasma inter-alpha-trypsin inhibitor heavy chains H3 and H4 serve as novel diagnostic biomarkers in human colorectal cancer. Dis Markers. 2019:5069614. doi:10.1155/2019/5069614
24. Min H, Wei Z, Bingbing Z, Li L. Relationship between inter-α-trypsin inhibitor heavy chain 4 and ovarian cancer. Chinese J Cancer Res. 2019;31(6):955–964. doi:10.21147/j.issn.1000-9604.2019.06.11
25. Jing W. Identification of Kininogen-1 as a serum biomarker for colorectal cancer using CLINPROT TM technology. Southern Medical University; 2012.
26. Jinfang X, Jun F, Zhonghao C, et al. Overexpression of the Kininogen-1 inhibits proliferation and induces apoptosis of glioma cells. J Exp Clin Cancer Res. 2018;37:180. doi:10.1186/s13046-018-0833-0
27. Ankur D, Saibal M, Omar FSM, et al. Unravelling the apoptotic mechanisms in T-lymphocytes in an animal model for pollen induced airway allergy and studying the impact of specific immunotherapy. Immunobiology. 2019;224(2):183–195. doi:10.1016/j.imbio.2018.11.008
28. Martínez-Morales LJ, Soto-Urzúa L, Baca BE, et al. Indole-3-butyric acid (IBA) production in culture medium by wild strain Azospirillum brasilense. Fems Microbiol Lett. 2003;228(2):167–173. doi:10.1016/S0378-1097(03)00694-3
29. Murray NS, Khalil GW, Robert CB, Richard HD. Role of tryptophan metabolites in the hypoglycemia associated with neoplasia. Cancer. 1966;19(1):127–133. PMID: 5901402. doi:10.1002/1097-0142(196601)19:1<127::aid-cncr2820190114>3.0.co;2-5
30. Xiumei L, Chengwei Z, Miao L. Metagenomics analysis of intestinal flora microbes in patients with Behcet Syndrome. J Mol Diagn Therapy. 2020;12(1):27–30.
31. Casal JI, Ruben AB. Beyond N-cadherin, relevance of cadherins 5, 6 and 17 in cancer progression and metastasis. Int J Mol Sci. 2019;20(13):3373. doi:10.3390/ijms20133373
 © 2022 The Author(s). This work is published and licensed by Dove Medical Press Limited. The full terms of this license are available at https://www.dovepress.com/terms.php and incorporate the Creative Commons Attribution - Non Commercial (unported, v3.0) License.
By accessing the work you hereby accept the Terms. Non-commercial uses of the work are permitted without any further permission from Dove Medical Press Limited, provided the work is properly attributed. For permission for commercial use of this work, please see paragraphs 4.2 and 5 of our Terms.
© 2022 The Author(s). This work is published and licensed by Dove Medical Press Limited. The full terms of this license are available at https://www.dovepress.com/terms.php and incorporate the Creative Commons Attribution - Non Commercial (unported, v3.0) License.
By accessing the work you hereby accept the Terms. Non-commercial uses of the work are permitted without any further permission from Dove Medical Press Limited, provided the work is properly attributed. For permission for commercial use of this work, please see paragraphs 4.2 and 5 of our Terms.