")
Back to Journals » Journal of Inflammation Research » Volume 15
The Multi-Omics Analysis of Key Genes Regulating EGFR-TKI Resistance, Immune Infiltration, SCLC Transformation in EGFR-Mutant NSCLC
Authors Wang Z, Zhang L, Xu W, Li J, Liu Y, Zeng X, Zhong M, Zhu Y
Received 29 September 2021
Accepted for publication 7 January 2022
Published 2 February 2022 Volume 2022:15 Pages 649—667
DOI https://doi.org/10.2147/JIR.S341001
Checked for plagiarism Yes
Review by Single anonymous peer review
Peer reviewer comments 2
Editor who approved publication: Dr Monika Sharma
Zhi Wang,1 Lingling Zhang,1 Wenwen Xu,1 Jie Li,1 Yi Liu,1 Xiaozhu Zeng,1 Maoxi Zhong,1 Yuxi Zhu1,2
1Department of Oncology, The First Affiliated Hospital of Chongqing Medical University, Chongqing, 400042, People’s Republic of China; 2Department of Oncology, Jinshan Hospital of the First Affiliated Hospital of Chongqing Medical University, Chongqing, 400042, People’s Republic of China
Correspondence: Yuxi Zhu, Tel +86-23-88955813
, Fax +862368811487
, Email [email protected]
Background: Lung cancer is a high-risk malignancy worldwide. The harboring of epidermal growth factor receptor (EGFR) mutations in non-small cell lung cancer (NSCLC) makes EGFR-tyrosine kinase inhibitor (EGFR-TKI) an attractive therapeutic option. However, patients usually suffer the primary and secondary resistance to EGFR-TKI. And the molecular alteration is still not fully clear and needs further study.
Methods: The GEO database was utilized to find the differentially expressed genes (DEGs) in NSCLC profiles resistant to the 1st or 2nd generation EGFR-TKI. We analyzed the expression and pathway enrichment of hub genes, and the prognosis of EGFR mutant/wild-type lung adenocarcinoma (LUAD). Moreover, small cell lung cancer (SCLC) and TKI-resistant profiles were used to find common DEGs, and construct miRNA regulatory network. Analysis was performed of hub genes’ related immune infiltration, drug sensitivity, and methylation. Further, we analyzed hub gene expression in EGFR-mutant LUAD and paracancerous tissue by qRT-PCR.
Results: A total of 107 DEGs were found related to TKI resistance. Eleven hub genes were obtained after visualization, of which 5 hub genes were co-expressed in SCLC with common miRNAs. Lower expression of SPP1 (hub gene) was associated with better survival in NSCLC. The immune infiltration analysis showed more CD4+ T cells in the resistant group with high expression of SPP1. SPP1 and CD44 promoters’ methylations were independent prognostic factors of LUAD. And the expression level of SPP1 related to the sensitivity of EGFR-TKIs in multiple cancer cell lines. qRT-PCR validated the higher expression of SPP1 in EGFR-mutant LUAD than in normal tissue.
Conclusion: Our study suggested that the upregulation of SPP1 might induce resistance to the 1st and 2nd generation EGFR-TKI, and influence tumor immune infiltration, resulting in poor survival. ZEB1, SPP1, MUC1, CD44, and ESRP1 might be molecular drivers of SCLC transformation of TKI resistance.
Keywords: bioinformatics analysis, drug resistance, epidermal growth factor receptor, non-small cell lung cancer, small cell lung cancer transformation, immune cell infiltration
Introduction
Lung cancer is one of the most common malignant tumors in the world, and approximately 80% of lung cancer is NSCLC.1 Although the efficacy of treatment for advanced NSCLC is still not satisfactory, the prognosis of NSCLC increased gradually during recent years because of the emerging new molecular targeting medicines.2 The successful treatment of EGFR mutation by EGFR-TKI is almost the milestone of precision medicine in NSCLC. It could be used as a first-line treatment for advanced NSCLC harboring TKI-sensitive EGFR mutations. TKI is superior to chemotherapy in terms of progression-free survival and response rate. When combined, TKI and chemotherapy might further improve overall survival.3 However, patients would suffer from drug resistance after taking TKI for about 9–14 months.4,5 Although some resistance-related alterations have already been found, such as T790M of 20th exon,6 MET amplification,7 transforming to SCLC,8 and so on, the resistance mechanisms of the 1st or 2nd generation of EGFR-TKI (gefitinib, afatinib, etc.) are still not completely clear. Therefore, it is urgently needed to estimate some new biomarkers to predict EGFR-TKIs resistance, and facilitate the best choice of treatment in clinical practice.
Cancer-associated immune cell infiltration in the tumor microenvironment could lead to tumor growth, metastasis, and therapy resistance. The immune and inflammatory cells include lymphocytes, neutrophils, monocytes, tumor-associated macrophages, and so on. EGFR-TKIs could regulate tumor-infiltrating immune cells of EGFR-mutant NSCLC, and tumor-infiltrating CD8+ lymphocytes significantly decreased after treatment.9 And such changes might associate with EGFR-TKI resistance, and provide clues for subsequent treatment like immune checkpoint inhibitors.
On the other hand, although NSCLC and SCLC have different pathological and genome characteristics, they might have a common cell source. It accounts for approximately 3–15% of resistance related to NSCLC transforming to SCLC.10 RB1 and TP53 loss,10 neuron-specific enolase (NSE),11 and plasma gastrin-releasing peptide (ProGRP)12 could be early predictive markers of NSCLC-to-SCLC transformation. And there might be other molecules driving the transformation.
Therefore, this study aims to explore whether there might be some DEGs linked to the resistance to both the 1st and 2nd generation of EGFR-TKIs, immune cell infiltration, and SCLC transformation by bioinformatics analysis and clinical checking samples. Moreover, we might find some mechanisms, and provide a new insight to overcome the resistance to EGFR-TKI. A study workflow is presented in Figure 1.
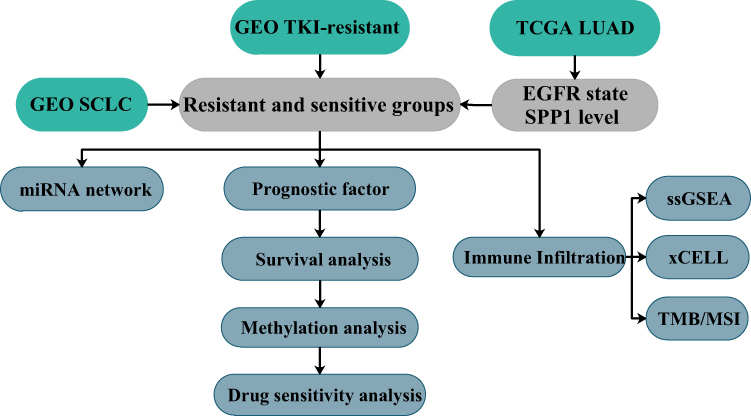 |
Figure 1 Study workflow. |
Materials and Methods
Access Data
Gene Expression Omnibus (GEO: www.ncbi.nlm.nih.gov/geo) belongs to the National Center for Biotechnology Information (NCBI), an affiliation of the National Institutes of Health (NIH).13 And GEO is one of the largest public gene expression data resources now. We selected 3 profiles of gefitinib, erlotinib, and afatinib from the GEO database for analysis: GSE12200514 based on GPL570 [HG-U133_Plus_2] Affymetrix Human Genome U133 Plus 2.0 Array, GSE3162515 based on GPL96 [HG-U133A] Affymetrix Human Genome U133A Array, and GSE6250416 based on GPL6947 Illumina HumanHT-12 V3.0 expression beadchip. GSE122005 (gefitinib) contained 3 resistant samples and 3 sensitive samples, GSE31625 (erlotinib) contained 28 samples and 18 sensitive samples, and GSE62504 (afatinib) contained 2 resistant samples and 1 sensitive samples.
Identification of DEGs
Firstly, we used GEO2R (GEO online tool) to search DEGs between EGFR-TKI-resistant tissue and sensitive tissue samples. The cut-off criteria for identifying DEGs were P<0.05 with the log FC ≥1 or ≤−1. And we used the Venn diagram to find common DEGs.
Functional Annotation of DEGs
Gene ontology (GO) covers three aspects: biological processes, molecular functions, and cellular components. Kyoto Encyclopedia of Genes and Genomes (KEGG) is a database resource for understanding high-level functions and utilities of the biological system. GO analysis of DEGs was performed by the DAVID v6.8 online tool (https://david.ncifcrf.gov/).17 Moreover, we used KEGG rest API (https://www.kegg.jp/kegg/rest/keggapi.html) to obtain the latest KEGG pathway gene annotation and used R package clusterProfiler for enrichment analysis.
Construction of PPI Network and Hub-Gene Extraction
A network could be built to show relationships among proteins by STRING database (https://string-db.org/).18 We used it to construct a PPI (protein–protein interaction) network for DEGs, used Cytoscape to visualize protein network, and extracted key modules in PPI network by MCODE.19 The gene that meets degree over 10 would be defined as the hub gene.
Hub Genes Expression Validation
We performed some expression analyses of hub genes by GEPIA (http://gepia.cancer-pku.cn/index.html).20 To further confirm results, we analyzed the protein expression of hub genes in normal lung and lung adenocarcinoma tissue microarrays by The Human Protein Atlas (http://www.proteinatlas.org/).21 The tissue microarray was stained by antibody HPA027541. LUAD patients’ tumor RNA-seq expression profiles, paired normal tissue samples, and clinical information were downloaded from The Cancer Genome Atlas (TCGA) database (https://portal.gdc.cancer.gov/). And EGFR wild or mutant samples were determined according to the prediction results of mutect2 software. Statistical analyses were performed by using R-4.0.4, and figures were implemented by R package ggplot2.
Prognostic Survival Analyses
We used GEPIA to perform survival analysis of hub genes. Furthermore, EGFR-mutant LUAD patients were divided into four groups according to the expression level of SPP1. Patients’ survival status and expression heatmap were drawn by R package ggrisk. The DSS (disease-specific survival) Kaplan–Meier analysis with log rank test was used to compare differences of survival curves by R package survival and survminer. Time-dependent ROC analysis was performed to compare the predictive accuracy of SPP1 by R package timeROC.
Analysis of Immune Cell Infiltration
Analysis was performed in TIMER (https://cistrome.shinyapps.io/timer/)22 of the correlations of SPP1 and immune cells infiltration level in LUAD. We divided LUAD patients in TCGA into EGFR mutant/wild-type and SPP1 high/low expression (median cutoff) groups. We utilized R package immunedeconv to find differential immune infiltrations between groups by integrating xCell algorithm.23 And we used ssGSEA to calculate the immune infiltration score for 28 kinds of immune cells of erlotinib-resistant and sensitive samples in GSE31625.24 The methods of anti-tumor immunity (cells regulate anti-cancer immune responses) and pro-tumor suppression (cells regulate immune suppressive functions) were referred from Jia et al’s recent publication.25 The relationship of erlotinib-resistant and sensitive samples’ anti-tumor immunity and pro-tumor suppression was estimated by Pearson’s correlation analysis. To better understand the relationship among various immune cells, we also calculated Pearson’s correlation coefficients among 28 immune cells to build the network. Finally, a box-plot was constructed to compare the difference of 28 immune cells between erlotinib-resistant and sensitive subgroups. All above immune analyses of GSE31625 were achieved by using R package GSVA.26
Kaplan–Meier Plotter Database Analysis
We performed survival analysis to estimate the relationship between immune cell infiltration and the expression level of SPP1 by KM Plotter (http://kmplot.com).27 LUAD patients were divided into decreased and enriched subgroups according to the difference of immune cell infiltration, and Kaplan–Meier survival analysis was used to evaluate the effect of SPP1 on patients’ prognosis. Statistical significance was defined as P value <0.05.
Co-Expression of SPP1, Relationship Between SPP1 and TMB/MSI
To further understand biological significance of SPP1 in LUAD, we performed the enrichment analysis of co-expressed genes of SPP1 in KEGG and Reactome pathway by GSEA in LinkedOmics (http://www.linkedomics.org/admin.php).28 We specifically estimated the expression relationship between SPP1 and PD-L1 (CD274). RNA-seq data of 33 kinds of tumor were downloaded from TCGA GDC data portal website (https://portal.gdc.cancer.gov/). For the methods of calculating tumor mutational burden (TMB) and microsatellite instability (MSI) we refer to 2 publications.29,30 R 4.0.4 was used for statistical analysis with a significant difference determined at P value <0.05.
Hub Genes of SCLC, TKIs Resistance and miRNA Network
We found SCLC profile to obtain DEGs between SCLC and normal tissues in GEO database: SCLC profile GSE149507 based on GPL23270 [HG-U133_Plus_2] Affymetrix Human Genome U133 Plus 2.0 Array, and GSE149507 contains 18 pairs of SCLC and adjacent lung tissues. And we used a Venn diagram to find co-expressed genes between SCLC and previous TKI resistance profiles. Thus, we might have genes related to SCLC transformation of TKI resistance. Additionally, we downloaded SCLC and NSCLC microRNA (miRNA) list, and got the common miRNAs of these two diseases from HMDD (the Human microRNA Disease Database) (http://www.cuilab.cn/hmdd/), which is a database that curated experiment-supported evidence for human miRNA and disease associations.31 And we predicted the interaction between transformation-related genes and common miRNAs by miRWalk (http://mirwalk.umm.uni-heidelberg.de/).32
Methylation and Prognostic Model of Hub Genes
The expression and DNA methylation of SPP1 in LUAD were analyzed by DNMIVD: DNA methylation interactive visualization database (http://119.3.41.228/dnmivd/index/). We used the prognostic model in DNMIVD to get CpGs related to 5 hub genes, and construct univariate, multivariate proportional hazards regression model. Kaplan–Meier plot was drawn by dividing patients into high-risk or low-risk groups based on the results of multiple proportional hazards regression model.33
Drug Sensitivity Analysis of SPP1
We downloaded data (Compound activity: DTP NCI-60, RNA: RNA-seq) from Cell Miner (https://discover.nci.nih.gov/cellminer/home.do).34 The NCI-60 is a panel of 60 diverse human cancer cell lines used to screen over 100,000 chemical compounds and natural products. Drug activity levels expressed as 50% growth-inhibitory levels (GI50) are determined by the Developmental Therapeutics Program (DTP). It defined the drug activity Z scores above 0 or below 0 indicating that cells are sensitive or resistant to some drugs, respectively. Cell Miner data analysis was performed by using R-4.0.4 to draw the scatter plot between SPP1 expression level and drug activity Z scores, and each one point means one of 60 various human cancer cell lines.
Real-Time Quantitative PCR
Total RNA was extracted and isolated from thirteen EGFR-mutant (19Del/21L858R) LUAD samples, eight of them associated with paired paracancerous tissue samples, by using the TRIzol method. Afterwards, RNA was reverse-transcribed into complementary DNA (cDNA) using the PrimerScript RT reagent kit (TaKaRa). The transcription level of SPP1 was measured by qRT-PCR according to the assay protocol (Bio-Rad CFX ConnectTM Real-Time Detection System). Glyceraldehyde-phosphate dehydrogenase (GAPDH) was used as internal control for mRNA normalization, and relative expression of target gene was quantified by using the 2-ΔΔCT method. The reference sample was the average of all paracancerous tissue samples. The unpaired t-test was used for intergroup comparisons. Results were considered statistically significant at P value <0.05.
Results
Identification of DEGs of TKI Resistance
In GEO database, we found three EGFR-TKI-resistant versus sensitive profiles, and DEGs of three profiles were analyzed by GEO2R. A Venn diagram was employed to get common DEGs, and in total 107 DEGs are identified in Figure 2A.
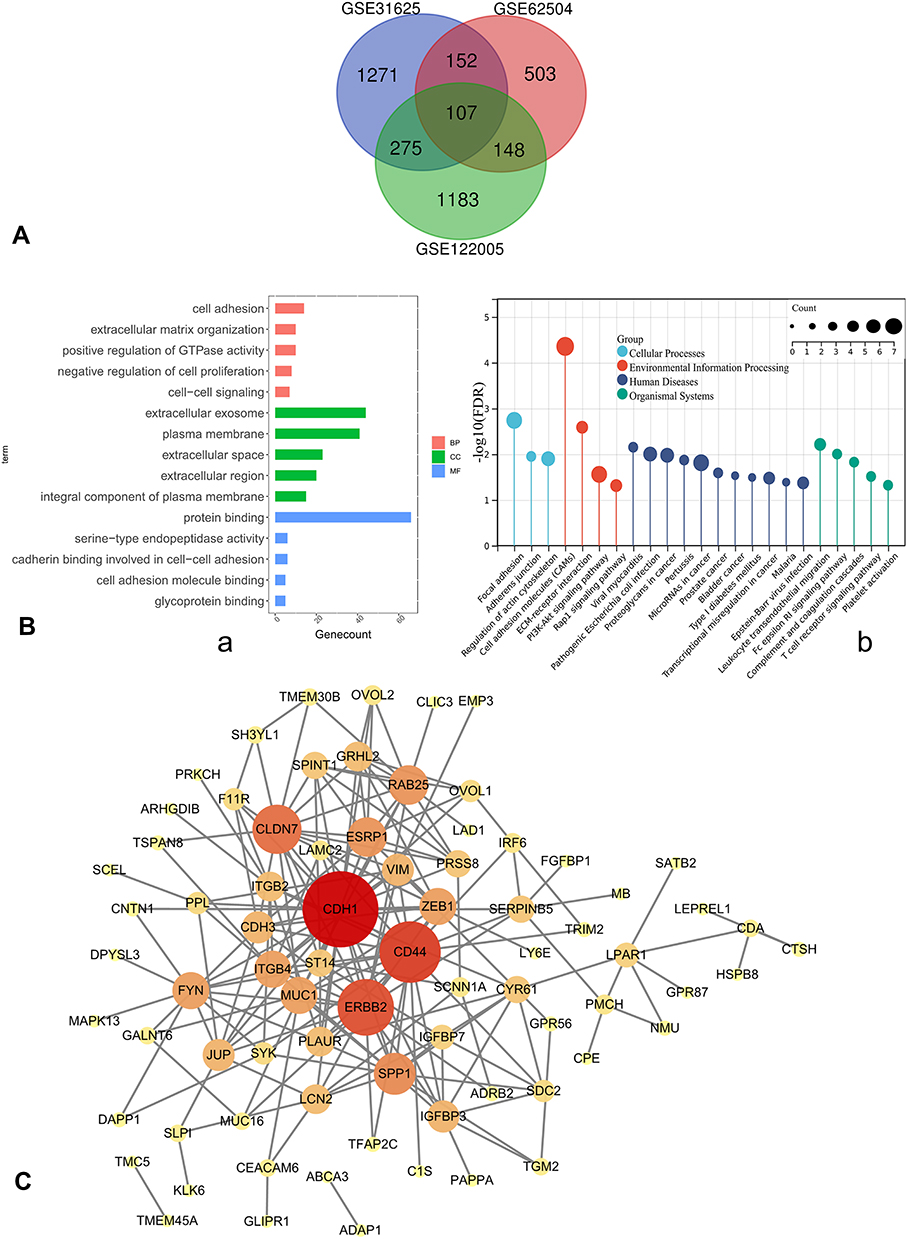 |
Figure 2 (A) Venn diagram, common DEGs of GSE122005, GSE31625, GSE62504. (B) a. GO enrichment; b. KEGG pathway annotation. (C) PPI network of DEGs was constructed in Cytoscape; the greater the degree of correlation between genes, the larger the circle and darker the colors. Abbreviations: DEGs, differentially expressed genes; GO, gene ontology; KEGG, Kyoto Encyclopedia of Genes and Genomes; BP, biological processes; CC, cellular components; MF, molecular functions; PPI, protein–protein interaction. |
GO and KEGG Pathway Enrichment of DEGs
The results showed that DEGs were mainly enriched in cell adhesion, extracellular matrix organization, positive regulation of GTPase activity, negative regulation of cell proliferation, and cell−cell signaling for biological processes. Cellular components were significantly enriched in extracellular exosome, plasma membrane, extracellular space, extracellular region, and integral components of plasma membrane, and molecular functions were significantly enriched in protein binding (Figure 2B-a). And KEGG pathway analysis of DEGs showed that they were associated with cell adhesion molecules, focal adhesion, microRNAs in cancer, PI3K-Akt signaling, T cell receptor signaling, and so on (Figure 2B-b).
DEGs PPI Network
PPI network of DEGs was constructed by STRING database (Supplementary Figure 1), and visualized in Cytoscape. MCODE extracted four key modules (Supplementary Figure 2); the greater the degree of correlation among genes, the larger the circle and darker the colors (Figure 2C). Finally, we found 11 highly connected genes (hub genes): RAB25, CD44, SPP1, ITGB4, ESRP1, FYN, CDH1, ERBB2, CLDN7, ZEB1, and MUC1. The expression of ZEB1 and SPP1 was up-regulated in three profiles. On the other hand, RAB25, ERBB2, ESRP1, ITGB4, MUC1, CLDN7, and CDH1 were down-regulated in three profiles. CD44 and FYN were both decreased in erlotinib- and gefitinib-resistant profiles and increased in afatinib-resistant profile.
Hub Gene Expression and Survival Analyses
Next, we analyzed the expression level of hub genes on GEPIA. The expression level of RAB25, ERBB2, SPP1, CDH1, ESRP1, and ITGB4 was significantly higher, and that of of ZEB1 and FYN was significantly lower in lung adenocarcinoma compared to normal tissue, respectively (Figure 3A). And lower expression of SPP1 and ITGB4 related to better overall survival both in LUAD and LUSC patients compared to higher expression. On the other hand, the simultaneously high expressions of SPP1 and ZEB1 were associated with poor overall survival in LUAD and LUSC patients compared to low expression (Figure 3B). Therefore, we thought that SPP1 was of great significance in the survival of NSCLC.
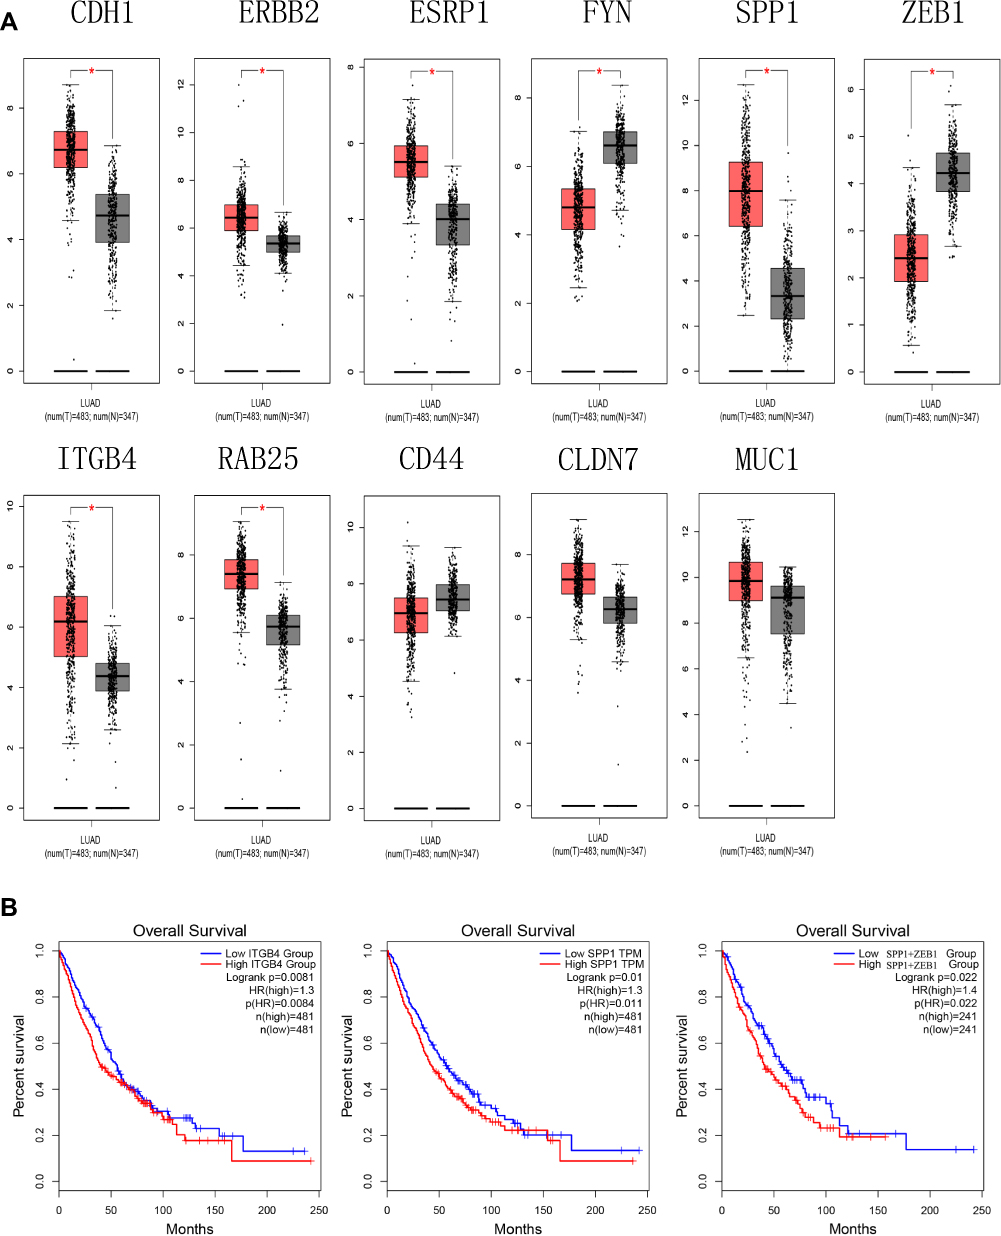 |
Figure 3 (A) The expression level of hub genes in lung adenocarcinoma and normal tissues in GEPIA (*P < 0.01). (B) Survival analysis. Expression level of SPP1 and ITGB4 was related to the overall survival of LUAD and LUSC patients (P < 0.05), expression level of SPP1+ZEB1 was related to overall survival of LUAD and LUSC patients (P < 0.05). Abbreviation: GEPIA, gene expression profiling interactive analysis. |
The Expression of SPP1 in Pan-Cancers and Prognostic Potential
Thus, we investigated the expression of SPP1 in pan-cancers. The expression of SPP1 was significantly higher in multiple kinds of tumor tissues compared with their cognate normal tissues (Figure 4A). Based on the staining of SPP1 protein in tissue microarray, SPP1 was mainly located in cytoplasm. And the staining was moderate in lung adenocarcinoma cells, and low in normal lung tissue cells according to the results of HPA database (Figure 4B). And we compared SPP1 expression in EGFR-mutant, wild-type of LUAD, and normal samples from TCGA. The expression level of SPP1 was significantly higher in the EGFR-mutant LUAD compared to the other two types (Figure 4C). According to the expression level of SPP1, we divided EGFR-mutant LUAD patients into four groups (Figure 5A). Among them, the lowest expression group had the longest DSS. The median survival time of 25–50% and 50–75% group was 3.8 years and 3.2 years, respectively (Figure 5B). And the AUC of the 3-year ROC is 0.762 (Figure 5C). Therefore, the expression level of SPP1 might be a prognostic factor in EGFR-mutant lung adenocarcinoma.
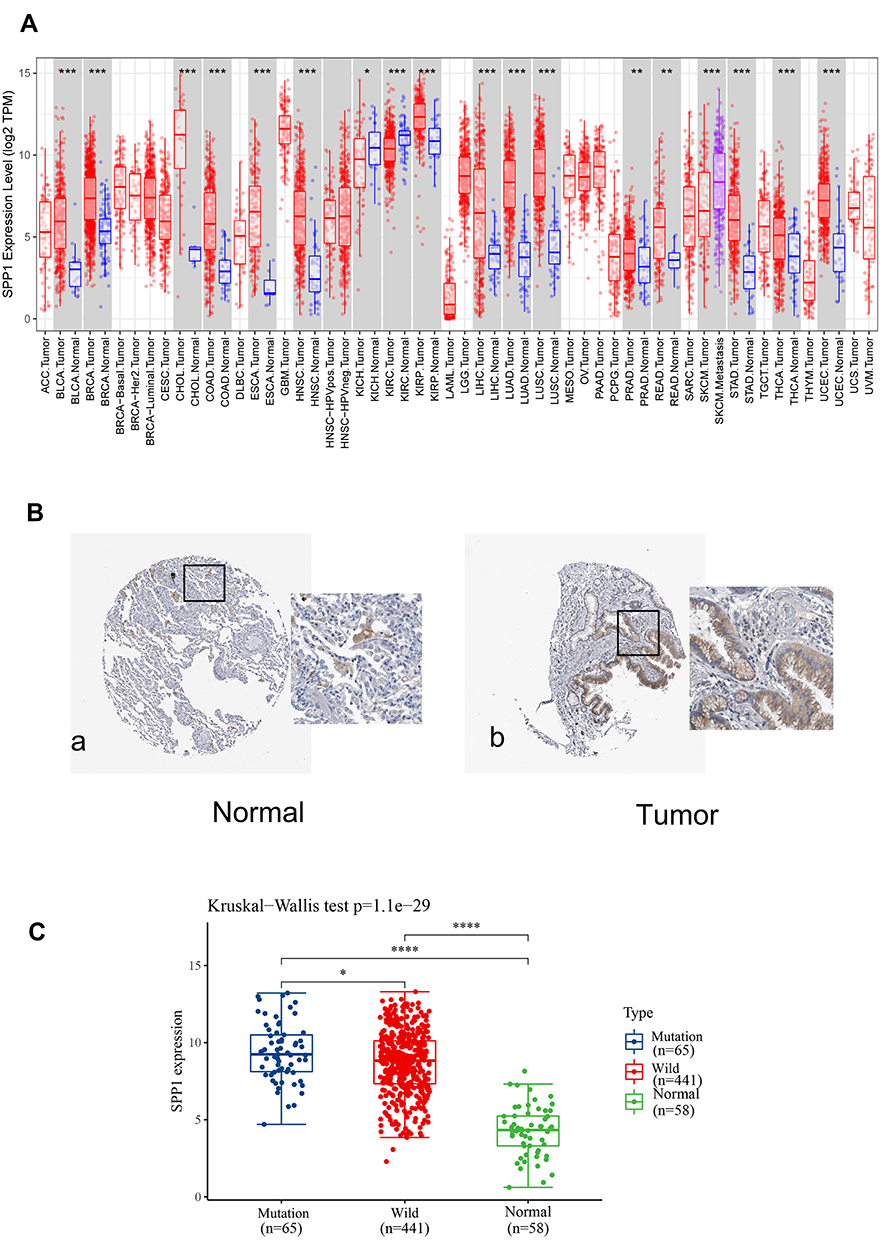 |
Figure 4 (A) Validation of the SPP1 expression in multiple tumors. (B) Validation of the SPP1 expression by the Human Protein Atlas database. a. SPP1 of immunohistochemistry in normal lung tissue; b. SPP1 of immunohistochemistry of LUAD tissue. (C) SPP1 expression in EGFR-mutant/wild LUAD and normal groups from TCGA. P value significant codes: *P < 0.05, **P < 0.01, ***P < 0.001, ****P < 0.0001. |
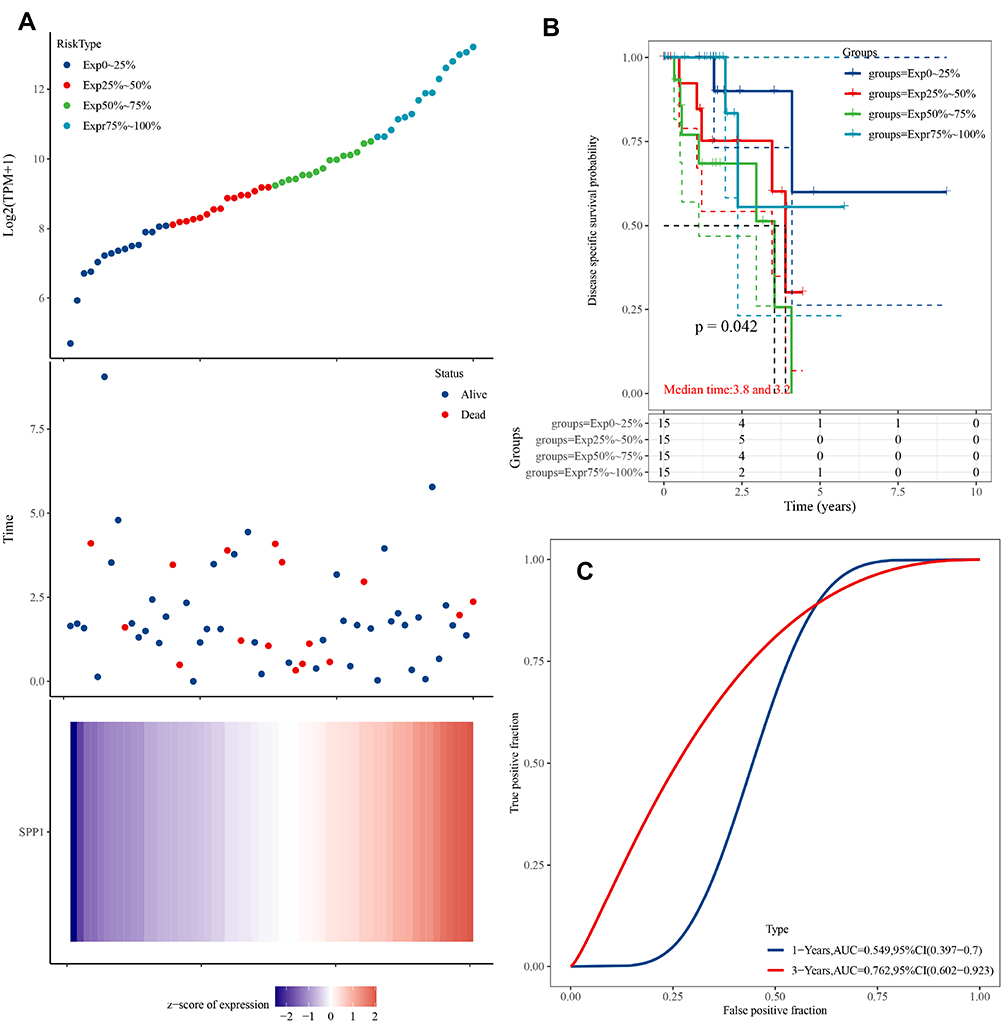 |
Figure 5 (A) Upper panel: The scatter plot of SPP1 expression from low to high, different colors represent different expression groups; Middle panel: The survival time and survival status of patients; Lower panel: Heatmap of SPP1 in EGFR-mutant LUAD. The abscissas of the upper, middle, and lower panels all represent same samples. (B) Kaplan–Meier survival analysis of SPP1. (C) Time-dependent ROC analysis of SPP1. |
Immune Landscape of EGFR-Mutant/Wild and TKI-Resistant Groups
We further analyzed the degree of immune cell infiltration related to prognostic hub gene expression of lung adenocarcinoma by TIMER database. There was a positive correlation between the expression of SPP1 and the infiltration of macrophage, neutrophil, and dendritic cells (Figure 6A). xCell results showed that the abundance of CD8+ T cells and CD4+ Th2 was lower in LUAD patients with EGFR mutation compared to wild-type (Figure 6B). There were more macrophage M1 and CD4+ Th2 cells, and fewer CD8+ T cells in LUAD patients with high expression of SPP1 compared to low expression (Figure 6C). These results might suggest that SPP1 could regulate tumor immune tolerance and immune escape. Immune infiltration landscape is shown in Figure 7A. Two categories of immunity ability (anti-tumor immunity and pro-tumor suppression) were positively associated (R=0.5438, P<0.001) in Figure 7B. The correlation heatmap (Figure 7C) revealed that effector memory CD4 T cells, NK T cells, MDSC (myeloid-derived suppressor cells), and Th2 T cells were moderately or highly correlated. We compared the differences between each kind of immune cells and erlotinib-sensitive and resistant samples in Figure 7D. We found fewer CD8+ T cells and natural killer cells, and more CD4+ T cells in the resistant group compared to the sensitive group.
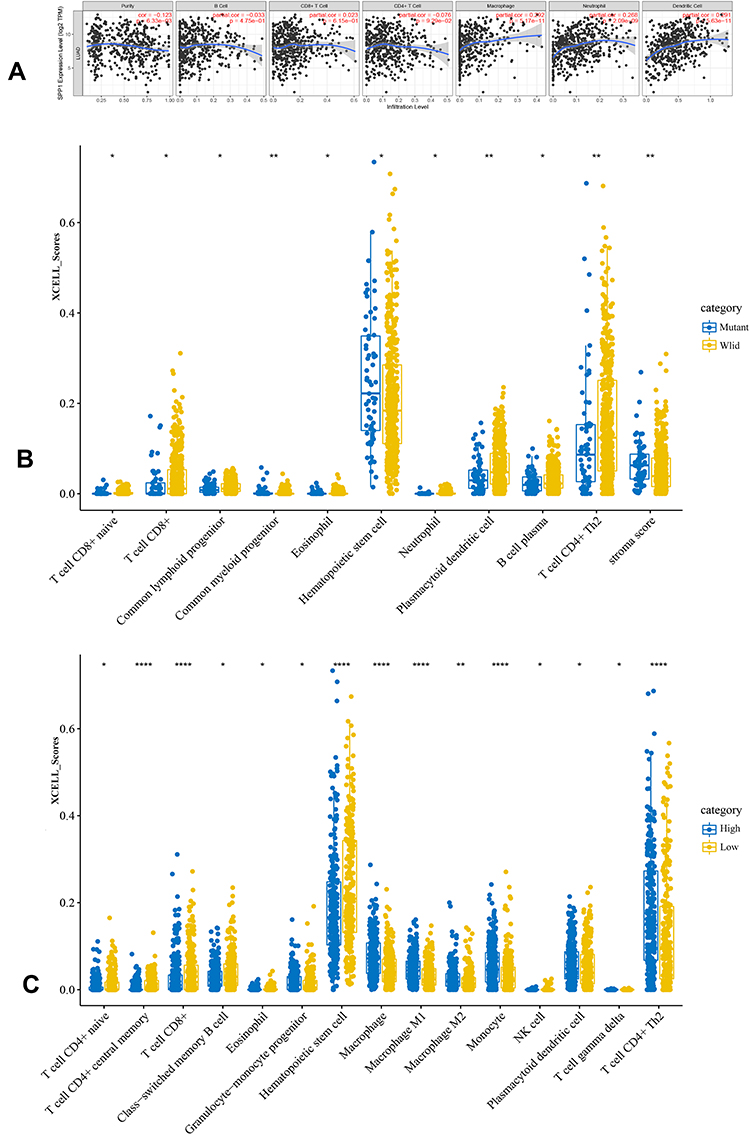 |
Figure 6 (A) The relationship of SPP1 expression level and tumor immune infiltration level. (B) The immune scores distribution of EGFR-mutant and wild-type in LUAD. Blue color represents EGFR-mutant group, yellow represents EGFR-wild group. (C) The immune scores distribution of SPP1 high and low expression in LUAD. Blue color represents SPP1 high group, yellow represents SPP1 low group. P value significant codes: *P < 0.05, **P < 0.01, ****P < 0.0001. |
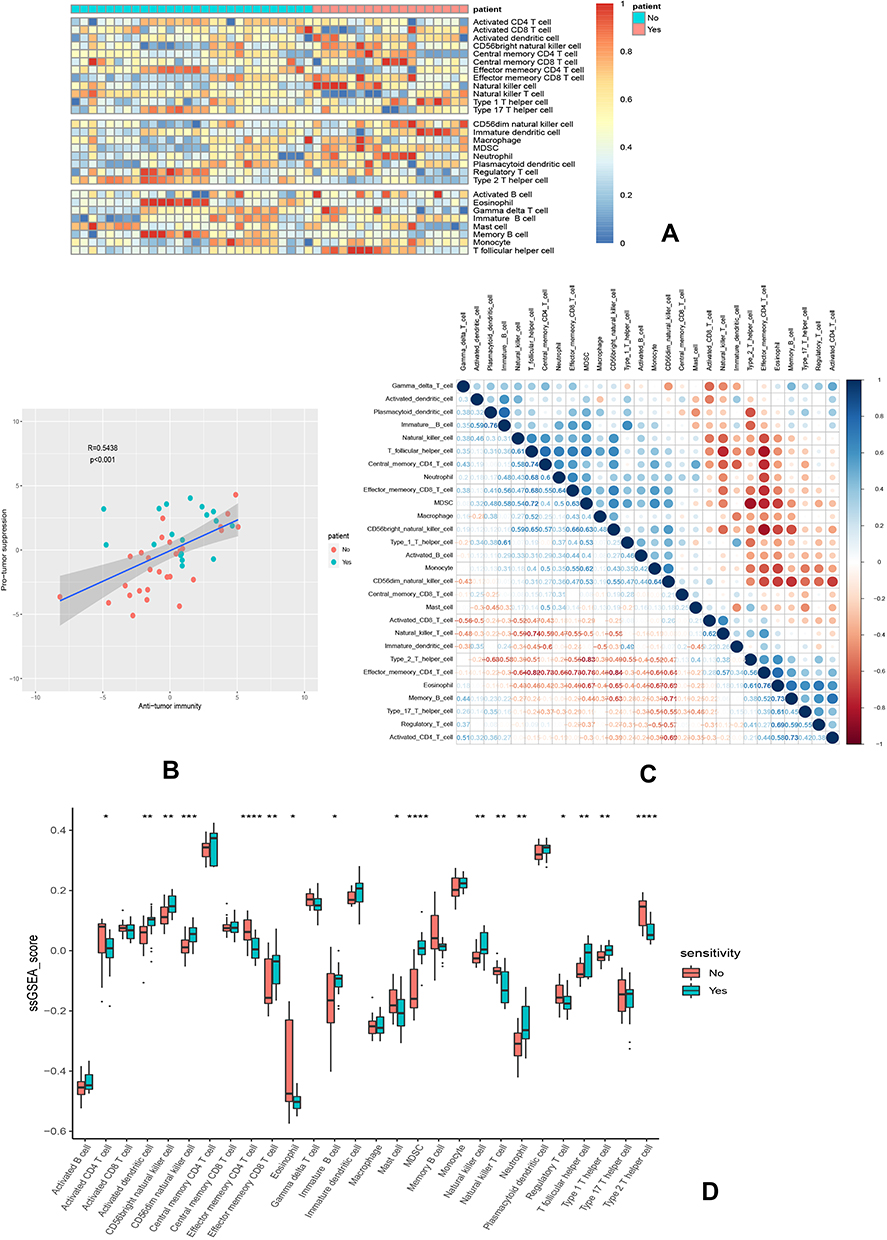 |
Figure 7 Immune landscape of GSE31625. (A) Heatmap of two subtypes from the GSE31625 based on ssGSEA scores calculated from 28 immune cells. (B) Correlation between anti-tumor immunity and pro-tumor immune suppressive functions; R: coefficient of Pearson’s correlation; the shaded area represents 95% confidence interval. (C) Correlation of 28 immune cells. (D) The relative immune infiltration scores of 28 immune cells between erlotinib-sensitive and resistant groups. P value significant codes: *P < 0.05, **P < 0.01, ***P < 0.001, ****P < 0.0001. |
Prognostic Analysis of SPP1 with Immune Cells in LUAD
We performed prognosis analyses based on the expression of SPP1 in related immune cell-enriched or depleted LUAD subgroups (Figure 8A). LUAD patients with high expression of SPP1 and decreased infiltration of basophils, CD4+ memory T cells, CD8+ memory T-cells, and regulatory T-cells had poor prognosis. And LUAD patients enriched in eosinophils, mesenchymal stem cells, natural killer T-cells, and type 1 T-helper cells with high expression of SPP1 had poor prognosis too. What is more, LUAD patients with high expression of SPP1 had significantly poorer prognosis with whatever infiltration level of B-cells and macrophages. These results indicated that SPP1 might be an effective prognosis marker of LUAD with different immune infiltration.
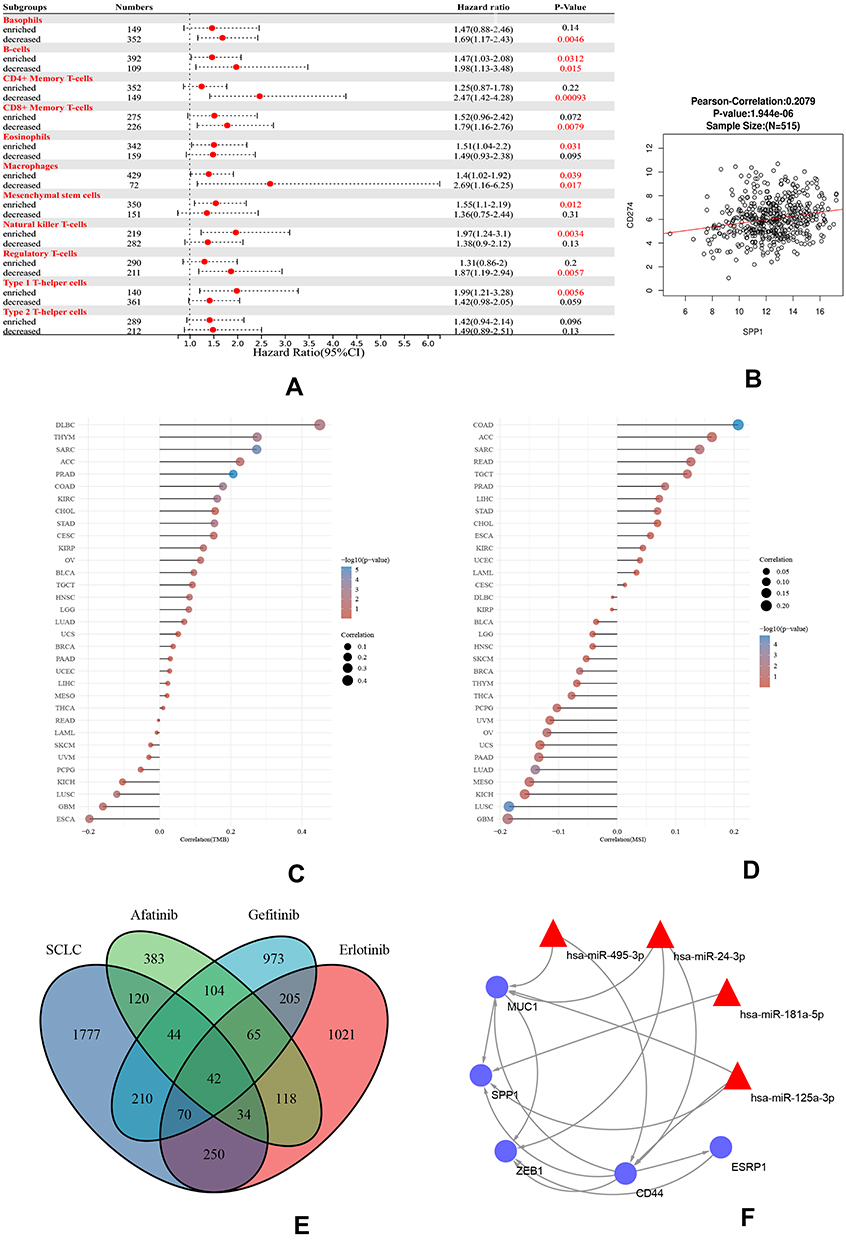 |
Figure 8 (A) A forest plot showed the prognostic value of SPP1 expression according to different immune cell subgroups in LUAD patients. (B) Correlation between PD-L1 and SPP1. (C) Correlation analysis of TMB and SPP1. (D) Correlation analysis of MSI and SPP1. The horizontal axis in the figure represents the correlation coefficient; the ordinate is different tumors. The size of dot represents the correlation coefficient, and colors represent the significance of P value. (E) A Venn diagram of SCLC and three TKI-resistant profiles. (F) RNA-miRNA network of five hub genes. Abbreviations: TMB, tumor mutational burden; MSI, microsatellite instability; SCLC, small cell lung cancer. |
The Co-Expression of SPP1 and TMB/MSI in Pan-Cancer
The positive correlation between PD-L1 (CD274) and SPP1 is explored in Figure 8B. The KEGG pathway of SPP1 co-expressed genes mainly promoted tumor cell proliferation in osteoclast differentiation, ECM-receptor interaction, HIF-1 signaling pathway, glycolysis, DNA replication, NF-kappa B signaling pathway, and cytokine–cytokine receptor interaction (Supplementary Figure 3A). And Reactome pathway analysis revealed that co-expressed genes promoted extracellular matrix organization, immunoregulatory interactions between a lymphoid and a non-lymphoid cell, neutrophil degranulation, synthesis and replication of DNA, and so on, shown in Supplementary Figure 3B. These enrichment results showed that SPP1 expression is related to tumor cell proliferation and immunity. Moreover, we found that SPP1 was not only closely related to TMB and MSI in LUAD but also related to various tumors by the analysis of SPP1 expression and TMB/MSI. The expression of SPP1 was associated with high TMB in DLBC, THYM, SARC, ACC, and PRAD (Figure 8C). On the other hand, SPP1 was negatively correlated to MSI in LUAD and LUSC. High correlation of SPP1 and MSI was observed in COAD, ACC, SARC, READ, and TGCT (Figure 8D).
SCLC Transformation Co-Expression RNA-miRNA Network
SCLC transformation is also one of the reasons for the resistance to EGFR-TKI. We compared the SCLC and TKI-resistant DEGs, and 42 genes were co-expressed in both profiles. CD44, MUC1, ESRP1, SPP1, and ZEB1 were hub genes of both SCLC and TKI resistance (Figure 8E). And we found that hsa-miR-495-3p, hsa-miR-24-3p, hsa-miR-181a-5p, and hsa-miR-125a-3p were related to both SCLC and NSCLC by using disease-miRNAs network (Supplementary Figure 4). Meanwhile, 5 hub genes were predicted to be target genes of these miRNAs (Figure 8F). A RNA-miRNA regulatory network might induce the TKI resistance by SCLC transformation.
Establishment and Evaluation of Methylation Prognostic Risk Models
SPP1 expression and DNA methylation were compared between normal and LUAD patients. The expression of SPP1 was higher, and promoter methylation level was lower in LUAD compared with normal tissue (Figure 9A). High methylation of SPP1 promoter represented decreased gene expression. A Cox proportional hazards model including CpGs of 5 hub genes (CD44, MUC1, ESRP1, SPP1, and ZEB1) was used. The univariate and multivariate analysis revealed that SPP1 CpG cg00088885 and CD44 CpG cg20971158 in LUAD were significantly associated with OS (Figure 9B and C). Z-scores of partial hazard matched to the prognostic classifier and patient survival status. We found that patients with lower Z-scores generally had better outcome than those with higher scores (Figure 9D-a). According to multivariate proportional hazards regression model, patients were divided into high-risk or low-risk groups, and the low-risk group had better survival benefit (Figure 9D-b).
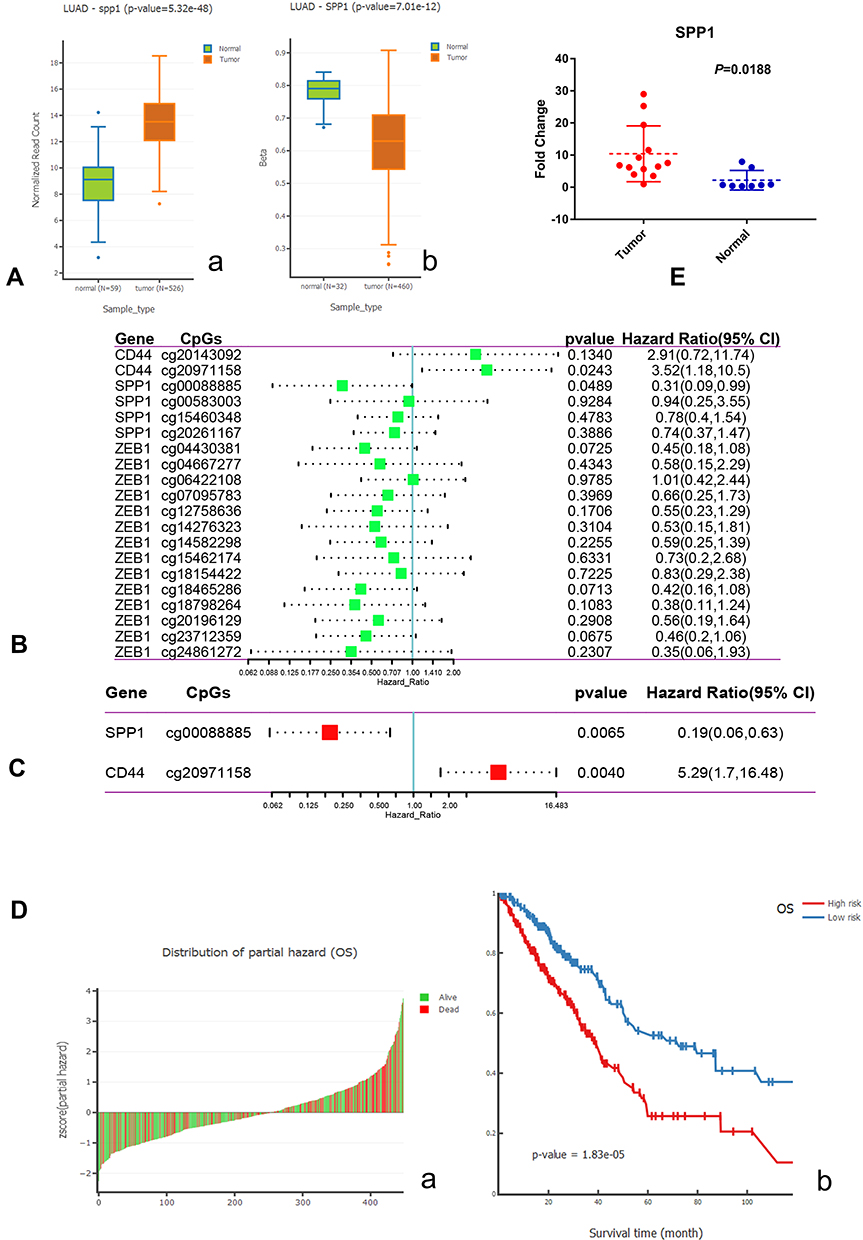 |
Figure 9 (A) a. Boxplot of expression of SPP1 in LUAD; b. Boxplot of DNA methylation of SPP1 in LUAD. (B) Univariate Cox analysis of hub gene CpGs. (C) Multivariate Cox analysis of hub gene CpGs. (D) a. Z-score distribution of the prognostic classifier and patients’ survival status; b. Kaplan–Meier survival analysis for LUAD patients based on multivariate proportional hazards regression model. (E) The high expression of SPP1 in EGFR-mutant lung adenocarcinoma compared with paracancerous tissues by qRT-PCR. |
TKIs Sensitivity Associated with SPP1
Relying on Cell Miner data, we acquired the SPP1 expression level in 60 diverse human cancer cell lines. The SPP1 expression of the NCI-60 cell lines and their Z scores for gefitinib, afatinib, and osimertinib are shown in Supplementary Figure 5. Most of cancer cell lines had Z scores below 0, meaning they are resistant to drugs with SPP1 high expression. Not only lung cancer but also other kinds of cancers such as breast cancer, glioblastoma, colon cancer, and melanoma were resistant to TKIs when SPP1 gene expressed.
The Expression Levels of SPP1 in EGFR-Mutant Lung Adenocarcinoma and Paracancerous Tissue
To examine the expression of SPP1 in EGFR-mutant LUAD, thirteen LUAD tissues and eight paracancerous tissues were collected. qRT-PCR analysis showed that SPP1 expression was significantly increased in EGFR-mutant LUAD tissues compared with adjacent normal tissues (P=0.0188) (Figure 9E).
Discussion
NSCLC patients harboring EGFR mutations developed resistance after taking TKI therapy for a period of time. The mechanisms of resistance were associated with T790M mutation, MET amplification, RET amplification, and so on. However, multiple unknown mechanisms still existed and needed further exploration. And resistance was also related to intratumoral clonal heterogeneity, dynamic changes of tumor cells, and tumor microenvironments. Although EGFR mutation could drive carcinogenesis of NSCLC, it is equally important to estimate the meaning of the copy number changes of some hub genes.35 On the other hand, the relevant scores of immune infiltration induced by these hub genes might be helpful for the guidance of immunotherapy after TKI resistance.
In this study, we found that the expression level of two hub genes, ZEB1 and SPP1, increased in resistant samples compared with sensitive samples. It was interesting that ZEB1 was down-regulated in LUAD, but up-regulated in resistant samples. And the expression of SPP1 was not only higher in EGFR-mutant LUAD than that of wild-type, but also highly expressed in the 1st and 2nd generation TKI-resistant samples. Recent studies have pointed out that abnormally high SPP1 expression could activate FAK/AKT and ERK signaling pathways by up-regulating αVβ3 to promote cell proliferation for EGFR-TKI resistance in EGFR-mutant NSCLC.36 Moreover, we found that SPP1 could be a prognostic factor in EGFR-mutant patients. Thus, it suggests that both ZEB1 and SPP1 might be related to resistance to EGFR-TKIs.
SPP1 encodes the protein, secreted phosphoprotein 1 (SPP1), also known as osteopontin.37 Now, SPP1 has been found to abnormally express in a variety of cancers, and induces drug resistance, progression, recurrence, and metastasis in breast, ovarian, and colon cancer.38–40 However, related resistance genes could be identified in both resistant cell lines and wild-type cells. Similarly, some kinds of TP53 mutation could be in found in NSCLC with or without EGFR mutation. The TP53 and EGFR co-mutations were associated with shorter progression-free survival for the 1st or 2nd generation EGFR-TKIs treatment compared with TP53 wild-type. It was a negative prognostic factor in advanced NSCLC.41 When EGFR mutation is coupled with high expression of SPP1, we might predict the prognosis of advanced NSCLC patients more accurately.
Interestingly, highly expressed SPP1 could induce lung cancer immune escape by up-regulating the expression of PD-L1, and regulating the polarization of tumor-associated macrophages.42 Although PD-L1 expression increased due to oncogenic signaling pathway activation in some EGFR-mutant lung adenocarcinomas, it resulted in unsatisfactory prognosis due to the lack of functional tumor-infiltrating lymphocytes (TILs) or “cold” TIME (tumor immune micro-environments).43 This cold TIME needs the regulation of immune microenvironments to enhance the response. In EGFR-TKI-resistant patients, if SPP1 is highly expressed, it would imply high infiltration of CD4+ T cells in TIME based on our results. Thus, the TIME is transformed into PD-L1+ with more TILs. This type of TIME is also described as an “inflamed” TIME.
The Car-T treatment also introduced T cells exogenously to regulate the infiltration of TILs in TIME to achieve anti-tumor effect,44 like the regulation of SPP1 in immune cell infiltration. This modification could strengthen patients’ response to immune checkpoint inhibitor therapy. What is more, CD4 is a reliable biomarker of ICIs, and it correlates to promoting the activity of cytotoxic T lymphocytes and establishing anti-tumor immunity. Specific dendritic cells transmitted signals from CD4+ T cells to CD8+ T cells to amplify the cytotoxic response.45 The poor efficacy of ICIs in lung cancer patients with EGFR mutation also might be related to poor antigen presentation with low CD4+ T cells,46 and low expression of SPP1.
In the IMPower150 trial, the patients with EGFR-sensitive mutation who were treated with atezolizumab plus bevacizumab and chemotherapy had better results in terms of efficacy than the anti-vascular combined with chemotherapy groups, with a median OS of 29.4 months vs 18.1 months (HR=0.6).47 Vascular endothelial growth factor-targeted therapy could “normalize” tumor blood vessels, introduce more immune cells to the TIME, and regulate the tumor microenvironment to enhance the immune response.48 For EGFR-TKI-resistant patients, Lam et al have shown that the combination of atezolizumab, bevacizumab, pemetrexed, and carboplatin achieved promising efficacy in metastatic EGFR-mutant NSCLC after TKI failure. The median PFS of patients reached 9.4 months, while the median OS did not reach and 72.5% of patients survived more than 1 year. After the treatment failure, many patients rechallenged EGFR-TKIs, and could still benefit from it, which means achieving targeted drug resensitization.49
Therefore, when SPP1 is highly expressed, it could regulate the immune microenvironment of TKI-resistant patients like anti-vascular drugs, and such patients might benefit from the immunotherapy. The expression level of SPP1 should be a basic test for subsequent treatment in patients resistant to EGFR-TKI to determine who would be suitable for immunotherapy. Overall, SPP1 might be viewed as a new biomarker for TIME and ICIs, and might serve as a prognostic biomarker associated with immune cell infiltration in lung cancer.
Lung cancer stem cells have been proven to be one of the key factors for EGFR-TKI resistance, and TKI resistance can induce a cancer stem cell (CSC) phenotype.50,51 Moreover, as for small cell transformation in TKI-resistant patients under the selective pressure of TKIs, multidrug-resistant cancer stem cells were retained and enriched. Thus, alveolar type II cell as the common precursor could differentiate into NSCLC firstly, and transform into SCLC under selective pressure.8 This transformation is due to the plasticity of the cell line, and the mechanism is not fully clear.52
We obtained a regulation network by using TKI-resistant and SCLC co-expressed hub genes. Among them CD44 not only binds to SPP1 ligands,53 but also functions as a recognized tumor stem cell marker.54 And ZEB1 could induce epithelial mesenchymal transition (EMT), and ESRP1 and CD44 contribute to early pathogenesis and metastatic potential in lung cancer.55 Some studies found that knocking down SPP1 significantly reduced stemness characteristics in pancreatic cancer cells.56 All of these hub genes were involved in the stemness regulation. Therefore, they might be involved in the small cell transformation in TKI resistance. However, not all TKI resistance samples were related to SCLC transformation. In these three TKI-resistant GEO profiles, only the afatinib group contained the co-increasing of SPP1 and CD44, indicating that this group might have the potential of SCLC transformation. This inference would be investigated in our future work by performing experiments on transformation to SCLC.
Conclusion
In summary, the resistance to EGFR-TKI is a critical problem after the initiation of targeting therapy. Several molecular mechanisms are associated with the resistance. Our results suggested that the up-regulation of SPP1 might induce resistance to the 1st and 2nd generation EGFR-TKIs, and SPP1 might be viewed as an independent prognostic biomarker of TKI treatment. Moreover, the high expression of SPP1 might promote the anti-tumor immune cell infiltration, and ICIs therapy could be considered in this situation. At the same time, SPP1 and CD44 DNA methylation might be independent prognostic factors in LUAD patients. Moreover, 5 hub genes might promote transformation of LUAD to SCLC by regulating the tumor stem cells in EGFR-TKI resistance.
Abbreviations
EGFR, epidermal growth factor receptor; NSCLC, non-small cell lung cancer; SCLC, small cell lung cancer; EGFR-TKI, epidermal growth factor receptor-tyrosine kinase inhibitor; LUAD, lung adenocarcinoma; DEGs, differentially expressed genes; GO, gene ontology; KEGG, Kyoto Encyclopedia of Genes and Genomes; ssGSEA, single-sample gene set enrichment analysis; ICIs, immune checkpoint inhibitors.
Data Sharing Statement
Publicly available datasets were analyzed in this study. All of the data could be obtained from GEO (www.ncbi.nlm.nih.gov/geo) and TCGA (https://portal.gdc.cancer.gov/).
Ethics Statement
The study was performed according to the Declaration of Helsinki, and was approved by the Ethics Committee of The First Affiliated Hospital of Chongqing Medical University. Informed consent was waived for non-interventional retrospective study by the Ethics Committee of The First Affiliated Hospital of Chongqing Medical University. We also confirm that the data were anonymized and maintained with confidentiality. Ethical approval number is 2021-347.
Funding
This study was supported by the Natural Science Foundation Project of Chongqing Science and Technology Commission (CSTC), China (grant no. cstc2018jcyjAX0012).
Disclosure
The authors report no conflicts of interest in this work.
References
1. Siegel RL, Miller KD, Jemal A. Cancer statistics, 2020. CA Cancer J Clin. 2020;70(1):7–30. doi:10.3322/caac.21590
2. Hsu WH, Yang JC, Mok TS, Loong HH. Overview of current systemic management of EGFR-mutant NSCLC. Ann Oncol. 2018;29(suppl_1):i3–i9. doi:10.1093/annonc/mdx702
3. Wu Q, Luo W, Li W, Wang T, Huang L, Xu F. First-generation EGFR-TKI plus chemotherapy versus EGFR-TKI alone as first-line treatment in advanced NSCLC with EGFR activating mutation: a systematic review and meta-analysis of randomized controlled trials. Front Oncol. 2021;11:598265. doi:10.3389/fonc.2021.598265
4. Mok TS, Wu YL, Ahn MJ, et al. Osimertinib or platinum-pemetrexed in EGFR T790M-positive lung cancer. N Engl J Med. 2017;376(7):629–640. doi:10.1056/NEJMoa1612674
5. Le T, Gerber DE. Newer-generation EGFR inhibitors in lung cancer: how are they best used? Cancers. 2019;11(3):366. doi:10.3390/cancers11030366
6. Wang ZF, Ren SX, Li W, Gao GH. Frequency of the acquired resistant mutation T790 M in non-small cell lung cancer patients with active exon 19Del and exon 21 L858R: a systematic review and meta-analysis. BMC Cancer. 2018;18(1):148. doi:10.1186/s12885-018-4075-5
7. Yu HA, Arcila ME, Rekhtman N, et al. Analysis of tumor specimens at the time of acquired resistance to EGFR-TKI therapy in 155 patients with EGFR-mutant lung cancers. Clin Cancer Res. 2013;19(8):2240–2247. doi:10.1158/1078-0432.CCR-12-2246
8. Oser MG, Niederst MJ, Sequist LV, Engelman JA. Transformation from non-small-cell lung cancer to small-cell lung cancer: molecular drivers and cells of origin. Lancet Oncol. 2015;16(4):e165–172. doi:10.1016/S1470-2045(14)71180-5
9. Isomoto K, Haratani K, Hayashi H, et al. Impact of EGFR-TKI treatment on the tumor immune microenvironment in EGFR mutation-positive Non-Small cell lung cancer. Clin Cancer Res. 2020;26(8):2037–2046. doi:10.1158/1078-0432.CCR-19-2027
10. Lee JK, Lee J, Kim S, et al. Clonal history and genetic predictors of transformation into small-cell carcinomas from lung adenocarcinomas. J Clin Oncol. 2017;35(26):3065–3074. doi:10.1200/JCO.2016.71.9096
11. Chen S, He Y, Liu J, et al. Third-generation TKI resistance due to SCLC transformation: a case report and brief review. Onco Targets Ther. 2019;12:11305–11311. doi:10.2147/OTT.S228301
12. Kato Y, Tanaka Y, Hino M, Gemma A. ProGRP as early predictive marker of non-small-cell lung cancer to small-cell lung cancer transformation after EGFR-TKI treatment. Respir Med Case Rep. 2019;27:100837. doi:10.1016/j.rmcr.2019.100837
13. Barrett T, Wilhite SE, Ledoux P, et al. NCBI GEO: archive for functional genomics data sets—update. Nucleic Acids Res. 2012;41(D1):D991–D995. doi:10.1093/nar/gks1193
14. Wu S-G, Chang T-H, Tsai M-F, et al. IGFBP7 drives resistance to epidermal growth factor receptor tyrosine kinase inhibition in lung cancer. Cancers. 2019;11(1):36.
15. Balko JM, Potti A, Saunders C, Stromberg A, Haura EB, Black EP. Gene expression patterns that predict sensitivity to epidermal growth factor receptor tyrosine kinase inhibitors in lung cancer cell lines and human lung tumors. BMC Genomics. 2006;7(1):289. doi:10.1186/1471-2164-7-289
16. Hsu J, Lin W, Lien T, et al. 154 overcoming acquired resistance to afatinib in HCC827, a non-small cell lung cancer cell line. Eur J Cancer. 2012;48(Suppl 6):47–48. doi:10.1016/S0959-8049(12)71952-4
17. Huang da W, Sherman BT, Lempicki RA. Bioinformatics enrichment tools: paths toward the comprehensive functional analysis of large gene lists. Nucleic Acids Res. 2009;37(1):1–13. doi:10.1093/nar/gkn923
18. Szklarczyk D, Gable AL, Lyon D, et al. STRING v11: protein-protein association networks with increased coverage, supporting functional discovery in genome-wide experimental datasets. Nucleic Acids Res. 2019;47(D1):D607–d613. doi:10.1093/nar/gky1131
19. Shannon P, Markiel A, Ozier O, et al. Cytoscape: a software environment for integrated models of biomolecular interaction networks. Genome Res. 2003;13(11):2498–2504. doi:10.1101/gr.1239303
20. Tang Z, Li C, Kang B, Gao G, Li C, Zhang Z. GEPIA: a web server for cancer and normal gene expression profiling and interactive analyses. Nucleic Acids Res. 2017;45(W1):W98–w102. doi:10.1093/nar/gkx247
21. Uhlen M, Zhang C, Lee S, et al. A pathology atlas of the human cancer transcriptome. Science. 2017;357(6352):6352. doi:10.1126/science.aan2507
22. Li T, Fan J, Wang B, et al. TIMER: a web server for comprehensive analysis of tumor-infiltrating immune cells. Cancer Res. 2017;77(21):e108–e110. doi:10.1158/0008-5472.CAN-17-0307
23. Aran D, Hu Z, Butte AJ. xCell: digitally portraying the tissue cellular heterogeneity landscape. Genome Biol. 2017;18(1):220. doi:10.1186/s13059-017-1349-1
24. Charoentong P, Finotello F, Angelova M, et al. Pan-cancer immunogenomic analyses reveal genotype-immunophenotype relationships and predictors of response to checkpoint blockade. Cell Rep. 2017;18(1):248–262. doi:10.1016/j.celrep.2016.12.019
25. Jia Q, Wu W, Wang Y, et al. Local mutational diversity drives intratumoral immune heterogeneity in non-small cell lung cancer. Nat Commun. 2018;9(1):5361. doi:10.1038/s41467-018-07767-w
26. Hänzelmann S, Castelo R, Guinney J. GSVA: gene set variation analysis for microarray and RNA-seq data. BMC Bioinform. 2013;14(1):7. doi:10.1186/1471-2105-14-7
27. Nagy Á, Munkácsy G, Győrffy B. Pancancer survival analysis of cancer hallmark genes. Sci Rep. 2021;11(1):6047. doi:10.1038/s41598-021-84787-5
28. Vasaikar SV, Straub P, Wang J, Zhang B. LinkedOmics: analyzing multi-omics data within and across 32 cancer types. Nucleic Acids Res. 2018;46(D1):D956–d963. doi:10.1093/nar/gkx1090
29. Thorsson V, Gibbs DL, Brown SD, et al. The immune landscape of cancer. Immunity. 2018;48(4):812–830.e814. doi:10.1016/j.immuni.2018.03.023
30. Bonneville R, Krook MA, Kautto EA, et al. Landscape of microsatellite instability across 39 cancer types. JCO Precis Oncol. 2017;2017:1–5.
31. Huang Z, Shi J, Gao Y, et al. HMDD v3.0: a database for experimentally supported human microRNA-disease associations. Nucleic Acids Res. 2019;47(D1):D1013–d1017. doi:10.1093/nar/gky1010
32. Sticht C, De La Torre C, Parveen A, Gretz N. miRWalk: an online resource for prediction of microRNA binding sites. PLoS One. 2018;13(10):e0206239. doi:10.1371/journal.pone.0206239
33. Ding W, Chen G, Shi T. Integrative analysis identifies potential DNA methylation biomarkers for pan-cancer diagnosis and prognosis. Epigenetics. 2019;14(1):67–80. doi:10.1080/15592294.2019.1568178
34. Reinhold WC, Sunshine M, Liu H, et al. CellMiner: a web-based suite of genomic and pharmacologic tools to explore transcript and drug patterns in the NCI-60 cell line set. Cancer Res. 2012;72(14):3499–3511. doi:10.1158/0008-5472.CAN-12-1370
35. McGranahan N, Swanton C. Clonal heterogeneity and tumor evolution: past, present, and the future. Cell. 2017;168(4):613–628. doi:10.1016/j.cell.2017.01.018
36. Fu Y, Zhang Y, Lei Z, et al. Abnormally activated OPN/integrin αVβ3/FAK signalling is responsible for EGFR-TKI resistance in EGFR mutant non-small-cell lung cancer. J Hematol Oncol. 2020;13(1):169. doi:10.1186/s13045-020-01009-7
37. Anborgh PH, Mutrie JC, Tuck AB, Chambers AF. Role of the metastasis-promoting protein osteopontin in the tumour microenvironment. J Cell Mol Med. 2010;14(8):2037–2044. doi:10.1111/j.1582-4934.2010.01115.x
38. Göthlin Eremo A, Lagergren K, Othman L, Montgomery S, Andersson G, Tina E. Evaluation of SPP1/osteopontin expression as predictor of recurrence in tamoxifen treated breast cancer. Sci Rep. 2020;10(1):1451. doi:10.1038/s41598-020-58323-w
39. Qian J, LeSavage BL, Hubka KM, et al. Cancer-associated mesothelial cells promote ovarian cancer chemoresistance through paracrine osteopontin signaling. J Clin Invest. 2021;131(16):16. doi:10.1172/JCI146186
40. Amilca-Seba K, Sabbah M, Larsen AK, Denis JA. Osteopontin as a regulator of colorectal cancer progression and its clinical applications. Cancers. 2021;13(15):15. doi:10.3390/cancers13153793
41. Skoulidis F, Heymach JV. Co-occurring genomic alterations in non-small-cell lung cancer biology and therapy. Nat Rev Cancer. 2019;19(9):495–509. doi:10.1038/s41568-019-0179-8
42. Zhang Y, Du W, Chen Z, Xiang C. Upregulation of PD-L1 by SPP1 mediates macrophage polarization and facilitates immune escape in lung adenocarcinoma. Exp Cell Res. 2017;359(2):449–457. doi:10.1016/j.yexcr.2017.08.028
43. Chi A, He X, Hou L, et al. Classification of non-small cell lung cancer’s tumor immune micro-environment and strategies to augment its response to immune checkpoint blockade. Cancers. 2021;13(12):2924. doi:10.3390/cancers13122924
44. Lu Y, Xue J, Deng T, et al. Safety and feasibility of CRISPR-edited T cells in patients with refractory non-small-cell lung cancer. Nat Med. 2020;26(5):732–740. doi:10.1038/s41591-020-0840-5
45. Binnewies M, Mujal AM, Pollack JL, et al. Unleashing type-2 dendritic cells to drive protective antitumor CD4(+) T cell immunity. Cell. 2019;177(3):556–571.e516. doi:10.1016/j.cell.2019.02.005
46. Simonds EF, Lu ED, Badillo O, et al. Deep immune profiling reveals targetable mechanisms of immune evasion in immune checkpoint inhibitor-refractory glioblastoma. J Immunol Cancer. 2021;9(6):e002181. doi:10.1136/jitc-2020-002181
47. Socinski MA, Mok TS, Nishio M, et al. Abstract CT216: iMpower150 final analysis: efficacy of atezolizumab (atezo) + bevacizumab (bev) and chemotherapy in first-line (1L) metastatic nonsquamous (nsq) non-small cell lung cancer (NSCLC) across key subgroups. Cancer Res. 2020;80(16Supplement):CT216–CT216.
48. Ellis LM, Hicklin DJ. VEGF-targeted therapy: mechanisms of anti-tumour activity. Nat Rev Cancer. 2008;8(8):579–591. doi:10.1038/nrc2403
49. Lam TC, Tsang KC, Choi HC, et al. Combination atezolizumab, bevacizumab, pemetrexed and carboplatin for metastatic EGFR mutated NSCLC after TKI failure. Lung Cancer. 2021;159:18–26. doi:10.1016/j.lungcan.2021.07.004
50. Si J, Ma Y, Bi JW, et al. Shisa3 brakes resistance to EGFR-TKIs in lung adenocarcinoma by suppressing cancer stem cell properties. J Exper Clin Cancer Res. 2019;38(1):481. doi:10.1186/s13046-019-1486-3
51. Del Re M, Arrigoni E, Restante G, et al. Concise review: resistance to tyrosine kinase inhibitors in non-small cell lung cancer: the role of cancer stem cells. Stem Cells. 2018;36(5):633–640. doi:10.1002/stem.2787
52. Rudin CM, Brambilla E, Faivre-Finn C, Sage J. Small-cell lung cancer. Nat Rev Dis Primers. 2021;7(1):3. doi:10.1038/s41572-020-00235-0
53. Shirasaki T, Honda M, Yamashita T, et al. The osteopontin-CD44 axis in hepatic cancer stem cells regulates IFN signaling and HCV replication. Sci Rep. 2018;8(1):13143. doi:10.1038/s41598-018-31421-6
54. Xu H, Niu M, Yuan X, Wu K, Liu A. CD44 as a tumor biomarker and therapeutic target. Exp Hematol Oncol. 2020;9(1):36. doi:10.1186/s40164-020-00192-0
55. Larsen JE, Nathan V, Osborne JK, et al. ZEB1 drives epithelial-to-mesenchymal transition in lung cancer. J Clin Invest. 2016;126(9):3219–3235. doi:10.1172/JCI76725
56. Nallasamy P, Nimmakayala RK, Karmakar S, et al. Pancreatic tumor microenvironment factor promotes cancer stemness via SPP1-CD44 axis. Gastroenterology. 2021;161(6):1998–2013.e7. doi:10.1053/j.gastro.2021.08.023
 © 2022 The Author(s). This work is published and licensed by Dove Medical Press Limited. The full terms of this license are available at https://www.dovepress.com/terms.php and incorporate the Creative Commons Attribution - Non Commercial (unported, v3.0) License.
By accessing the work you hereby accept the Terms. Non-commercial uses of the work are permitted without any further permission from Dove Medical Press Limited, provided the work is properly attributed. For permission for commercial use of this work, please see paragraphs 4.2 and 5 of our Terms.
© 2022 The Author(s). This work is published and licensed by Dove Medical Press Limited. The full terms of this license are available at https://www.dovepress.com/terms.php and incorporate the Creative Commons Attribution - Non Commercial (unported, v3.0) License.
By accessing the work you hereby accept the Terms. Non-commercial uses of the work are permitted without any further permission from Dove Medical Press Limited, provided the work is properly attributed. For permission for commercial use of this work, please see paragraphs 4.2 and 5 of our Terms.