")
Back to Journals » Journal of Asthma and Allergy » Volume 14
The Molecule Sensitized Pattern of Atopic Dermatitis Patients Who Co-Sensitized to Shrimp, Cockroaches, Crab and House Dust Mites
Authors Hu H, Hou X, Luo W, Li Y , Huang H, Huang X, Sun B , Zhang XD
Received 24 June 2021
Accepted for publication 30 July 2021
Published 11 August 2021 Volume 2021:14 Pages 993—997
DOI https://doi.org/10.2147/JAA.S326411
Checked for plagiarism Yes
Review by Single anonymous peer review
Peer reviewer comments 3
Editor who approved publication: Dr Luis Garcia-Marcos
Haisheng Hu,1,* Xiangqing Hou,2,* Wenting Luo,1 Yusi Li,2 Huimin Huang,1 Xiaoying Huang,1 Baoqing Sun,1 Xiaohua Douglas Zhang2
1Department of Allergy and Clinical Immunology, First Affiliated Hospital of Guangzhou Medical University (State Key Laboratory of Respiratory Disease, National Clinical Research Center of Respiratory Disease, Guangzhou Institute of Respiratory Health), Guangzhou, People’s Republic of China; 2Faculty of Health Sciences, University of Macau, Macau, People’s Republic of China
*These authors contributed equally to this work
Correspondence: Baoqing Sun
Department of Allergy and Clinical Immunology, First Affiliated Hospital of Guangzhou Medical University, Guangzhou, Guangdong, People’s Republic of China
Tel +86 20 8306 2865
Email [email protected]
Xiaohua Douglas Zhang
Faculty of Health Sciences, University of Macau, Taipa, Macau, People’s Republic of China
Tel +86 853 88224813
Email [email protected]
Abstract: This study investigated the molecule sensitized pattern of atopic dermatitis patients who co-sensitized to shrimp, cockroaches, crab and house dust mites allergens and promoted the development of clinical accurate diagnosis and treatment.
Keywords: specific immunoglobulin E, sIgE, atopic dermatitis, cross-reaction
With the change in global climate and the air pollution (such as increase of sensitizers), the sensitized pattern of patients is also changing.1,2 Our previous studies have shown that there were more than 70% of crab-sensitized patients co-sensitization to shrimp, cockroaches and house dust mites,3 as well as >75% of shrimp sensitized patients positive for cockroaches, house dust mites and moth at the same time in South China.4 This means that, under a clinical approach, patients may need to avoid all of the above allergen species, or even more if they are sensitized to one of the above. However, why does this sensitized pattern occur and what are those patients truly sensitized to? Cross-reaction between allergens may be the best explanation for species co-sensitization.5 Allergen components from different species may have the same functions, which leads to similar specific immunoglobulin E (sIgE) binding epitopes causing cross-reaction6. Accordingly, when patients are sensitized to these functional proteins, they may sensitize to all the allergen crude extract which included those functional proteins. Hence, we deduce that some co-sensitized patients are instead likely to be just sensitized to a few kinds of functional proteins.
Atopic dermatitis7 increases the risks of rhinitis and asthma among people of nearly all ages. In order to explore the sensitized proteins of these patients, in this study, 34 atopic dermatitis patient’s sera were randomly taken from the serum bank of Allergy Information Repository from January 2020 to May 2020 in Guangzhou, China. All participants provided informed consent, and approval from the ethic committee of The First Affiliated Hospital of Guangzhou Medical University (Reference number: GYFYY-2016-73). There were 16 males and the mean age was 18.5. All the patients were positive (≥0.35 kU/L) for the serum sIgE for D. pteronyssinus, C. pagurus, B. germanica and P. monodon at the same time by Phadia 1000 (Sweden, Thermo). None of these patients had taken specific allergen immunotherapy, with no autoimmune diseases, parasitic infections or cancer and the diagnoses of atopic dermatitis were based on the Atopic Dermatitis Guidelines applied by dermatologist.8 All the patients have tested 125 allergen components by ALEX® (A MacroArrayDX, Austria), and the result ≥0.30 kU/L was defined as positive according to the manufacturer’s instructions. Categorical data were reported as a percentage, compared the different between groups used chi-square tests (χ2) or F-tests.
The results show that 70.6% of patients were positive for more than one allergen component, 52.9% for more than two components, 17.6% for more than five components and 2.9% for more than ten components. The sIgE concentration for most of the allergen components in these patients was very low, ranging from 0.30 to 29.52 kU/L. As shown in Figure 1, in food allergen components, the highest was Cic a 1 (11.8%) and only 2.9% of patients were sensitive to Ara h 9. In pollen allergen components, Cup s 1 and Cry j 1 (14.7%) had the highest positive rate, followed by Lol p 1 (11.8%) and Fra e 1 (8.8%), but both Pla a 1 (2.9%) and Pla l 1 (2.9%) had a lower positive rate. Besides, co-sensitization to European Cypress (Cup s 1) and Cryptomeria (Cry j 1) was 11.8%. In dust mite allergen components, Der p 1 had the highest positive rate (20.6%). In animal allergen components, we found Api m 1 (17.6%) had the highest sensitization rates among all insect related allergen components. In contrast, both cockroach [Bla g 2 (5.9%), Bla g 4 (2.9%), Bla g 5 (2.9%)] and Gly d 2 (2.9%) had a lower positive rate. There were few patients sensitive to fungal allergen components and the highest was Asp f 3 (8.8%). In addition, to exhaustively examine the relationship between those allergens, we performed a spring-embedded correlation analysis to primarily identify six modularities with well-connected clusters (Figure 2). The algorithms of Layout choose “ForceAtlas2” which is a force-directed layout.9 This algorithm is close to other algorithms used for network spatialization.10 Next, we added the “Avg. Path Length” and “Modularity” options to increase the visibility of edge and network overview. The size of the node is proportional to the weight of the relationship with allergens (the larger the circle, the more the correlation of allergens). The length of the line between the nodes (spring length) is proportional to the correlation strength (the shorter the length, the stronger the correlation with neighboring allergen components). The different colors of the lines represent various modularity classes. The thickness of the line is proportional to the significance of correlation (the thicker the line, the more significant the analysis). Accordingly, the results show that allergen components Pla a 1, Pla l 1, Mal d 1, Phl p 6 and Ara h 9 as the pre-dominated allergens were closely correlated with all allergens. The Spearman correlation analysis also shows that the correlation coefficients between Api g 1 and Pla l 1, as well as Pla a 1 and Gly m 4 were all more than 0.80 (P < 0.001).
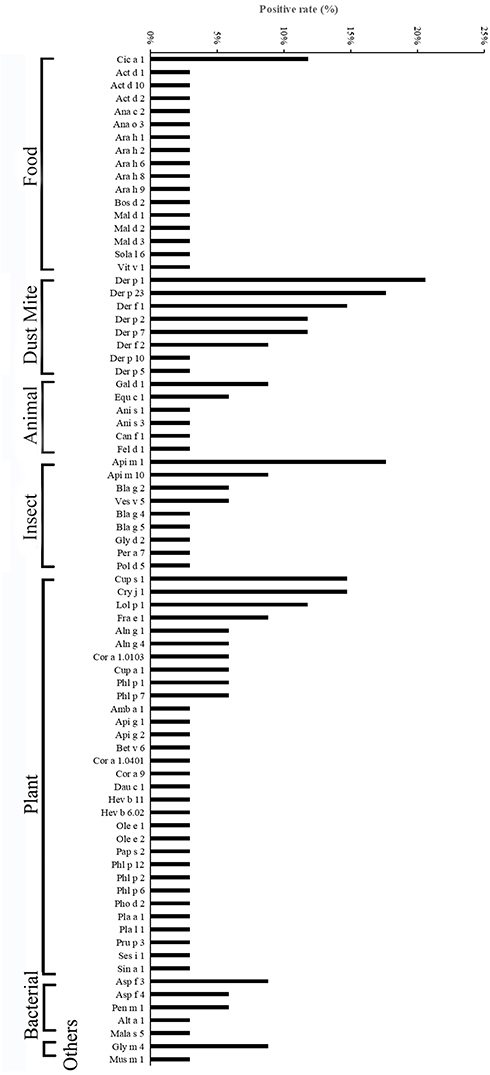 |
Figure 1 The positive rate of molecular allergen in atopic dermatitis patients with D. pteronyssinus, C. pagurus, B. germanica and P. monodon co-sensitized. Note: The positive rate of allergen components were shown in figure and all the patients were negative for Act d 5, Amb a 4, Api g 6, Api m 2, Ara h 3, Art v 1, Art v 3, Asp f 6, Ber e 1, Bet v 1, Bet v 2, Bla g 1, Bos d 4, Bos d 5, Bos d 6, Bos d 8, Can f 2, Can f 3, Che a 1, Cla h 8, Cor a 11, Cor a 14, Cor a 8, Cyp c 1, Der p 11, Fag e 2, Fel d 2, Fel d 4, Gad m 1, Gal d 2, Gal d 3, Gal d 4, Gal d 5, Gly m 5, Gly m 6, Gly m 8, Hev b 1, Hev b 3, Hev b 5, Hev b 8, Jug r 1, Jug r 2, Mala s 1, Mala s 11, Mala s 6, Mala s 9, Par j 2. |
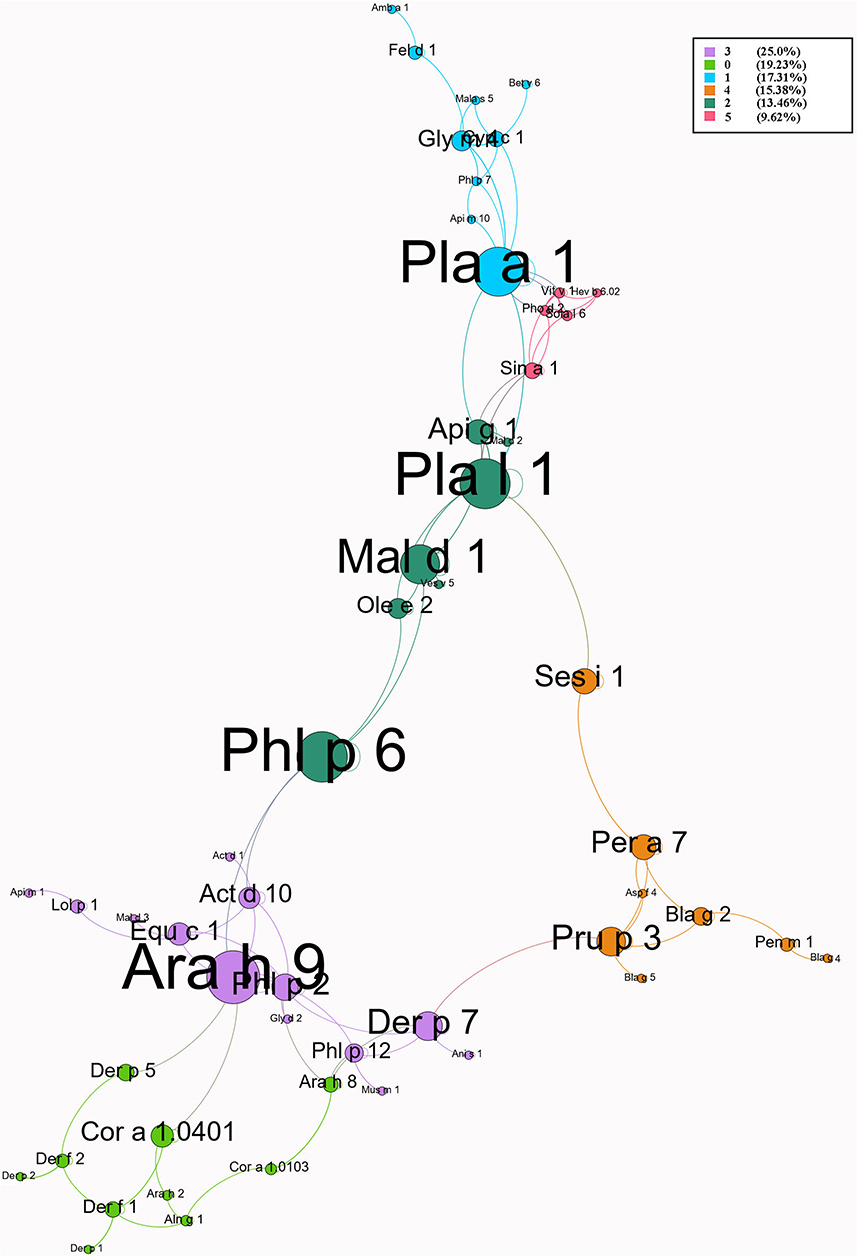 |
Figure 2 Spring-embedded correlation plot illustrating the relationship between allergen components. Note: The size of the node is proportional to the weight of the relationship with allergens (the larger the circle, the more correlation the allergen). The length of the line between the nodes (spring length) is proportional to the correlation strength (the shorter the length, the stronger the correlation with neighboring allergen components). The different color of the lines represents various modularity class. The thickness of the line is proportional to the significance of correlation (more thicker the line, the more significant the analysis). |
The positive rate of Der p 1 was highest, followed by Der p 23, Api m 1, Der f 1, Cup s 1 and Cry j 1 in those patients. Among the above components, Cup s 1 and Cry j 1 as a pectate lyase, usually only positive in patients with pollen allergy, which seem to have no relationship with mite, cockroach, shrimp or crab sensitization. However, Seema Patel et al report that the retention of critical domains like HAMP, HBM, EFh, HELICc in pollen proteins, was similar to cockroach allergens protein,11 This means that cross-reactions between insects and pollen allergens need to be considered in the future. In addition, a research from UK used tandem mass spectrometry to identify the allergens and found a similar epitope between mite allergen protein chitinase, cockroach allergen protein Cr-PI/Per a 3 and Apis mellifera allergen protein Api m 1 (PLA2),12 which may be important proteins in the co-sensitization of cockroaches and house dust mites. Pan-allergen components (like Der p 1, Der f 1, etc.) come from different creatures, but the functionally related molecules share highly conserved sequence regions and three-dimensional structures. Thus, they have similar epitopes and meet the requirements of IgE cross-reaction.13 In clinical diagnosis, we cannot simply determine which allergens are multiple sensitized patients are truly allergic to. These patients are likely to be sensitized to certain types of allergenic proteins which have similar functions. This concept will promote the development of clinical personalized immunotherapy.14 In addition, Celakovska et al’s study shows that atopic dermatitis patients suffering from food allergies suffer significantly more often from allergic rhinitis or asthma, we speculated that these patients may be sensitized to the cross-reactive protein between inhalation allergens and food allergens.15 To our knowledge, this is the first study to investigate the molecule sensitized pattern of atopic dermatitis patients who co-sensitized to shrimp, cockroaches, crab and house dust mites, as well as to use a spring-embedded correlation plot to comprehensively explore the associations among the sensitized proteins. Nevertheless, the insufficient sample size is the main limitation of this research. Meanwhile, only 125 allergen components were detected in this study, and there may be other leading co-sensitization not being detected, and IgE level of D. pteronyssinus and D. farinae may be affected by weather.16 Therefore, further studies including multi-season sampling are required to confirm the conclusion. This should require the development of allergen component detection technology in the future.
Ethics Approval and Consent to Participate
Approval was obtained from the ethic committee of The First Affiliated Hospital of Guangzhou Medical University (Reference number: GYFYY-2016-73). All participants provided informed consent, in accordance with the Declaration of Helsinki.
Acknowledgments
We thank everyone involved in the collection, detection, and date management of the serum samples. We thank Professor Hammer Tsui for guiding the detection and Dr. Zhangkai Jason Cheng for correcting the English expression.
Funding
This study was supported by National Natural Science Foundation of China (NSFC 81871736), the University of Macau (grant numbers: FHS-CRDA-029-002-2017 and MYRG2018-00071-FHS) and the Science and Technology Development Fund, Macau SAR (File no. 0004/2019/AFJ and 0011/2019/AKP).
Disclosure
The authors declare that they have no conflicts of interest.
References
1. D’Amato G, Pawankar R, Vitale C, et al. Climate change and air pollution: effects on respiratory allergy. Allergy Asthma Immunol Res. 2016;8(5):391–395. doi:10.4168/aair.2016.8.5.391
2. Hou X, Huang H, Hu H, et al. Short-term exposure to ambient air pollution and hospital visits for IgE-mediated allergy: a time-stratified case-crossover study in southern China from 2012 to 2019. EClinicalMedicine. 2021;37:100949. doi:10.1016/j.eclinm.2021.100949
3. Luo W, Hu H, Tang W, et al. Allergen sensitization pattern of allergic adults and children in southern China: a survey based on real life data. Allergy Asthma Clin Immunol. 2019;15(1):42. doi:10.1186/s13223-019-0357-y
4. Liao C, Hu H, Huang Z. Shrimp and cockroach co-sensitization in southern China: association moth sensitization. Allergy Asthma Proc. 2020;41(3):e54–e60. doi:10.2500/aap.2020.41.200013
5. Hu H, Luo W, Wu Z, et al. A pilot study on the allergen-specific IgE to molecular components on polysensitized mite allergic asthmatic patients in Guangzhou, China. Mol Immunol. 2019;105:38–45. doi:10.1016/j.molimm.2018.11.004
6. Liao C, Liang C, Hu H, et al. Major pollen allergen components and CCD detection in bermuda grass sensitized patients in Guangzhou, China. J Asthma Allergy. 2020;13:615–623. doi:10.2147/JAA.S277704
7. Langan SM, Irvine AD, Weidinger S. Atopic dermatitis. Lancet. 2020;396(10247):345–360. doi:10.1016/S0140-6736(20)31286-1
8. Sidbury R, Kodama S. Atopic dermatitis guidelines: diagnosis, systemic therapy, and adjunctive care. Clin Dermatol. 2018;36(5):648–652. doi:10.1016/j.clindermatol.2018.05.008
9. Jacomy M, Venturini T, Heymann S, et al. ForceAtlas2, a continuous graph layout algorithm for handy network visualization designed for the Gephi software. PLoS One. 2014;9(6):e98679. doi:10.1371/journal.pone.0098679
10. Lee SW, Yuh WT, Yang JM, et al. Nationwide results of COVID-19 contact tracing in south korea: individual participant data from an epidemiological survey. JMIR Med Inform. 2020;8(8):e20992. doi:10.2196/20992
11. Patel S, Rani A, Goyal A. Insights into the immune manipulation mechanisms of pollen allergens by protein domain profiling. Comput Biol Chem. 2017;70:31–39. doi:10.1016/j.compbiolchem.2017.07.006
12. El-Faham MH, Gai F, Igetei JE, et al. Antigenic cross-reactivity between Schistosoma mansoni and allergenic invertebrates putatively due to shared glycanic epitopes. Sci Rep. 2020;10(1):3350. doi:10.1038/s41598-020-59892-6
13. Reese G, Ayuso R, Lehrer SB. Tropomyosin: an invertebrate pan-allergen. Int Arch Allergy Immunol. 1999;119(4):247–258. doi:10.1159/000024201
14. Zou X, Hu H, Huang Z, et al. Serum levels of specific immunoglobulin E to Dermatophagoides pteronyssinus allergen components in patients with allergic rhinitis or/and asthma. Allergy Asthma Proc. 2021;42(1):e40–e46. doi:10.2500/aap.2021.42.200105
15. Celakovska J, Bukac J. Analysis of food allergy in atopic dermatitis patients - association with concomitant allergic diseases. Indian J Dermatol. 2014;59(5):445–450. doi:10.4103/0019-5154.139867
16. Lee SW, Cho E, Koh HY, et al. Effect of solar irradiation on serum specific immunoglobulin E to house-dust mite. Allergy Asthma Proc. 2015;36(4):44–50. doi:10.2500/aap.2015.36.3845
 © 2021 The Author(s). This work is published and licensed by Dove Medical Press Limited. The full terms of this license are available at https://www.dovepress.com/terms.php and incorporate the Creative Commons Attribution - Non Commercial (unported, v3.0) License.
By accessing the work you hereby accept the Terms. Non-commercial uses of the work are permitted without any further permission from Dove Medical Press Limited, provided the work is properly attributed. For permission for commercial use of this work, please see paragraphs 4.2 and 5 of our Terms.
© 2021 The Author(s). This work is published and licensed by Dove Medical Press Limited. The full terms of this license are available at https://www.dovepress.com/terms.php and incorporate the Creative Commons Attribution - Non Commercial (unported, v3.0) License.
By accessing the work you hereby accept the Terms. Non-commercial uses of the work are permitted without any further permission from Dove Medical Press Limited, provided the work is properly attributed. For permission for commercial use of this work, please see paragraphs 4.2 and 5 of our Terms.