")
Back to Journals » Journal of Healthcare Leadership » Volume 11
The Moderating Role Of Top Executives’ Sex, Level Of Education And Knowledge On Adoption Of Mobile Health Applications By Hospitals In Kenya
Authors Ngongo BP, Ochola P , Ndegwa J, Katuse P
Received 7 August 2019
Accepted for publication 8 October 2019
Published 7 November 2019 Volume 2019:11 Pages 115—126
DOI https://doi.org/10.2147/JHL.S226341
Checked for plagiarism Yes
Review by Single anonymous peer review
Peer reviewer comments 2
Editor who approved publication: Professor Russell Taichman
Bahati Prince Ngongo, Phares Ochola, Joyce Ndegwa, Paul Katuse
Chandaria School of Business, United States International University Africa, Nairobi, Kenya
Correspondence: Bahati Prince Ngongo
United States International University Africa, Nairobi, Kenya
Email [email protected]
Background: Kenya lags behind other countries in adoption of mobile health (m-health) applications. Understanding factors affecting adoption of m-health by hospitals is required to inform strategic scale up and leverage m-health for sustainable development goals. This study investigated the moderating effects of Top Executives’ (TEs) traits, namely sex, level of education and knowledge of m-health, on adoption of Patient Centered (PC) and Facility-Centered (FC) m-health applications.
Methods: This study applied the Technological, Organizational and Environmental (TOE) framework and the Diffusion of Innovation (DOI) theory to test hypotheses that TEs’ traits individually or combined had no statistically significant moderating effect on adoption of PC and FC m-health applications. Primary data were collected through a self-administered questionnaire from a representative sample size of 211 TEs from level 4 to 6 hospitals. The Logit Regression Model was used to determine the significance of each predictor.
Results: Most TEs of hospitals are predominantly male (75.3%). Most TEs (65%) rated their knowledge of m-health at medium level. Most TEs reported having completed undergraduate (46%) or post-graduate (38.4%) degrees. At 5% level of significance, the study found that being a male TE (p=0.041) and having higher level of knowledge of m-health (p=0.009) were statistically significant moderators of adoption of PC m-health applications by hospitals in Kenya. However, all TEs’ traits combined or individually were not statistically significant moderators of FC m-health applications. The moderating effect of TEs’ traits is thus affected by the focus, level of complexity of the technology, and by the required organizational change management. For PC scale-up, there is an urgent need to integrate digital health training in the medical education curricula and in the professional development programs and to develop policy incentives that remove any gender-related barriers to adoption of m-health. However, scale up of FC m-health may require other strategies such as pre-existence of systems and infrastructure and a cohesive change management strategy.
Conclusion: This study recommends a differentiated approach to introduction, scale up, and investigation of PC and FC m-health applications.
Keywords: mobile health, adoption of m-health, digital health, health innovations
Introduction
The increased access to phones and smart phones in the last decade presents a golden opportunity for mobile health (m-health) revolution. Globally, there are over 6 billion mobile phone subscribers, representing 75% of the world’s population, with potential for m-health business opportunities and global health impact.1 Akter and Ray2 projected that the massive penetration of low-cost high-quality smart phones will reach more than 4 billion individuals by 2017 and that the m-health market will reach US $23 billion by end of 2017. The World Health Organization3 defines m-health as the use of any wireless technology or portable device by health providers to enable communication between patients and health services, for consultation between health care professionals, for health monitoring and surveillance, and for access to information for health care professionals at point of care. It identified twelve general applications of m-health (Table 1) that could be further categorized as patient-centered (PC) and facility-centered (FC). PC m-health applications aim to facilitate communications and data between patients and health providers, while FC m-health applications mostly facilitate communications and data between health care providers and have the opportunity to provide services remotely through networked facilities.
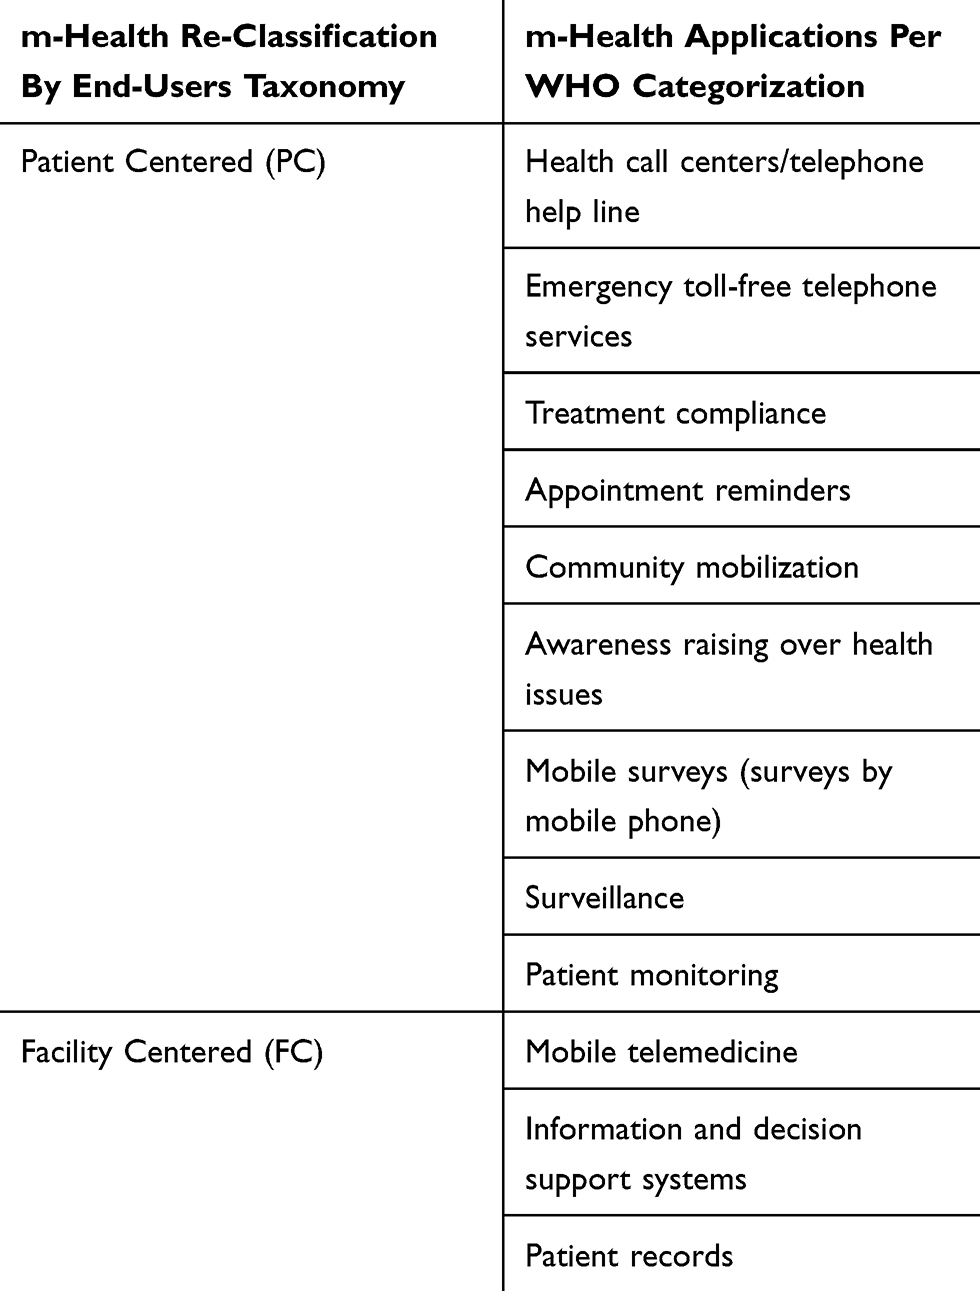 |
Table 1 M-Health Applications Categories And Re-Categorization As Per WHO |
While m-health adoption in hospitals is expanding in High-Income Countries (HICs), it is not realizing its promised potential in Low- and Middle-Income Countries (LMICs). Sub-Saharan Africa lags behind other regions in adoption of m-health.3–5 Kenya lags behind other Sub-Saharan countries in m-health adoption despite its earlier competitive advantage in mobile financing and in e-commerce. Despite its leadership in developing one of the first comprehensive e-health strategies in Sub-Saharan Africa, adoption of m-health remains sub-optimal and thus requires further investigation of barriers to adoption of m-health by hospitals.6 There is a gap in knowledge of factors that affect m-health adoption by hospitals in Kenya and in other Sub-Saharan countries. A review of studies as cited by Gagnon7 on m-health between 2005 and 2014 showed that more than half (54.5%) of studies were conducted in the Americas, 18.2% in Europe, 15% in Asia, and 12.1% in Africa, mainly in Ethiopia, South Africa, Botswana, and Uganda. Most of these studies focused on acceptability of m-health to consumers or health care professionals and did not investigate institutional adoption of m-health “through the lenses“ of high-level decision makers of hospitals' adoption of innovations. They were also qualitative in nature and had limited geographical scope. The literature on m-health globally in general, and in Sub-Saharan Africa, does not investigate the role of top executives of hospitals in adoption of m-health applications.8 There is a need for a shift from individual adoption to organizational adoption through sound and comprehensive theoretical frameworks and through the lenses of top decision makers at the firm level or organizational level.9
There are mixed results from empirical studies by regions and sectors on the moderating role of Chief Executive Officers (CEO) or Top Executives’ (TEs') sex, level of education, and knowledge of technology on adoption of Information, Communications and Technology (ICT) innovations. For instance, in Kenya, Ochola10 found that CEOs' sex, level of education, and knowledge of e-commerce significantly moderated adoption of e-commerce. The higher the level of education, the higher the knowledge of e-commerce, the higher the likelihood of adopting e-commerce. It also found that enterprises led by female CEOs had higher adoption of e-commerce. However, studies in other regions such as China11 and Bangladesh12 found contrary results suggesting that female-led SME were less-likely to adopt IT innovations. There is limited evidence in the literature of the moderating effect of TEs of hospitals on adoption of health innovations generally and on m-health specifically. Most literature on m-health focus on either consumer adoption of m-health or individual health care provider adoption of m-health. Such approaches have led to techno-optimistic results of adoption of m-health because they do not consider organization adoption and also do not include a comprehensive evaluation of technological, organizational, and environmental factors that affect adoption.8,13 Furthermore, previous studies have not integrated any differences of the moderating effect of TEs' traits based on the focus of ICT innovations, whether they are PC (patient-centered and less complex to integrate) or FC (internally and process focused, resource intensive and more technologically and organizationally complex to integrate).
This study thus hypothesized that adoption of m-health is moderated by the TEs' traits such as sex, level of education, and knowledge of m-health. It further hypothesized that this moderating effect may be different for PC and FC m-health applications. While the age bracket and tenure of the TE have been considered in the analysis, they have not been integrated in the testing of hypotheses due to potential bias related to higher variability within each bracket and higher sensitivity to annual changes to significantly associate them with the process of decision-making to adopt innovations.
As highlighted previously, adoption of innovation in the health sector is complex and requires a mix of technological, organizational, and environmental determinants. The Diffusion of Innovation (DOI) theory developed by Rogers,14 is the most used framework to analyze adoption of IT innovations. Analyzing the technological and organizational characteristics of a technology through the DOI model by itself is not sufficient when adoption requires consideration of wider industry adoption, governmental regulations, and global competition. The Technological, Organizational and Environmental [TOE]) Framework developed by Tornatzky and Fleischer in 1390 is commonly used to investigate TOE determinants of adoption of innovations in general. However, critics of the TOE models have pointed out its weakness in the constructs of technological determinants. Therefore, a mix of TOE and DOI will be used to complement the analysis of the technological determinants as done by other studies on e-health in other regions or on e-commerce in Kenya.9,19
Therefore, this study will analyze the following moderating effect of TEs' traits using the combined TOE/DOI framework. The constructs of the technological determinants are m-health relative advantage, compatibility, complexity and trialability, and m-health acquisition strategies. The constructs of the organizational determinants include the hospital’s size (i.e., number of employees and number of patients), human resources and IT capabilities (e.g., availability of IT specialized staff and units); managerial structure (centralization, complexity, formalization, interconnectedness), and organizational slack (i.e., the degree to which uncommitted resources are available to a firm). The environmental constructs refer to the firm’s industry characteristics such as nature of the competition, effect of government regulations and incentives; the level of competition for patients, effect of global medical tourism, government pressure or incentives, support or resistance from medical health insurance companies, support or resistance of medical professional associations, and pressure from patients. The need to include the effect of network externalities and impact of other stakeholders and professional associations have been proposed as needed additions to the TOE framework15 but due to the nascent nature of m-health and scarcity of data on m-health adoption, this study will not include network externalities in this study.
Therefore, this study investigated the moderating role of the traits of TEs of hospitals in Kenya on TOE determinants and on adoption of m-health in order to identify practical recommendations for effective scale up of m-health. It tested the following four null hypotheses:
H01 Top executives’ sex has no significant statistical moderating effect on their perceptions of TOE determinants and PC and FC m-health adoption by hospitals in Kenya.
H02 Top executives’ level of education has no significant statistical moderating effect on their perceptions of TOE determinants and FC and PC m-health adoption by hospitals in Kenya.
H03 Top executives’ knowledge of m-health has no significant statistical moderating effect on their perceptions of TOE determinants and PC and FC m-health adoption by hospitals in Kenya.
H04 The combined effect of TEs' sex, level of education and knowledge of m-health has no significant statistical moderating effect on their perceptions of TOE determinants and PC and FC m-health adoption by hospitals.
Figure 1 summarizes the TOE/DOI conceptual framework, the constant model and the model with moderators, and hypotheses tested.
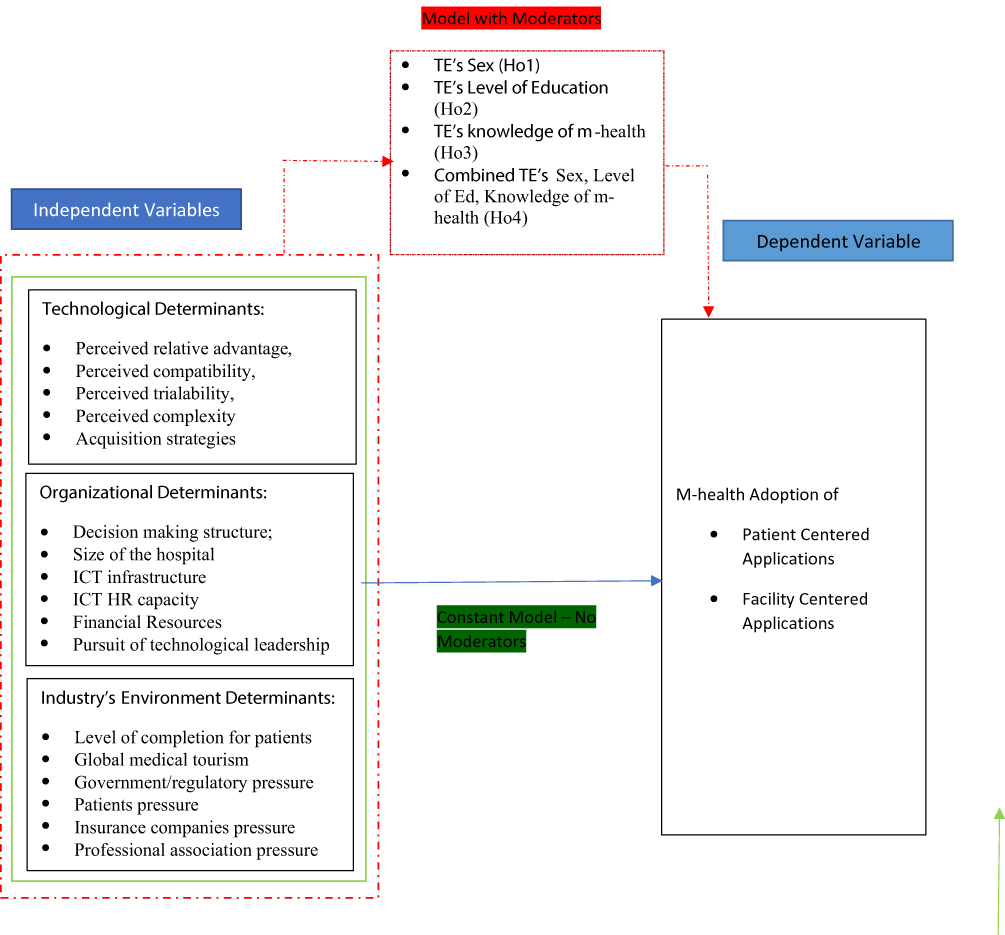 |
Figure 1 Conceptual framework of TOE determinants and moderators of TEs’ traits. |
Methodologies
This study is non-experimental quantitative research with correlational design as defined by Creswell.16 It used correlational statistics to describe, explain or measure the degree or relationships between one or more variables. It applied the survey design to generate numeric or quantified description of trends or association of variables.17 It used a Likert scale and self-administered questionnaire to ensure standardization and comparability of data necessary for generalizability.18
M-health applications under investigation in this study followed the WHO3 classification of 12 m-health applications and were re-categorized under PC and FC as indicated in Table 1.
The general target population of this study was the 507 (N) Top Executives (TEs) or managers of level 4, 5, and 6 hospitals as registered in the Kenya Master Health Facility database (Table 2). TEs were defined in this study as the most senior officer, manager or executive in charge of strategic leadership and management of the hospital. This study targeted one TE per hospital. The choice of TEs as respondents for this study is justified by the fact that they possess both decision-making power on adoption of health innovations and accountability for hospitals' strategic vision and performances and it follows the application of the TOE framework with CEO or TE as subject of investigation. This study targeted TEs of levels 4, 5, and 6 public, private, FBO and/or NGO hospitals because these hospitals constitute the primary mechanisms for introduction and roll-out of innovations in the Kenya health system. Levels 3 (health centers), 2 (dispensaries and clinics), and 1 (community levels) were excluded from this analysis as their relevance for m-health and other innovations are often reliant on the adoption of the higher levels of hospitals (levels 4 to 6) that they refer their patients to.
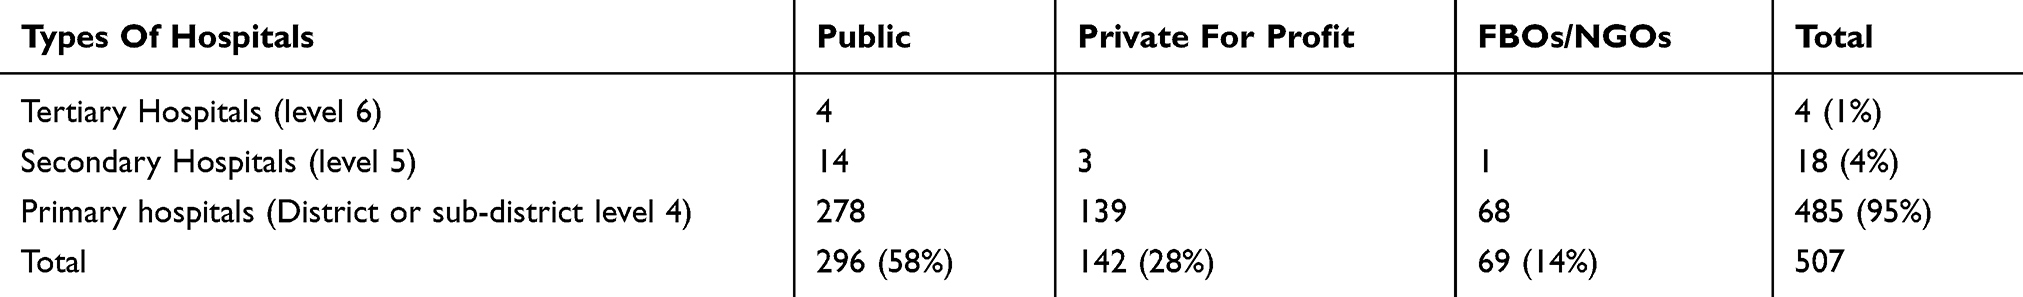 |
Table 2 National Distribution Of Hospitals By Categories Of Ownership And Classification Of Levels |
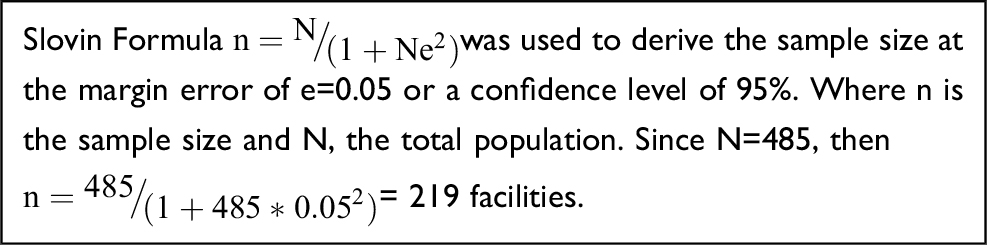
This study used the census method for the 22 level 5 and 6 hospitals. It used the Slovin formula to select a stratified simple random sampling method for the 485 level 4 hospitals to select a sample size of 219 facilities proportionately distributed across the 47 counties and ownership to derive a total of 126 public health facilities from 278 registered hospitals; 63 private for-profit hospitals from 139 registered facilities, and 30 from FBOs/NGOs (Table 2).
 |
|
The distribution of the sample size across the facilities is shown in Table 3. The random selection of level 4 hospitals in the sample size guided the random selection of TEs of the hospitals.
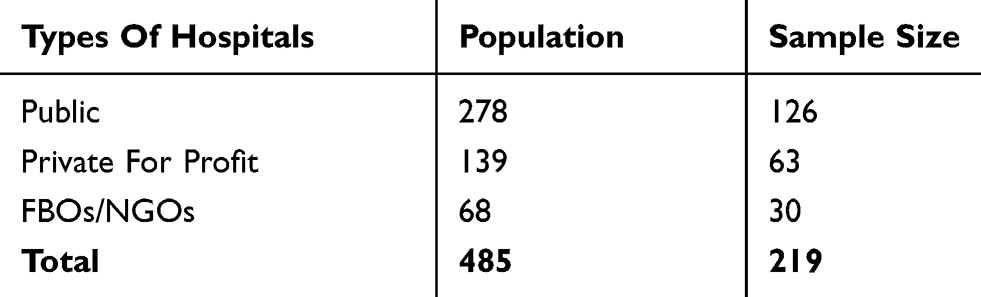 |
Table 3 Distribution Of Sample Size Across The Level 4 Hospital Facilities |
The ethical approval for the study was obtained through United States International University - Africa and the research approval was given by the National Council on Science, Technology and Innovations (NACOSTI). In view of the nature and scope of the study, the Ministry of Health (MoH) at national level and the County Health Departments also provided authorizations and recommendations before data collection. A team of 15 experienced and trained local research assistants was hired to distribute and collect the self-administered questionnaire from the TEs of level 4, 5, and 6 hospitals sampled in order to ensure accuracy of respondents and higher response rate. The use of emails or e-surveys was not considered as a reliable option for this study due to the low rate of response observed in other studies that targeted CEOs or TEs of hospitals by email. Furthermore, relying on e-surveys or emails had the potential challenges of excluding rural hospitals that may have limited ICT and internet infrastructures. Participation in the study by TEs was voluntary and TEs had the option to decline participation on first contact with research assistants or later when research assistants returned for the collection of the questionnaire if applicable. Confidentiality of respondents was ensured by not collecting personal identifiers and by guaranteeing de-linkage of results to TEs or hospitals.
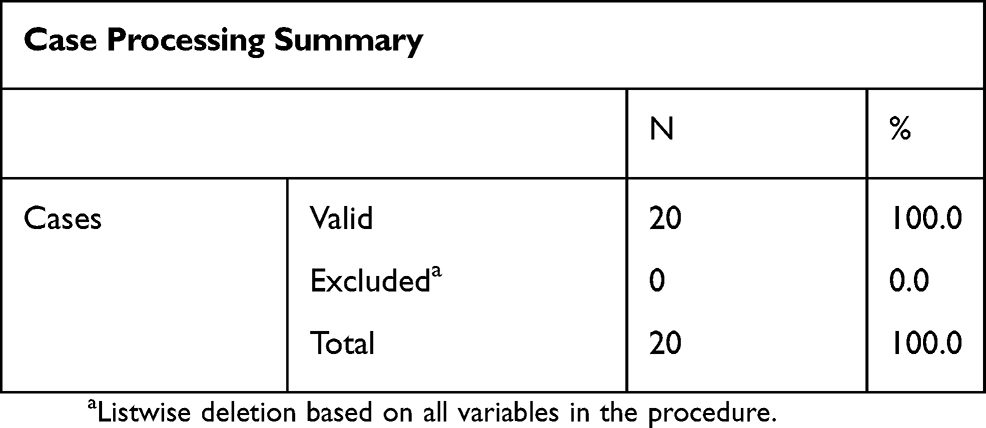
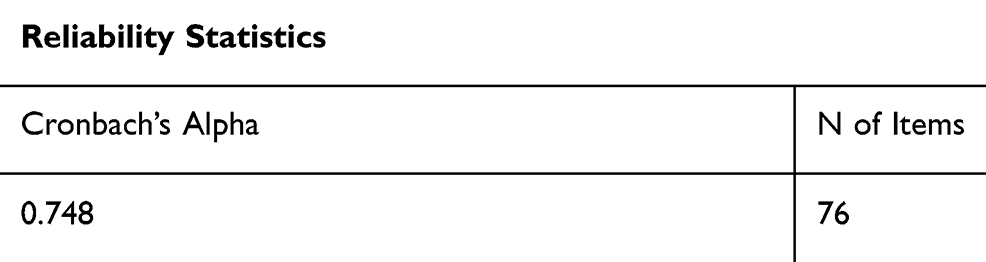
A pilot test was conducted in March and April 2018 with a convenience sample of 20 TEs of level 4 hospitals in Nairobi and Kiambu counties. These 20 hospitals were excluded in the sample size of level 4 hospitals included in the study. The choices of Nairobi and Kiambu counties was based on the higher presence of different levels of hospitals and different types of ownership.
The outcome of the pilot test showed a reliability test that was within the recommended range of alpha between 0.65 and 0.8.19
 |
|
 |
|
Because this study adapted the questionnaire used in other studies using TOE/DOI framework, content validity was used as guided by Foxcroft, Paterson, le Roux and Herbst.20 Feedback from different panels of experts, research assistants, and respondents in the pilot was summarized to guide further refinement of key terminologies in the questionnaire. Data collection was initiated from April to July 2018.
The data analysis was conducted using SPSS 21 and comprised descriptive and inferential statistics using statistical techniques, non-parametric methods. The study used the Logit Regression Analysis (LRA) to explain the theoretical and mathematical reasoning of the two outcomes Y=0 or Y=1. The Logit Regression Model (LRM) as used in this study, satisfied the characteristics of the study where the dependent variable is binary while the explanatory variables were nominal, ordinal, and interval/ratio. In addition, the LRM model was found appropriate, as its analysis was not constrained by normality requirement as well as restrictions of missing values in data. In this model, the explanatory variables were incrementally added to determine their individual and collective effect on adoption of m-health applications. The Nagelkerke R square was used to explain variance in the logistic models. The Hosmer and Lemeshow Chi-squared was used to test significance of the model and classification of respondents in their respective groups.
The model analysis collected n explanatory variables that resulted in two specific outcomes Y= 1 adoption of m-health, Y= 0 rejection of m-health. Adoption was defined as official hospital’s adoption and use of PC or FC m-health at the time of the study. The inferential statistics focused on relationship and correlation between the dependent variables (Y; Y1, 0) and the explanatory variables of the constant models denoted as X (X1 to n) where X1 = =Gender of TE, X2 Education level of TE, X3= Knowledge of m-health of TE and X4 = combined effect of gender, level of education, and knowledge of m-health.
The general LRM therefore is presented as follows:
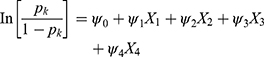
Where Pk=is the likelihood of adopting the kth (for k=1,2) m-health technological category 1= PC and 2= FC.
Findings
The total number of questionnaires that met the requirements for the study was 211 out of 241 (219 level 4 hospitals and 24 level 5 and 6 hospitals) distributed questionnaires across 24 counties. This represents 87.5% response rate which complies with recommendations by Fincham21 that a response rate of 80% and above is needed for generalizability of results of surveys. Four questionnaires were discarded because they were filled by non-top executive staff and 3 questionnaires were discarded because the hospitals self-categorized as level 3 hospitals despite being registered as level 4 in the Kenya Ministry of Health database. The overall distribution of respondents by hospital ownership was 48% for public, 36% for private, and 16% for FBOs/NGOs. The distribution by level of hospitals was 80% level 4 hospitals, 16% level 5 hospitals, and 4% level 6. The geographical distribution of hospitals was 36% urban, 38% semi-urban, and 26% rural.
Tables 4–8 show the distribution of age, sex, level of education, knowledge of m-health, and tenure of top executives. Most TEs were below 50 years old (85.2%). The age distribution of TEs represented a mix of young (18% between 21–30 years of age) and older TEs (66% between 31 and 50 years of age). The sex distribution of TEs of hospitals (levels 4–6) in Kenya is highly imbalanced with female TE in charge of hospitals representing only 24.7%. Public hospitals and FBOs have the highest imbalance of F:M (24% of female vs 76% of male), followed by private hospitals (at 26% vs 74%). Forty-six percent had completed undergraduate while 38.4% completed master’s or other postgraduate levels. A few executives (2.8%) reported having obtained doctorate or PhD degrees. Most top executives (65%) rated their knowledge of m-health as medium. Only 12.9% of top executives rated their knowledge of m-health as very high, while 17.7% rated their knowledge as low. The rest (4.3%) did not have any knowledge of m-health. Private hospitals had more TEs with higher knowledge of m-health. The majority (53.1%) of TEs had held their leadership position between 1–5 years, followed by those (21.2%) who had held the leadership position between 5 to 10 years. Only 8.6% of TEs had been in their position for more than 10 years compared to 16.9% who had been in the executive leadership position for less than a year. Public hospitals had the highest number of new TEs (22.7%) and fewer long-serving TEs (2.9%).
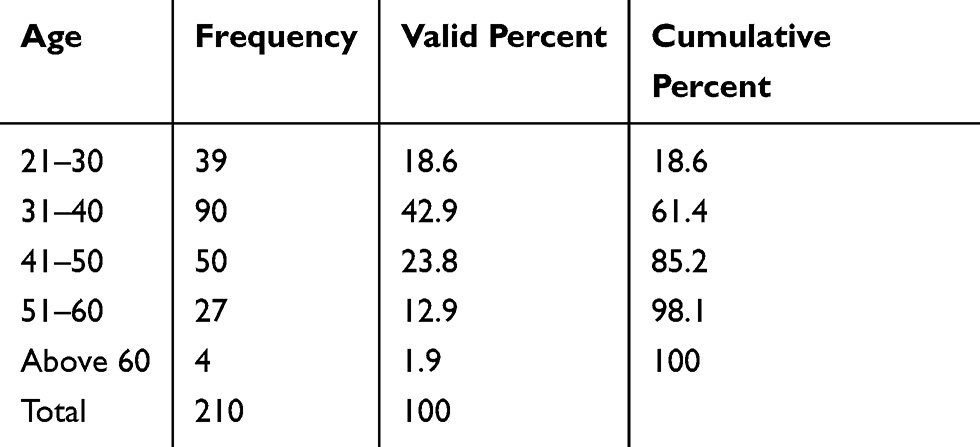 |
Table 4 The Distribution Of Age Of Top Executives |
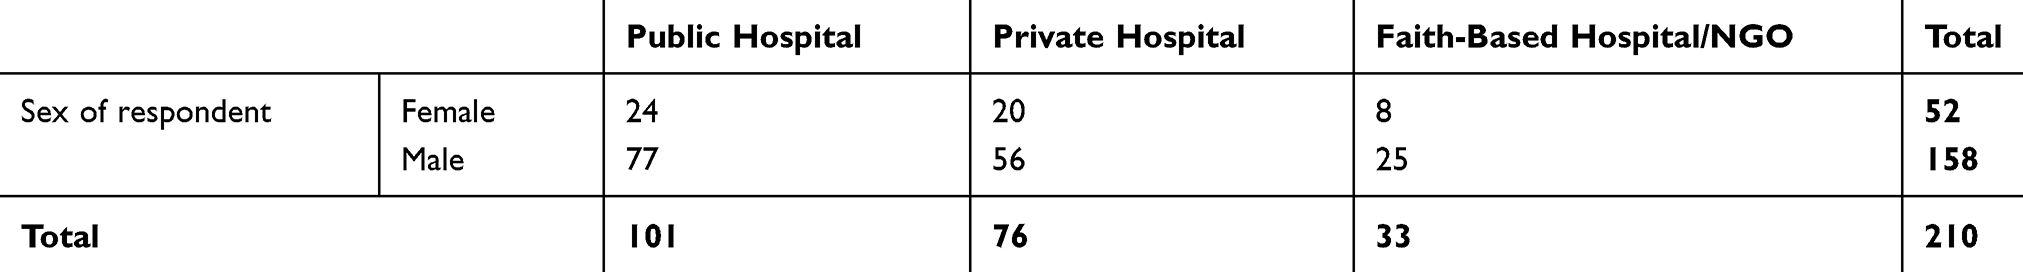 |
Table 5 The Distribution Of Sex Of Top Executives By Category Of Hospitals |
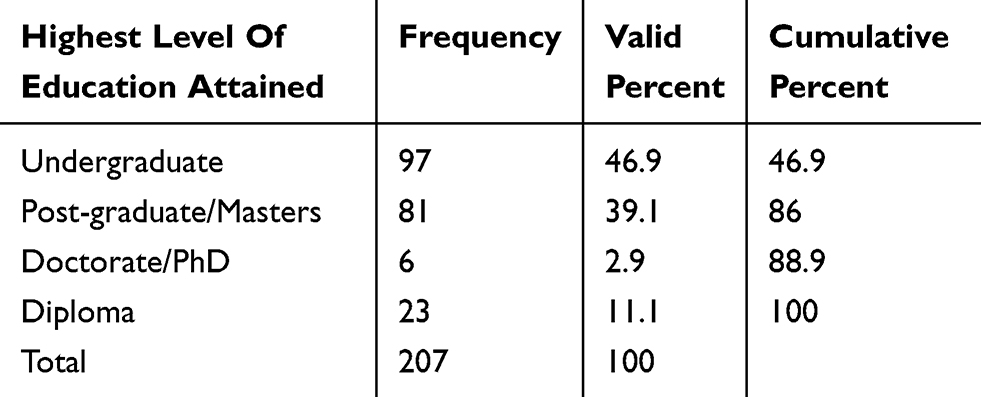 |
Table 6 The Distribution Of Level Of Education Attained By Top Executives |
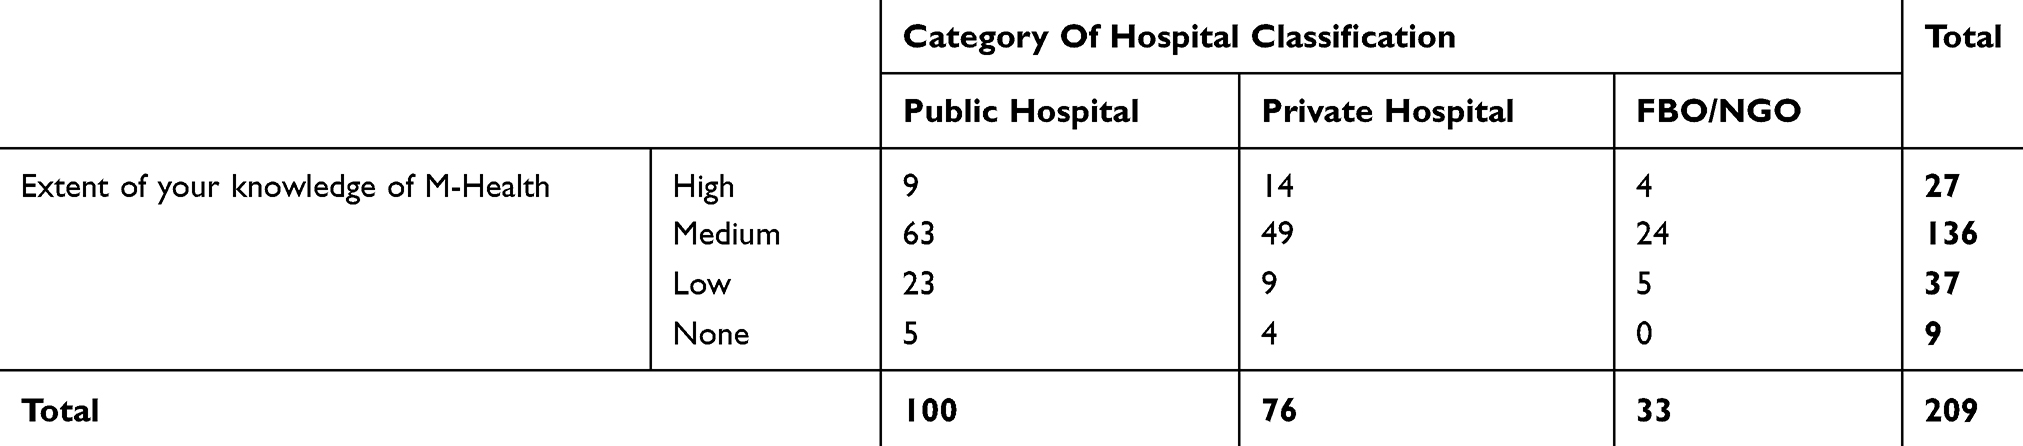 |
Table 7 The Distribution Of Top Executives’ Knowledge Of M-Health |
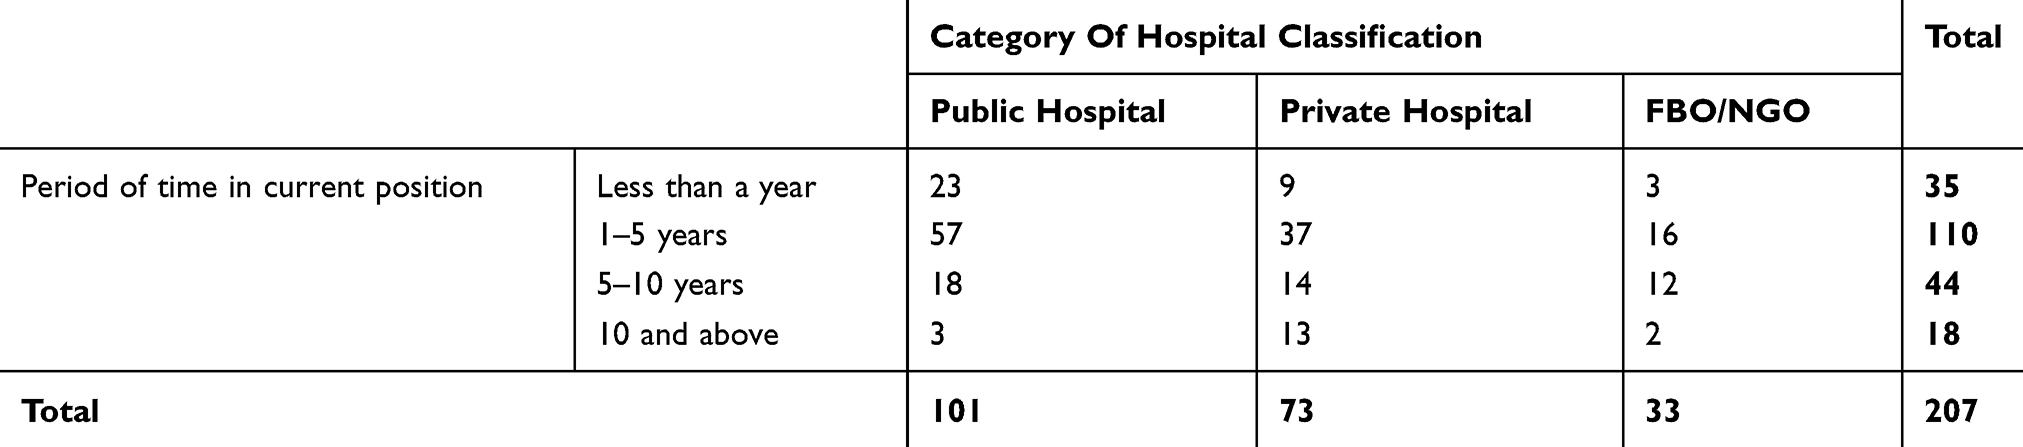 |
Table 8 The Distribution Of Tenure of Top Executives |
Figure 2 shows the distribution of level of knowledge of m-health across the different age brackets. The age bracket of 31–40 years of age had the highest concentration of high and medium level of m-health knowledge. The distribution of the different levels of knowledge of m-health within each age bracket was more or less similar. The age bracket of 21–30 had 6 missing data.
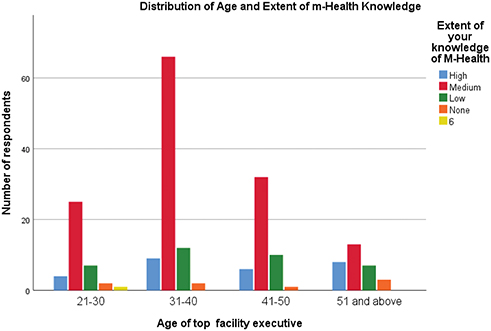 |
Figure 2 The distribution of age and extent of knowledge of m-health. |
Table 9 shows the distribution of adoption of PC and FC m-health applications.
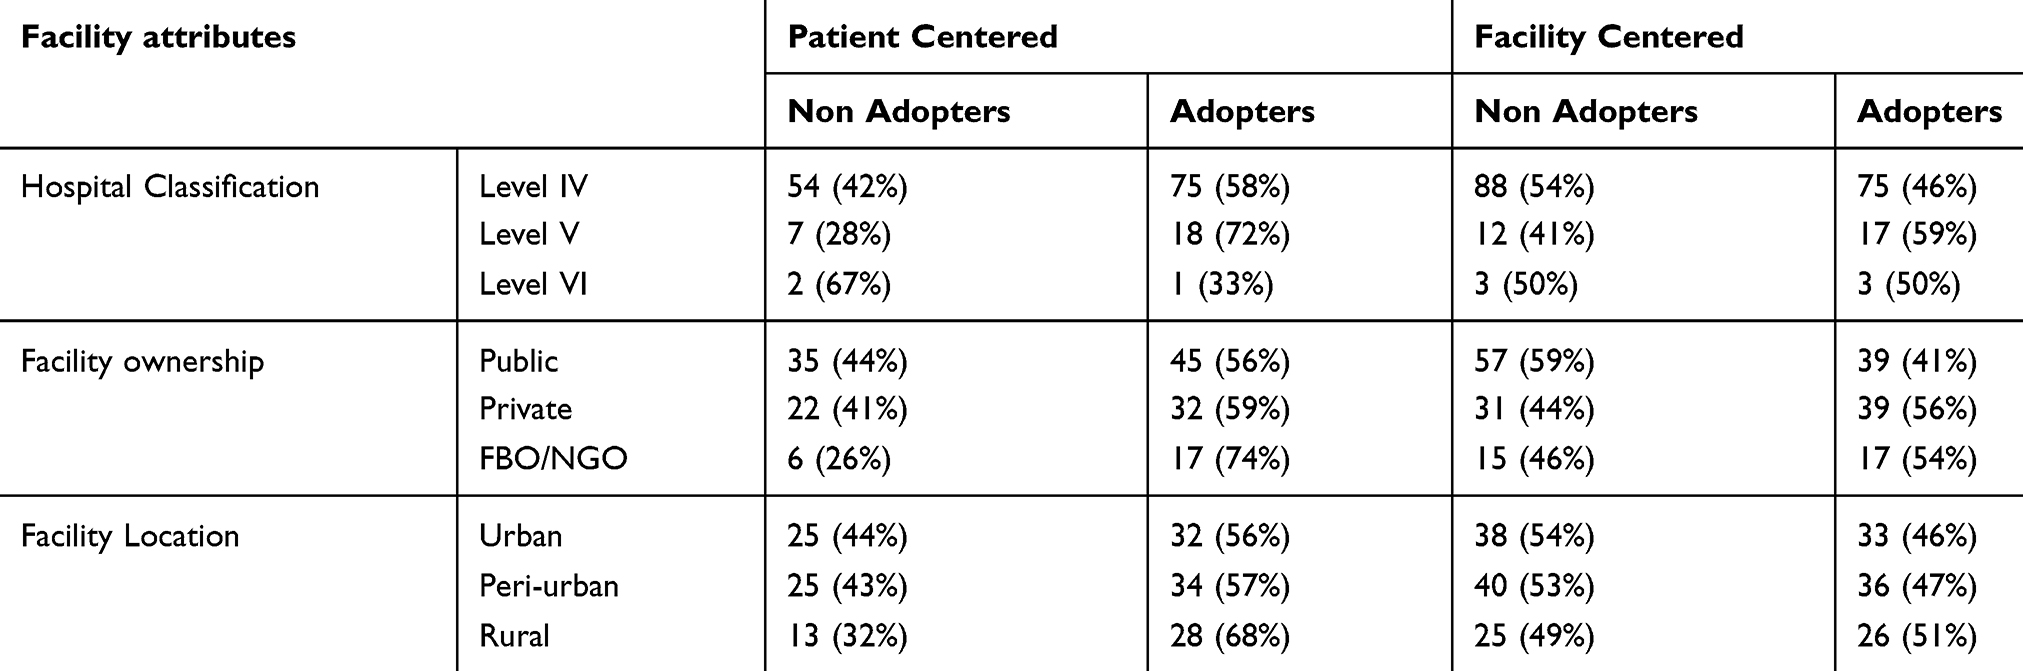 |
Table 9 The Distribution Of Adoption Status By Level Of Hospital, Ownership And Geographical Location |
To determine the estimated LRA of the moderating effect of TEs' traits, this study first conducted the Omnibus Tests of model coefficients to check if the new model with moderating variables of TEs’ sex, level of education, and knowledge of m-health was an improvement of the constant model with TOE/DOI without integration of TEs' traits at 5% of significance level. It then used the enter method of model fitting which involves the entering of all TOE determinants or variables at the same step for each of the two categories (PC and FC) of m-health innovations and regressed them on the identified TE traits of male sex, highest educational level attained, and highest knowledge of m-health.
Table 10 presents the results of the Omnibus tests for Model Coefficients for each PC and FC m-health application.
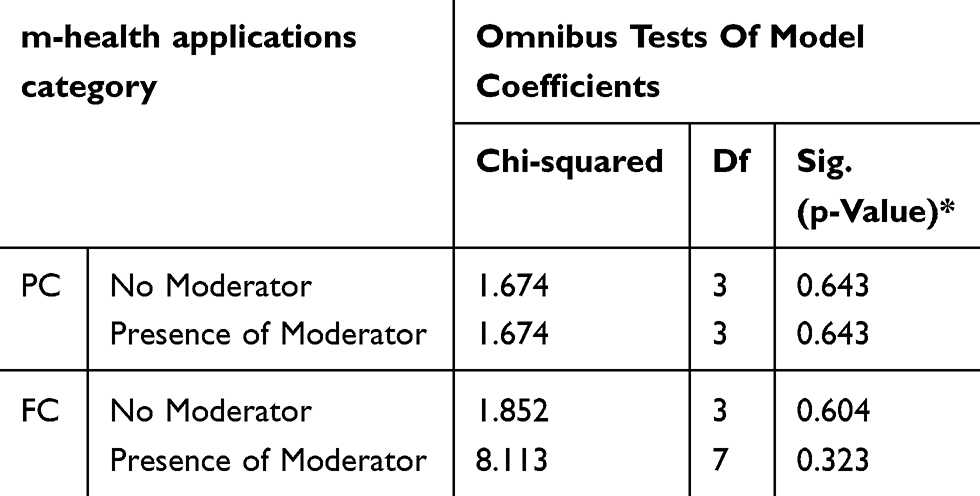 |
Table 10 Omnibus Tests Of Model Coefficients |
It shows that for both the PC and FC models with or without the combined moderating traits of TEs' sex, level of education and knowledge of m-health were statistically not significant as indicated by p value > 0.05 for PC m-health applications (p=0.643) with no moderator and p= 0.643 with presence of moderators. The same results apply for FC m-health applications with p= 0.604 (>0.05) with no moderator and p=0.323 (>0.05) with moderator. This implies that the predictive power of the two models did not improve over that of their respective constant only models.
However, the results of goodness of fit (Table 9) show that inclusion of the moderator variable improved the explanatory power of the variances in the two models (PC and FC). The higher values of Nagelkerke R Squared in the presence of moderators of 0.218 and 0.68 implies that 21.8% for PC and 68% for FC of the respective changes in adoption of the two interventions were explained by the moderating variables identified. Table 11 presents the output for model summary which provides information about the goodness of fit of the two models.
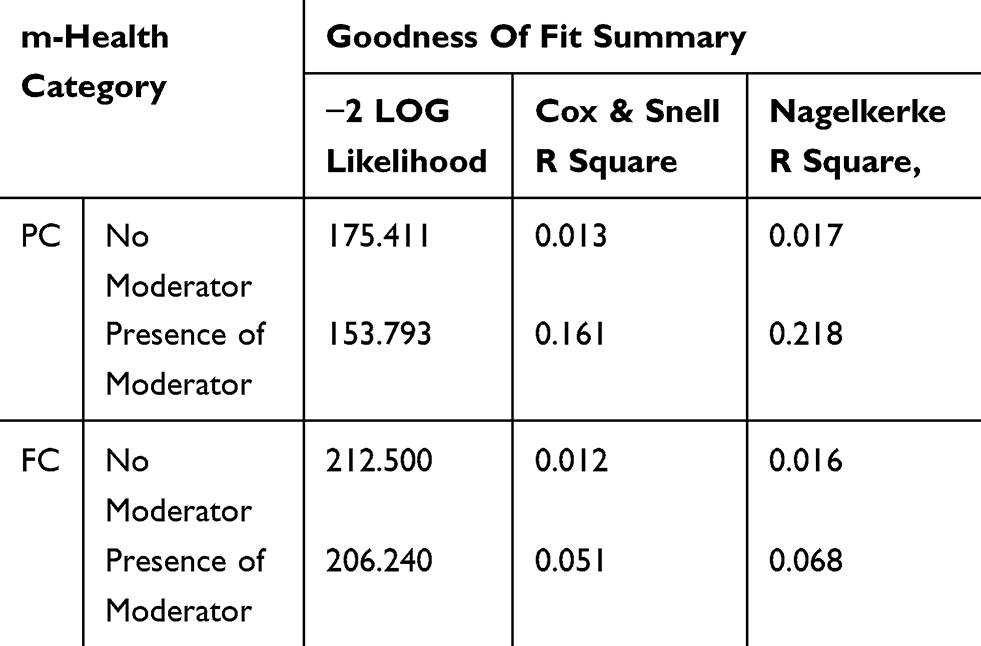 |
Table 11 Model Summary For Goodness Of Fit Test |
Table 12 also demonstrates an overall goodness of fit of the two models under both the moderator and non-moderator TEs’ traits variables. An overall goodness of fit of the model is indicated by p-values > 0.05. For both PC (p-value of 0.284 with no moderator and 0.615 with moderator) and FC (p-value of 0.812 with no moderator and 0.328 without a moderator) had p-values greater than 0.05. Therefore, the goodness of fit assumption was confirmed for both PC and FC models.
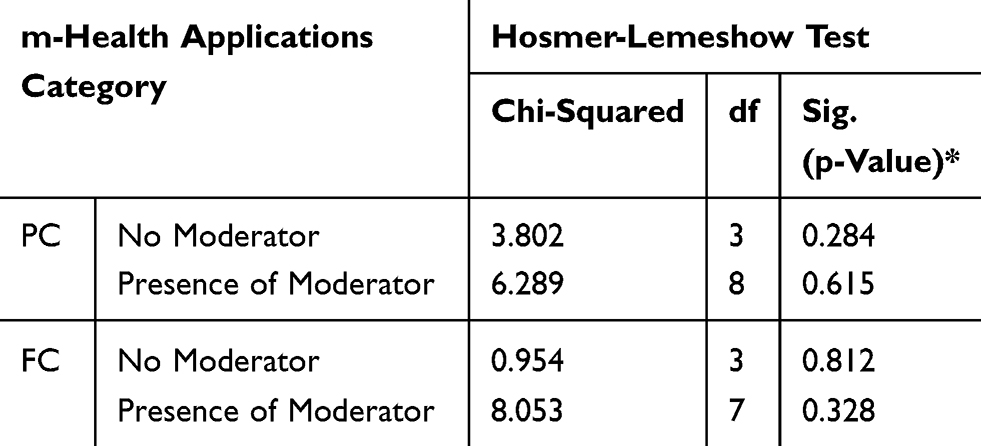 |
Table 12 Hosmer-Lemeshow Test |
Tables 13 and 14 show the estimated coefficients for each moderating variable of TEs’ traits on the TOEs and on adoption of PC and FC m-health. Variables with p values (Sig) less than 0.005 are statistically significant moderators of adoption of PC and FC m-health applications by hospitals in Kenya. The Wald chi-squared statistic tests the unique contribution of each moderating variable in the context of other predictor variables, to test the conventional 0.05 standard for statistical significance.
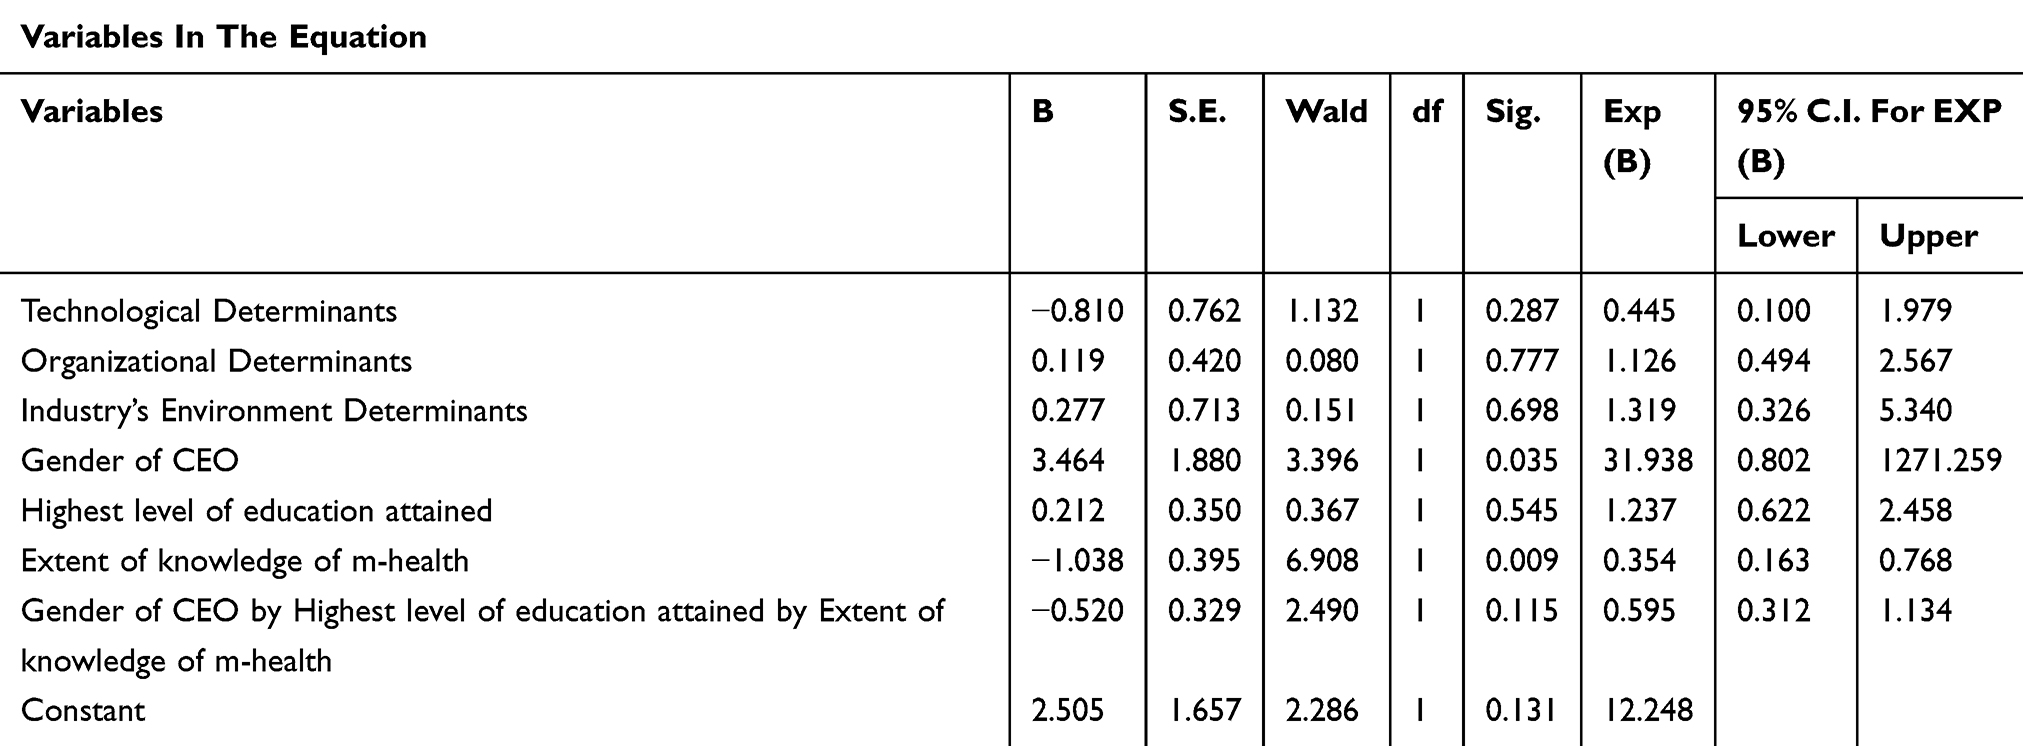 |
Table 13 PC Innovation Adoption And Moderating Effect Of Top Executives’ Traits |
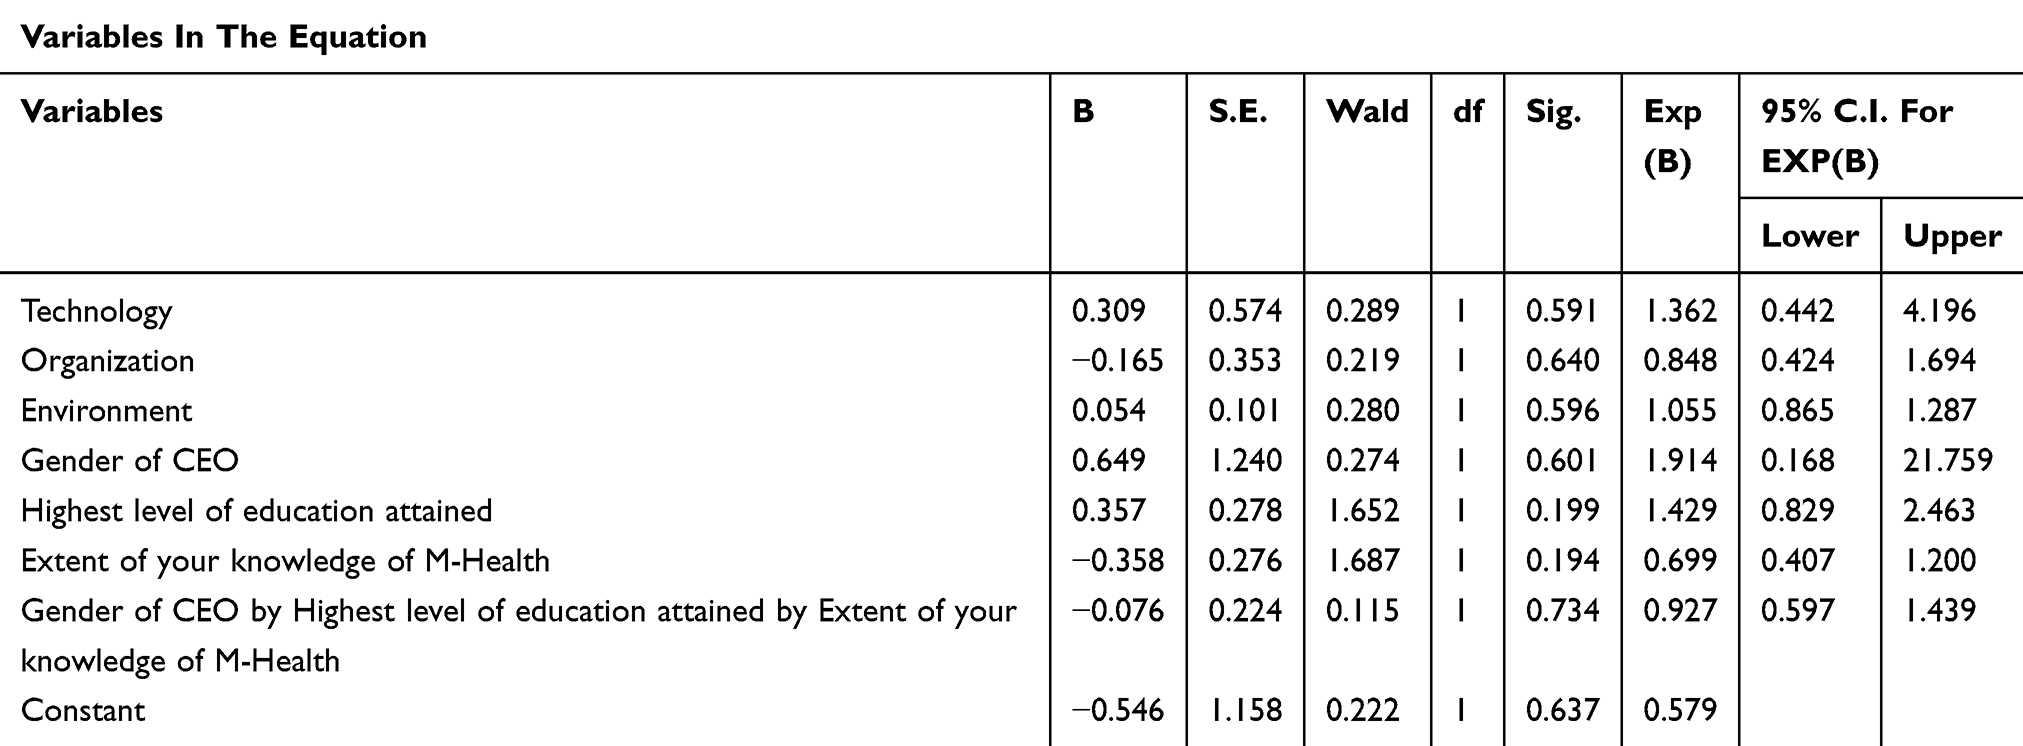 |
Table 14 FC M-Health Applications On Adoption And Moderating Effect Of Top Executives’ Traits |
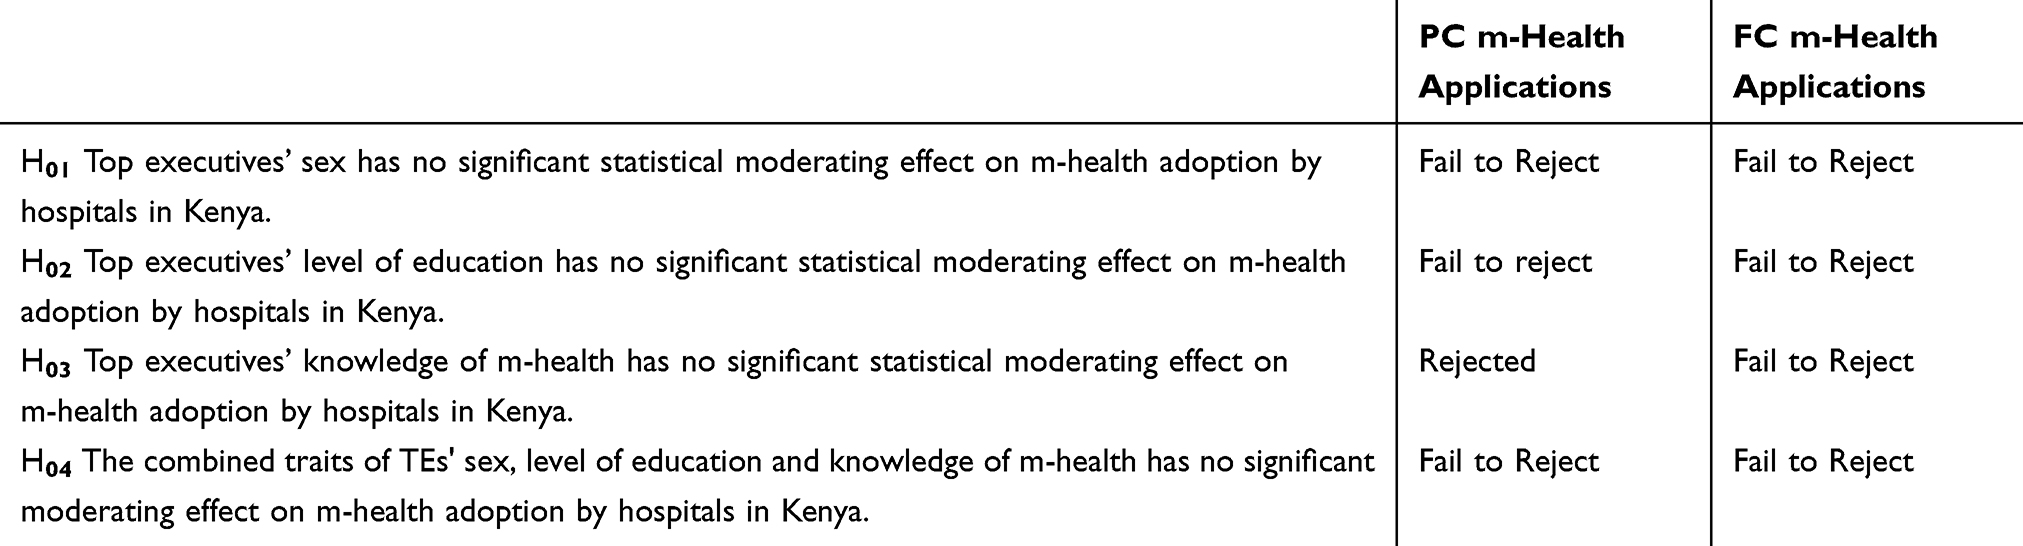 |
Table 15 Model Result Of Hypothesis Of Moderating Effect Of TEs' Traits On Adoption Of M-Health |
The final LRA equation of moderating effect of TEs' sex, level of education and knowledge of m-health is as follows:
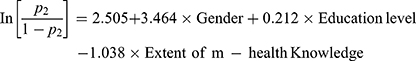

For FC m-health adoption, none of the top executive’s traits variables had statistically significant moderating effect on adoption of FC model. The combined effect of TEs' sex, level of education and knowledge of m-health did not have any statistically significant moderating effect on adoption of FC m-health applications. Table 13 summarizes the outcome of the four hypotheses tested in this study.
Discussion
This study uniquely shows that the moderating effects of TEs' traits are different for PC and FC m-health adoption. The sex of TE (p=0.041) and the level of TEs’ knowledge of m-health (p=0.009) were statistically significant moderators of adoption of PC m-health applications but not significant for adoption of FC m-health applications.
This study concurs with findings in China by Zhang et al11 that found that being male had a higher predictability and moderating effect on adoption of m-health and found significant gender differences in adoption patterns. This study also concurs with findings of Hoque12 in Bangladesh that found significant gender differences in adoption of m-health. In Kenya, Ochola10 found that the sex of the TE significantly moderated adoption of e-commerce by small and medium enterprises. However, unlike for e-commerce (which could be categorized as PC), this study shows that male TEs as opposed to female TEs are more likely to adopt m-health. It reinforces findings by Nderitu, Kassie and Shiferaw22 in the agricultural sector in Kenya that found females less likely to adopt innovations due to socio-economic and cultural barriers. Laukkanen23 also found significant disparity on adoption of internet and mobile banking innovations due to gender related barriers.
This study also concurs with the findings by Ochola10 that TEs' knowledge of technology significantly moderated the organization’s adoption of the technology. However, it differs from the findings by Ochola10 that the level of education of TE is a significant moderator of adoption of innovations. However, it is important to note that most studies reviewed did not investigate the differential effect of PC and FC m-health applications. PC m-health applications are relatively less expensive and less complex to integrate and adopt. They are relatively externally focused and may involve less complex management of changes in the hospital’s processes and procedures than FC m-health applications (mobile telemedicine, information and decision support system and patient records). Adoption of PC m-health applications may also elucidate less resistance to change by staff than FC m-health.
Therefore, two possible explanations may be derived from the differences in the moderating effect of PC and FC:
- the moderating effect of TEs' traits is affected by the level of complexity of the technology. While PC m-health applications that are less complex are affected by the traits of the TE, FC are not.
- The moderating effect of TEs' traits is affected by the required organizational change and change management that the technology entails. PC m-health applications may require less organizational change, capital investment and change management than FC and therefore are highly moderated by TEs' traits.
It is also important to note the unique context of Kenya that may also explain the differences in the significance of moderating effect between PC and FC. Unlike in other HICs, Kenya’s expansion of cell-phone coverage has expanded faster than ICT capacity of hospitals to support complex FC m-health innovations, which may provide a basis for confident investment in PC m-health compared to FC m-health.24 In 2016 the mobile penetration reached 88.1% with 37.8 million subscribers. Pre-paid subscriptions accounted for 97.3% (36.8 million subscribers). 99% of the internet subscribers in Kenya access the internet through their mobile phone, thus representing a good basis for PC m-health.6
The findings of this study, therefore, present significant considerations for effective scale up of m-health in Kenya and other LMICs.
In addition to developing digital or e-health policies, policy makers should integrate digital health modules in the medical education curricula and in the professional development programs of hospital managers. They should also ensure integration of policy incentives that remove any gender-related barriers to adoption of digital health innovations and reduce the gender-imbalance in the distribution of TEs of hospitals. The national and county level scale-up strategies should be differentiated for PC and FC m-health applications.
Managers and owners of hospitals should invest in capacity and professional development of the hospital’s leadership in digital health innovations and establish a differentiated PC and FC introduction and change management plan. They should also ensure implementation of organizational policies that remove gender related barriers to adoption of innovations and career path.
Developers and marketers of digital health innovations should integrate TEs' knowledge of m-health and gender-related barriers in their product development and marketing strategies for PC products. However, FC products may be moderated by other factors such as pre-existence of IC infrastructure and a cohesive change management strategy. This study also recommends a differentiated approach to future investigations of adoption of digital health innovations based on the focus of the innovations. Aggregating all m-health or digital innovation without PC or FC differentiation may continue to provide a techno-optimistic bias of studies on adoption of IT innovations.8,13
Conclusion And Recommendations
This study provides evidence of effects of top executives’ traits on adoption of m-health innovations by hospitals in Kenya. It shows that the sex of TE and knowledge of m-health were significant moderators of adoption or rejection of m-health applications. To increase adoption and scale up of m-health and minimize failure rates, priority should be given to increasing top executives’ knowledge of m-health and establishing policies and practices that minimize gender barriers to adoption of m-health and other digital health innovations. Therefore, policy makers, developers of m-health, and marketing practitioners need to develop a differentiated approach to PC and FC scale up strategies. While PC scale up requires mainstreaming of gender-sensitive training and continuous human resources development on digital health, FC will require greater focus on system and infrastructure capacity strengthening and strategic management of change.
Limitations And Suggestions For Future Research
This study did not use a longitudinal view of adoption of innovations in view of the nascent nature of m-health adoption in Kenya. It also did not separate the different processes and stages of decision making in adoption (e.g., considering adoption or adopted then rejected) but instead chose a binary approach (adopted or not adopted) in view of the nascency of the field of m-health and in compliance with the logit regression model used. This study did also not integrate the effect of network externalities (when a hospital adopts a technology because other hospitals within the network have adopted). It also did not disaggregate the moderating effect of TEs' tenure and category of ownership of the hospitals (public, private, or faith based) and geographical locations (urban, semi-urban, rural). Future studies should integrate these analyses and evaluate their longitudinal effect on PC and FC m-health and other digital health innovations.
Disclosure
The authors report no conflicts of interest in this work.
References
1. Tomlinson M, Rotheram-Borus MJ, Swartz L, Tsai AC. Scaling up mHealth: where is the evidence? PLoS Med. 2013;10(2):e1001382. doi:10.1371/journal.pmed.1001382
2. Akter S, Ray P. mHealth-an ultimate platform to serve the unserved. Yearb Med Inform. 2010;19(1):94–100. doi:10.1055/s-0038-1638697
3. World Health Organization. Mobile Health: new Horizons for health through mobile technologies; 2011. Available from: https://www.who.int/goe/publications/goe_mhealth_web.pdf.
4. Mehl G, Labrique A. Prioritizing integrated mHealth strategies for universal health coverage. Science. 2014;345(6202):1284–1287. doi:10.1126/science.1258926
5. Mechael P, Batavia H, Kaonga N, et al. Barriers and Gaps Affecting mHealth in Low- and Middle-Income Countries: Policy White Paper. Alliance; 2010.
6. The Netherland Enterprise Agency. The Kenya health sector market survey; 2016. Available from: https://www.rvo.nl/sites/default/files/2016/10/2016_Kenyan_Healthcare_Sector_Report_Compleet.pdf.
7. Gagnon M-P, Ngangue P, Payne-Gagnon J, Desmartis M. m-health adoption by healthcare professionals: a systematic review. J Am Med Inform Assoc. 2015;23(1):212–220. doi:10.1093/jamia/ocv052
8. Chib A. The promise and peril of mHealth in developing countries. Mobile Media Commun. 2013;1(1):69–75. doi:10.1177/2050157912459502
9. Oliveira T, Martins MF. Literature review of information technology adoption models at firm level. Electron J Info Sys Eval. 2011;14(1):110.
10. Ochola P. An empirical study of determinants of E-commerce adoption amongst Micro, Small and Medium Enterprises (Msmes) in Kenya. Int J Econ Commerce Manage UK. 2015;12(12):223–240. Available from: http://ijecm.co.uk/.
11. Zhang X, Guo X, Lai K-H, Guo F, Li C. Understanding gender differences in m-health adoption: a modified theory of reasoned action model. Telemed E-Health. 2013;20(1). doi:10.1089/tmj.2013.0092
12. Hoque MR. An empirical study of mHealth adoption in a developing country: the moderating effect of gender concern. BMC Med Inform Decis Mak. 2016;16:Article number: 51. doi:10.1186/s12911-016-0289-0
13. Hoti E. The technological, organizational and environmental framework of IS innovation adaption in small and medium enterprises. Evidence from research over the last 10 years. Int J Bus Manag. 2015;III(4):1–14. doi:10.20472/BM.2015.3.4.001
14. Rogers EM. Diffusion of Innovation.
15. Baker J. The technology–organization–environment framework. In: Dwivedi Y, Wade M, Schneberger S, editors Information Systems Theory. Integrated Series in Information Systems, vol 28. New York: Springer; 2012:231–245. doi:10.1007/978-1-4419-6108-2_12
16. Creswell JW. Research Design: Qualitative, Quantitative, and Mixed Methods Approaches. London, UK: Sage Publications, Incorporated; 2013.
17. Cresswell JW, Plano Clark VL. Designing and Conducting Mixed Methods Research. Thousand Oaks etc. Sage; 2007.
18. Jones M, Rattray J. Essential elements of questionnaire design and development. J Clin Nurs. 2010;16(2):234–243.
19. Field A, Miles J. Discovering Statistics Using SAS. London: Sage Publications; 2010.
20. Foxcroft C, Paterson H, Le Roux N, Herbst D. Psychological assessment in South Africa: a needs analysis: the test use patterns and needs of psychological assessment practitioners; 2004. Available from: http://repository.hsrc.ac.za/handle/20.500.11910/7498.
21. Fincham JE. Response rates and responsiveness for surveys, standards, and the Journal. Am J Pharm Educ. 2008;72(2):43. doi:10.5688/aj720243
22. Ndiritu SW, Kassie M, Shiferaw B. Are there systematic gender differences in the adoption of sustainable agricultural intensification practices? Evidence from Kenya. Food Policy. 2014;49(Part 1):117–127. doi:10.1016/j.foodpol.2014.06.010
23. Laukkanen T. Consumer adoption versus rejection decisions in seemingly similar service innovations: the case of the Internet and mobile banking. J Bus Res. 2016. doi:10.1016/j.jbusres.2016.01.013
24. Wesolowski A, Eagle N, Noor AM, Snow RW, Buckee CO. Heterogeneous mobile phone ownership and usage patterns in Kenya. PLoS One. 2012;7(4):e35319. doi:10.1371/journal.pone.0035319
 © 2019 The Author(s). This work is published and licensed by Dove Medical Press Limited. The full terms of this license are available at https://www.dovepress.com/terms.php and incorporate the Creative Commons Attribution - Non Commercial (unported, v3.0) License.
By accessing the work you hereby accept the Terms. Non-commercial uses of the work are permitted without any further permission from Dove Medical Press Limited, provided the work is properly attributed. For permission for commercial use of this work, please see paragraphs 4.2 and 5 of our Terms.
© 2019 The Author(s). This work is published and licensed by Dove Medical Press Limited. The full terms of this license are available at https://www.dovepress.com/terms.php and incorporate the Creative Commons Attribution - Non Commercial (unported, v3.0) License.
By accessing the work you hereby accept the Terms. Non-commercial uses of the work are permitted without any further permission from Dove Medical Press Limited, provided the work is properly attributed. For permission for commercial use of this work, please see paragraphs 4.2 and 5 of our Terms.