")
Back to Journals » International Journal of General Medicine » Volume 15
The Mechanism and Prognostic Value of DNA Polymerase δ Subunits in Hepatocellular Carcinoma: Implications for Precision Therapy
Authors Wang Q, Zhang S, Xu Q, Liang J, Zhang P, Huang W, Lin Z, Zheng S, Gu S, Yan J
Received 18 November 2021
Accepted for publication 25 January 2022
Published 9 February 2022 Volume 2022:15 Pages 1365—1380
DOI https://doi.org/10.2147/IJGM.S347162
Checked for plagiarism Yes
Review by Single anonymous peer review
Peer reviewer comments 2
Editor who approved publication: Dr Scott Fraser
Qing Wang,1,* Song Zhang,2,* Qiaodong Xu,1 Jiahong Liang,1 Peidong Zhang,1 Wenlong Huang,1 Zhihuan Lin,1 Shaodong Zheng,1 Songgang Gu,1 Jiang Yan1
1Department of Biliary-Pancreatic Minimally Invasive Surgery, The First Affiliated Hospital of Shantou University Medical College, Shantou, 515041, Guangdong, People’s Republic of China; 2Department of General Surgery, The Second Affiliated Hospital of Anhui Medical University, Hefei, 230601, Anhui, People’s Republic of China
*These authors contributed equally to this work
Correspondence: Jiang Yan; Songgang Gu, Email [email protected]; [email protected]
Purpose: Polymerase δ (POLD) proteins is a pivotal B-family DNA polymerase in the process of genome replication and repair and are comprised of POLD1-4. The predictive value of POLDs in hepatocellular carcinoma (HCC) has not been evaluated until now.
Patients and Methods: A total of 369 hepatocellular carcinoma samples and 50 adjacent normal samples were enrolled from the TCGA-LIHC database, and the GSE10186 database was also used. Transcription, methylation and genetic alteration status of HCC patients were evaluated by GEPIA, Kaplan–Meier plotter, cBioPortal, MethHC, MethSurv. SurvExpress was employed to generate the overall prognosis prediction signature of POLDs. POLDs coexpressed genes were explored and enriched in potential pathways. K-M curves were generated to compare the different survival results in different groups, while ROC curves were used to validate the efficiency of the POLD signature.
Results: All four POLD subunits were highly expressed in HCC tumor tissues. POLD1-3 and increased mRNA levels were also positively associated with advanced tumor stage and OS prognosis. Methylation in the promoter of POLDs affects mRNA expression and OS, especially for some specific CpG sites. Meanwhile, POLDs could preferably predict the prognosis for patients who suffered from a high gene mutation burden. We evaluated the combined prognostic predictive value of four POLD subunits in both the TCGA-LIHC and GSE10186 databases and recognized the statistically significant HR of the high-risk group, along with the reliable predictive value. The coexpressed gene sets and annotation results showed that the POLD coexpressed genes were mostly associated with DNA repair and cell cycle regulation pathways.
Conclusion: POLD is an essential predictive factor for the prognosis of HCC. The united signature could precisely identify unfavorable clinical outcome of HCC.
Keywords: DNA polymerase δ subunits, hepatocellular carcinoma, DNA repair, prognosis
Introduction
Hepatocellular carcinoma (HCC) is the 5th and 9th most frequent malignant carcinoma in males and females worldwide and is the 3rd leading cause of cancer-specific death.1 There were approximately 42,030 new cases and 31,780 estimated deaths of HCC patients in 2019 around America.2 Due to the increased infection risk of hepatitis B or C virus (HBV or HCV), regions with traditional low HCC incidence have experienced more cases in recent years, such as the United States and Canada.3 China might face the largest number of HCC patients based on the large size of the population, as well as the high frequency of hepatitis B virus (HBV); almost 10% of the population is infected with HBV.4–6 A favorable survival prognosis of HCC patients after surgical or medicinal treatment has been observed; however, effective prognostic predictive factors are still scarce.7 Although serum alpha-fetoprotein (AFP) is regarded as the diagnostic and prognostic factor for HCC patients, it is always affected by side diseases, such as chronic hepatitis, cirrhosis and stetosis.8–10 On the other hand, up to 40% of HCC patients are AFP negative.11,12 Therefore, it is necessary to study new biomarkers to illustrate the prognosis of HCC.
Polymerase α, ε and δ are the three pivotal B-family DNA polymerases in the process of genome duplication.13 Polymerase δ (POLD) is reported to synthesize DNA in both the leading strand and lagging strand.14,15 Polymerase δ could also control the process of break-induced replication and homologous recombination to safeguard the stability of the genome.16,17 Polymerase δ is comprised of four subunits: POLD1 is the catalytic subunit, and the large p125 subunit provides the essential catalytic subunit and performs its function in protein assembly by combining with the accessory subunits POLD2, POLD3 and POLD4.18 The mechanism of POLDs in tumorigenesis has been reported in several tumors. Wang et al19 illustrated that POLE/POLD1 mutations are promising potential predictive biomarkers for positive immune checkpoint inhibitor therapy outcomes. Elgaaen et al20 reported that POLD2 increased approximately 2~20-fold compared with moderately to poorly differentiated serous carcinomas and was linked with poor prognosis. Qin et al21 found that increased expression of POLD1 was associated with shorter recurrence-free survival and acted as a potential prognostic marker for invasive breast carcinoma.
However, the predictive value of POLDs in HCC has not been evaluated until now. In the current study, we assessed the transcription, methylation and genetic alteration of POLDs and printed the overall prognostic results by POLDs based on TCGA and GEO databases.
Materials and Methods
Genetic and Clinical Data of HCC Patients
A total of 369 hepatocellular carcinoma samples and 50 adjacent normal samples were enrolled in the current study. Data of transcription profiling (mRNA SeqV2), genetic alterations (gene level) and methylation (Methylation450k) for POLDs were all from The Cancer Genome Atlas (TCGA) project (https://www.cancer.gov). Overall survival (OS) time and status were also considered to represent the prognosis of each patient, as well as the tumor stage.
Gene Expression, Genetic Alteration and DNA Methylation Effect on Prognosis
The pancancer expression of POLDs was assessed by ULCAN (http://ualcan.path.uab.edu/analysis.html).22 We further evaluated the prognostic value of POLDs in pancancer by GEPIA (http://gepia.cancer-pku.cn) and compared POLDs mRNA expression between normal and tumor groups and between different tumor stages.23 The prognostic evaluation of POLDs was assessed via the Kaplan–Meier (K-M) plotter Pancancer RNA-seq platform (https://kmplot.com/analysis/index.php?p=service&cancer=pancancer_rnaseq), while the best separation determined by algorithms was chosen as the method to separate patients into two groups.24 The genetic alterations of POLDs were illustrated by the cBioPortal platform (http://www.cbioportal.org/), and OncoPrinter was employed to determine the frequency of genetic alterations among the recorded databases in cBioPortal.25,26 The MethHC database (http://methhc.mbc.nctu.edu.tw/php/index.php) was used to evaluate the association between DNA promoter region methylation and gene expression.27 We also characterized the methylation effect on OS. The prognostic predictive value of DNA methylation CpG sites on POLDs was analyzed by the TCGA database-based methylation-prognosis visualization web tool MethSurv (https://biit.cs.ut.ee/methsurv/).28
Prognostic Signature Based on Four POLDs
To comprehensively appraise the prognostic predictive value of the POLDs, we employed the public resource-based survival assessment platform SurvExpress (http://bioinformatica.mty.itesm.mx:8080/Biomatec/SurvivaX.jsp) to determine the characteristics of the signature.29 We chose the LIHC-TCGA-Liver hepatocellular carcinoma database (n=361) and Hoshida Golub Liver GSE10186 database (n=80) to evaluate the POLD signature. Based on the multivariate Cox analysis, the coeffect (coef) value of each POLD was determined, and then each patient obtained a risk score generated by the mRNA expression of POLDs and the coef value. Subsequently, patients were divided into high- and low-risk groups, K-M curves were conducted to illustrate the different OS between the two groups, and receiver operating characteristic (ROC) curves were used to evaluate the survival curves.
POLDs Related Genes and Pathways
POLD-related genes were generated with UALCAN (http://ualcan.path.uab.edu/index.html).22 We downloaded the coexpressed genes to each POLD, and the cut-off value was |R|>0.3. Gene enrichment annotation was also performed on GO molecular functions, GO biological processes, GO cellular components and KEGG pathways by Metascape (http://metascape.org).30
POLDs Related Immunocytes
Immunocytes and immune microenvironment have important impacts on tumorigenesis and patient prognosis.31 We evaluated the potential association between POLDs and immunocytes by TIMER (https://cistrome.shinyapps.io/timer/).32 In addition, we evaluated the correlation of POLD expression and immune checkpoint levels by ENCORI (https://starbase.sysu.edu.cn/index.php).33
Immunohistochemical Staining
Tissue microarrays containing 10 HCC samples and 10 adjacent normal liver samples with associated clinicopathological information were purchased from Shanghai Outdo Biotech Co. Ltd. (Cat# HLivH020PG02-M-255, China). Immunohistochemical staining (IHC) assays were performed on a tissue microarray using anti-POLD1 antibody (Cat#383045, dilution 1:200, ZEN-BIO, Chengdu, China), anti-POLD3 antibody (Cat#bs-2755R, dilution 1:200, Bioss, Boston, USA) and anti-PDL1 antibody (Cat#GB14132, dilution 1:200, Servicebio, Wuhan, China). The IHC staining score (H-score) can be divided into two parts: staining intensity and percentage of positive tumor cells. Staining intensity was classified as 0 (no staining), 1 (weak staining), 2 (moderate staining), and 3 (strong staining). The percentage of positive tumor cells was classified as 1+ (≤25%), 2+ (26–50%), 3+ (51–75%), and 4+ (>75%). The final expression scores were calculated by multiplying the two variables together.
Prediction of Potential Target Drugs
The potential treatment drugs prediction for hepatocellular carcinoma was also evaluated in the current study. We compared the clinical response of common chemotherapy drugs used in hepatocellular carcinoma via the “MOVICS” packages.34 Moreover, we also searched for new drugs through the GSEA online website.35
Statistical Analysis
Univariate Cox regression analysis was used to assess the CpG site effect on OS. Multivariate Cox regression analysis of POLDs was performed in OS to generate the coef and risk score formula. K-M curves were generated to compare the different survival results in different groups, while ROC curves were used to validate the efficiency of the POLD signature. A P value less than 0.05 was considered a significant result in all cases.
Results
POLDs Increased in Tumor Tissues and Indicated Poor Prognosis in Pan Cancer
We evaluated the expression of POLDs in tumor tissues compared with normal tissues across cancers and revealed that POLDs were elevated in most cancer types, POLD1 (20/24, 83.33%), POLD2 (18/24, 75.00%), POLD3 (10/24, 41.67%), and POLD4 (14/24, 58.33%), especially in HCC patients (Figure 1A). Furthermore, we evaluated the prognostic value of overall survival of POLDs and observed that the increased expression of POLDs was associated with poor clinical outcome in several cancer types, especially ACC, LGG, LIHC, LUAD, and MESO (Figure 1B).
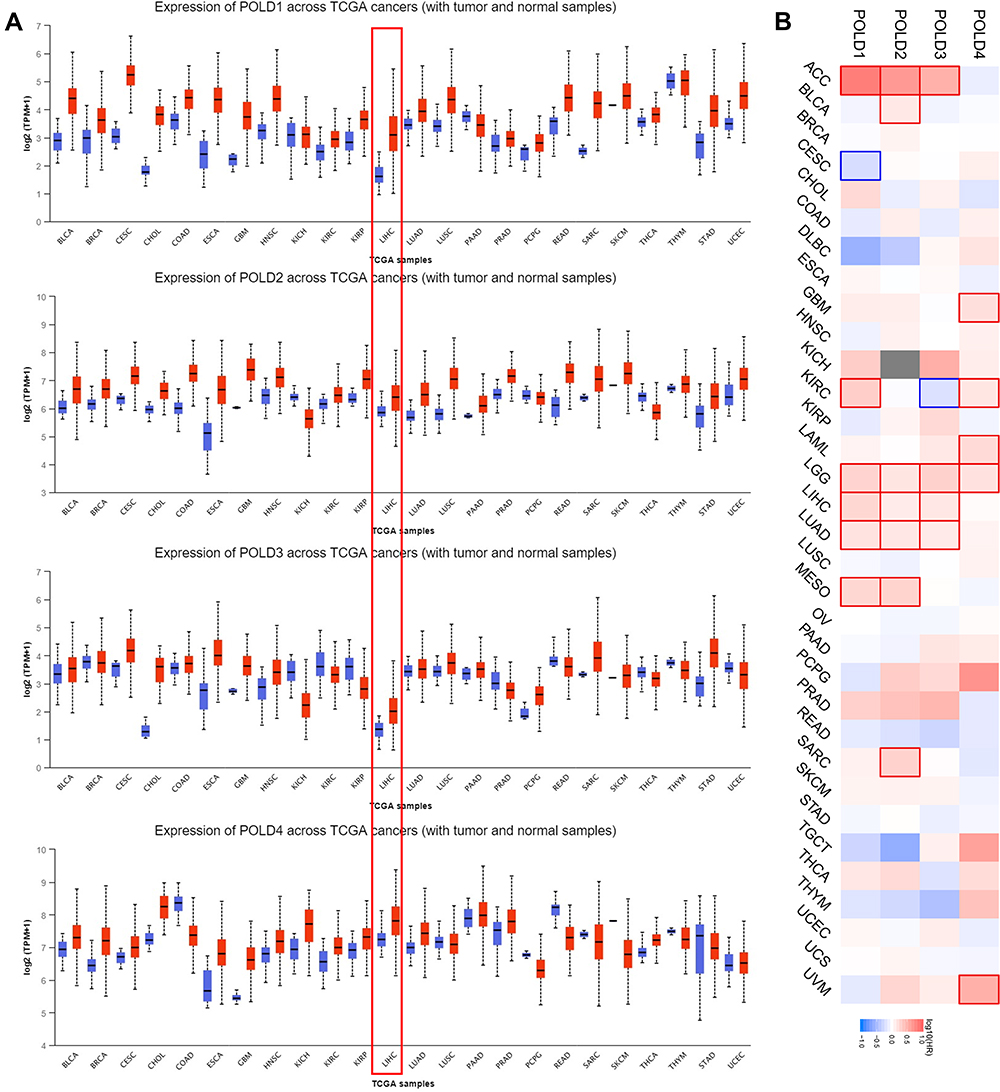 |
Figure 1 Expression and prognostic value of POLDs in pancancer. (A) Expression of POLDs among tumor and normal tissues in pancancer; (B) Prognostic value of POLDs in pancancer. |
POLDs Increased Significantly in Hepatocellular Carcinoma and Correlated with Poor Prognosis
Based on the mRNA expression data of HCC tissue and adjacent normal tissue, we evaluated the difference in POLDs and overall survival. POLD1 increased dramatically in tumor tissues compared to normal tissues and increased with advanced tumor stage (P<0.001), while high POLD1 expression also indicated poor OS (P<0.001) (Figure 2A). Regarding POLD2, increased expression was also observed in tumor tissues, as well as advanced tumor stage (P=0.0375). High POLD2 expression was associated with poor OS (P<0.001) (Figure 2B). POLD3 expression in tumor tissues was higher than normal, and the evaluated level was associated with tumor stage (P=0.0119) and linked to unfavorable OS (P<0.001) (Figure 2C). However, we only observed the increased mRNA level of POLD4 in tumors, not the story with advanced tumor stage and OS (Figure 2D).
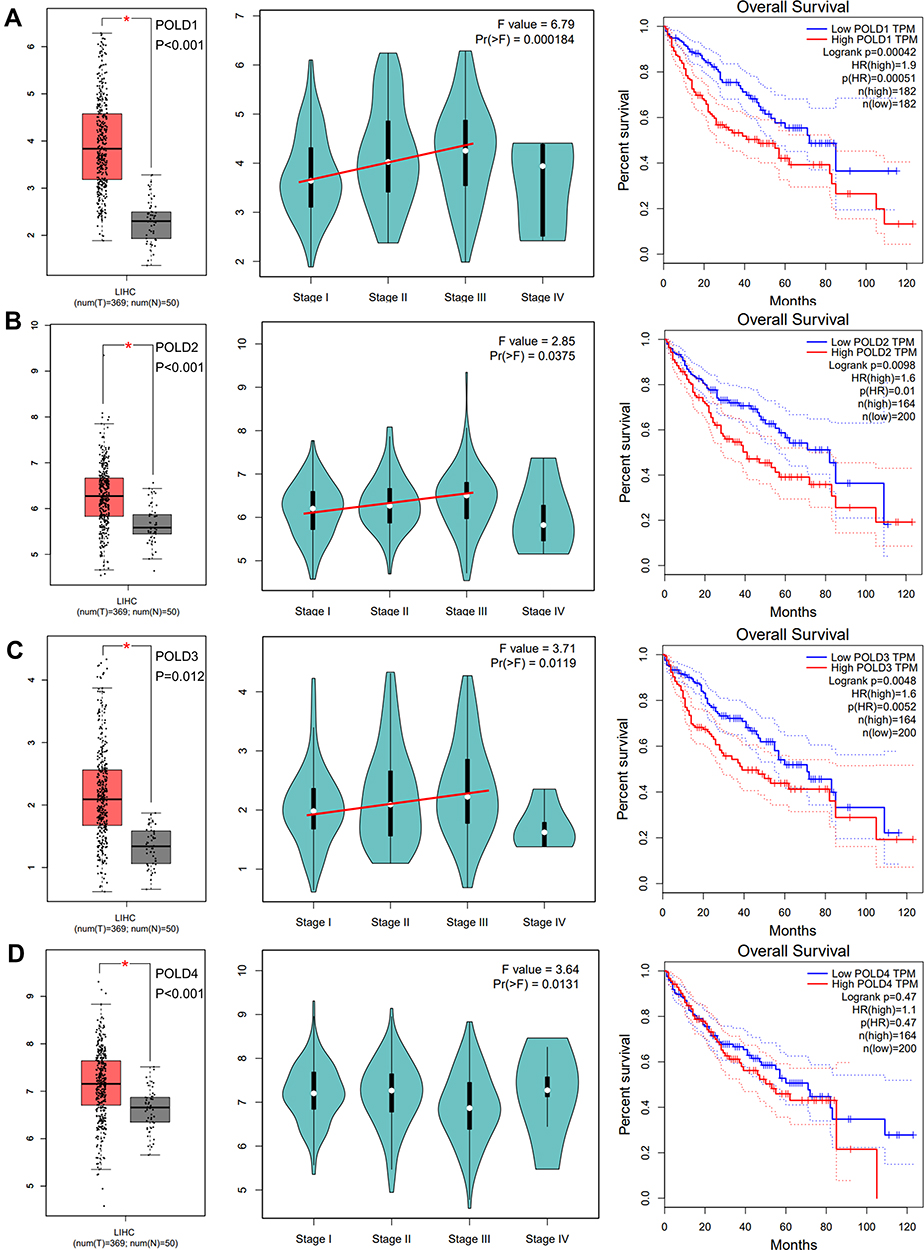 |
Figure 2 mRNA expression and prognostic value of POLDs. The increased mRNA expression of POLD1 (A), POLD2 (B), and POLD2 (C) in tumor tissues and advanced tumor stage indicated poor prognosis but not POLD4 (D). *P < 0.05. |
POLDs Methylation Affects Gene Expression and Prognosis
To study the potential reason for the increased mRNA expression of POLDs in tumor tissue, we evaluated the methylation status of the promoter regions of POLDs. As shown in Figure 2A, we found that promoter methylation decreased in tumor tissues compared to normal tissues in POLD1 (P=0.0089), POLD2 (P=0.0002), and POLD4 (P<0.0001) but not POLD2 (P=0.0838) (Figure 3A). The methylation β score in the promoter region was negatively associated with the gene expression of POLD1 (R=−0.190, P=0.009), POLD3 (R=−0.251, P<0.001), and POLD4 (R=−0.233, P=0.001) (Figure 3B). Furthermore, we assessed how CpG site methylation affects the OS of hepatocellular carcinoma patients. We found that methylation of cg02298523 and cg19063387 in POLD1 was linked to favorable OS, as well as the methylation of cg00453717 and cg01173485 sites in POLD3. Meanwhile, methylation of the cg20428722, cg20469507, cg26564815, and cg26717758 sites in POLD3 was associated with poor OS, and methylation of the cg11754314 and cg18235480 sites indicated poor OS (Table 1, Figure 3C).
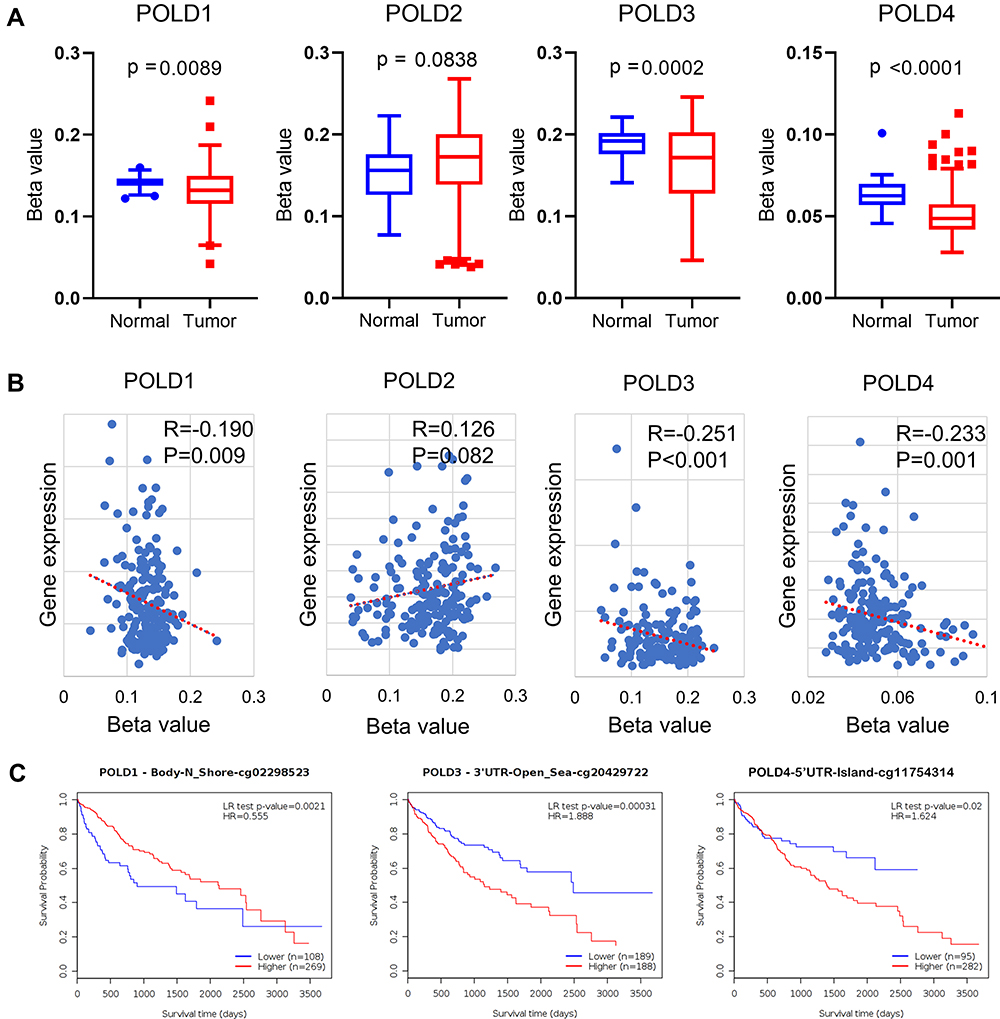 |
Figure 3 POLDs methylation affects gene expression and prognosis. (A) The methylation β value of the POLDs promoter region compared in normal and tumor tissues; (B) The correlation between the methylation β value of the POLDs promoter and gene expression; (C) The representative K-M plotter for the OS of HCC patients with different methylation status of CpG sites. |
Genetic Alterations of POLDs and the Effect of POLDs in Patients with Different Tumor Mutant Burdens
With the help of OncoPrinter, we analysed the frequency of genetic alterations among the POLDs. The overall genetic alteration rate was very low in POLDs; for example, only approximately 1.2% of patients had genetic alterations in POLD4 (Figure 4A). Due to the pivotal role of POLDs in DNA replication and repair, we appraised their effect on OS in HCC patients with high and low tumor mutational burdens and found that higher expression of POLDs was significantly linked to poor prognosis in patients with a high mutational burden, especially POLD1 (P=0.0022) and POLD3 (P=0.04) (Figure 4B), but not in patients with a low mutational burden (Figure 4C).
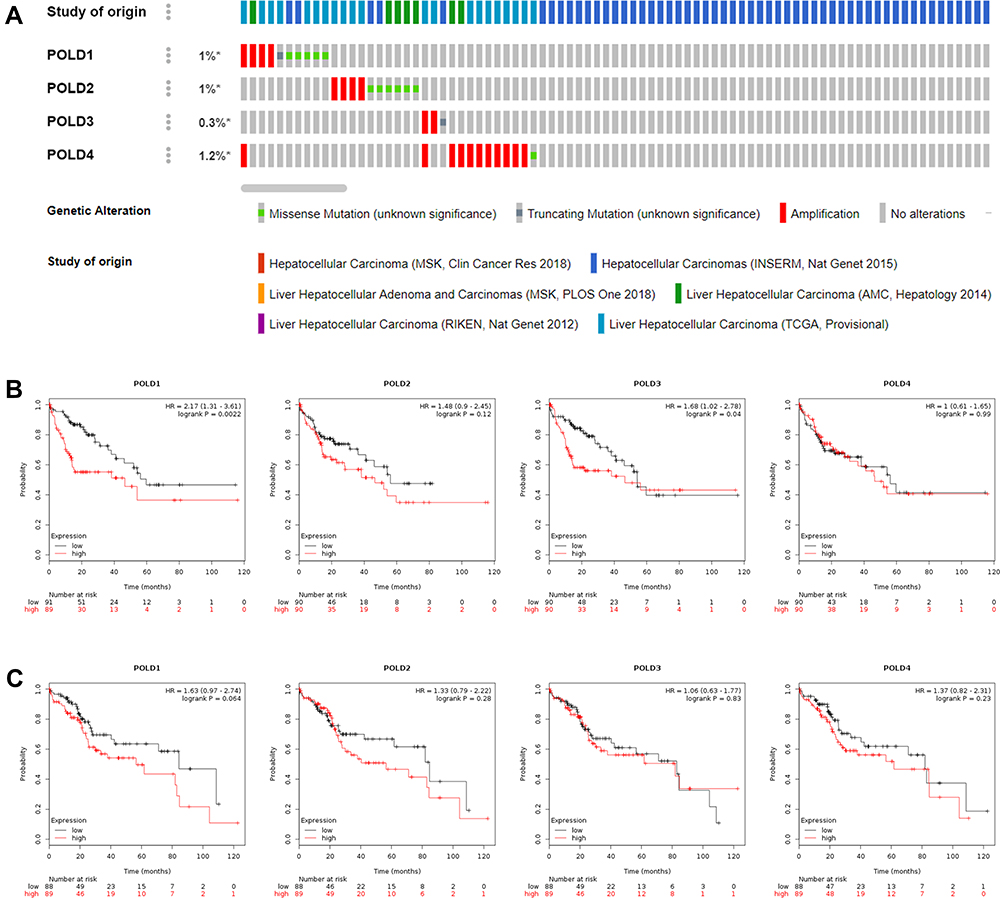 |
Figure 4 Genetic alterations of POLDs and the effect of POLDs in patients with different tumor mutational burdens. (A) The frequency of genetic alterations among the POLDs; (B) The OS prognosis of POLDs with a high tumor mutation burden; (C) The OS prognosis of POLDs with a low tumor mutation burden. *P < 0.05. |
United Prognosis Predicting Value of Four POLDs
To estimate the overall predictive value of POLD for OS, we employed SurvExpress to generate the results. For patients in the TCGA-LIHC database, the risk score was generated by the coef of each POLD with the different expression levels for each patient. Patients in the high-risk group illustrated higher mRNA levels of POLD1 (P<0.001), POLD2 (P<0.001) and POLD3 (P<0.001) than those in the low-risk group (Figure 5A and B), which is consistent with the expression pattern in tumor and normal tissues. We also observed that a high risk indicated an unfavorable OS (HR=2.56, 95% CI: 1.71–3.84, P<0.001) (Figure 5C), and the AUC value was 0.655 (Figure 5D). Moreover, we also detected the predictive value of POLDs in the GSE10186 database, and similar results were obtained. Patients with high-risk scores also had high levels of POLD1 (P=0.0269), POLD2 (P<0.001), and POLD3 (P<0.001) (Figure 5E and F). The high risk was also associated with poor prognosis in GSE10186 patients (HR=2.17, 95% CI: 1.05–4.47, P=0.03576), while the AUC value was 0.709 (Figure 5G and H).
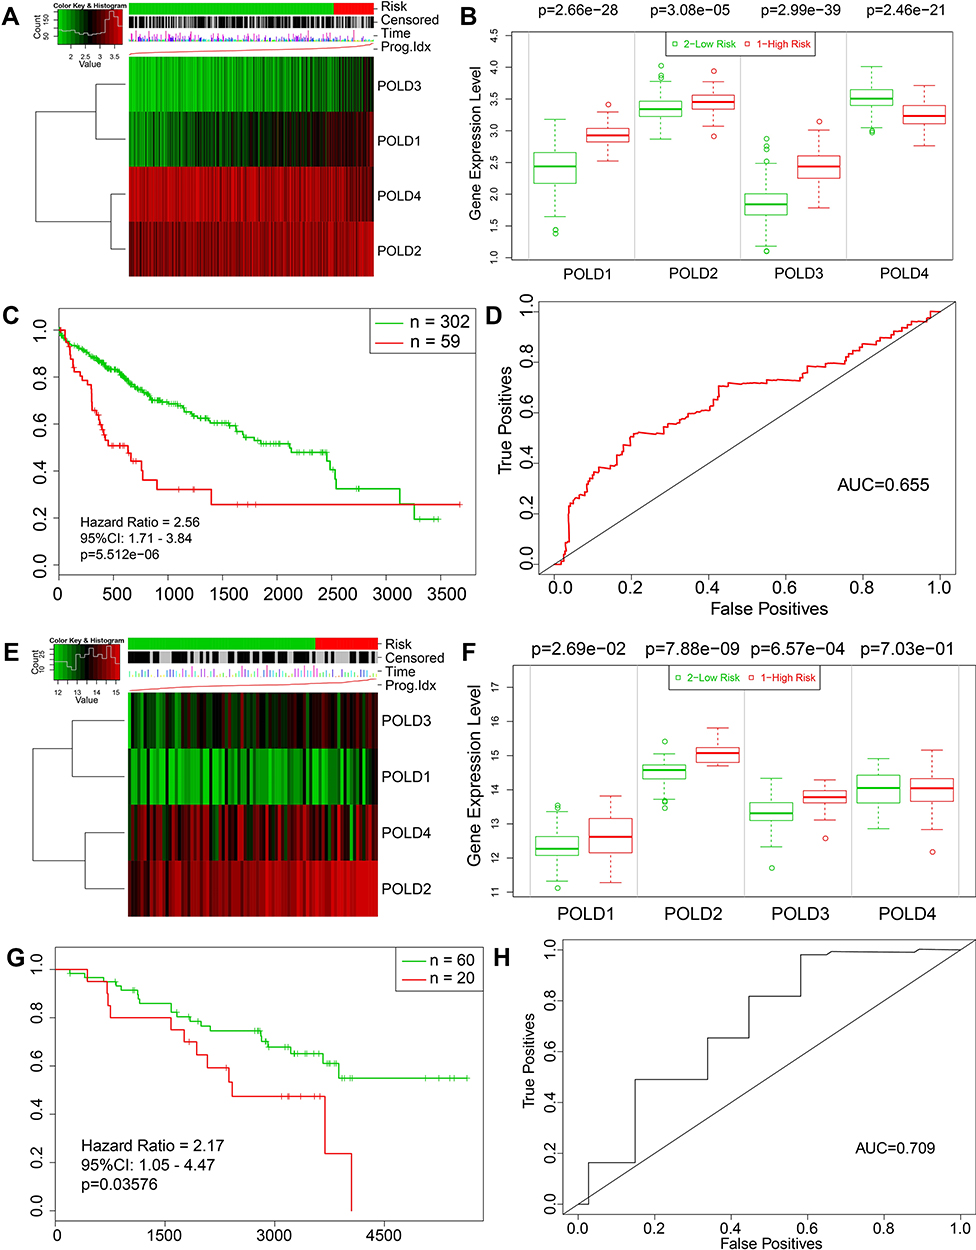 |
Figure 5 The comprehensive prognostic value of four. (A) Heatmap of POLDs expression in low- and high-risk patients in TCGA-LIHC; (B) The differential expression of POLDs in low- and high-risk patients in TCGA-LIHC; (C) K-M plotter showing the comprehensive prognostic value of POLDs in TCGA-LIHC; (D) ROC curve showing the prognostic accuracy of POLDs in TCGA-LIHC. (E) Heatmap of POLDs expression in low- and high-risk patients in GSE10186. (F) Differential expression of POLDs in low- and high-risk patients in GSE10186. (G) K-M plotter showing the comprehensive prognostic value of POLDs in GSE10186. (H) ROC curve showing the prognostic accuracy of POLDs in GSE10186. |
Enrichment Annotation Among POLDs Coexpressed Genes
We downloaded the POLDs coexpressed genes from the UCLAN online database with the cut-off value of |R|>0.3. Finally, 6468 genes were reported to be associated with POLD1, 1247 genes with POLD2, 7094 genes with POLD3 and 47 genes with POLD4. We merged the four groups and chose the genes correlated with at least three POLDs to the gene pool, and 1009 POLD coexpressed genes were chosen for the next step of enrichment annotation (Figure 6A). The enrichment annotation results showed that POLDs mostly affected the cell cycle, DNA repair, DNA replication, chromosome segregation and cell cycle regulation pathways (Figure 6B and C).
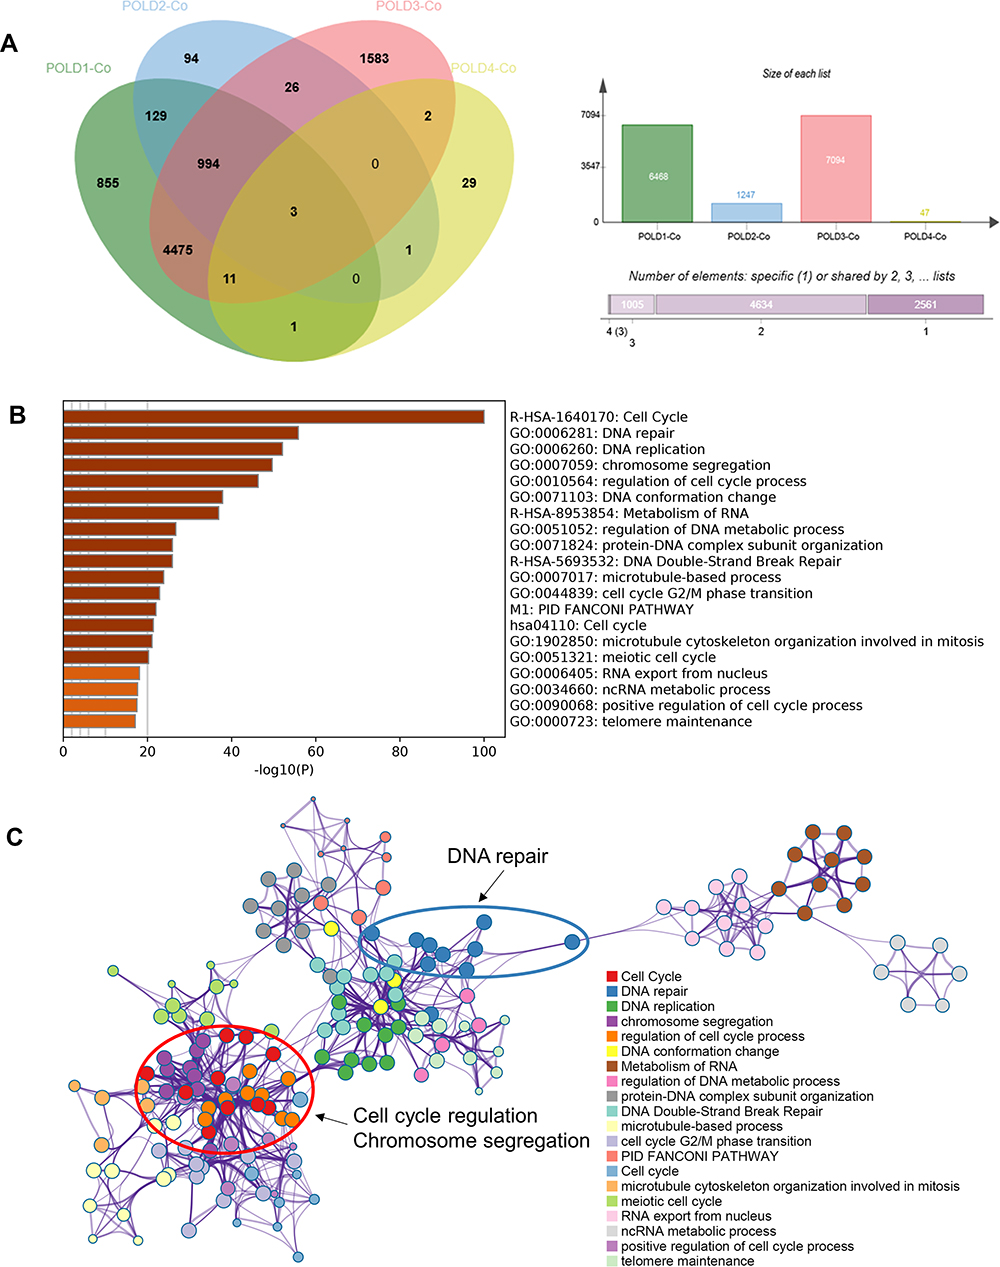 |
Figure 6 Enrichment annotation among POLDs coexpressed genes. (A) The numbers of each POLD coexpressed gene obtained from the UCLAN online database. (B and C) Pathway enrichment of POLD coexpressed genes. |
POLDs Link with Immunocytes and Immunotherapy
We evaluated the association between POLDs and immunocytes and observed that POLD1 and POLD3 were significantly associated with the infiltration of immunocytes, especially B cells (POLD1, R = 0.468, P < 0.001; POLD3, R = 0.442, P < 0.001) and macrophages (POLD1, R = 0.397, P < 0.001; POLD3, R = 0.504, P < 0.001) (Figure 7A). Meanwhile, POLD2 and POLD3 did not show a significant association with the infiltration of immunocytes (Figure S1). In addition, we also assessed and observed that POLD1 (PDCD1, R = 0.318, P < 0.001; CD274, R = 0.172, P < 0.001; PDCD1, R = 0.277, P < 0.001) and POLD3 (PDCD1, R = 0.277, P < 0.001; CD274, R = 0.278, P < 0.001; PDCD1, R = 0.232, P < 0.001) were significantly positively associated with the expression of immune checkpoints (Figure 7B).
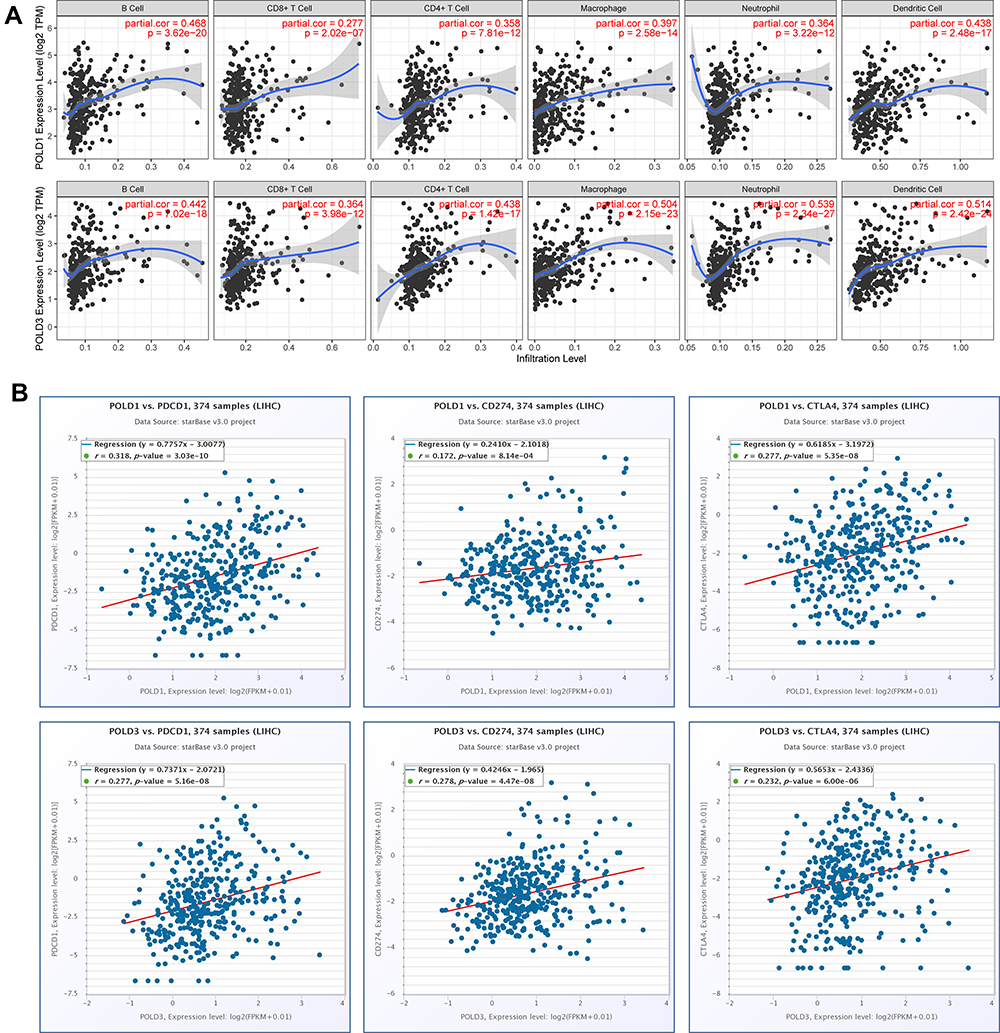 |
Figure 7 POLDs expression with immune microenvironment. (A) Correlation between POLD1, POLD3 and six immunocytes; (B) Correlation between POLD1, POLD3 and the immune checkpoints PDCD1, CD274 and CTLA4. |
Potential Drugs Targeting the POLDs for Treatment
We revealed that patients in the POLDs-determined high-risk group were more suitable for chemotherapy, which is commonly applied in clinical treatment, including 5-fluorocracil, cisplatin, doxorubicin, gemcitabine, and sorafenib (all P < 0.001, Figure 8). Moreover, we also searched for potential new drugs via the GSEA online website, and the top effective drugs for POLDs are listed in Table 2. The negative correlation indicated that the higher the level of POLDs was, the more sensitive the drug was to the target drug.
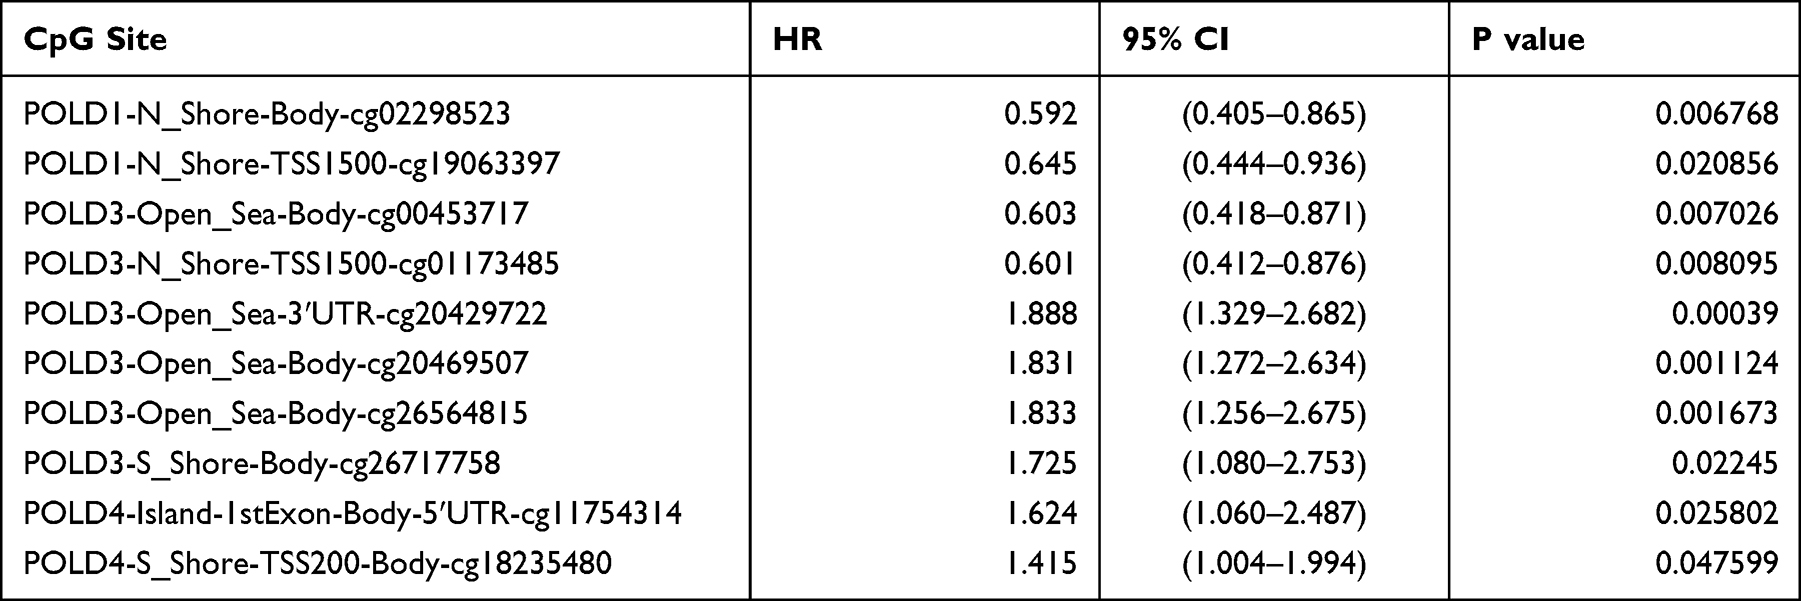 |
Table 1 The Significant Prognostic Value of CpG Sites in POLDs |
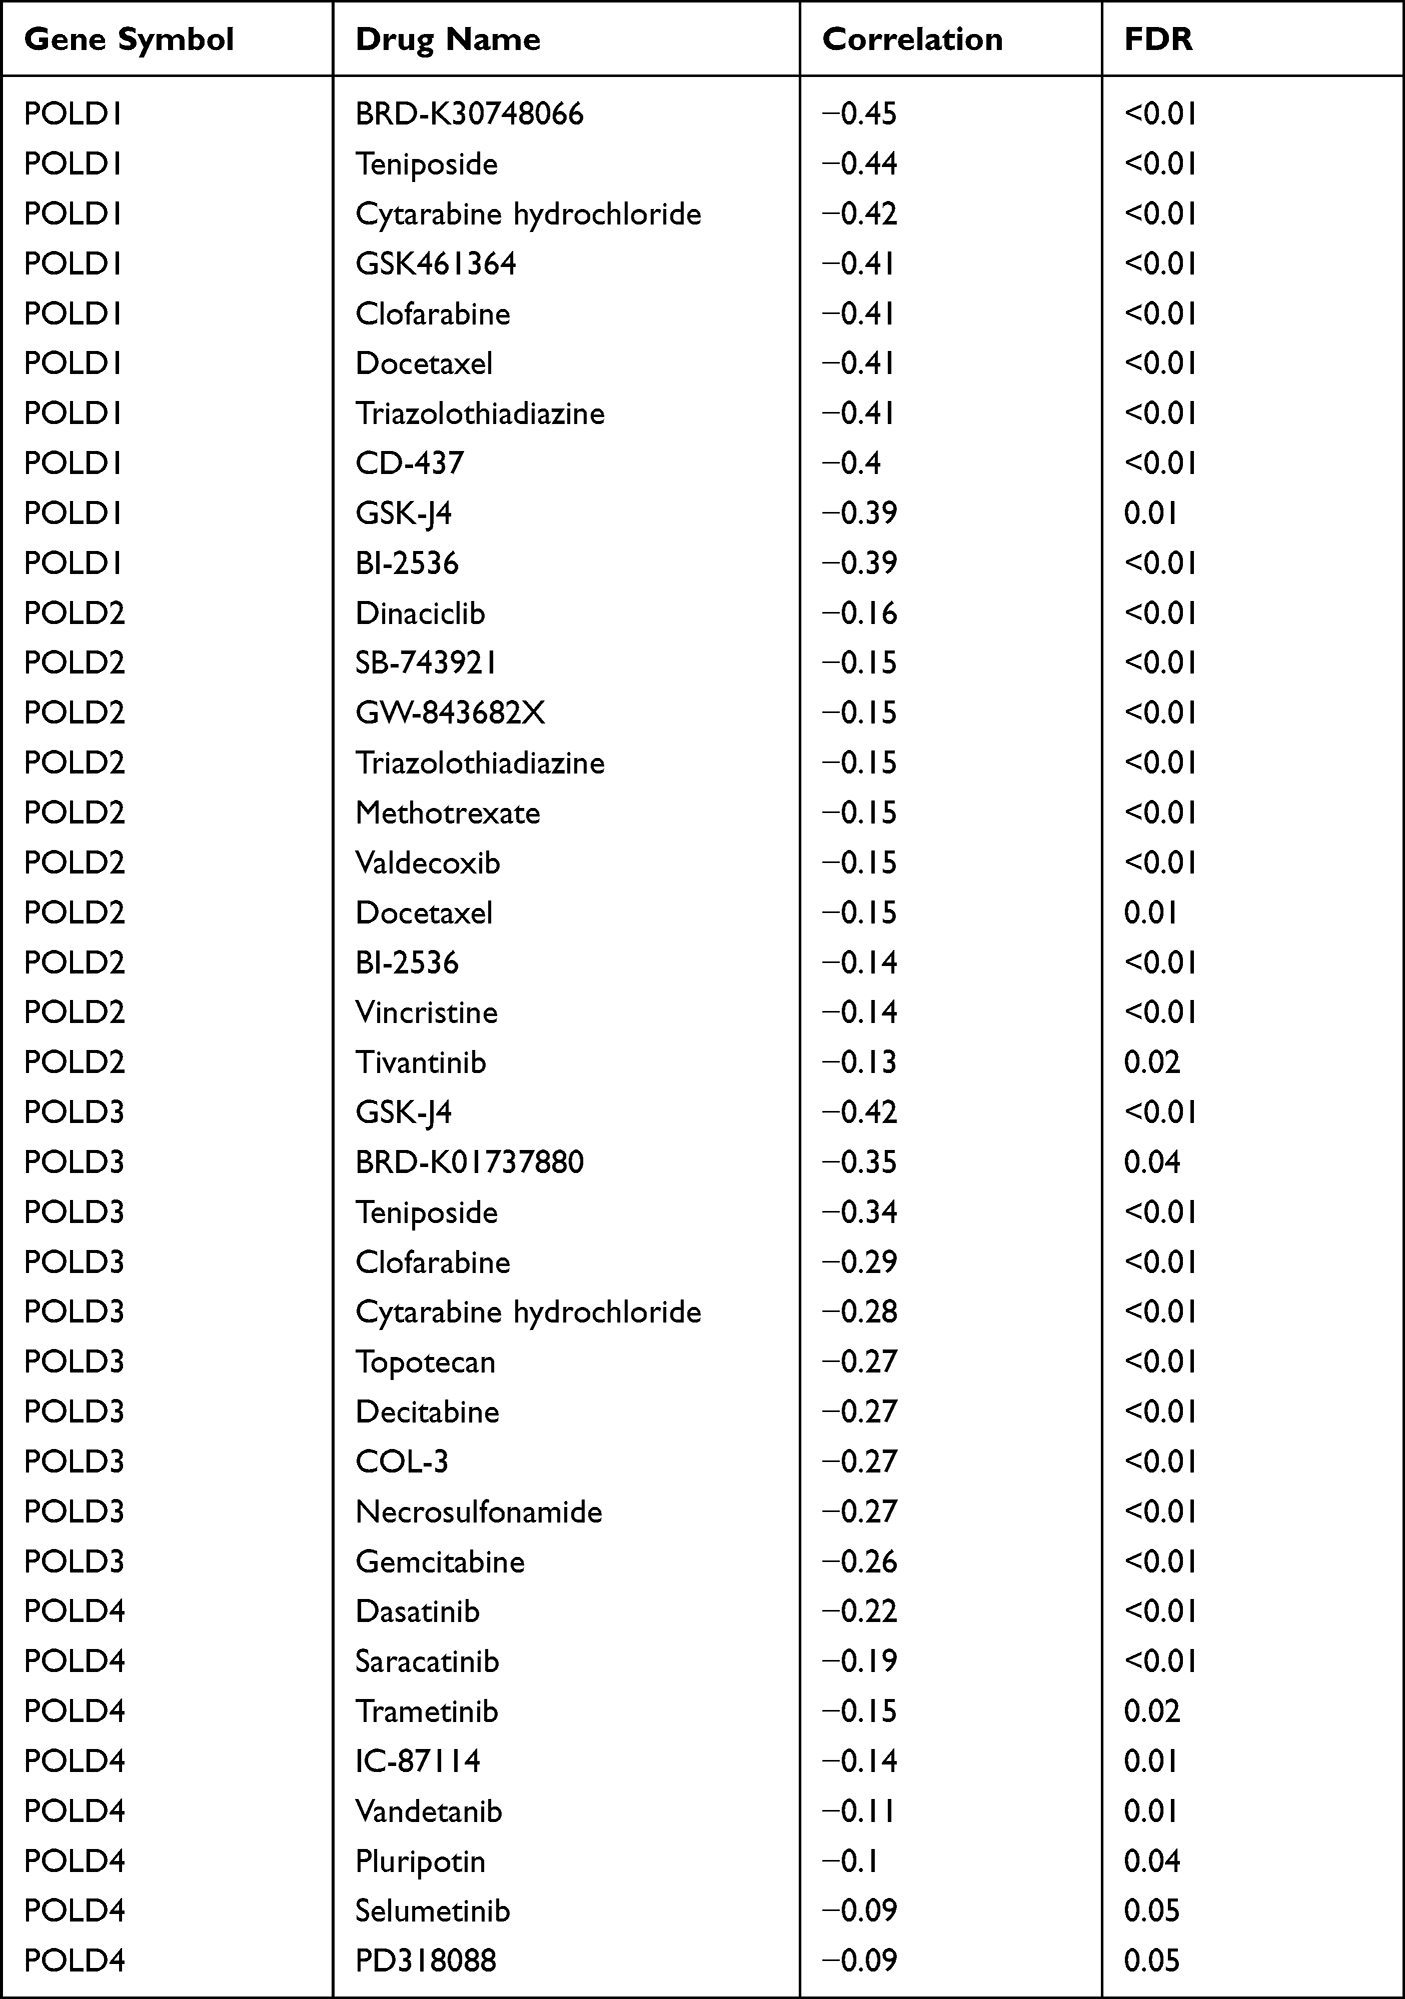 |
Table 2 Potential Target Drugs for POLDs Treatment |
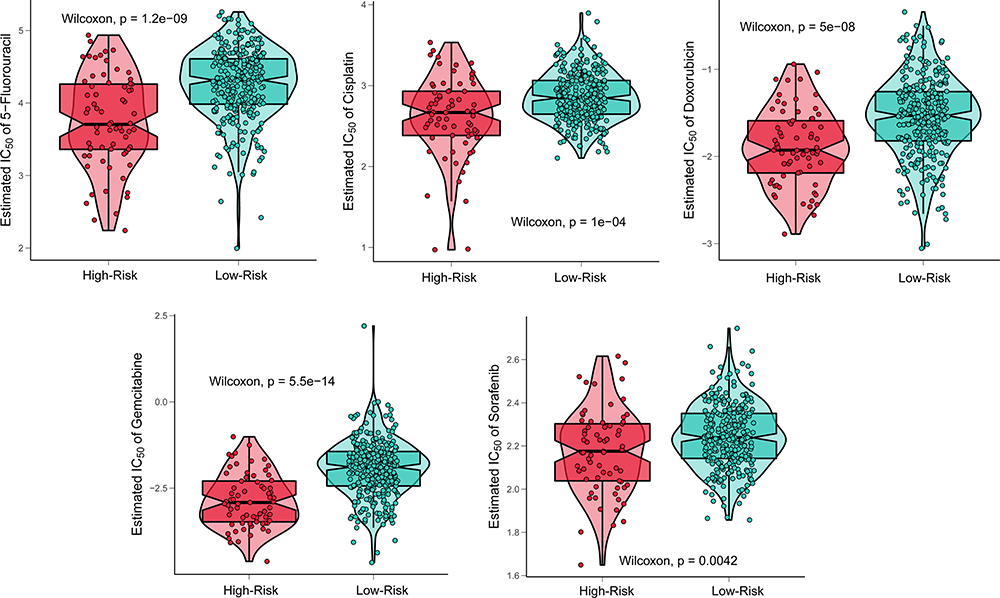 |
Figure 8 Response to common chemotherapy drugs in POLDs risk groups. |
Validation of the Expression of POLD1 and POLD3 in a Tissue Microarray
To further confirm the expression of POLDs in HCC, we employed a tissue microarray, and the proteins POLD1 and POLD3 were detected due to their higher index in the prognostic formula. Notably, we observed a higher level of POLD1 protein in HCC tissues than in adjacent normal liver tissues (P = 0.0109, Figure 9A), as well as a higher protein level of POLD3 (P = 0.0009, Figure 9B). Moreover, we also observed an increased level of POLD1 in stage III HCC tissues compared with stage I–II HCC tissues (P = 0.0027, Figure 9D). In the above mentioned results, we revealed the positive correlation of POLD1/3 and PD-L1, implicating potential links with immunotherapy. We added IHC staining of PD-L1 and further confirmed the positive correlation between POLD1 and PD-L1 (R = 0.314, Figure 9E) and between POLD3 and PD-L1 (R = 0.788, Figure 9F).
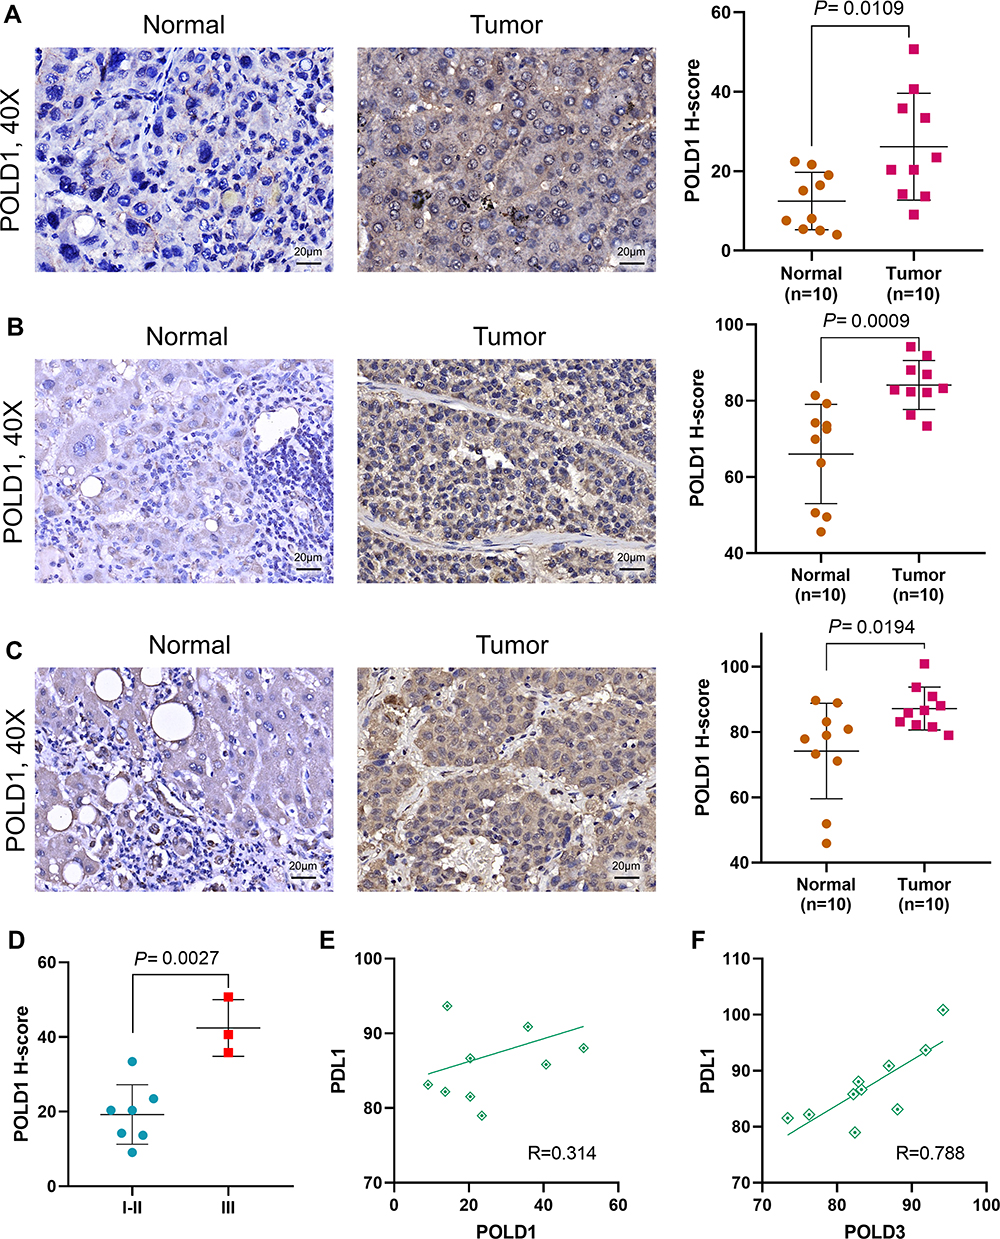 |
Figure 9 Validation of POLD1, POLD3 and PD-L1 levels in tissue microarray. (A) Protein level of POLD1 in HCC and normal liver tissues; (B) Protein level of POLD3 in HCC and normal liver tissues; (C) Protein level of PD-L1 in HCC and normal liver tissues; (D) Protein level of POLD1 in Stage I–II and Stage III HCC tissues; (E) Correlation between POLD1 and PD-L1 expression; (F) Correlation between POLD3 and PD-L1 expression. |
Discussion
DNA duplication is a pivotal process in cell proliferation that can transmit and pass genetically hereditary information. DNA damage response pathways are the safeguard of genetic replication in cells, while DNA polymerase δ works in both DNA replication and repair processes.36 Alterations in POLDs in humans are associated with several disorders. Ferrer-Avargues et al37 reported a novel Leu474Pro mutation in POLD1 associated with the increased occurrence of colorectal cancer among Spain families. Elouej et al38 reported mandibular hypoplasia, deafness, progeroid features, and lipodystrophy syndrome caused by Ile1070Asn in the ZnF2 (Zinc Finger 2) domain of the POLD1 protein. Zhou et al39 found that Pold3 plays important roles in DNA double strand break repair, telomere maintenance and genomic stability of both embryonic stem cells and spermatocytes in mice. Hung et al40 revealed that the decrease in POLD4 leads to blockade of the cell cycle at G1-S by suppression of the AKt-Skp2-p27 pathway. Therefore, POLDs play an important role in cell progression and tumorigenesis.
The association between HCC risk and DNA replication and repair has been widely reported. Shen et al41 reported that facilitating chromatin transcription complex (FACT), a DNA repair-related and transcription-related histone chaperone, could promote the progression of HCC through the NRF2-driven oxidative stress response. Ji et al42 exposed the deficiency of histone deacetylase 3 (HDAC3) promote HCC via the defect of H3K9ac/H3K9me3 transition, HDAC3 is the essential components for DNA damage control. To maintain the stability of genetic information, the stability of the replication fork is very important in the process of DNA replication, which can strongly inhibit the development of cancer. Ge et al43 found that ubiquitin conjugate BIR repeat containing ubiquitin-conjugating enzyme (BRUCE) downregulation in HCC promotes the activation of ATR and the phosphorylation of its downstream targets CHK1 and RPA, subsequently leading to the inhibition of tumorigenesis in HCC.
In the current study, we examined the predictive value and potential mechanism of POLDs in HCC. POLD1-4, one catalytic subunit and accessory subunit, are all highly expressed in HCC tumor tissues compared to adjunct normal tissues. For POLD1-3, the increased mRNA level was also positively associated with the advancement of tumors, as well as OS prognosis. Methylation in the promoter of POLDs is also different in tumors and normal tissues, which affects mRNA expression and OS, especially for some specific CpG sites. Because POLDs play a pivotal role in DNA replication and repair, we generated results that could preferably predict the prognosis for patients who suffer from a high gene mutation burden. Then, we evaluated the combined prognostic predictive value of four POLD subunits in both the TCGA-LIHC and GSE10186 databases and recognized the statistically significant HR of the high-risk group, along with the reliable predictive value. We also confirmed the increased protein levels of POLD1 and POLD3 in HCC tissues compared with adjacent normal tissues with a tissue microarray, validated the positive correlations among PD-L1 and POLDs, and provided insight into POLDs and immunotherapy. By exploring the potential mechanism impacted by POLDs in HCC patients, we obtained coexpressed gene sets and annotated the related pathways. As expected, POLDs coexpressed was mostly enriched in DNA repair and cell cycle regulation pathways.
In summary, POLDs are essential predictive factors for the prognosis of HCC. The united signature could precisely identify unfavorable prognoses.
Data Sharing Statement
The data used to support the findings of this study are included within the article. The gene expression data can be accessed on The Cancer Genome Atlas (TCGA) and Gene Expression Omnibus (GEO).
Ethics Approval and Consent to Participate
The need for further ethics approval was waived by The First Affiliated Hospital of Shantou University Medical College Ethics Committee.
Author Contributions
All authors made a significant contribution to the work reported, whether that is in the conception, study design, execution, acquisition of data, analysis and interpretation, or in all these areas; took part in drafting, revising or critically reviewing the article; gave final approval of the version to be published; have agreed on the journal to which the article has been submitted; and agree to be accountable for all aspects of the work.
Disclosure
The authors report no conflicts of interest in this work.
References
1. Ferlay J, Soerjomataram I, Dikshit R, et al. Cancer incidence and mortality worldwide: sources, methods and major patterns in GLOBOCAN 2012. Int J Cancer. 2015;136(5):E359–E86. doi:10.1002/ijc.29210
2. Siegel RL, Miller KD, Jemal A. Cancer statistics, 2019. CA Cancer J Clin. 2019;69(1):7–34. doi:10.3322/caac.21551
3. El-Serag HB. Epidemiology of viral hepatitis and hepatocellular carcinoma. Gastroenterology. 2012;142(6):1264–1273 e1. doi:10.1053/j.gastro.2011.12.061
4. Liao B, Zhang F, Lin S, et al. Epidemiological, clinical and histological characteristics of HBV/HDV co-infection: a retrospective cross-sectional study in Guangdong, China. PLoS One. 2014;9(12):e115888. doi:10.1371/journal.pone.0115888
5. Goyal A, Murray JM. Recognizing the impact of endemic hepatitis D virus on hepatitis B virus eradication. Theor Popul Biol. 2016;112:60–69. doi:10.1016/j.tpb.2016.08.004
6. Bray F, Ferlay J, Soerjomataram I, Siegel RL, Torre LA, Jemal A. Global cancer statistics 2018: GLOBOCAN estimates of incidence and mortality worldwide for 36 cancers in 185 countries. CA Cancer J Clin. 2018;68(6):394–424. doi:10.3322/caac.21492
7. Zhang W, Jiang R, Hou J, Sun B. Clinicopathological features and prognostic factors of young patients with surgically treated liver cancer. Medicine (Baltimore). 2015;94(12):e684. doi:10.1097/MD.0000000000000684
8. Gamil M, Alboraie M, El-Sayed M, et al. Novel scores combining AFP with non-invasive markers for prediction of liver fibrosis in chronic hepatitis C patients. J Med Virol. 2018;90(6):1080–1086. doi:10.1002/jmv.25026
9. Hallager S, Ladelund S, Kjaer M, et al. Hepatocellular carcinoma in patients with chronic hepatitis C and cirrhosis in Denmark: a nationwide cohort study. J Viral Hepat. 2018;25(1):47–55. doi:10.1111/jvh.12764
10. Mousa N, Gad Y, Abdel-Aziz A, Abd-Elaal I. Increased alpha-fetoprotein predicts steatosis among patients with chronic Hepatitis C Genotype 4. Int J Hepatol. 2012;2012:636392. doi:10.1155/2012/636392
11. Boffa DJ, Greene FL. Reacting to changes in staging designations in the 7th edition of the AJCC staging manual. Ann Surg Oncol. 2011;18(1):1–3. doi:10.1245/s10434-010-1427-z
12. Hwang S, Lee YJ, Kim KH, et al. The impact of tumor size on long-term survival outcomes after resection of solitary hepatocellular carcinoma: single-institution experience with 2558 patients. J Gastrointest Surg. 2015;19(7):1281–1290. doi:10.1007/s11605-015-2849-5
13. Loeb LA, Monnat RJ
14. Johnson RE, Klassen R, Prakash L, Prakash S, Major A. Role of DNA polymerase delta in replication of both the leading and lagging DNA strands. Mol Cell. 2015;59(2):163–175. doi:10.1016/j.molcel.2015.05.038
15. Pursell ZF, Isoz I, Lundstrom EB, Johansson E, Kunkel TA. Yeast DNA polymerase epsilon participates in leading-strand DNA replication. Science. 2007;317(5834):127–130. doi:10.1126/science.1144067
16. Costantino L, Sotiriou SK, Rantala JK, et al. Break-induced replication repair of damaged forks induces genomic duplications in human cells. Science. 2014;343(6166):88–91. doi:10.1126/science.1243211
17. Maloisel L, Fabre F, Gangloff S. DNA polymerase delta is preferentially recruited during homologous recombination to promote heteroduplex DNA extension. Mol Cell Biol. 2008;28(4):1373–1382. doi:10.1128/MCB.01651-07
18. Conde CD, Petronczki OY, Baris S, et al. Polymerase delta deficiency causes syndromic immunodeficiency with replicative stress. J Clin Invest. 2019;129(10):4194–4206. doi:10.1172/JCI128903
19. Wang F, Zhao Q, Wang YN, et al. Evaluation of POLE and POLD1 mutations as biomarkers for immunotherapy outcomes across multiple cancer types. JAMA Oncol. 2019;5:1504. doi:10.1001/jamaoncol.2019.2963
20. Elgaaen BV, Haug KB, Wang J, et al. POLD2 and KSP37 (FGFBP2) correlate strongly with histology, stage and outcome in ovarian carcinomas. PLoS One. 2010;5(11):e13837. doi:10.1371/journal.pone.0013837
21. Qin Q, Tan Q, Li J, et al. Elevated expression of POLD1 is associated with poor prognosis in breast cancer. Oncol Lett. 2018;16(5):5591–5598. doi:10.3892/ol.2018.9392
22. Chandrashekar DS, Bashel B, Balasubramanya SAH, et al. UALCAN: a portal for facilitating tumor subgroup gene expression and survival analyses. Neoplasia. 2017;19(8):649–658. doi:10.1016/j.neo.2017.05.002
23. Tang Z, Li C, Kang B, Gao G, Li C, Zhang Z. GEPIA: a web server for cancer and normal gene expression profiling and interactive analyses. Nucleic Acids Res. 2017;45(W1):W98–W102. doi:10.1093/nar/gkx247
24. Nagy A, Lanczky A, Menyhart O, Gyorffy B. Validation of miRNA prognostic power in hepatocellular carcinoma using expression data of independent datasets. Sci Rep. 2018;8(1):9227. doi:10.1038/s41598-018-27521-y
25. Gao J, Aksoy BA, Dogrusoz U, et al. Integrative analysis of complex cancer genomics and clinical profiles using the cBioPortal. Sci Signal. 2013;6(269):pl1. doi:10.1126/scisignal.2004088
26. Cerami E, Gao J, Dogrusoz U, et al. The cBio cancer genomics portal: an open platform for exploring multidimensional cancer genomics data. Cancer Discov. 2012;2(5):401–404. doi:10.1158/2159-8290.CD-12-0095
27. Huang WY, Hsu SD, Huang HY, et al. MethHC: a database of DNA methylation and gene expression in human cancer. Nucleic Acids Res. 2015;43(Databaseissue):D856–D861. doi:10.1093/nar/gku1151
28. Modhukur V, Iljasenko T, Metsalu T, Lokk K, Laisk-Podar T, Vilo J. MethSurv: a web tool to perform multivariable survival analysis using DNA methylation data. Epigenomics. 2018;10(3):277–288. doi:10.2217/epi-2017-0118
29. Aguirre-Gamboa R, Gomez-Rueda H, Martinez-Ledesma E, et al. SurvExpress: an online biomarker validation tool and database for cancer gene expression data using survival analysis. PLoS One. 2013;8(9):e74250. doi:10.1371/journal.pone.0074250
30. Zhou Y, Zhou B, Pache L, et al. Metascape provides a biologist-oriented resource for the analysis of systems-level datasets. Nat Commun. 2019;10(1):1523. doi:10.1038/s41467-019-09234-6
31. Meng J, Lu X, Zhou Y, et al. Tumor immune microenvironment-based classifications of bladder cancer for enhancing the response rate of immunotherapy. Mol Ther Oncolytics. 2021;20:410–421. doi:10.1016/j.omto.2021.02.001
32. Li T, Fan J, Wang B, et al. TIMER: a web server for comprehensive analysis of tumor-infiltrating immune cells. Cancer Res. 2017;77(21):e108–e110. doi:10.1158/0008-5472.CAN-17-0307
33. Li JH, Liu S, Zhou H, Qu LH, Yang JH. starBase v2.0: decoding miRNA-ceRNA, miRNA-ncRNA and protein-RNA interaction networks from large-scale CLIP-Seq data. Nucleic Acids Res. 2014;42(Database issue):D92–7. doi:10.1093/nar/gkt1248
34. Lu X, Meng J, Zhou Y, Jiang L, Yan F. MOVICS: an R package for multi-omics integration and visualization in cancer subtyping. Bioinformatics. 2020. doi:10.1093/bioinformatics/btaa1018
35. Liu CJ, Hu FF, Xia MX, Han L, Zhang Q, Guo AY. GSCALite: a web server for gene set cancer analysis. Bioinformatics. 2018;34(21):3771–3772. doi:10.1093/bioinformatics/bty411
36. Prindle MJ, Loeb LA. DNA polymerase delta in DNA replication and genome maintenance. Environ Mol Mutagen. 2012;53(9):666–682. doi:10.1002/em.21745
37. Ferrer-Avargues R, Diez-Obrero V, Martin-Tomas E, et al. Characterization of a novel POLD1 missense founder mutation in a Spanish population. J Gene Med. 2017;19(4):Apr. doi:10.1002/jgm.2951
38. Elouej S, Beleza-Meireles A, Caswell R, et al. Exome sequencing reveals a de novo POLD1 mutation causing phenotypic variability in mandibular hypoplasia, deafness, progeroid features, and lipodystrophy syndrome (MDPL). Metabolism. 2017;71:213–225. doi:10.1016/j.metabol.2017.03.011
39. Zhou Z, Wang L, Ge F, et al. Pold3 is required for genomic stability and telomere integrity in embryonic stem cells and meiosis. Nucleic Acids Res. 2018;46(7):3468–3486. doi:10.1093/nar/gky098
40. Huang Q, Suzuki M, Zeng Y, Zhang H, Yang D, Lin H. Downregulation of POLD4 in Calu6 cells results in G1-S blockage through suppression of the Akt-Skp2-p27 pathway. Bioorg Med Chem Lett. 2014;24(7):1780–1783. doi:10.1016/j.bmcl.2014.02.033
41. Shen J, Chen M, Lee D, et al. Histone chaperone FACT complex mediates oxidative stress response to promote liver cancer progression. Gut. 2019. doi:10.1136/gutjnl-2019-318668
42. Ji H, Zhou Y, Zhuang X, et al. HDAC3 deficiency promotes liver cancer through a defect in H3K9ac/H3K9me3 transition. Cancer Res. 2019;79(14):3676–3688. doi:10.1158/0008-5472.CAN-18-3767
43. Ge C, Vilfranc CL, Che L, et al. The BRUCE-ATR signaling axis is required for accurate DNA replication and suppression of liver cancer development. Hepatology. 2019;69(6):2608–2622. doi:10.1002/hep.30529
 © 2022 The Author(s). This work is published and licensed by Dove Medical Press Limited. The full terms of this license are available at https://www.dovepress.com/terms.php and incorporate the Creative Commons Attribution - Non Commercial (unported, v3.0) License.
By accessing the work you hereby accept the Terms. Non-commercial uses of the work are permitted without any further permission from Dove Medical Press Limited, provided the work is properly attributed. For permission for commercial use of this work, please see paragraphs 4.2 and 5 of our Terms.
© 2022 The Author(s). This work is published and licensed by Dove Medical Press Limited. The full terms of this license are available at https://www.dovepress.com/terms.php and incorporate the Creative Commons Attribution - Non Commercial (unported, v3.0) License.
By accessing the work you hereby accept the Terms. Non-commercial uses of the work are permitted without any further permission from Dove Medical Press Limited, provided the work is properly attributed. For permission for commercial use of this work, please see paragraphs 4.2 and 5 of our Terms.