")
Back to Journals » Medical Devices: Evidence and Research » Volume 13
The Machine Learned Stethoscope Provides Accurate Operator Independent Diagnosis of Chest Disease
Authors Kotb MA, Elmahdy HN , Seif El Dein HM, Mostafa FZ , Refaey MA, Rjoob KWY , Draz IH, Basanti CWS
Received 28 June 2019
Accepted for publication 3 December 2019
Published 23 January 2020 Volume 2020:13 Pages 13—22
DOI https://doi.org/10.2147/MDER.S221029
Checked for plagiarism Yes
Review by Single anonymous peer review
Peer reviewer comments 3
Editor who approved publication: Dr Scott Fraser
Magd Ahmed Kotb,1 Hesham Nabih Elmahdy,2 Hadeel Mohamed Seif El Dein,3 Fatma Zahraa Mostafa,1 Mohammed Ahmed Refaey,2 Khaled Waleed Younis Rjoob,2 Iman H Draz,1 Christine William Shaker Basanti1
1Department of Pediatrics, Faculty of Medicine, Cairo University, Cairo, Egypt; 2Information Technology Department, Vice-Dean of Faculty of Computers and Information, Cairo University, Giza, Egypt; 3Department of Diagnostic and Interventional Radiology, Faculty of Medicine, Cairo University, Cairo, Egypt
Correspondence: Magd Ahmed Kotb
Cairo University, 5, Street 63 El Mokatam, Cairo 11571, Egypt
Tel +20 2 2508 4994
Email [email protected]
Introduction: Contemporary stethoscope has limitations in diagnosis of chest conditions, necessitating further imaging modalities.
Methods: We created 2 diagnostic computer aided non-invasive machine-learning models to recognize chest sounds. Model A was interpreter independent based on hidden markov model and mel frequency cepstral coefficient (MFCC). Model B was based on MFCC, hidden markov model, and chest sound wave image interpreter dependent analysis (phonopulmonography (PPG)).
Results: We studied 464 records of actual chest sounds belonging to 116 children diagnosed by clinicians and confirmed by other imaging diagnostic modalities. Model A had 96.7% overall correct classification rate (CCR), 100% sensitivity and 100% specificity in discrimination between normal and abnormal sounds. CCR was 100% for normal vesicular sounds, crepitations 89.1%, wheezes 97.6%, and bronchial breathing 100%. Model B’s CCR was 100% for normal vesicular sounds, crepitations 97.3%, wheezes 97.6%, and bronchial breathing 100%. The overall CCR was 98.7%, sensitivity and specificity were 100%.
Conclusion: Both models demonstrated very high precision in the diagnosis of chest conditions and in differentiating normal from abnormal chest sounds irrespective of operator expertise. Incorporation of computer-aided models in stethoscopes promises prompt, precise, accurate, cost-effective, non-invasive, operator independent, objective diagnosis of chest conditions and reduces number of unnecessary imaging studies.
Keywords: machine learned stethoscope, operator independent diagnosis, chest, correct classification rate, CCR, normal vesicular sounds, crepitations, ACA, automatic chest auscultation, wheezes
Plain Language Summary
This study describes creation of accurate computer-aided sound analysis that can precisely diagnose and label type of chest sound (normal vesicular sounds, crepitations, wheezes, and bronchial breathing) and underlying disease (bronchopneumonia and pneumonia). It defines the best number of MFCC coefficients and best frame duration to achieve highest correct classification rate (CCR), sensitivity and specificity.
What’s Known on This Subject?
Computer respiratory sound analysis (CORSA) was developed to aid in chest disease diagnosis. The accuracy range is 67.6–92.6%. CORSA uses different methods to analyze chest sounds such as statistical, morphological complexity, energy and amplitude analysis.
What Does This Study Add?
We created and validated 2 models with 100% sensitivity and specificity for chest sound recognition and (96.7–98.7%) correct classification rate and defined their determinants. We studied chest wave image phonopulmonography (PPG) that proved unique for every sound type. Machine learning models in chest auscultation, when combined with machine learning heart sound models, promise an ease of medical education, implementation of telemedicine, screening of cohorts, diagnosis and medical practice in the near future.
Introduction
The prompt diagnosis of chest conditions is necessary to achieve the best outcome for the patient. State of the art bedside diagnosis depends upon contemporary stethoscopes. While chest ultrasonography promises non-invasive bedside diagnosis it is conditioned by the presence of an expensive ultrasonography machine in the bedside clinical setting.1 Most of the diagnostic modalities, such as chest X-ray and computed tomography (CT) remain the cornerstone in diagnosing some conditions,2,3 but are demanding with regards to cost, time, space, and expertise. Diagnosis thus far depends on sound recognition and radiographic imaging, while assessment of function depends on pulmonary function tests.4 Computer aided auscultation employing “computer respiratory sound analysis (CORSA)” or “computerized lung sound analysis (CLSA)” was developed to support clinical decision-making.5 To capitalize on sound recognition, researchers developed automatic chest sound recognition systems that allow diagnosis of chest sounds such as wheezes, bronchial breathing, and crepitation, that are caused by underlying pathology such as bronchitis, bronchial asthma, pneumonia, and bronchopneumonia, etc.6,7 Automatic chest auscultation (ACA) may be used to enhance medical students’ auscultation skills and help physicians in diagnosis. The contemporary stethoscope is unable to record, share chest sounds for follow up, and can miss some chest sounds that need amplification. Previous works in ACA used different methods to analyze chest sounds such as statistical, morphological complexity, energy and amplitude analysis. In automatic chest auscultation, different mel frequency cepstral coefficients (MFCC) as features, and different frame duration lengths were employed.8 Yet, there is a need to determine the best number of MFCC coefficients, best frame duration to achieve highest correct classification rate (CCR), sensitivity and specificity, as well as a need to assess the effect of combined chest wave image phonopulmonography (PPG) and machine learning model on CCR, sensitivity and specificity of chest sound recognition.
We aimed to develop an automatic chest sound recognition system that provides a prompt bedside diagnosis that overcomes operator interpretation, with high sensitivity and specificity. We aimed to provide a diagnostic model that is prompt with high sensitivity as to diagnose “normal chest sounds” with confidence and to recognize chest sounds (crepitations, wheezes, and bronchial breathing). We also aimed to determine the best frame duration length and the best number of MFCC coefficients to reach the highest sensitivity, specificity, and correct classification rate (CCR) for chest sound recognition. To overcome both overfitting and underfitting that can lead to poor model performance, we validated both learned models by testing on a validation dataset to know the final performance of both models on unseen data.9
Materials and Methods
We developed two classification models, model A used machine learning based on hidden markov model (HMM) as frequency features (MFCC). In model B we combined the first model with chest sound wave image (PPG) interpreter based analysis. After being created, both models were used to recognize a new dataset of chest sounds of another group of children that were not included during the machine learning. Diagnoses based upon recognition by model A and B were compared to the gold standard diagnostic tools: clinical examination, chest X-ray, and CT chest. We compared the CCR, sensitivity, and specificity of both models.
Subjects
We studied records of real 464 chest sounds that belonged to 116 children (of them 77 were males and 39 were females), whose diagnoses were confirmed by clinical examination, chest X-ray, and CT as judged by a clinician. The study commenced in May 2015 and ended by July 2016. The study was cross sectional, without risk, without invasive procedures, and the recording of sounds was done during the scheduled examination as a part of diagnostic work-up or follow up of the enrolled children. Participation was subject to verbal informed freely-given consent of caregivers of children with complete protection of the privacy and the confidentiality of their personal information,10 as approved by Cairo University Committee for Post-Graduate Studies and Research, Cairo University, Egypt which is committed to the Declaration of Helsinki and within provisions of its principles including 25 and 26.10 The chest sounds were collected from the 4 auscultation areas (apical right and left and basal right and left front) as shown in Figure 1.
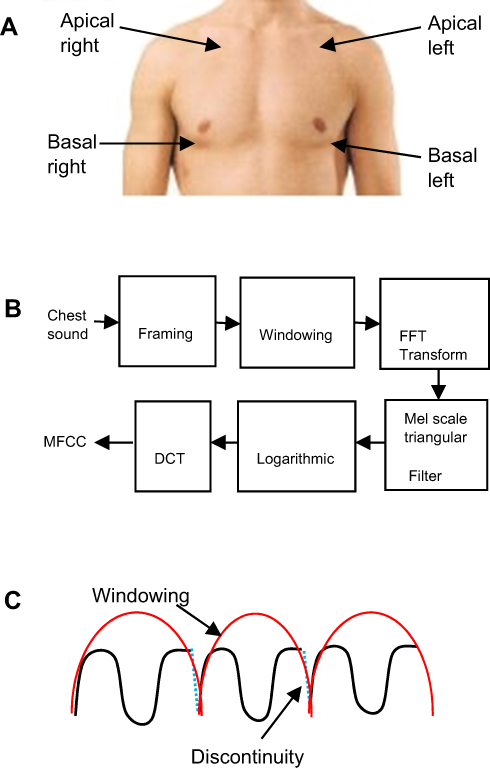 |
Figure 1 (A) Chest sound auscultation and recording areas. (B) MFCC feature extraction steps. (C) Computation windowing and frame continuing. |
Methods
Chest Model A
I- Data acquisition: to minimize effect of computer generated simulation we studied real chest sounds. Chest sounds were recorded at 16-bit accuracy and 44,100 Hz sampling frequency and stored as wav format using small microphone connected with stethoscope. We used Recor Pad sound recorder software to record chest sounds.
II - Chest sound normalization: after data acquisition, chest sounds were normalized using the following formula in Equation (1) to reduce noise effect, with each chest sound located within maximum and minimum amplitude (1 to −1).
(1)
where y[n] is the original chest signal.
III - MFCC feature to extract feature matrix for each type of chest sound. Block diagram in Figure 1 shows MFCCs computation according to the following steps:
- initialization of MFCC parameter analysis, frame duration 40 ms, analysis frame shift 10, pre-emphasis coefficient α=0.97.
- Pre-emphasis filtering using Equation (2).
(2)
- Windowing using Hamming window w(n) in Equation (3)
(3)
- Keeping the continuity of the first point and the last point in each frame as shown in Figure 1C using Equation (4).
(4)
- FFT transform.
- Warping to mel scale using Equation (5) and applying triangular filter-bank on mel-scale to get filter-bank energy.
(5)
- Applying log on filter bank energy.
- Taking DCT of logarithmic spectrum to get MFCC.
IV- To determine the best frame duration length and number of MFCC coefficients in MFCC feature extraction we used two different scenarios:
- First scenario: we extracted MFCC using different number of MFCC coefficients (13 MFCCs to 19 MFCCs) to determine best number of MFCC coefficients.
- Second scenario: we extracted MFCC using different frame duration lengths (30ms to 60ms) to determine the best frame duration length.
V- Classification of chest sounds was according to “left to right” discrete hidden markov model (HMM) using four parameters:
- T: the number of distinct observations: we have four distinct observations (crepitations, wheezes, bronchial breathing, and normal sounds) combined with two different states (normal and abnormal states).
- π: initial state probability.
- A: transition probability matrix.
- B: observation probability matrix.
VI- HMM was built as follows:
- HMM was trained using MFCC feature matrix (in each scenario HMM was trained using a different number of MFCC coefficients and different frame duration lengths).
- Baum-Welch EM algorithm was used in HMM to produce new parameter estimates using forward-backward algorithm that have equal or greater likelihood of training data.
- Forward algorithm was used to calculate the log-likelihood.
- Maximum log-likelihood was used.
- We classified detected signals by machine learning into nominal characters denoting specific chest defects.
Validation was done in 2 tiers:
- recognition of the initial training sound records;
- recognition of new blinded chest sounds diagnosed via clinicians and confirmed by chest X-ray and CT according to clinical judgment. The validation was compared to diagnosis according to clinicians’ decision, standard X-ray, and CT. Recognition of new blinded chest sounds was applied using two previous scenarios. Each scenario was evaluated according to CCR, sensitivity, and specificity.
For the two models’ (A and B) validation we used the two scenarios, the first scenario using different number of MFCC coefficients and the second scenario using different frame duration lengths.
Experiment 1 included 13, 14, 15, 16, 17, 18 and 19 MFCCs and frame duration of 30 ms, 35 ms, 40 ms, 45 ms, 50 ms, 55 ms and 60 ms.
Experiment 2 included experiment 1 and wave shape (PPG).
Statistical Analysis
Sensitivity, specificity, and CCR were used in the first and second model validation and were computed according to Equation (6, 7 and 8) respectively:
(6) (7) (8)


- True Positive (TP): sick people correctly identified as sick.
- False Positive (FN): healthy people incorrectly identified as sick.
- True Negative (TN): healthy people correctly identified as healthy.
- False Negative (FN): sick people incorrectly identified as healthy.
- Correctly Recognized (CR): correctly classified to specific class.
- Incorrectly Recognized (IR): incorrectly classified to specific class.
Chest Model B
We used the same steps as the first model combined with chest sound wave image as shown in block diagram in Figure 1. We plotted the wave for each chest sound type and underlying pathology (pneumonia and bronchopneumonia) as shown in Tables 1 and 2. According to Figure 1 each chest sound has a distinct wave shape. To determine the type of chest sound the wave shape was analyzed by an independent trained author (operator dependent), in an attempt to enhance the first model’s CCR, sensitivity, and specificity.
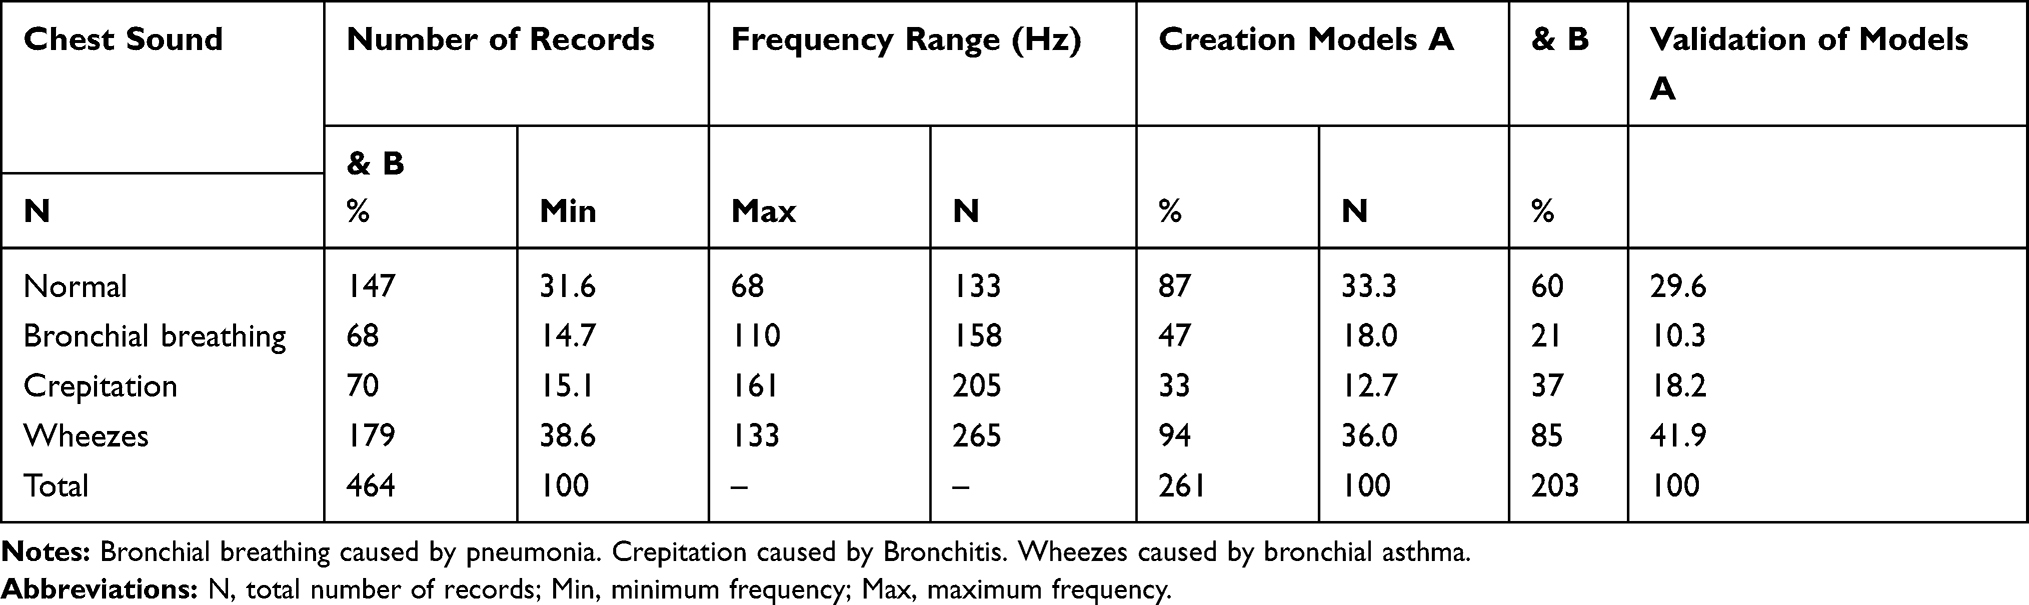 |
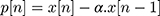
Table 1 Frequency Range and Different Diagnoses of Studied Records |
 |
Table 2 Chest Model CCR, Sensitivity, and Specificity Using Different Number of MFCC Coefficients and Different Frame Durations & Chest Models A and B Confusion Matrix, CCR, Sensitivity, and Specificity Using 13 MFCCs and Frame Duration 40 ms |
Results
The study was conducted on 464 records of real chest sounds belonging to 116 children who were diagnosed by clinicians, as confirmed by chest X-ray, CT, and other diagnostic modalities according to clinical decision. The mean age and standard deviation (SD) of children was 36.9 months ± 39.8 (ranged from 1 month to 144 months). The studied group comprised 77 (66.4%) males and 39 (33.6%) females. Table 1 shows the age and gender of children in creation and groups (minimum child age 1 month and maximum age 144 months). Table 2 and Figure 2 show the frequency range, the different diagnoses of studied records and the number of records in creation and validation according to clinicians, X-ray, and CT.
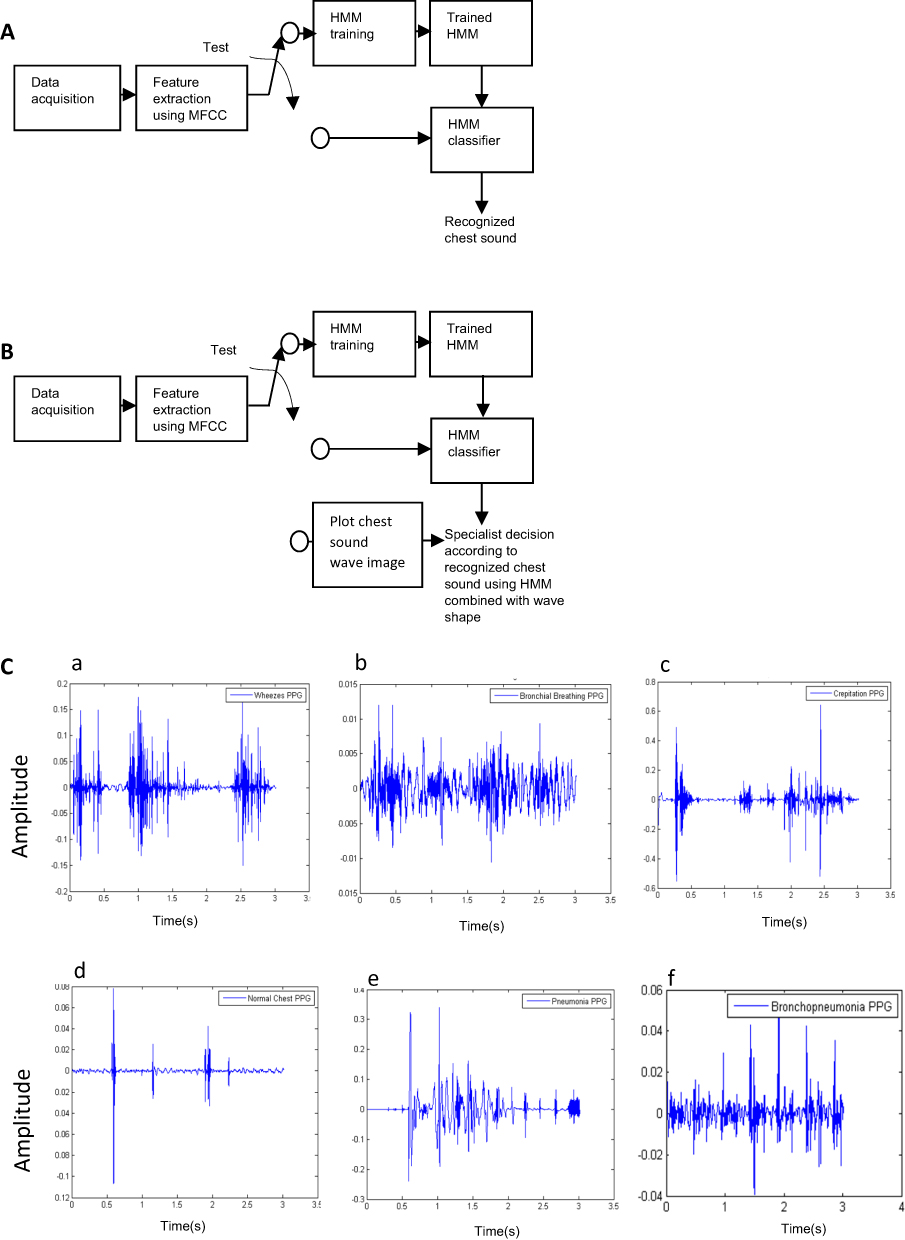 |
Figure 2 Building of chest sound recognition models A & B and recognition of chest sounds wave shape. Notes: (A) Model A building. (B) Model B building. (C) Wave shape of (a) wave of wheezes sound, (b) wave of bronchial breathing sound, (c) wave of crepitation sound, (d) wave of normal chest sound, (e) wave of underlying pathology pneumonia sound, (f) wave of underlying pathology bronchopneumonia sound.Abbreviations: PPG, phonopulmonography; s, second. |
Wheezes had the highest frequency 265 Hz and we found small frequency overlap between normal sound (68 Hz–133 Hz) and bronchial breathing (110 Hz–158 Hz) as shown in Table 2.
Chest Model Creation
In chest model training we built the model using 261 chest sounds, of them 87 (33.3%) were normal chest sounds and 174 (66.7%) were abnormal chest sounds. Abnormal chest sounds studied included wheezes, crepitations, and bronchial breathing caused by underlying pathology such as bronchitis, bronchial asthma, pneumonia, and bronchopneumonia as shown in Table 2. The training time was found to be 40 seconds, initial testing sound was 3 seconds and any consequent sound test time was 1 second.
Chest Model Validation
After the learned machine model was created, the model was validated to assess its performance and overcome overfitting. We recorded another 203 different real chest sounds (blinded chest sounds) covering 60 normal chest, 143 abnormal chest sounds (21 bronchial breathing, 37 crepitations, 85 wheezes) to test chest sound recognition using models A and B. Table 3 and Figure 2 show chest model CCR, sensitivity, and specificity based on machine learning and MFCCs with a different number of MFCC coefficients according to clinicians decision, chest X-ray, and CT.
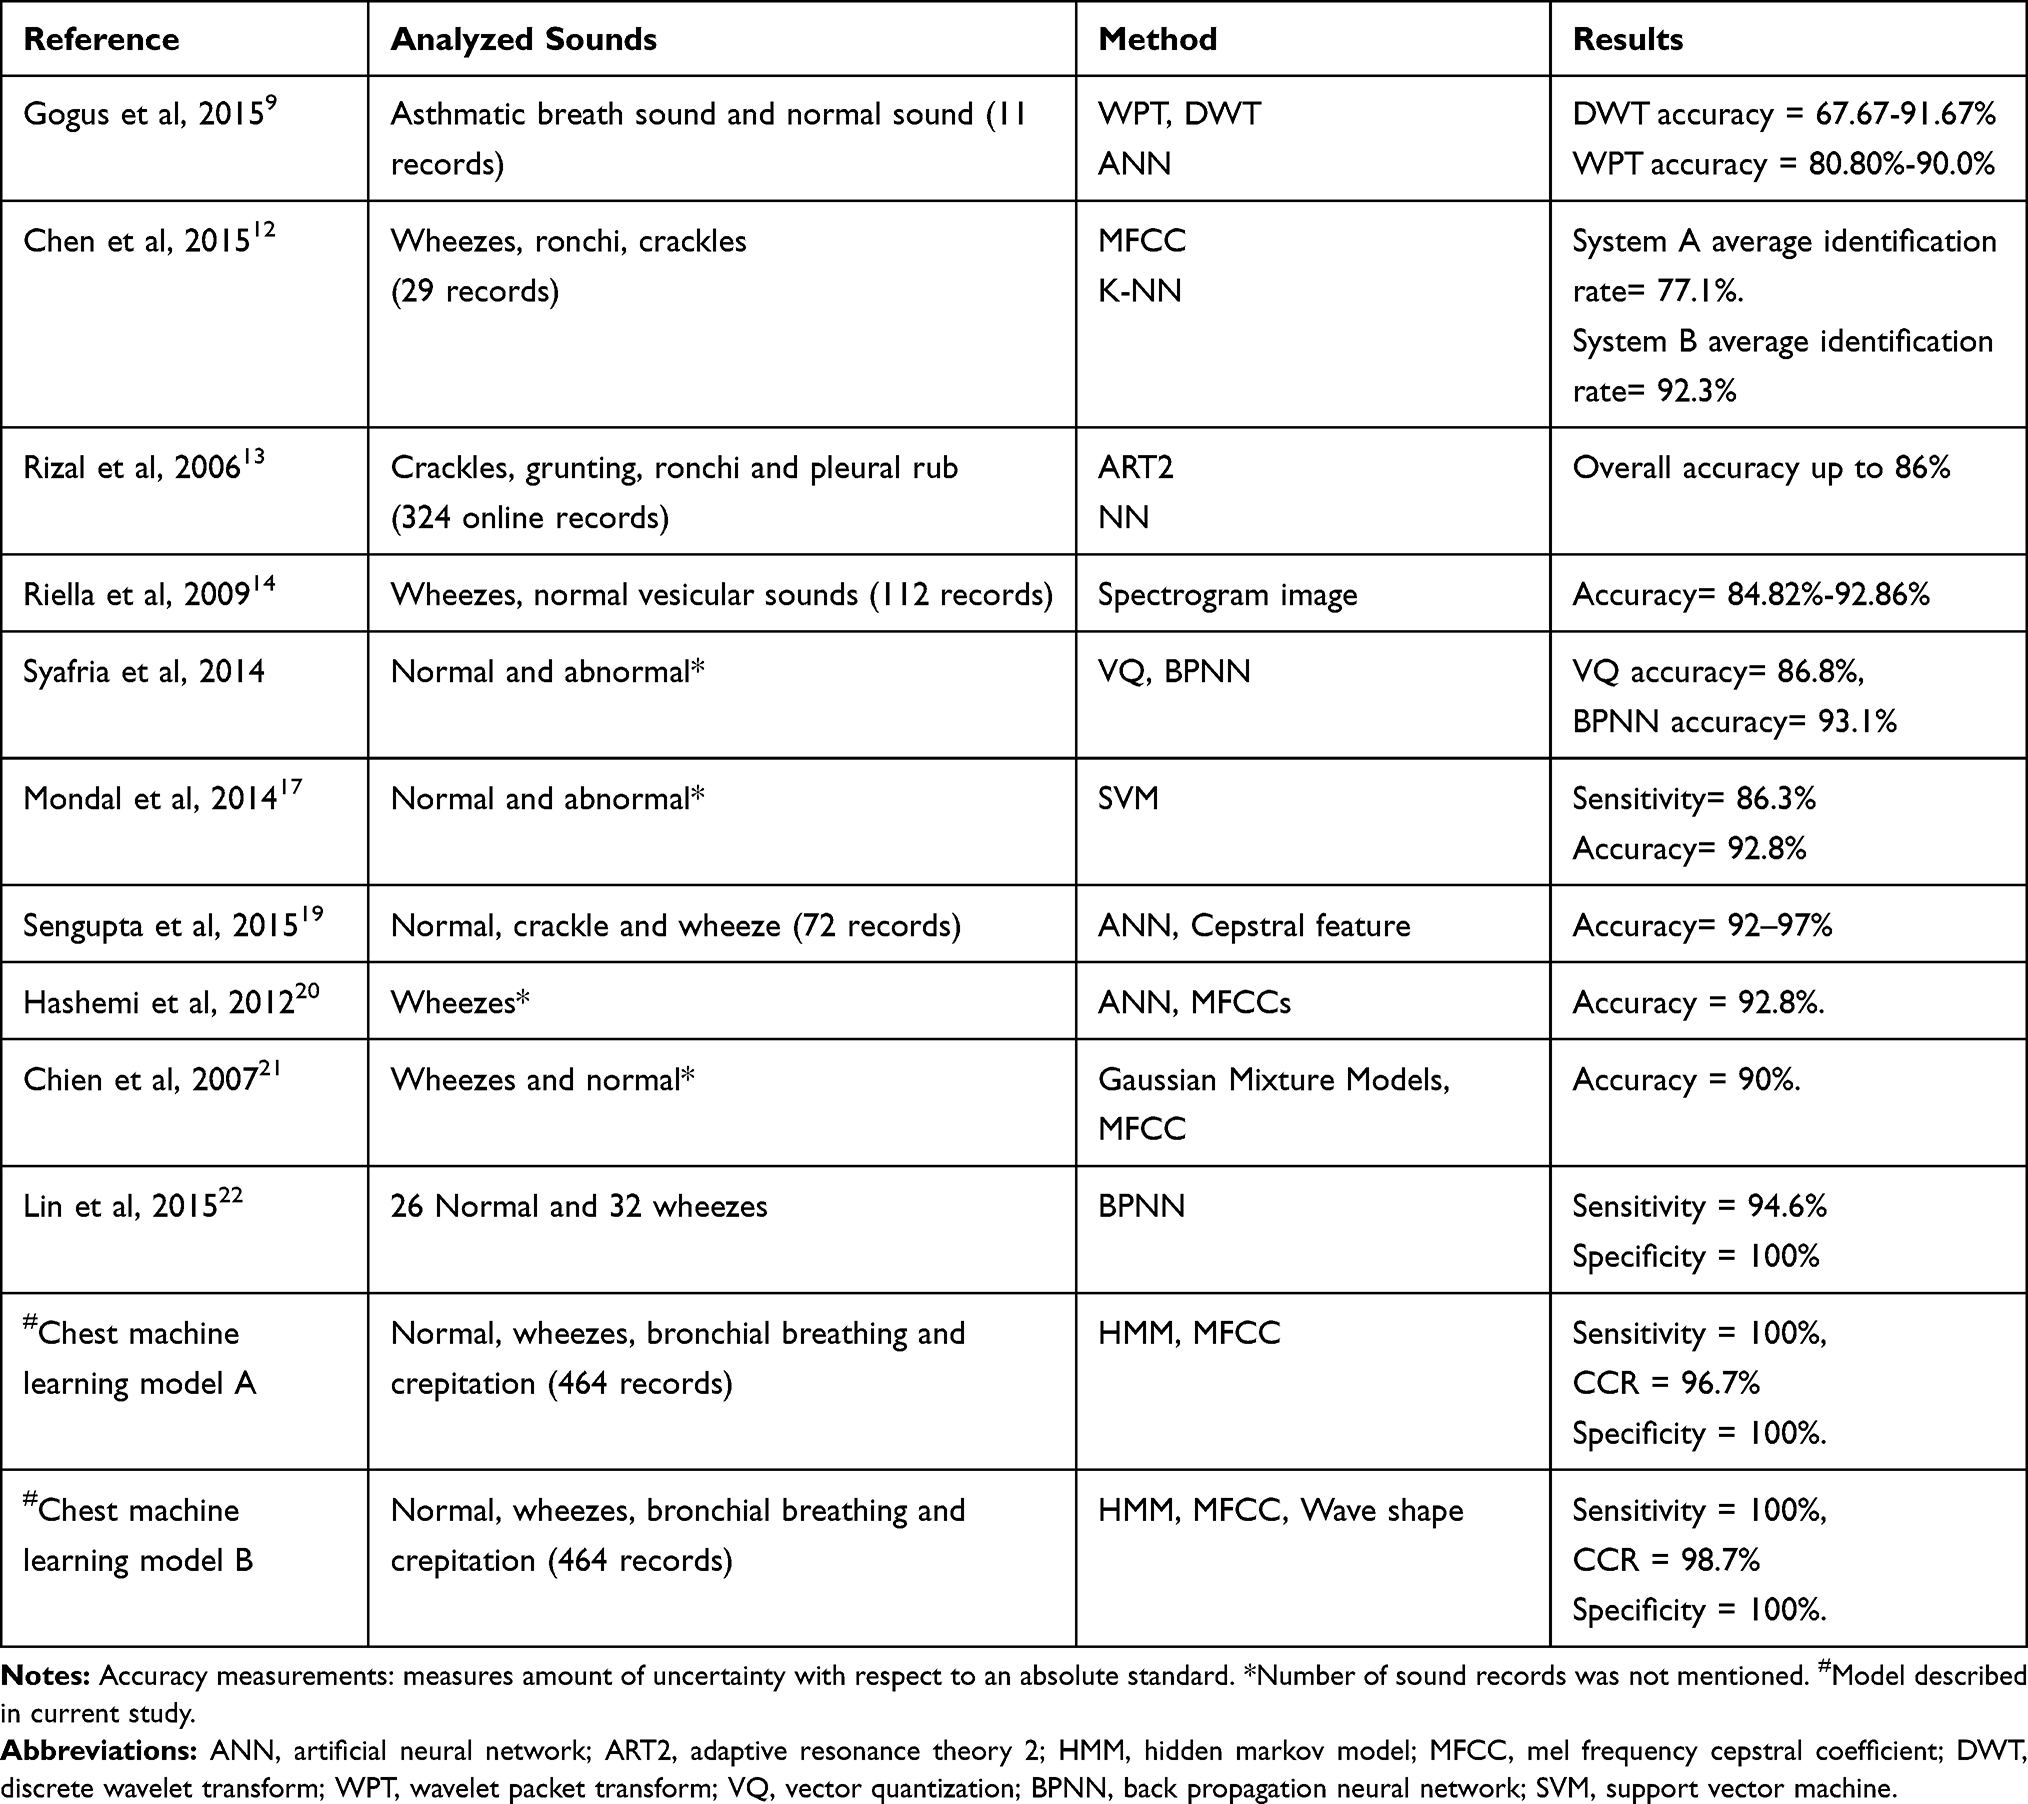 |
Table 3 Comparison of Chest Sound Recognition Ability of Previous ACA Models and Current Models A & B |
Experimental Results
Model A
Model A's overall CCR range was 93.8%-96.7%, sensitivity range was 99.6%-100%, and specificity range was 96.6%-100%. The chest model based on 13 MFCCs and a frame duration of 40 ms had the highest CCR (96.7), sensitivity (100%), and specificity (100%) (Table 2 and Figure 2). Table 2 shows confusion matrix of first chest classification model based on 13 MFCCs and frame duration 40 ms. Model A demonstrated CCR range (89.1%-100%), sensitivity 100% and specificity 100% as shown in Table 2.
Model B
Model B overall CCR range was (97.3%-100%), sensitivity range was 100% and specificity was 100%. Table 2 shows the confusion matrix of the second chest sounds classification model based on 13 MFCCs, a frame duration of 40ms and a wave shape image (PPG).
Discussion
Discrete wavelet transform (DWT), wavelet packet transform (WPT), and artificial neural network (ANN) were used to classify breath sound, yet, the accuracy of automatic system range was 67.6–92.6%.11 Machine learning was always considered as the efficient replacement of human operator to overcome inter-operators, helping to overcome inter-operator differences and misinterpretations. Thus, ANN systems, K nearest neighbor (K-NN), Adaptive Resonance Theory 2 Neural Network (ART2NN) and spectrogram image analysis were developed. However, their accuracy was reported to be 77.1–92.3%, up to 86%, and 84.8–92.8% respectively.12–14 Visual determinant based analysis was made possible with the development of audio visual recognition of breath sounds based on two spectrograms using fast fourier transform (FFT).15 The visual determinant based analysis provides a diagnostic modality for specific chest conditions (wheezes and crepitations) but its accuracy did not exceed 85%.14 Vector quantization (VQ) and back propagation neural network (BPNN) were used as classifiers in chest sounds recognition and mel frequency cepstral coefficient (MFCC) was used as feature, BPNN accuracy was 93.1% and VQ accuracy was 86.8%. Morphological complexities of respiratory sound and support vector machine (SVM) were also used to classify chest sounds, but the reported sensitivity was 86.3% and accuracy was 92.8%.16
We created ACA models that analyzed sound waves according to MFCC. The models were based on machine learning. Each chest sound type was found to have a distinct PPG. Radiologic imaging has limited ability in diagnosing wheezes, therefore physicians are the cornerstone for the diagnosis of conditions such as bronchial asthma as opposed to radiologic imaging. ACA model A based on HMM achieved an overall CCR of 96.7%, sensitivity of 100%, and 100% specificity using 13 MFCCs and a frame duration of 40 ms. ACA model B based on wave shape achieved overall CCR of 98.7%, sensitivity of 100%, and 100% specificity).
We detected very clear overlap between the frequency of normal vesicular sounds and some abnormal sounds such as bronchial breathing as shown in Table 2, nevertheless when we employed the analysis of MFCC (depending on filter-bank energy), model A was able to discriminate the overlapping frequencies. Also in model B MFCC and chest sound wave shape as features were sensitive enough to detect all “abnormal” cases and annulled false negative diagnosis, thus none of the examined children will be dismissed as normal, while being sick.
The A and B ACA models had a higher sensitivity and CCR in recognizing sounds over analysis based upon MFCC. PPG (wave shape image) analysis of chest sounds was achieved by model B. Model B ACA machine learning model based on HMM recognition and wave shape, had greater CCR than that detected by the first ACA model and others, such as Riella et al (2009) where the model they created had CCR and accuracy of 85%.14 We compared some previously reported studies and types of chest sounds recognized in Table 3.
The ACA model B based on HMM overcomes CT and X-ray inability to aid in the diagnosis of wheezes. ACA models A and B, based on HMM comprise the largest reported databank size of real chest sounds (464 chest sounds); of which 203 chest sounds were for validation (testing) and 261 chest sounds were for creation (training). We did not study simulated chest sounds, although some previous reports used simulated sounds,17 to allow projection of results and validation of real sounds. In the two ACA models, we created a large databank, thus our results are reliable and reproducible. The accuracy of ACA model A promises future implications in chest sound recognition, namely using simpler devices compared to the more complex operator dependent CT machines, and promises a new role in clinical education and diagnosis. The ACA model B based on HMM might prove valuable in the diagnosis of specific conditions such as pneumonia, bronchitis, hydrothorax etc.
To reliably diagnose “normal” and “abnormal” we need to examine all chest areas. A single area auscultation by chest auscultation model yields less CCR for diagnosis of any underlying pathologic chest condition compared to at least 12 areas of lung auscultation, yet a four area auscultation overall CCR for any chest sound was 96.7% with the first ACA model and 98.7% with the second model as shown in Figure 3. Both models enhance the diagnostic abilities of the interpreter who listens and visualizes the respective phonogram, promising easier and more objective acquisition of breath sound teaching skills.17,20–22 Machine learning models in chest auscultation, when combined with machine learning heart sound models,21–24 promise an ease of medical education, implementation of telemedicine, screening of cohorts, diagnosis and medical practice in the near future.
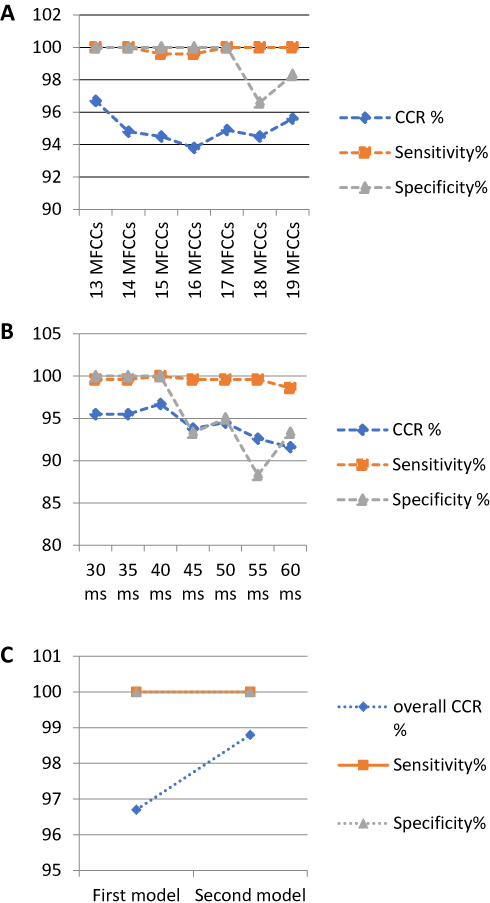 |
Figure 3 Sensitivity and specificity of models A and B. Notes: (A) Automatic chest auscultation model CCR, sensitivity and specificity using different number of MFCC elements combined with frame duration length 40 ms, and (B) according to different frame duration length combined with 13 MFCCs coefficients. (C) Comparison between first and second model according CCR, sensitivity, and specificity.Abbreviation: ms, millisecond. |
Conclusion
The ACA models built based on HMM algorithm, MFCC feature and extra element PPG demonstrated high sensitivity, specificity, and CCR. The model based on frequency, energy and computational analysis had 100% sensitivity, 100% specificity, and 96.7% overall CCR. Adding operator dependent PPG analysis to the ACA model demonstrated higher sensitivity, specificity, and overall CCR (100%, 100%, and 98.7% respectively) for recognizing “normal” and “abnormal” chest sounds (bronchial breathing, wheezes, and crepitation). The chest model A may be used in diagnosis while model B may be used in both diagnosis and learning as it allows demonstration of chest sound wave shape (PPG) beside recorded signal, which will provide the medical student with an extra element (wave shape on screen) beside auscultation technique to enhance auscultation skills. The ACA models are foreseen to prove valuable for screening and as reliable prompt bedside physician aid.
Abbreviations
ACA, automatic chest auscultation; ANN, artificial neural network; BPNN, back propagation neural network; CCR, correct classification rate; CLSA, computerized lung sound analysis; CORSA, computer respiratory sound analysis; CT, computed tomography; DWT, discrete wavelet transform; FFT, fast fourier transform; K-NN, K nearest neighbor; MFCC, mel frequency cepstral coefficient; PPG, phonopulmonography; SVM, support vector machine; VQ, vector quantization; WPT, wavelet packet transform.
Compliance with Ethical Statements
This article does not contain any studies with human participants or animals performed by any of the authors. It included chest sounds that were collected from children whose parents approved verbally. The trial was approved by Pediatric Department Committee for Post-Graduate Studies and Research, and Faculty of Medicine Administration for Post-Graduate Studies and Research, Cairo University, Egypt.
Disclosure
MA Kotb, HN Elmahdy and KWY Rjoob filed patent application (patent 1052/2015) related to some aspects of the study. The authors report no other conflicts of interest in this work.
References
1. Kristensen MS, Teoh WH, Graumann O, et al. Ultrasonography for clinical decision-making and intervention in airway management: from the mouth to the lungs and pleurae. Insights Imaging. 2014;5:253–279. doi:10.1007/s13244-014-0309-5
2. Harvey HB, Gilman MD, Wu CC, et al. Diagnostic yield of recommendations for chest CT examination prompted by outpatient chest radiographic findings. Radiology. 2015;275:262–271. doi:10.1148/radiol.14140583
3. Li X, Samei E, Segars WP, et al. Patient-specific radiation dose and cancer risk for pediatric chest CT. Radiology. 2011;259:862–874. doi:10.1148/radiol.11101900
4. Ranu H, Wilde M, Madden B. Pulmonary function tests. Ulster Med J. 2011;80:84–90.
5. Gurung A, Scrafford CG, Tielsch JM, Levine OS, Checkley W. Computerized lung sound analysis as diagnostic aid for the detection of abnormal lung sounds: a systematic review and meta-analysis. Respir Med. 2011;105:1396–1403. doi:10.1016/j.rmed.2011.05.007
6. Sarkar M, Madabhavi I, Niranjan N, Dogra M. Auscultation of the respiratory system. Ann Thorac Med. 2015;10:158–168. doi:10.4103/1817-1737.160831
7. Jakhar SK, Pandey M, Shah D, et al. Etiology and risk factors determining poor outcome of severe pneumonia in under-five children. Indian J Pediatr. 2018;85:20–24. doi:10.1007/s12098-017-2514-y
8. Chang GC, Lai YF. Performance evaluation and enhancement of lung sound recognition system in two real noisy environments. Comput Methods Programs Biomed. 2010;97:141–150. doi:10.1016/j.cmpb.2009.06.002
9. Göğüş FZ, Bekir Karlık B, Harman G. Classification of asthmatic breath sounds by using wavelet transforms and neural networks. Int J Signal Process Syst. 2015;3:106–111.
10. WMA Declaration of Helsinki – ethical principles for medical research involving human subjects.
11. Chicco D. Ten quick tips for machine learning in computational biology. BioData Min. 2017;10:35. doi:10.1186/s13040-017-0155-3
12. Chen CH, Huang WT, Tan TH, Chang CC, Chang YJ. Using K-nearest neighbor classification to diagnose abnormal lung sounds. Sensors. 2015;15:13132–13158. doi:10.3390/s150613132
13. Rizal A, Mengko TLR, Suksmono AB. Lung sound recognition using wavelet packet decomposition and ART2 (adaptive resonance theory 2) neural network. Biomedical Engineering Day 2006; 2006: 168–172. Available from: http://achmadrizal.staff.telkomuniversity.ac.id/wpcontent/uploads/sites/11/2013/12/PR04-BMEDAY06.pdf.
14. Riella RJ, Nohama P, Maia JM. Method for automatic detection of wheezing in lung sounds. Braz J Med Biol Res. 2009;42:674–684. doi:10.1590/S0100-879X2009000700013
15. Nogata F, Yokota Y, Kawamura Y, Morita H, Uno Y. Audio-visual recognition of auscultatory breathing sounds using fourier and wavelet analyses. Asian J Comput Inf Sys. 2015;3:96–105.
16. Mondal A, Bhattacharya B, Saha G. Detection of lungs status using morphological complexities of respiratory sounds. Sci World J. 2014;2014:1–9. ID 182938. doi:10.1155/2014/182938.
17. Kiyokawa H, Greenberg M, Shirota K, Pasterkamp H. Auditory detection of simulated crackles in breath sounds. Chest. 2001;119(6):1886–1892. doi:10.1378/chest.119.6.1886
18. Sengupta N, Sahidullah M, Saha G. Optimization of cepstral features for robust lung sound classification. Proceedings of the 2015 Annual IEEE India Conference (INDICON), New Dehli, India, 17-20 December 2015. Piscataway, NJ: IEEE; 2016. doi: 10.1109/INDICON.2015.7443768
19. Hashemi A, Arabalibeik H, Agin K. Classification of wheeze sounds using cepstral analysis and neural networks. Stud Health Technol Inform. 2012;173:161–165.
20. Chien JC, Wu HD, Chong FC, et al. Wheeze detection using cepstral analysis in Gaussian mixture models. Conf Proc IEEE Eng Med Biol Soc. 2007;3168–3171.
21. Lin BS, Wu HD, Chen SJ. Automatic wheezing detection based on signal processing of spectrogram and back-propagation neural network. J Healthc Eng. 2015;6:649–672. doi:10.1260/2040-2295.6.4.649
22. Ramsay CF. An evaluative study of breath sounds. Thorax. 2011;66:A144. doi:10.1136/thoraxjnl-2011-201054c.185
23. Kotb MA, Elmahdy HN, Mostafa F, et al. Improving the recognition of heart murmur. Int J Adv Comput Sci App. 2016;7(7). doi:10.14569/IJACSA.2016.070740
24. Kotb MA, Elmahdy HN, Mostafa F, Shaker CW, Refaey MA, Rjoob KWY. Recognition of heart murmur based on machine learning and visual based analysis of phonocardiography: proceedings of the 2018 computing conference, recognition of heart murmur based on machine learning and visual based analysis of phonocardiography. In: Arai K, Kapoor S, Bhatia R, editors. Intelligent computing. SAI 2018. Advances in intelligent systems and computing. Vol. 857. Cham: Springer; 188–202.
 © 2020 The Author(s). This work is published and licensed by Dove Medical Press Limited. The full terms of this license are available at https://www.dovepress.com/terms.php and incorporate the Creative Commons Attribution - Non Commercial (unported, v3.0) License.
By accessing the work you hereby accept the Terms. Non-commercial uses of the work are permitted without any further permission from Dove Medical Press Limited, provided the work is properly attributed. For permission for commercial use of this work, please see paragraphs 4.2 and 5 of our Terms.
© 2020 The Author(s). This work is published and licensed by Dove Medical Press Limited. The full terms of this license are available at https://www.dovepress.com/terms.php and incorporate the Creative Commons Attribution - Non Commercial (unported, v3.0) License.
By accessing the work you hereby accept the Terms. Non-commercial uses of the work are permitted without any further permission from Dove Medical Press Limited, provided the work is properly attributed. For permission for commercial use of this work, please see paragraphs 4.2 and 5 of our Terms.