")
Back to Journals » OncoTargets and Therapy » Volume 12
The lncRNA ZEB2-AS1 is upregulated in gastric cancer and affects cell proliferation and invasion via miR-143-5p/HIF-1α axis
Authors Wu F, Gao H, Liu K, Gao B , Ren H, Li Z, Liu F
Received 28 May 2018
Accepted for publication 23 November 2018
Published 18 January 2019 Volume 2019:12 Pages 657—667
DOI https://doi.org/10.2147/OTT.S175521
Checked for plagiarism Yes
Review by Single anonymous peer review
Peer reviewer comments 2
Editor who approved publication: Dr William C. Cho
Fangxiong Wu,1 Hongyan Gao,1 Kaige Liu,1 Baohua Gao,1 Hezhuang Ren,1 Zheng Li,2 Fengrui Liu2
1Department of Gastroenterology, The First Affiliated Hospital of Xi’an Medical University, Xi’an City, Shaanxi Province, China; 2Department of Emergency, The First Affiliated Hospital of Xi’an Medical University, Xi’an City, Shaanxi Province, China
Background: Growing evidence has implicated the important role of the long non-coding RNAs (lncRNAs) in gastric cancer progression. In this study, we examined the expression of lncRNA zinc finger E-box-binding homeobox 2 antisense RNA 1 (ZEB2-AS1) in gastric cancer tissues and elucidated the molecular mechanisms underlying ZEB2-AS1-mediated gastric cancer progression.
Methods: Quantitative real-time PCR measured the gene expression level; CCK-8, colony formation and cell invasion assays determined gastric cancer cell proliferation, growth and invasion, respectively; the xenograft nude mice model was used to determine in vivo tumor growth; Bioinformatics analysis and luciferase reporter assay determined the downstream targets of ZEB2-AS1 and miR-143-5p. The expression of ZEB2-AS1 was upregulated in gastric cancer cell lines.
Results: Knockdown of ZEB2-AS1 suppressed gastric cancer cell proliferation, growth and invasion, and also suppressed in vivo tumor growth in the nude mice. Overexpression of ZEB2-AS1 potentiated gastric cancer cell proliferation, growth and invasion. Bioinformatics analysis and luciferase reporter assay showed that miR-143-5p was a direct target of ZEB2-AS1 and was negatively regulated by ZEB2-AS1. Furthermore, hypoxia-inducible factor-1α (HIF-1α) was found to be a target of miR-143-5p and was negatively regulated by miR-143-5p. The rescue in vitro assays showed that the effects of ZEB2-AS1 overexpression on gastric cancer cell proliferation, growth and invasion was mediated via miR-143-5p/HIF-1α. ZEB2-AS1 and HIF-1α was upregulated in gastric cancer tissues, while miR-143-5p was down-regulated; and ZEB2-AS1 expression level was inversely correlated with miR-143-5p expression level, and positively correlated with HIF-1α mRNA expression level; while miR-143-5p expression level was inversely correlated with HIF-1α expression level. High ZEB2-AS1 expression level was correlated with poor differentiation, lymph node metastasis and distant metastasis.
Conclusion: Collectively, our results indicated that ZEB2-AS1 was up-regulated in gastric cancer tissues and cells and promoted cell proliferation and metastasis through miR-143-5p/HIF-1α pathway, which may provide a promising target for treatment of gastric cancer.
Keywords: gastric cancer, ZEB2-AS1, miR-143-5p, HIF-1α, cell proliferation, metastasis
Introduction
Gastric cancer is one of the most common malignancies and is a threat for public health, especially in the developing countries. There are nearly a million new cases of gastric cancer reported each year, and developing countries account for two-thirds of all cases, with about 42% occurring in China.1,2 The occurrence and development of gastric cancer involve dysregulation of multiple genes. Although the medication for the treatment of gastric cancer has been constantly improving, such as the application of some new target chemotherapy drugs and the practice of tumor immunotherapy, the 5-year survival rate of patients has not significantly improved.3 Gastric cancer is highly heterogeneous, and the molecular signaling pathway is complex. Deregulation of oncogenes and tumor suppressor genes has been considered to be an indispensable factor leading to the development of gastric cancer.
With the progress of sequencing technology, it is currently believed that ~85% of the entire human genome can be transcribed; a large number of transcripts do not encode proteins and these RNA transcripts are called ncRNAs.4–6 The ncRNAs can be roughly divided into two groups based on the length. Generally, ncRNAs shorter than 200 nucleotides are called short ncRNAs, such as miRNA. The other type is called lncRNAs with >200 nucleotides.7 The lncRNAs are involved in a variety of biological processes, including proliferation, differentiation, autophagy, and apoptosis.8–10 In the field of cancer research, lncRNAs have been found to regulate the progression of various types of cancers such as glioma,11 breast cancer,12 colorectal cancer,13 liver cancer,14 and leukemia15 and are associated with recurrence and poor prognosis. A large number of dysregulated lncRNAs have been identified in gastric cancer till now.16 A study of whether these lncRNAs can be used as a diagnostic marker of gastric cancer, and how these lncRNAs participate in the initiation and progression of gastric cancer and how there lncRNAs regulate the proliferation, invasion, and metastasis of gastric epithelial cells has important clinical significance for understanding the initiation and progression of gastric cancer. Growing evidence has shown that lncRNAs can act as ceRNA to regulate the expression of miRNAs in gastric cancers. For example, Liu et al showed the lncRNA HOX antisense intergenic RNA (HOTAIR) functioned as a ceRNA to regulate gastric cancer progression via sponging miR-331-3p.17 The lncRNA metastasis-associated lung adenocarcinoma transcript one was found to regulate autophagy-associated chemoresistance via sponging miR-23b3p in gastric cancer.18 Recently, zinc finger E-box-binding homeobox two antisense RNA 1 (ZEB2-AS1) has been identified as a new lncRNA, and studies showed that ZEB2-AS1 promoted cancer progression including pancreatic cancer, bladder cancer, and hepatocellular carcinoma.19–21 To our best knowledge, the role of ZEB2-AS1 in gastric cancer progression has not been determined yet.
In this study, we performed both in vitro and in vivo functional assays to determine the effects of ZEB2-AS1 on gastric cancer progression and to explore the biological role of ZEB2-AS1 and the mechanisms underlying gastric cancer progression.
Materials and methods
Clinical samples
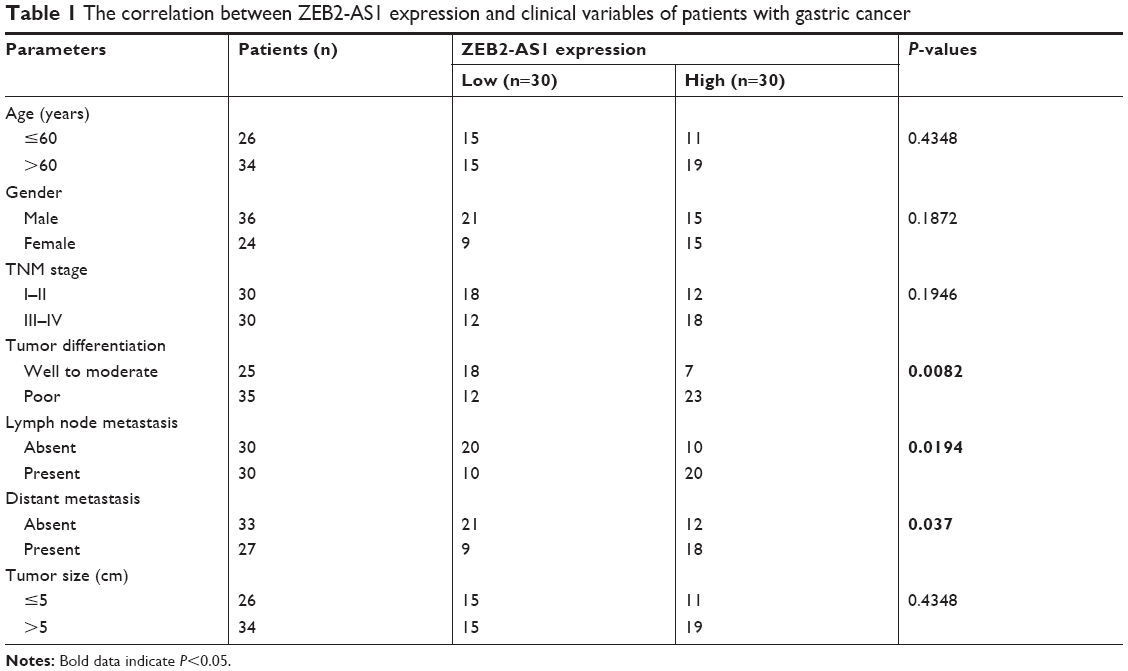
A total of 60 patients with primary gastric cancer undergoing surgical treatment at the First Affiliated Hospital of Xi’an Medical University were analyzed. The study was approved by the Research Ethics Committee of the First Affiliated Hospital of Xi’an Medical University, and written informed consent was signed and returned by each patient before surgery. The cancerous and adjacent normal gastric tissues were snap-frozen in liquid nitrogen once dissected from the patients and used for subsequent experiments. The clinicopathologic features of patients were also collected (see Table 1).
 | Table 1 The correlation between ZEB2-AS1 expression and clinical variables of patients with gastric cancer |
Cell culture and cell transfection
Three gastric cancer cell lines (MKN-28, BGC-823, and SGC-7901) and one normal gastric cell line (GES-1) were purchased from ATCC (Manassas, VA, USA). They were cultured in Roswell Park Memorial Institute-1640 medium (Thermo Fisher Scientific, Waltham, MA, USA) supplemented with 10% FBS (Thermo Fisher Scientific) in a humidified cell incubator with an atmosphere of 5% CO2 at 37°C. ZEB2-AS1-overexpressing vector (pcDNA3.1-ZEB2-AS1), ZEB2-AS1 siRNA (si-ZEB2-AS1(a) and si-ZEB2-AS1(b)), sh_ZEB2-AS1 vector, miR-143-5p mimics, and respective control were synthesized by GenePharma and transfected using Lipofectamine 2000 (Thermo Fisher Scientific) according to manufacturer’s instructions.
Quantitative reverse transcriptase PCR (qRT-PCR)
Total RNA was extracted from tissues or cells using RNAiso Plus (TaKaRa, Dalian, China). A total of 1 μg RNA was reverse transcribed to cDNA by PrimeScript First Strand cDNA Synthesis Kit (TaKaRa). Real-time PCR was performed using SYBR® Premix Ex Taq (TaKaRa) on the ABI 7900 system. GAPDH was used as the internal control for ZEB2-AS1, and hypoxia-inducible factor-1α (HIF-1α) expression and U6 were used as the internal controls for miR-143-5. The expression levels of the genes in the clinical samples were calculated by using the comparative Ct method, and the expression levels of the genes in cells and animal tumor tissues were calculated by using the 2−ΔΔCt method. The primers are shown in Table S1.
Cell counting kit-8 (CCK-8) assay
SGC-7901 or MKN-28 cells were seeded in a 96-well plate at a density of 2×10³ cells/well. After transfecting for 0, 24, 48, and 72 hours, the CCK-8 reagent was added in each well (5 mg/mL) and then incubated in dark at 37°C for 2 hours. The OD value was determined at 450 nm wavelength. All the experiments were performed in triplicate.
Colony formation assay
The transfected SGC-7901 or MKN-28 cells were seeded in six-well plates at a density of 5×10⁸ cells/well and cultured for 14 days. Subsequently, cells were fixed and stained with 0.2% crystal violet. The colonies were then visualized and quantified under a light microscope (Olympus Corporation, Tokyo, Japan). All the experiments were performed in triplicate.
Cell invasion assays
Cell invasion assays were performed by using Transwell inserts (BD Biosciences, San Jose, CA, USA) coated with Matrigel. Transfected cells (2×10⁵ cells) were seeded in serum-free medium and placed in the upper chamber, and growth medium was added to the bottom chamber. After incubation for 24 hours, the non-invaded cells in the upper chamber were removed with a cotton swab and the invaded cells in the bottom chambers were fixed and stained with 0.2% crystal violet. The number of cells was counted at five random fields under a light microscope at 100× magnification (Olympus Corporation). All the experiments were performed in triplicate.
Luciferase reporter assay
The potential miR-143-5p binding site of ZEB2-AS1 and the mutant one were synthesized and inserted into the pGL3 vector (Promega, Madison, WI, USA). Similarly, the predicted binding site on the 3′-UTR of HIF-1α and the mutant one were also synthesized and inserted into the pGL3 vector. MKN-28 cells were seeded in 96-well plates at 24 hours prior to transfection. The cells were transfected with miR-143-5p or control mimics, together with the above vectors or respective mutant ones. At 48 hours after transfection, luciferase activities were determined by using the Dual-Luciferase Reporter System (Promega) according to the manufacturer’s instructions.
Western blot assay
Cells were collected and proteins were extracted by using RIPA lysis buffer. Protein concentrations were examined by BCA Protein Assay Kit (Bio-Rad Laboratories Inc., Hercules, CA, USA). Equal amount of proteins was separated by SDS-PAGE and then electrophoretically transferred to polyvinylidene difluoride membrane. The membranes were blocked with 5% nonfat milk for 1 hour at room temperature and then incubated with the primary antibodies against HIF-1α (Abcam, Cambridge, UK) and β-actin (Abcam) overnight at 4°C. After incubating with HRP-linked secondary antibody for 1 hour at room temperature, the protein bands were visualized by an electrochemiluminescence kit (Pierce Biotechnology, Rockford, IL, USA). β-actin was used as an internal control.
Xenograft mouse model
All animal experiments were approved by the Animal Care and Use Ethics Committee of the First Affiliated Hospital of Xi’an Medical University and were carried out in accordance with the Guidelines for the Care and Use of Laboratory Animals (Ministry of Science and Technology of China, 2006). Twelve male BALB/c nude mice (4 weeks old) were randomly divided into two groups. SGC-7901 cells transfected with sh_ZEB2-AS1 vector or sh_NC were suspended in serum-free DMEM medium (5×10⁶ cells) and subcutaneously injected into the right flank of mice. Tumor volume was monitored every 5 days for 25 days after injection, and was calculated as V= length × width2/2. Mice were then sacrificed at 25 days after inoculation, and tumor tissues were isolated, weighed, and frozen for other experiments.
Statistical analysis
GraphPad Prism Software was used to perform the statistical analysis. The data were presented as mean ± SD. Comparisons between groups were performed using Student’s t-test or one-way ANOVA. Categorical data were analyzed by chi-squared test. Pearson correlation analysis was used to analyze the relationship between the expression levels of different genes in gastric cancer samples. P<0.05 was considered statistically significant.
Results
The effects of ZEB2-AS1 on gastric cancer cell proliferation and invasion
We first detected ZEB2-AS1 expression levels in the gastric cancer cell lines (MKN-28, BGC-823, and SGC-7901) and the normal gastric cell line GES-1. The qRT-PCR results showed that ZEB2-AS1 was upregulated in the gastric cancer cells, compared with the normal one (Figure 1A). To explore the role of ZEB2-AS1 in gastric cancer, the downregulation of ZEB2-AS1 in gastric cancer cells was achieved by transfecting with ZEB2-AS1 siRNAs (Figure 1B), while the upregulation of ZEB2-AS1 was achieved by transfecting with ZEB2-AS1–overexpressing vector (Figure 1C). To investigate the effects of ZEB2-AS1 on the proliferation and invasion of gastric cancer cells, CCK-8, colony formation, and cell invasion assays were conducted. Knockdown of ZEB2-AS1 inhibited cell proliferation in a time-dependent manner and suppressed colony growth as well as invasion in SGC-7901 cells, while the ectopic expression of ZEB2-AS1 showed the opposite effects, promoting the MKN-28 cell proliferation and invasion (Figure 1D–I).
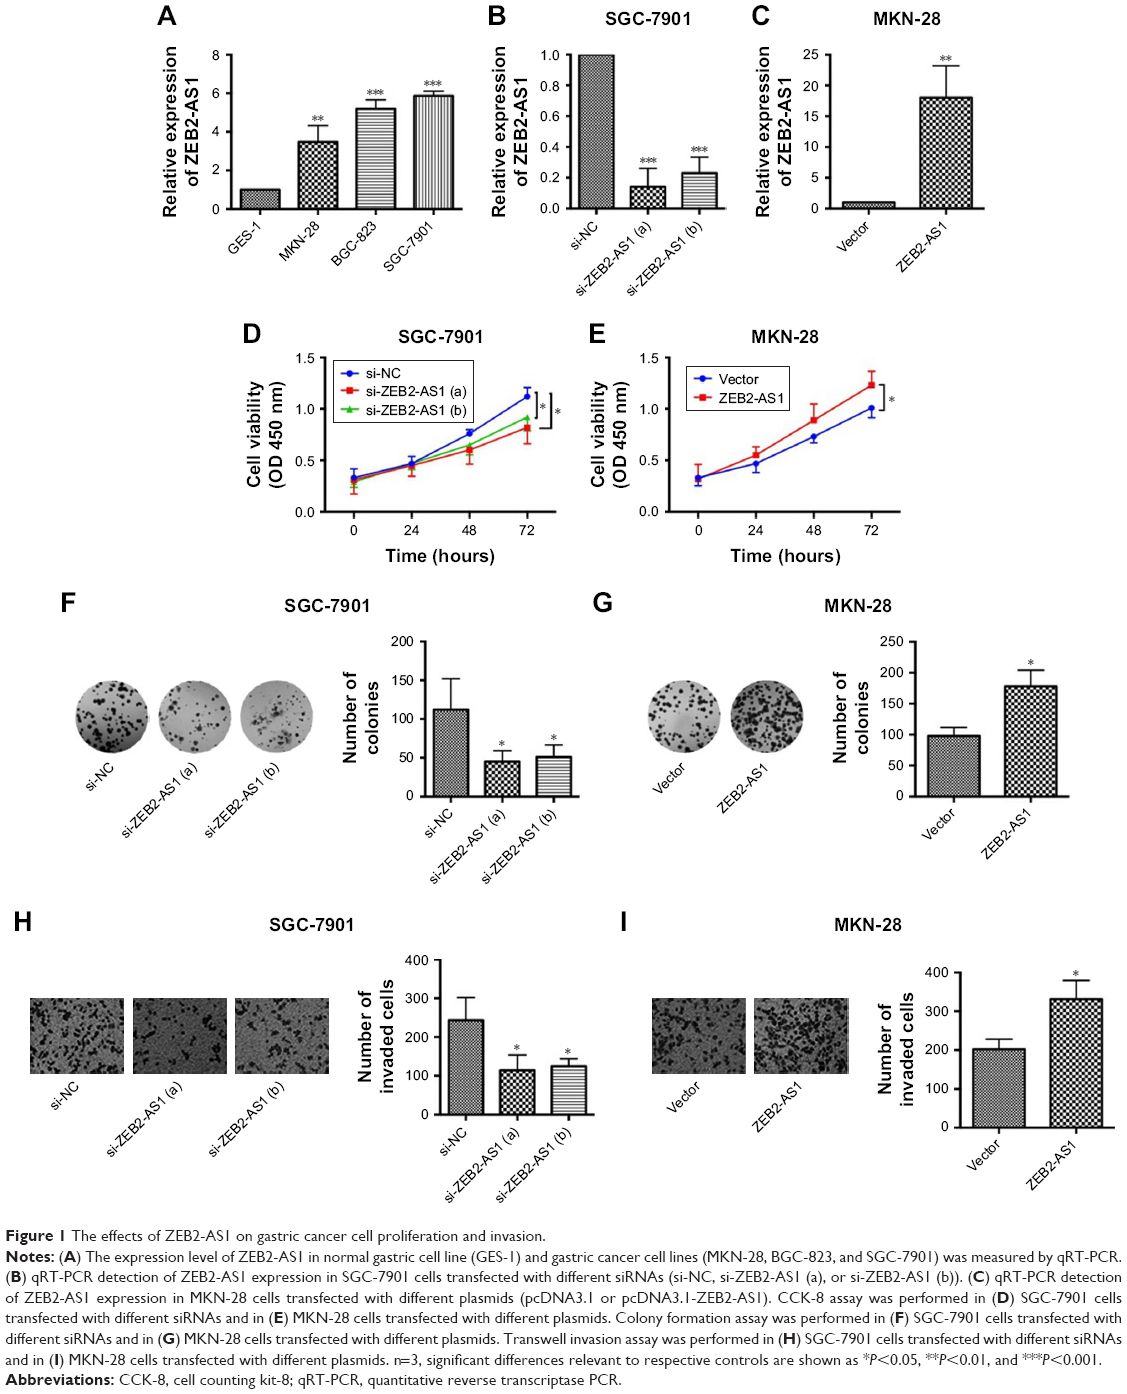 | Figure 1 The effects of ZEB2-AS1 on gastric cancer cell proliferation and invasion. |
The effects of ZEB2-AS1 on in vivo tumor growth
The role of ZEB2-AS1 in gastric tumorigenesis was also analyzed in an in vivo nude mice xenograft model. SGC-7901 cells transfected with sh_ZEB2-AS1 or sh_NC were subcutaneously injected into the right flank of nude mice. At 15, 20, and 25 days after inoculation, the tumor volume in the sh_ZEB2-AS1 group was significantly reduced when compared to that in the sh_NC group (Figure 2A). At 25 days after inoculation, the tumor tissues were weighed, and the weight of the tumor tissues in the sh_ZEB2-AS1 group was significantly lower than that in the sh_NC group (Figure 2B). In addition, the lncRNA expression level was also examined in dissected tumor tissues and ZEB2-AS1 expression was significantly decreased in the tumor tissues from sh_ZEB2-AS1 group when compared with sh_NC group (Figure 2C).
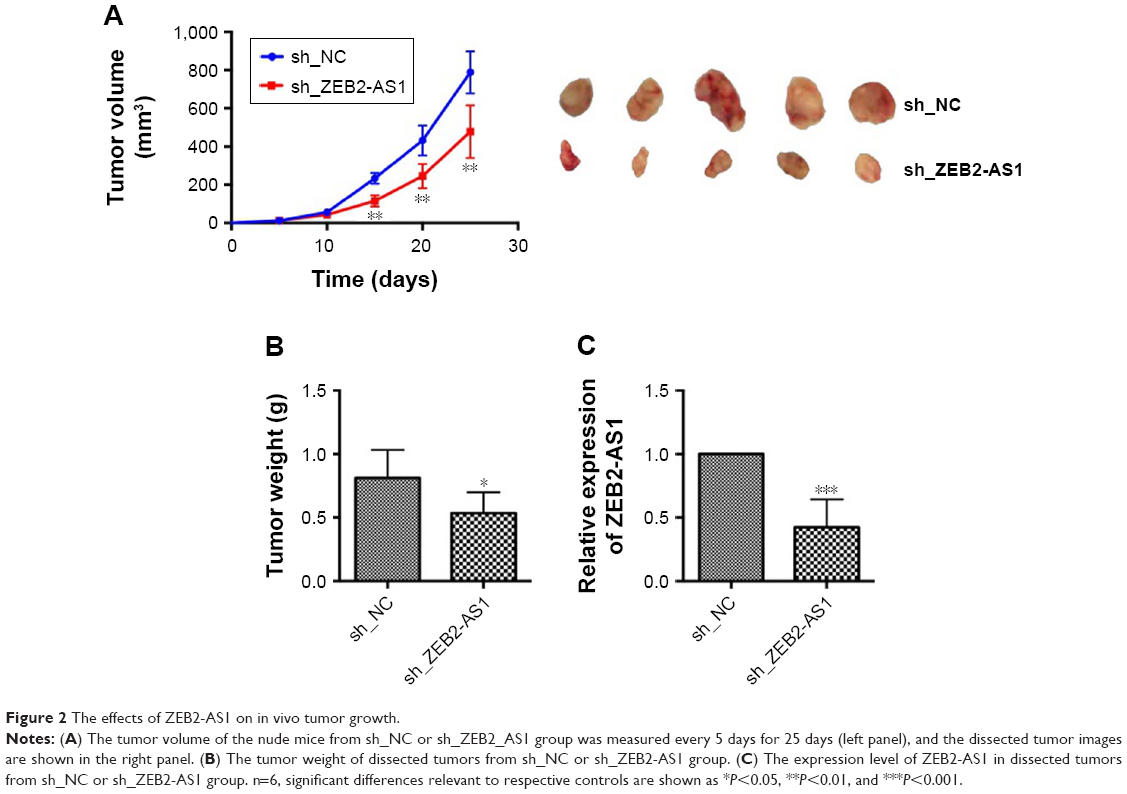 | Figure 2 The effects of ZEB2-AS1 on in vivo tumor growth. |
The interaction between ZEB2-AS1 and miR-143-5p
Recently, ceRNA has been proposed as one of the major regulatory mechanisms for lncRNAs.22 To explore the possible ceRNA network involving ZEB2-AS1, we used bioinformatics tools (DIANA tools) to search the potential candidates and identified miR-143-5p. To further clarify the direct interaction between ZEB2-AS1 and miR-143-5p, luciferase constructs containing the wild-type ZEB2-AS1 transcript or the mutant one (unpaired bases with miR-143-5p in the predicted binding sites) were co-transfected into MKN-28 cells with miR-143-5p mimics or mimic NC (Figure 3A). The results showed the miR-143-5p mimics efficiently increased the miR-143-4p expression level and reduced the luciferase activity of reporter vector containing wild-type fragments, but not the mutant one (Figure 3B and C). Transfection with miR-143-5p mimic also suppressed the expression ZEB2-AS1 in MKN-28 cells (Figure 3D). Furthermore, transfection with ZEB2-AS1 vector decreased the level of miR-143-5p in MKN-28 cells (Figure 3E).
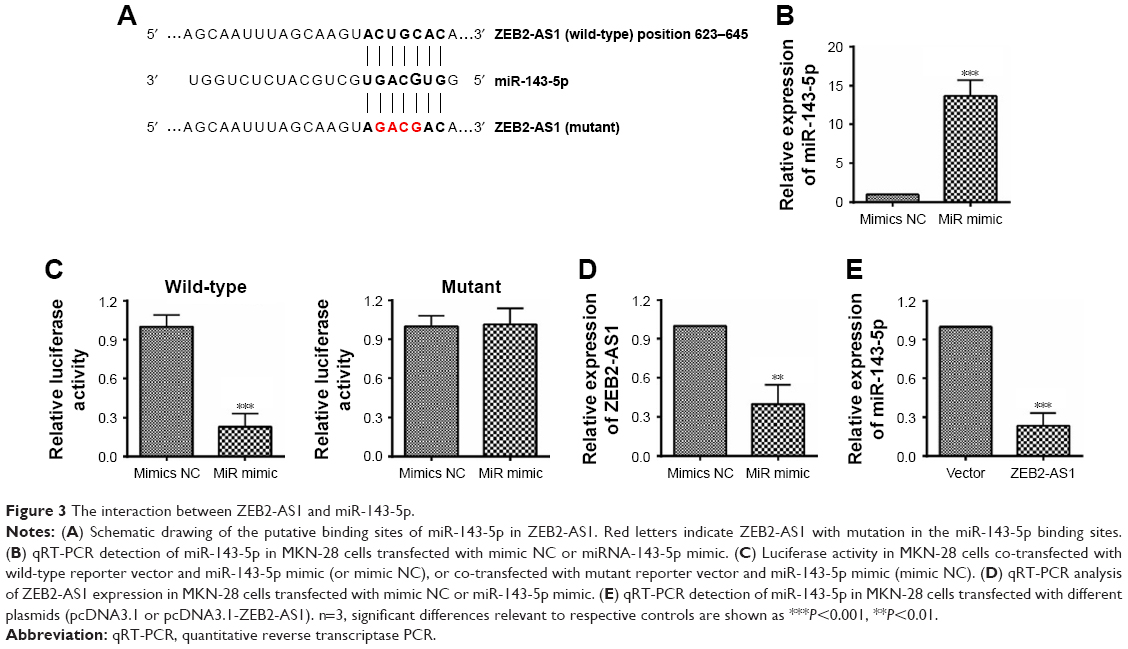 | Figure 3 The interaction between ZEB2-AS1 and miR-143-5p. |
HIF-1α is a direct target of miR-143-5p
According to bioinformatics analysis by TargetScan, we found that miR-143-5p could bind directly to the 3′-UTR of HIF-1α and observed that miR-143-5p inhibited the luciferase reporter activity of the wild-type HIF-1α 3′-UTR, but did not significantly change the activity of the mutant one (unpaired bases with miR-143-5p in the predicted binding sites; Figure 4A and B). In addition, transfection of miR-143-5p mimics decreased the mRNA and protein expression of HIF-1α, while the ectopic expression of ZEB2-AS1 showed the opposite effects on HIF-1α expression (Figure 4C and D). On the other hand, the silence efficiency of HIF-1α siRNA was also examined and the siRNA downregulated both the mRNA and protein expression of HIF-1α (Figure 4E).
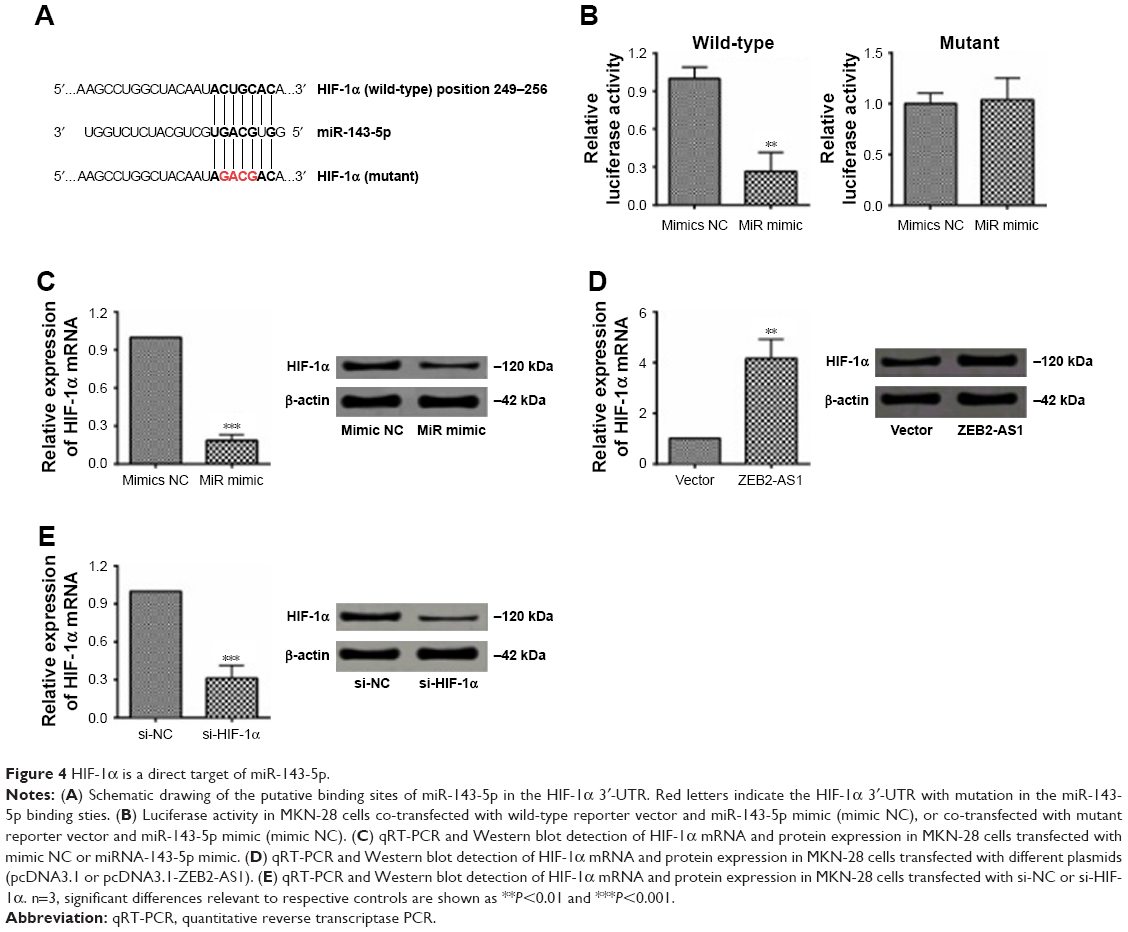 | Figure 4 HIF-1α is a direct target of miR-143-5p. |
ZEB2-AS1 regulated gastric cancer cell proliferation and invasion via miR-143-5p/HIF-1α axis
In order to determine whether ZEB2-AS1 regulated gastric cancer cell proliferation and invasion via miR-143-5p/HIF-1α axis, we performed the rescue experiments. ZEB2-AS1-overexpressing gastric cancer cells were intervened with miR-143-5p mimics or HIF-1α siRNA. CCK-8, colony formation assay, and invasion assay results indicated that miR-143-5p mimics transfection decreased cell viability, colony numbers, and invaded cells, abrogating the effects of ZEB2-AS1 overexpression on the gastric cancer cell proliferation and invasion. In addition, knockdown of HIF-1α showed similar effects as miR-143-5p mimics did, counteracting the effects of ZEB2-AS1 overexpression (Figure 5).
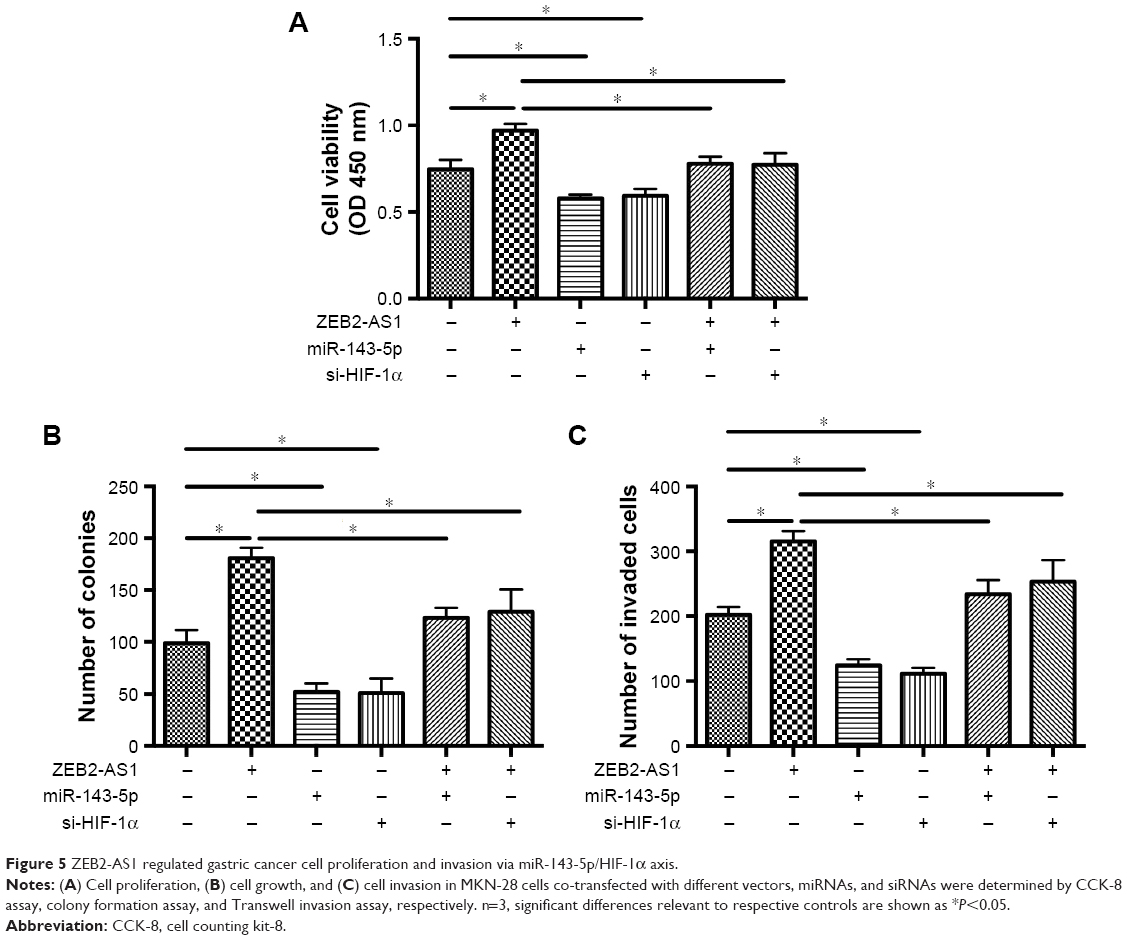 | Figure 5 ZEB2-AS1 regulated gastric cancer cell proliferation and invasion via miR-143-5p/HIF-1α axis. |
The expression of ZEB2-AS1, miR-143-5p, and HIF-1α in gastric cancer tissues
Finally, we checked the expression patterns of ZEB2-AS1, miR-143-5p, and HIF-1α in gastric cancer specimens. Consistent with the in vitro results, ZEB2-AS1 was significantly upregulated in cancerous tissues compared with noncancerous tissues (Figure 6A). MiR-143-5p was downregulated, while HIF-1α was upregulated in the cancerous tissues (Figure 6B and C). The expression of miR-143-5p was inversely correlated with that of ZEB2-AS1, which is a negative but significant correlation (r=−0.2248, P=0.00131; Figure 6D), while HIF-1α showed a positive correlation with ZEB2-AS1 in gastric cancer tissues (r=0.3954, P=0.0068; Figure 6E). In addition, the expression of miR-143-5p was also negatively correlated with HIF-1α expression in gastric cancer tissues (r=−0.5182, P=0.0138; Figure 6F). We then separated the patients into high-expression group and low-expression group based on the medium value. High ZEB2-AS1 expression level was correlated with poor differentiation, lymph node metastasis, and distant metastasis (Table 1).
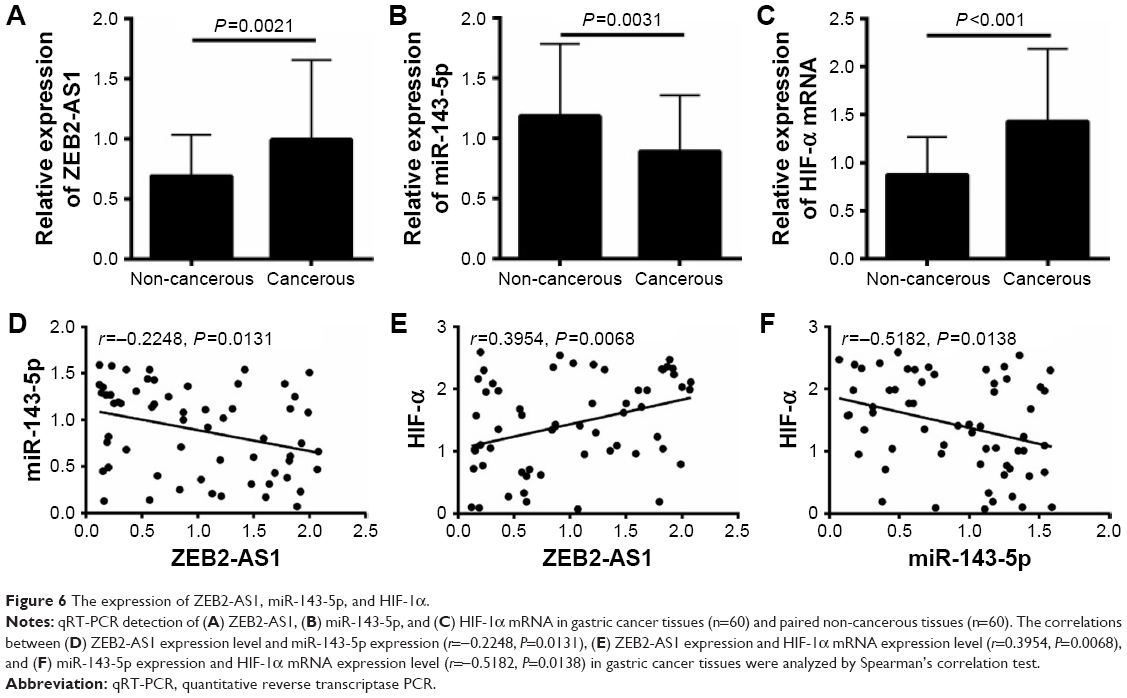 | Figure 6 The expression of ZEB2-AS1, miR-143-5p, and HIF-1α. |
Discussion
Recent studies have suggested that exploring the functions of lncRNA may provide a better understanding for tumor progression. Aberrantly expressed lncRNAs were documented in various types of cancers, including gastric cancer.16 The lncRNA SOX2 overlapping transcript was overexpressed in gastric cancer tissues and contributed to gastric cancer cell proliferation and metastasis.23 HOTAIR was associated with tumor size and metastasis, which represented a biomarker of poor prognosis in gastric cancer.17 ZEB2-AS1 was a conserved natural antisense transcript corresponding to the 5′-UTR of ZEB2, which is known as a transcriptional factor for the process of epithelial–mesenchymal transition, closely associated with carcinogenesis.21 A previous study reported the expression level of ZEB2-AS1 was markedly elevated in pancreatic cancer.21 In lung cancer, ZEB2-AS1 was markedly upregulated and its knockdown increased the levels of apoptosis-related proteins and the relative activities of caspase-3 and -9.24 ZEB2-AS1 silencing inhibited bladder cancer cell proliferation and promoted apoptosis.19 Consistent with previous studies, ZEB2-AS1 was upregulated in gastric cancer tissues and cell lines. In vitro experiments showed that knockdown of ZEB2-AS1 suppressed cell proliferation and cell migration/invasion, while overexpression of ZEB2-AS1 reversed these effects. In vivo data indicated that knockdown of ZEB2-AS1 inhibited tumor growth. We may conclude that ZEB2-AS1 acts as an oncogene in gastric cancer.
The lncRNAs usually exert the effects by acting as a molecular sponge for miRNA. We hypothesized that ZEB2-AS1 serves as a ceRNA in the regulation of gastric cancer progression and discovered that miR-143-5p was a potential target, which was confirmed by luciferase reporter assay and qRT-PCR. The function of miR-143-5p has been reported in prostate cancer and cervical squamous cancer, in which miR-143-5p was found to inhibit the progression of cell cycle, proliferation, and metastasis.19,25 Consistently, overexpression of miR-143-5p counteracted the enhanced effects of ZEB2-AS1 overexpression on cell proliferation and invasion of gastric cancer cells in our study. Moreover, it was downregulated in the gastric cancer tissues and the expression level was negatively associated with that of ZEB2-AS1.
Further investigation was focused on the downstream target of miR-143-5p, and bioinformatics analysis predicted that HIF-1α was a target of miR-143-5p. HIF-1α is a major transcription factor, regulating the downstream genes in response to hypoxia. HIF-1α was reported to play important roles in glucose metabolism, cell proliferation, metastasis, and chemotherapy resistance in cancers.26 For instance, HIF-1α activated matrix metalloproteinase-2 in breast cancer and repressed E-cadherin expression in hepatocellular carcinoma.27,28 It was also demonstrated that HIF-1α upregulation is associated with poor outcomes in cancer.29,30 Moreover, HIF-1α can stimulate PD-L1 expression on the tumor cells, contributing to cancer immune escape.31 In the present study, high HIF-1α expression was also observed in the cancerous tissues. The expression of HIF-1α was negatively regulated by miR-143-5p, while it positively correlated with ZEB2-AS1 expression level. Silencing HIF-1α inhibited cell proliferation and invasion of gastric cancer cells, counteracting the effects of ZEB2-AS1, suggesting that the effects of ZEB2-AS1–mediated gastric cancer progression may involve miR-143-5p/HIF-1α axis.
There are some limitations in this study. The correlation between ZEB2-AS1 expression in gastric cancer tissues and overall survival of gastric cancer patients may be determined to further confirm the prognostic role of ZBE2-AS1 in gastric cancer. In addition, the downstream targets of ZEB2-AS1 may not limit to the miR-143-5p/HIF-1α axis, and further studies should be performed to explore other downstream targets of ZEB2-AS1 in gastric cancer.
Taken together, ZEB2-AS1 was upregulated in gastric tissues and cell lines and promoted cell proliferation and metastasis through miR-143-5p/HIF-1α pathway, which may provide a promising target for treatment of gastric cancer.
Acknowledgment
This project was supported by the Scientific Research Program of Shaanxi Education Department (No 12JK0704).
Disclosure
The authors report no conflicts of interest in this work.
References
Chen W, Zheng R, Baade PD, et al. Cancer statistics in China, 2015. CA Cancer J Clin. 2016;66(2):115–132. | ||
Siegel RL, Miller KD, Jemal A. Cancer statistics, 2017. CA Cancer J Clin. 2017;67(1):7–30. | ||
Thiel A, Ristimäki A. Gastric cancer: basic aspects. Helicobacter. 2012;17(Suppl 1):26–29. | ||
Beermann J, Piccoli MT, Viereck J, Thum T. Non-coding RNAs in development and disease: background, mechanisms, and therapeutic approaches. Physiol Rev. 2016;96(4):1297–1325. | ||
Hombach S, Kretz M. Non-coding RNAs: classification, biology and functioning. Adv Exp Med Biol. 2016;937:3–17. | ||
Wei JW, Huang K, Yang C, Kang CS. Non-coding RNAs as regulators in epigenetics (Review). Oncol Rep. 2017;37(1):3–9. | ||
Guttman M, Rinn JL. Modular regulatory principles of large non-coding RNAs. Nature. 2012;482(7385):339–346. | ||
Esteller M. Non-coding RNAs in human disease. Nat Rev Genet. 2011;12(12):861–874. | ||
Ponting CP, Oliver PL, Reik W. Evolution and functions of long noncoding RNAs. Cell. 2009;136(4):629–641. | ||
Prensner JR, Chinnaiyan AM. The emergence of lncRNAs in cancer biology. Cancer Discov. 2011;1(5):391–407. | ||
Zhou Q, Liu J, Quan J, Liu W, Tan H, Li W. IncRNAs as potential molecular biomarkers for the clinicopathology and prognosis of glioma: a systematic review and meta-analysis. Gene. 2018;668:77–86. | ||
Liu G, Hu X, Zhou G. Long non-coding RNA OR3A4 promotes proliferation and migration in breast cancer. Biomed Pharmacother. 2017;96:426–433. | ||
Zou Y, Yao S, Chen X, et al. LncRNA OIP5-AS1 regulates radioresistance by targeting DYRK1A through miR-369-3p in colorectal cancer cells. Eur J Cell Biol. 2018;97(5):369–378. | ||
Ye B, Hu B, Zheng Z, Zheng R, Shi Y. The long non-coding RNA AK023948 enhances tumor progression in hepatocellular carcinoma. Exp Ther Med. 2017;14(4):3658–3664. | ||
Sun MD, Zheng YQ, Wang LP, Zhao HT, Yang S. Long noncoding RNA UCA1 promotes cell proliferation, migration and invasion of human leukemia cells via sponging miR-126. Eur Rev Med Pharmacol Sci. 2018;22(8):2233–2245. | ||
Gu Y, Chen T, Li G, et al. LncRNAs: emerging biomarkers in gastric cancer. Future Oncol. 2015;11(17):2427–2441. | ||
Liu XH, Sun M, Nie FQ, et al. LncRNA HOTAIR functions as a competing endogenous RNA to regulate HER2 expression by sponging miR-331-3p in gastric cancer. Mol Cancer. 2014;13(1):92. | ||
Yiren H, Yingcong Y, Sunwu Y, et al. Long noncoding RNA MALAT1 regulates autophagy associated chemoresistance via miR-23b-3p sequestration in gastric cancer. Mol Cancer. 2017;16(1):174. | ||
Wu X, Yan T, Wang Z, Wu X, Cao G, Zhang C. LncRNA ZEB2-AS1 promotes bladder cancer cell proliferation and inhibits apoptosis by regulating miR-27b. Biomed Pharmacother. 2017;96:299–304. | ||
Lan T, Chang L, Wu L, Yuan Y. Downregulation of ZEB2-AS1 decreased tumor growth and metastasis in hepatocellular carcinoma. Mol Med Rep. 2016;14(5):4606–4612. | ||
Gao H, Gong N, Ma Z, et al. LncRNA ZEB2-AS1 promotes pancreatic cancer cell growth and invasion through regulating the miR-204/HMGB1 axis. Int J Biol Macromol. 2018;116:545–551. | ||
Tay Y, Rinn J, Pandolfi PP. The multilayered complexity of ceRNA crosstalk and competition. Nature. 2014;505(7483):344–352. | ||
Qu F, Cao P. Long noncoding RNA SOX2OT contributes to gastric cancer progression by sponging miR-194-5p from AKT2. Exp Cell Res. 2018;369(2):187–196. | ||
Guo Y, Hu Y, Hu M, He J, Li B. Long non-coding RNA ZEB2-AS1 promotes proliferation and inhibits apoptosis in human lung cancer cells. Oncol Lett. 2018;15(4):5220–5226. | ||
Jin X, Chen X, Hu Y, et al. LncRNA-TCONS_00026907 is involved in the progression and prognosis of cervical cancer through inhibiting miR-143-5p. Cancer Med. 2017;6(6):1409–1423. | ||
Lin D, Wu J. Hypoxia inducible factor in hepatocellular carcinoma: a therapeutic target. World J Gastroenterol. 2015;21(42):12171–12178. | ||
Choi JY, Jang YS, Min SY, Song JY. Overexpression of MMP-9 and HIF-1α in breast cancer cells under hypoxic conditions. J Breast Cancer. 2011;14(2):88–95. | ||
Zhang L, Huang G, Li X, et al. Hypoxia induces epithelial-mesenchymal transition via activation of SNAI1 by hypoxia-inducible factor-1α in hepatocellular carcinoma. BMC Cancer. 2013;13(1):108. | ||
Lodewijk L, van Diest P, van der Groep P, et al. Expression of HIF-1α in medullary thyroid cancer identifies a subgroup with poor prognosis. Oncotarget. 2017;8(17):28650–28659. | ||
Yang SL, Ren QG, Wen L, Hu JL. Clinicopathological and prognostic significance of hypoxia-inducible factor-1 alpha in lung cancer: a systematic review with meta-analysis. J Huazhong Univ Sci Technolog Med Sci. 2016;36(3):321–327. | ||
Dai X, Pi G, Yang SL, Chen GG, Liu LP, Dong HH. Association of PD-L1 and HIF-1α coexpression with poor prognosis in hepatocellular carcinoma. Transl Oncol. 2018;11(2):559–566. |
Supplementary material
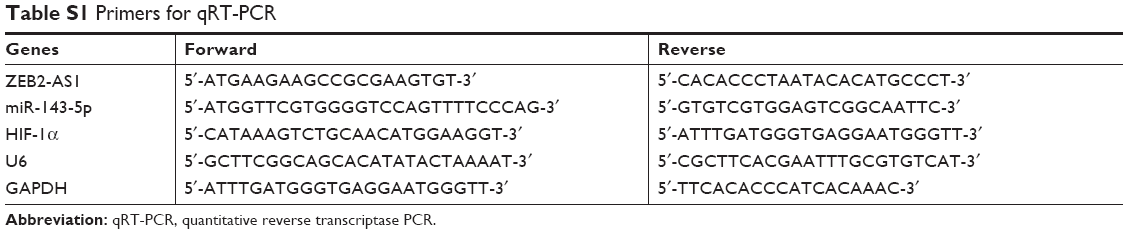 | Table S1 Primers for qRT-PCR |
 © 2019 The Author(s). This work is published and licensed by Dove Medical Press Limited. The full terms of this license are available at https://www.dovepress.com/terms.php and incorporate the Creative Commons Attribution - Non Commercial (unported, v3.0) License.
By accessing the work you hereby accept the Terms. Non-commercial uses of the work are permitted without any further permission from Dove Medical Press Limited, provided the work is properly attributed. For permission for commercial use of this work, please see paragraphs 4.2 and 5 of our Terms.
© 2019 The Author(s). This work is published and licensed by Dove Medical Press Limited. The full terms of this license are available at https://www.dovepress.com/terms.php and incorporate the Creative Commons Attribution - Non Commercial (unported, v3.0) License.
By accessing the work you hereby accept the Terms. Non-commercial uses of the work are permitted without any further permission from Dove Medical Press Limited, provided the work is properly attributed. For permission for commercial use of this work, please see paragraphs 4.2 and 5 of our Terms.