")
Back to Journals » Diabetes, Metabolic Syndrome and Obesity » Volume 15
The Inverse Association of Leg Fat Mass and Osteoporosis in Individuals with Type 2 Diabetes Independent of Lean Mass
Authors Yang L, Deng H , Pan W, Huang X , Xu K, Zhang X, Hu X, Gu X
Received 16 January 2022
Accepted for publication 20 April 2022
Published 29 April 2022 Volume 2022:15 Pages 1321—1330
DOI https://doi.org/10.2147/DMSO.S358717
Checked for plagiarism Yes
Review by Single anonymous peer review
Peer reviewer comments 2
Editor who approved publication: Professor Ming-Hui Zou
Lijuan Yang, Huihui Deng, Wei Pan, Xiaoyan Huang, Ke Xu, Xingxing Zhang, Xiang Hu, Xuejiang Gu
Department of Endocrine and Metabolic Diseases, the First Affiliated Hospital of Wenzhou Medical University, Wenzhou, People’s Republic of China
Correspondence: Xiang Hu; Xuejiang Gu, Department of Endocrine and Metabolic Diseases, the First Affiliated Hospital of Wenzhou Medical University, Ouhai District, Wenzhou, 325000, People’s Republic of China, Tel/Fax +86-577-55579381, Email [email protected]; [email protected]
Purpose: Recent studies revealed that high levels of thigh fat were independently associated with better glucose and lipid metabolism, as well as lower risk of hypertension and cardiometabolic disease. Therefore, the purpose of this study was to evaluate the association between leg fat mass (FM) and osteoporosis (OP) in individuals with type 2 diabetes (T2DM).
Patients and Methods: In this cross-sectional study, a total of 1,259 individuals aged 50 years or older with T2DM (female 536, male 723) were included. A bioelectrical impedance analyser was used to assess the segment body composition containing FM and lean mass (LM) of arms, legs, and trunk. Bone mineral density (BMD) was determined by dual-energy X-ray absorptiometry.
Results: Leg FM was positively correlated with BMD of all sites in females and BMD of femoral neck and total hip in males after adjusting age, diabetes duration, glucose and lipid metabolism indexes, and lifestyle (all P< 0.05). LM was positively associated with BMD at almost sites (P< 0.001), while leg FM/LM ratio had no relationship with BMD at any skeleton sites (P> 0.05). Compared with the bottom tertile group of leg FM, the risk of OP was significantly lower in the top tertile group both in females (T3 vs T1: OR=0.206, 95% CI=0.098– 0.433, P< 0.001) and males (T3 vs T1: OR=0.385, 95% CI=0.182– 0.815, P< 0.05), even after adjusting for LM.
Conclusion: In the present study, higher leg FM was correlated with the lower risk of OP in both men and postmenopausal women with T2DM independently of total LM.
Keywords: leg fat mass, bone mineral density, osteoporosis, type 2 diabetes mellitus
Introduction
Osteoporosis (OP) has become a serious social and public health problem worldwide. According to an early epidemiological survey conducted among individuals over 50 years old in China, osteoporosis prevalence was 20.7% in females and 14.4% in males.1 Individuals with OP are unaware of their low bone mineral density (BMD) status until suffering their first osteoporotic fracture. Therefore, OP is a silent killer. Type 2 diabetes (T2DM), another common disease, has been demonstrated to be a risk factor for fractures.2 However, multiple studies revealed that individuals with T2DM had normal or even elevated BMD.3,4 BMI is considered as the protective effect of BMD. Fat mass (FM) and lean mass (LM) are the main components of body composition. It has been demonstrated that LM was the main determinant of BMD.5–8 And recently, a data from the Concord Health and Ageing in Men Project showed that hip fracture risk reduced with higher appendicular LM rather than total FM in old men over 70 years.9 Whereas the association of FM with BMD is inconsistent. Moreover, previous literature has found that regional fat distribution may influence BMD differently. Some research data showed that total FM had a positive correlation with BMD, while abdominal FM had an unfavourable association with BMD.10,11 Another study indicated that total FM after adjusting for weight was negatively related to BMD, and abdominal fat in women and limb fat in men exhibited the most notable negative associations with BMD.12 Additionally, data from the Indian population found that percent total FM and trunk FM were positively correlated with BMD at lumbar spine, femur, and forearm in men and women.13 A recent study found that the relationship between adipose and BMD was dependent on BMI and menopause status in men and women, respectively.14 Thus, the impact of fat distribution on BMD remains controversial.
To the best of our knowledge, studies investigating the correlation between FM distribution and BMD in individuals with T2DM are scarce. A small-scale study found that visceral and subcutaneous fat were inversely associated with femoral neck BMD in men and with lumbar BMD and femoral neck BMD in women with T2DM after adjusting for weight.15 Contrary to the founding in the above research, an opposite conclusion was drawn from another small-scale study performed in the US.16 Interestingly, recent studies revealed that a high level of thigh fat was independently correlated with better glucose and lipid levels, and a lower risk of hypertension and cardiometabolic disease.17–19 Moreover, a retrospective cohort study suggested that subcutaneous fat area at the upper thigh was a protective factor for survival in the population of elderly patients with proximal femur fracture.20 Additionally, the Health, Aging and Body composition study (Health ABC) demonstrated that decreased thigh subcutaneous fat thickness was significantly associated with increased hip fracture.21
Hence, the purpose of our cross-sectional study was to explore the correlation of FM distribution, especially leg FM, with BMD in women and men with T2DM, as well as the influence of confounding factors including fish consumption, smoking, and alcohol habits.
Patients and Methods
Study Population
A total of 1,259 participants with T2DM, aged 50 years or older (women in menopause for at least 2 years) were included; the patients were hospitalized from April 2017 to January 2020. The participants were excluded before enrollment if they had metabolic bone diseases or a medical history known to influence BMD as follows: thyroid dysfunction, hyperparathyroidism, rheumatic disease, cardiovascular disease, chronic liver disease, chronic renal disease, mental disease, acute infectious disease, tumor, pregnancy, prolonged intake of drugs for osteoporosis such as estrogen, bisphosphonates, vitamin D analogs, or parathyroid hormones, and previously prescribed systemic glucocorticoids or anticonvulsants. Each participant was required to complete a standardized questionnaire on previous medical history, usage of drugs, menopausal status of women, smoking, alcohol intake, and dietary habits. Smoking and alcohol status were categorized into three levels: never, ever (previous consumption for at least 6 months), and current (recent consumption over the past 6 months). The last two levels were deemed as positive. Fish intake was classified into three levels: low (<1 serving per week), moderate (≥1 serving per week, but <3 servings per week), and high (≥3 servings per week). Similarly, the last two levels were regarded as positive.
This cross-sectional study was a part of a Serological, metabolomic, genomic study of metabolic diseases, which was applied by the Ruijin Hospital, Shanghai JiaoTong University School of Medicine. The study protocol was approved by the Ethics Committee of The First Affiliated Hospital of Wenzhou Medical University (KY2021-173) which is a subcenter of the Ruijin Hospital, Shanghai JiaoTong University School of Medicine. This study was conducted in accordance with the Declaration of Helsinki. Written informed consent was obtained from each participant.
Anthropometric and Biochemical Measurements
A general physical examination was performed for each participant by the trained doctors. Weight and height were assessed to the nearest 0.01 kg and 0.01 cm by standard methods, respectively. Body mass index (BMI) was obtained by the calculation according to the following formula: BMI=weight (kg)/height2(m2). Waist circumference (WC) was measured with a tape wrapping around the waist at the level of the midpoint of the line between the anterior superior iliac spine and the lowest rib, and accurate to 0.01 cm. On the basis of the Expert Consensus on Integrated Management of Type 2 Diabetes Mellitus Complicated with Obesity in China,22 BMI≥24 kg/m2 was defined as overweight/obesity, and WC≥90 cm in men and WC≥85 cm in women were defined as abdominal obesity.
Blood samples were taken from the antecubital vein after at least a 10-hour overnight fast. ARCHITECT ci16200 Integrated system (Abbott, IL) was used to measure the laboratory indices including fasting plasma glucose (FPG), fasting insulin, and serum lipid spectra (involving total cholesterol [TC], low-density lipoprotein cholesterol [LDL-c], high-density lipoprotein cholesterol [HDL-c], triglycerides [TGs]). Glycated hemoglobin (HbA1c) was determined by high performance liquid chromatography method (VARIANTTMI and D-10TM system, BIO-RAD). All blood samples were analyzed within 24 hours. The Homeostasis Model Assessment of Insulin Resistance (HOMA-IR) formula is shown below: HOMA-IR=FINS (mU/L)×FPG (mmol/L)/22.5.
Measurements of Body Composition and Fat Distribution
An automatic bioelectrical impedance analyzer (InBody 720, Biospace Co, Ltd, Korea) was carried out to measure the segment body composition including FM and LM of arms, legs and trunk, separately. In accordance with the manufacturer’s instructions, participants’ information about gender, age, and height were input into the analyzer before measurement. Each participant was instructed to stand barefoot on a stand-alone unit and to grasp the handles of the analyzer during measurement. Finally, results of each body segment were retrieved from the analysis.
Dual-Energy X-Ray Absorptiometry (DXA) Examination
Areal BMD (grams per square centimeter) of lumbar spine (L1-L4), femoral neck, and total hip was measured by DXA (Prodigy primo, GE Inc., Madison, WI). Well trained and licensed technicians operated DXA instruments and used a spine phantom for quality control prior to initiating scanning sessions daily. The coefficient of variation (CV) was <1.0% for each measurement site. Based on the World Health Organization (WHO), OP was defined as a T-score ≤−2.5, osteopenia was defined as −2.5 < T-score <−1.0, and normal BMD was defined as T-score ≥−1.0.
Statistical Analysis
SPSS 16.0 statistical software (SPSS Inc, Chicago, IL) was used for statistical analysis. Data was presented as mean±standard deviation for normally distributed continuous variables, median (interquartile range) for skewed distributed continuous variables, and numbers (percentages) for categorical variables. Chi-squared test was performed to compare calculators information, one-way ANOVA was performed to compare means, and Kruskal–Wallis test was performed to compare median. To assess the correlation of fat distribution (arms FM, legs FM, trunk FM), leg FLR and total LM with BMD of lumbar spine, femoral neck and total hip in individuals with T2DM, univariate and multivariate logistic regression were carried out. Logistic regression analyses were applied to determine the presence of OP among leg FM tertiles. In Model 1, we evaluated the relationship between leg FM and the presence of OP firstly. In Model 2, we investigated the association of leg FM and the presence of OP with adjusted for age, lifestyle (intake of fish, smoking, alcohol), glucose and lipid metabolism indexes (TG, HDL-c, LDL-c, HOMA-IR, HbA1c), and diabetes duration. In Model 3, LM of total body was included into discussion with the relationship of leg FM and the presence of OP. P<0.05 was considered statistically significant.
Results
Clinical Variables of the Study Population
As shown in Table 1, the median age was 59 years for the whole population, 60 for females and 58 for males, respectively. The BMI was 24.64±3.60 kg/m2 for females and 24.34±2.99 kg/m2 for males. The percentages of drinkers and smokers were 4.10% and 1.12% for females and 39.97% and 22.95% for males. The percentages of fish intake was 52.24% for females and 60.17% for males. The biochemical parameters, segment body composition, and BMD at all skeleton sites are described in detail in Table 1.
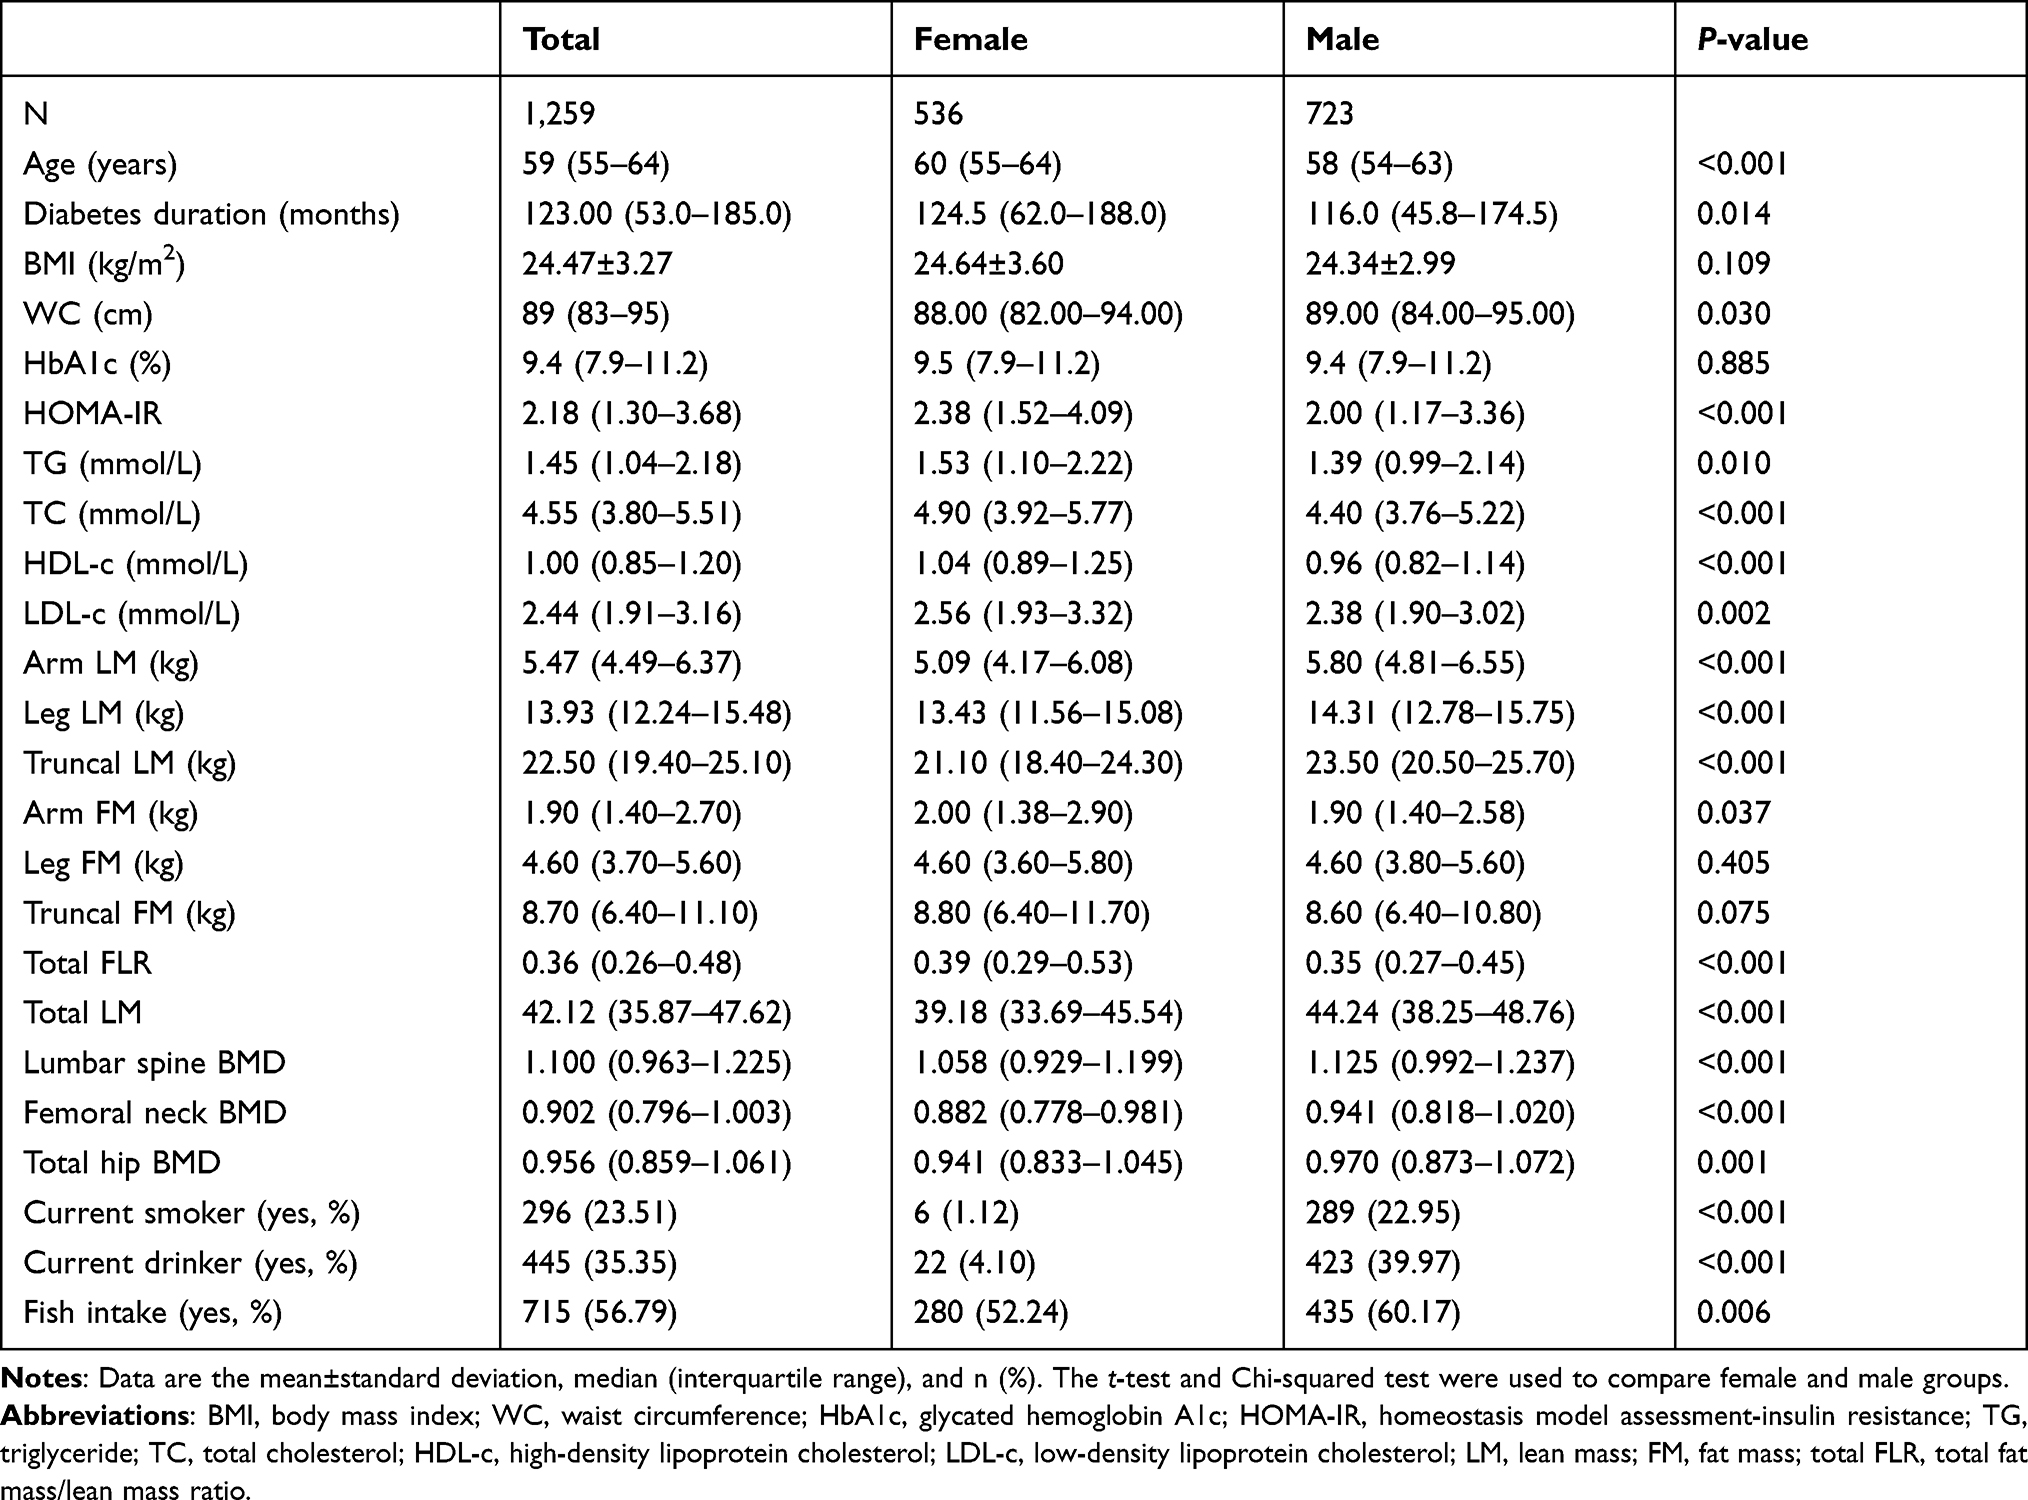 |
Table 1 Characteristics of Study Participants |
Multiple Regression Analysis of Segment Body Composition with BMD at All Sites
Multiple linear regression analysis was conducted in participants with T2DM. Results showed that leg FM of females was positively correlated with BMD in lumbar spine, femoral neck, and total hip (P<0.05) and leg FM of males was positively correlated with BMD in femoral neck and total hip (P<0.01). In this study population, trunk FM had no significant association with BMD (Table 2). LM of all the segments including arm, leg, and trunk had a positive association with BMD of the lumbar spine, femoral neck, and total hip in females and with BMD of the femoral neck and total hip in males (P<0.001, Supplementary Table S1). Additionally, there was no significant relationship between leg FLR and BMD at any skeleton sites (P>0.05, Supplementary Table S2).
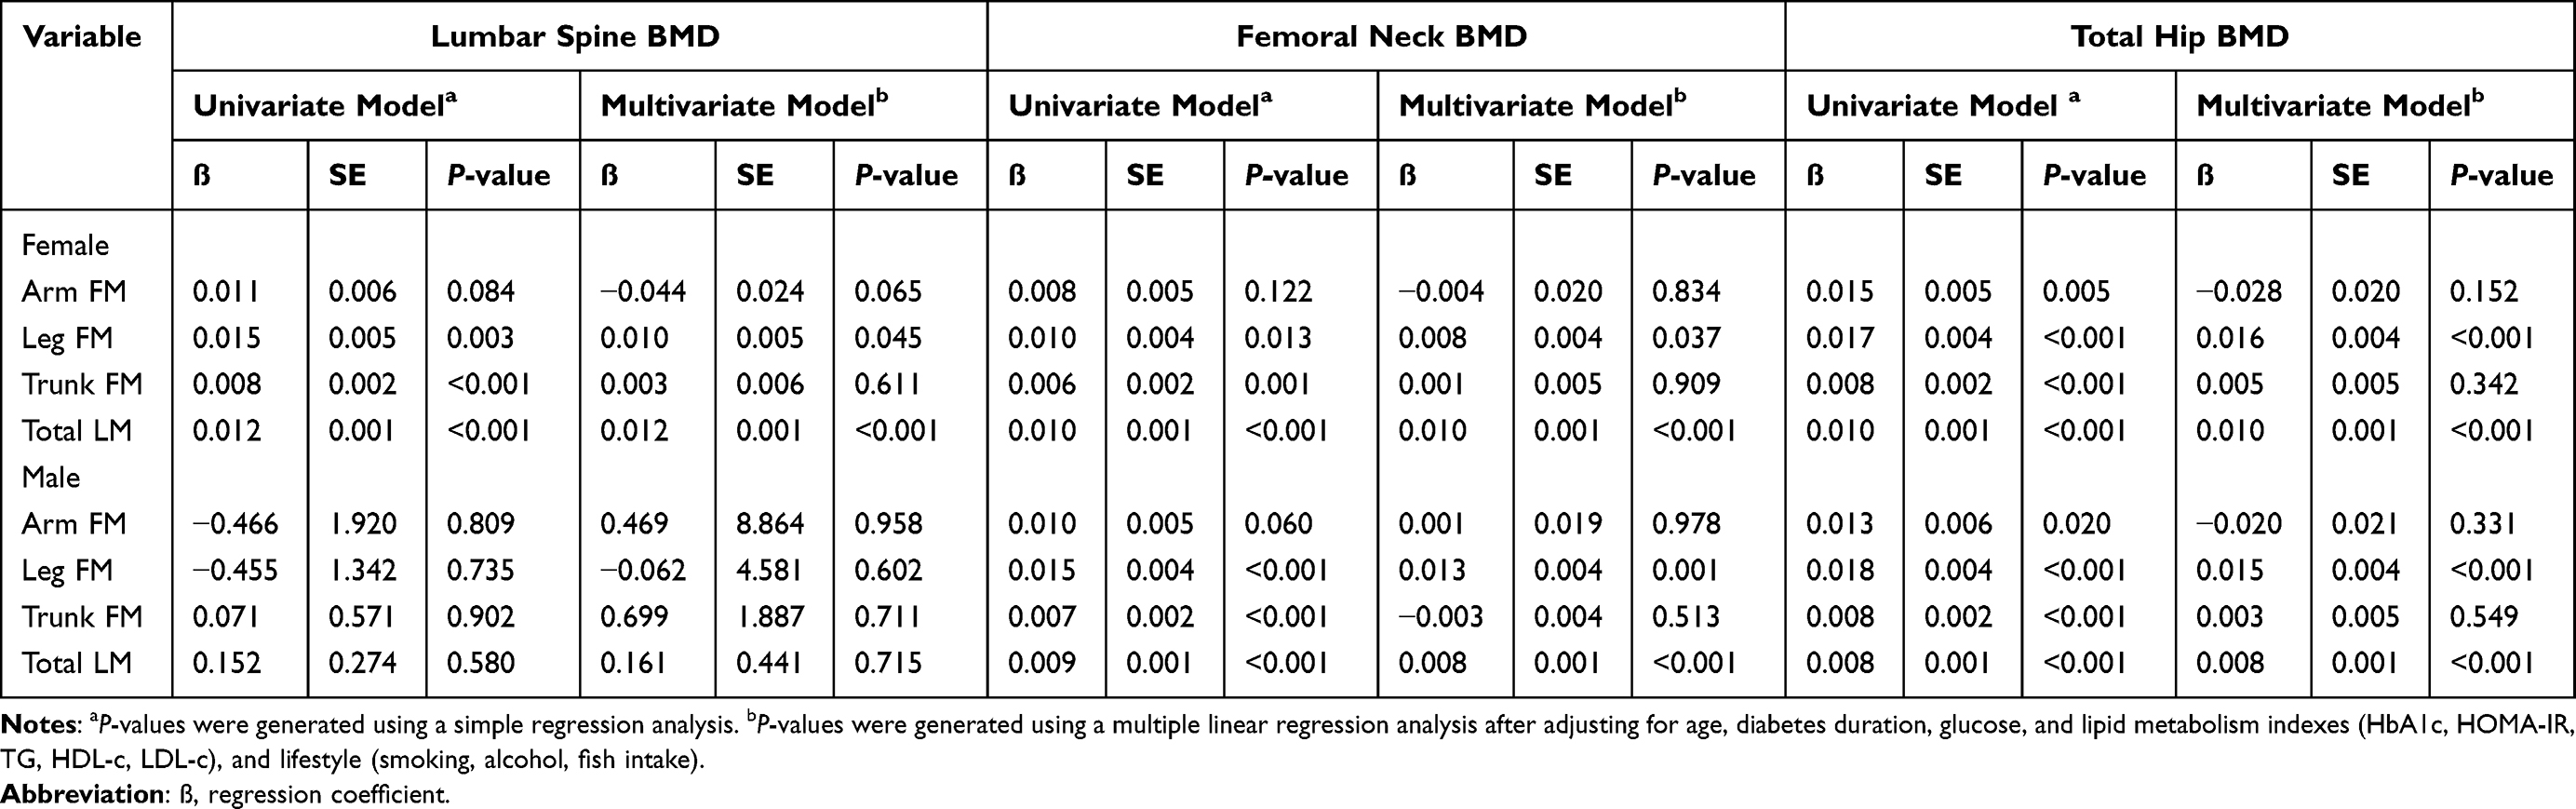 |
Table 2 Univariate and Multivariate Analyses for Associations Between Body Composition and BMD Value at Various Skeletal Sites for Females and Males |
The Leg FM of OP Was Lower Than Those with Osteopenia and Normal BMD
In postmenopausal women with T2DM, leg FM showed an uptrend from osteoporosis, to those with osteopenia, and to those with normal BMD (low WC: 3.8 (3.2–5.0), 4.4 (3.4–5.5), 4.8 (4.0–5.8), P for trend <0.05; high WC: 4.0 (3.2–5.2), 4.6 (3.8–5.6), 5.0 (4.0–6.2), respectively, P for trend <0.001) (Figure 1). In elderly men with T2DM, the result was similar in the low WC group (4.00 (3.13–5.13), 4.40 (3.43–5.20), 4.75 (3.98–5.63), P for trend <0.05), and that trend disappeared in the high WC group (4.40 (3.35–5.55), 4.60 (3.80–5.60), 4.70 (4.00–5.93), P for trend >0.05) (Figure 1).
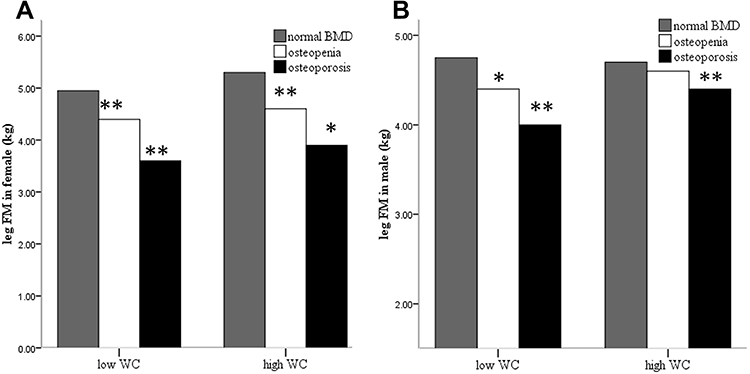 |
Figure 1 Comparison of leg fat mass between normal bone mineral density, osteopenia, and osteoporosis in different waist circumference groups. (A) Comparison of leg fat mass in females; (B) comparison of leg fat mass in males. *P<0.05 versus normal bone mineral density, **P<0.001 versus normal bone mineral density. |
The Presence of OP Among Leg FM Tertiles
The current study participants were further classified into three subgroups T1~T3 according to leg FM tertiles (leg FM level in females: T1 ≤3.9 kg, T2 4.0~5.3 kg, T3 ≥5.4 kg; leg FM level in males: T1 ≤3.9 kg, T2 4.0~5.2 kg, T3 ≥5.2 kg). In postmenopausal women with T2DM, after adjusting for age, diabetes duration, glucose and lipid metabolism indexes, and lifestyle (smoking, alcohol, fish intake), the risk of OP decreased by more than half in T2 (odds ratio [OR]=0.331, 95% confidence interval (CI)=0.170–0.643, P=0.001) and T3 (OR=0.230, 95% CI=0.113–0.466, P<0.001) compared to T1 (Supplementary Table S3). Even after adjusting for LM, the decrease in risk of OP remained in T2 (OR=0.263, 95% CI=0.129–0.537, P<0.001) and T3 (OR=0.206, 95% CI=0.098–0.43, P<0.001) when compared to T1 (Figure 2). Moreover, the per unit increase in leg FM was dramatically correlated with a 36.9% reduction in the prevalence of OP (OR=0.631, 95% CI=0.508–0.785, P<0.001) (Supplementary Table S3). However, in elderly men with T2DM, the risk of OP decreased only in the highest tertile of leg FM (OR=0.385, 95% CI=0.182–0.815, P=0.013), when adjusted for LM (Figure 2).
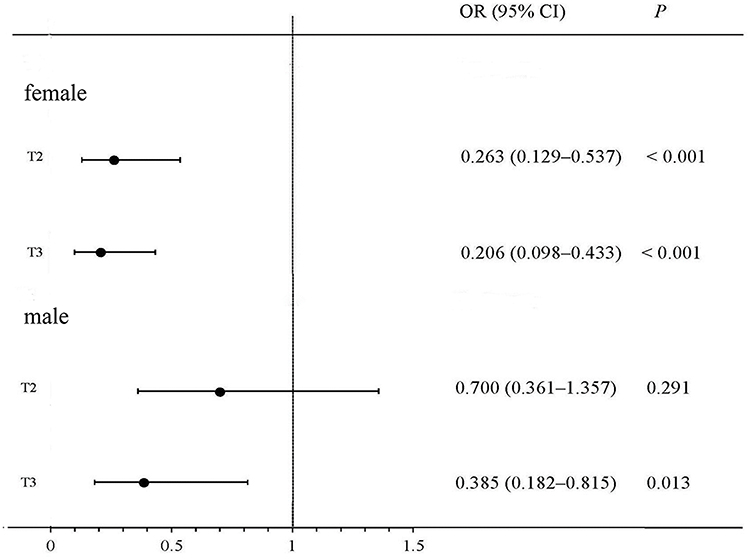 |
Figure 2 Adjusted odds ratio of osteoporosis according to tertiles of leg fat mass. The odds ratio with corresponding 95% confidence interval were adjusted for age, lifestyles (intake of fish, smoking, alcohol), glucose and lipid metabolism indexes (HbA1c, HOMA-IR, TG, HDL-c, LDL-c), diabetes duration, and total lean mass. T1 is the reference group. |
Discussion
In this study, leg FM was independently and positively associated with BMD in the lumbar spine, femoral neck, and total hip in postmenopausal females with T2DM, and with BMD of the femoral neck and total hip in males with T2DM. Moreover, higher leg FM was related to lower risk of osteoporosis in men and postmenopausal women with T2DM, independent of total LM.
Increased leg FM was correlated with an increase in BMD and a reduction in risk of osteoporosis, consistent with other similar studies partly. A previous study in a population of 49 human cadaveric specimens showed that the risk of hip fracture decreased with increasing trochanteric soft tissue thickness.23 However, no statistical significance was found after adjusting for hip BMD. The fracture risk caused by reduced trochanteric soft tissue thickness was attributed to decreased force acting on the hip during sideways falling independent of BMD. Another result from the Health ABC study revealed that increased thigh subcutaneous fat thickness was related to decreased fracture risk both in men and women, even after adjusting for total femoral BMD.21 Although existing data on the association between extremity FM and BMD was sparse, extremity fat mass has been considered to be related to metabolic diseases. It is noteworthy that extremity FM is a protective factor for blood pressure, lipid, glucose, and cardiovascular disease in recent literature. Additionally, the subcutaneous compartment seemed to be the strongest determinant of lower extremity fat tissue, unlike visceral adiposity, and may play a protective role in bone structure and strength.24 In our study, leg FM in men and postmenopausal women with T2DM was a significant predictor of osteoporosis in fully adjusted models.
On the basis of the result mentioned above, leg FM was associated with BMD at various skeletal sites not only in females but also in males, thus the association between leg FLR and LM with BMD at various skeletal sites was further assessed subsequently to compare the contribution of the proportion of fat mass and lean body mass. As a result, a positive correlation was observed between LM of all the regions and BMD, while no association between leg FLR and BMD was observed in our present study. Thus, it is suggested that leg FM and leg LM might have equal contributions to BMD in individuals with T2DM.
Although the relationship of abdominal obesity and BMD has been studied for many years, the conclusion remains controversial.11,13,25 There was no significant association between truncal FM and BMD in the present study. It has been reported that WC was a stronger predictor than trunk fat for bone mineral content.26 And WC has been considered to be a reliable surrogate measure for abdominal obesity.27 Therefore, the subjects were divided into two groups of high WC and low WC, as defined above. Compared with normal BMD individuals, leg FM was lower in osteopenia individuals and lowest in osteoporosis individuals both in high and low WC in postmenopausal women, and in the low WC group of men. in men with high WC, the downtrend of leg FM still existed despite no statistical significance being drawn. In other words, the positive association between leg FM and BMD in individuals with T2DM could not be interfered with WC.
To measure segmental body composition, nowadays different methods such as improved DXA and CT scans are often used. Trochanteric soft tissue thickness is difficult to acquire for the assessment of body composition. CT scans are also limited in application because of their cost and radiation exposure. DXA is also expensive and not practical for epidemiological studies. Bioelectrical impedance analysis (BIA) is a convenient, noninvasive, and inexpensive method for evaluating body composition, and is suitable for assessment in a large-sample cohort study. In addition, some research has shown good agreement between DXA and BIA for estimation of appendicular FM and lean soft tissue mass (LSTM), especially in older adults.28 Therefore, BIA was used to measure segment body composition containing the whole-body, appendicular (upper extremity and lower extremity), trunk FM and LM in the present study. And, as far as we know, this study was the first to investigate the relationship between lower extremity FM assessed using BIA and osteoporosis in individuals with T2DM.
Previous studies have found that fish consumption might have a positive relationship with BMD or decline in risk of fractures.29 The population included in this study were from coastal areas, who had more fish consumption comparatively because of its accessibility. Therefore, the present study took fish consumption into consideration as a confounding factor and explored its influence on the relationship between leg FM and BMD. As a result, this positive relationship was independent of fish consumption.
There are some potential explanations for the osteoporosis risk difference among different lower extremity FM groups. First, the lipolytic activity of femoral fat depots is different from that of visceral fat depots. Nonesterified fatty acids (NEFAs) can be obtained from circulation by femoral fat depots to prevent other organs from high NEFA exposure,30,31 which means that there would be a greater inclination to differentiate into osteogenic cells from mesenchymal stem cells.32 Second, due to appear more sensitive to corticosteroids and estrogen, fat deposits preferentially exist in the femoral region.33 Estrogen derived from the femoral region can induce osteoclast apoptosis and inhibit bone resorption.34 Third, adiponectin and leptin derived from adipocyte, express higher in subcutaneous fat tissue than in visceral fat, which could play important roles in bone formation and resorption. It has been shown previously that adiponectin directly suppressed osteoclast-mediated bone resorption and leptin promoted the differentiation of osteoblasts.35,36
The strength of this study is that many potential variables such as smoking, alcohol, and fish consumption were taken into account to minimize the impacts of confounding factors. Although numerous literature has indicated that fat distribution was correlated with BMD, studies on the association between lower extremity FM and BMD is scarce in elderly individuals with T2DM. Nevertheless, the present study had its limitations. First, it was an observational study where no conclusions about cause and effect on lower extremity FM and BMD could be drawn. Great sample size and further long follow-up period with a control group of individuals with no diabetes are required to confirm and generalize the present findings in future researches. Second, discrepancies underlying the BIA could be influenced by any alteration in distribution of body water and body geometric construction of the study participants. Third, other surrogate indicators of abdominal obesity such as waist-to-hip ratio, sagittal abdominal diameter, and visceral adipose tissue are needed to be studied with BMD in T2DM individuals in future studies.
Conclusion
Higher leg FM is associated with increased BMD and decreased osteoporosis risk among men and postmenopausal women with T2DM independent of LM, as well as fish consumption, smoking, and alcohol habits. Contribution of leg FM to the rise of BMD is important as much as leg LM. These results indicated that it’s important to evaluate segmental body composition precisely, and maintaining appropriate lower extremity FM is beneficial for BMD in individuals with T2DM.
Acknowledgments
This work was funded by the Natural Science Foundation of Zhejiang Province (Project Number: LY20H070003) and the National Natural Science Foundation of China (81900737).
Author Contributions
All authors made a significant contribution to the work reported, whether that is in the conception, study design, execution, acquisition of data, analysis and interpretation, or in all these areas; took part in drafting, revising or critically reviewing the article; gave final approval of the version to be published; have agreed on the journal to which the article has been submitted; and agree to be accountable for all aspects of the work.
Disclosure
The authors report no conflicts of interest in this work.
References
1. Eitorial Committee of White Paper on Osteoporosis Prevention and Control. China Health Promotion Foundation. White paper on osteoporosis. Chine J Health Manage. 2009;3:148–154.
2. Miyake H, Kanazawa I, Sugimoto T. Association of Bone Mineral Density, Bone Turnover Markers, and Vertebral Fractures with All-Cause Mortality in Type 2 Diabetes Mellitus. Calcif Tissue Int. 2018;102(1):1–13. doi:10.1007/s00223-017-0324-x
3. Strotmeyer ES, Cauley JA, Schwartz AV, et al. Diabetes is associated independently of body composition with BMD and bone volume in older white and black men and women: the Health, Aging, and Body Composition Study. J Bone Miner Res. 2004;19(7):1084–1091. doi:10.1359/JBMR.040311
4. Ma L, Oei L, Jiang L, et al. Association between bone mineral density and type 2 diabetes mellitus: a meta-analysis of observational studies. Eur J Epidemiol. 2012;27(5):319–332. doi:10.1007/s10654-012-9674-x
5. Park JH, Song YM, Sung J, et al. The association between fat and lean mass and bone mineral density: the Healthy Twin Study. Bone. 2012;50(4):1006–1011. doi:10.1016/j.bone.2012.01.015
6. Kim YM, Kim SH, Kim S, et al. Variations in fat mass contribution to bone mineral density by gender, age, and body mass index: the Korea National Health and Nutrition Examination Survey (KNHANES) 2008-2011. Osteoporos Int. 2016;27(8):2543–2554. doi:10.1007/s00198-016-3566-y
7. Kang DH, Guo LF, Guo T, et al. Association of body composition with bone mineral density in northern Chinese men by different criteria for obesity. J Endocrinol Invest. 2015;38(3):323–331. doi:10.1007/s40618-014-0167-5
8. Ahn SH, Lee SH, Kim H, et al. Different relationships between body compositions and bone mineral density according to gender and age in Korean populations (KNHANES 2008-2010). J Clin Endocrinol Metab. 2014;99(10):3811–3820.
9. Scott D, Seibel M, Cumming R, et al. Associations of Body Composition Trajectories with Bone Mineral Density, Muscle Function, Falls, and Fractures in Older Men: the Concord Health and Ageing in Men Project. J Gerontol a Biol Sci Med Sci. 2020;75:939–945. doi:10.1093/gerona/glz184
10. Zhang J, Jin Y, Xu S, et al. Associations of fat mass and fat distribution with bone mineral density in Chinese obese population. J Clin Densitom. 2015;18(1):44–49. doi:10.1016/j.jocd.2014.03.001
11. Fu X, Ma X, Lu H, et al. Associations of fat mass and fat distribution with bone mineral density in pre- and postmenopausal Chinese women. Osteoporos Int. 2011;22(1):113–119. doi:10.1007/s00198-010-1210-9
12. Liu YH, Xu Y, Wen YB, et al. Association of weight-adjusted body fat and fat distribution with bone mineral density in middle-aged Chinese adults: a cross-sectional study. PLoS One. 2013;8(5):e63339. doi:10.1371/journal.pone.0063339
13. Marwaha RK, Garg MK, Tandon N, et al. Relationship of body fat and its distribution with bone mineral density in Indian population. J Clin Densitom. 2013;16(3):353–359. doi:10.1016/j.jocd.2012.08.074
14. Bland VL, Klimentidis YC, Bea JW, Roe DJ, Funk JL, Going SB. Cross-sectional associations between adipose tissue depots and areal bone mineral density in the UK Biobank imaging study. Osteoporos Int. 2022;33(2):391–402. doi:10.1007/s00198-021-06140-w.
15. Yamaguchi T, Kanazawa I, Yamamoto M, et al. Associations between components of the metabolic syndrome versus bone mineral density and vertebral fractures in patients with type 2 diabetes. Bone. 2009;45(2):174–179. doi:10.1016/j.bone.2009.05.003
16. Moseley KF, Dobrosielski DA, Stewart KJ, et al. Lean mass and fat mass predict bone mineral density in middle-aged individuals with noninsulin-requiring type 2 diabetes mellitus. Clin Endocrinol. 2011;74(5):565–571. doi:10.1111/j.1365-2265.2010.03965.x
17. Jung KJ, Kimm H, Yun JE, et al. Thigh circumference and diabetes: obesity as a potential effect modifier. J Epidemiol. 2013;23(5):329–336. doi:10.2188/jea.je20120174
18. Chen GC, Arthur R, Iyengar NM, et al. Association between regional body fat and cardiovascular disease risk among postmenopausal women with normal body mass index. Eur Heart J. 2019;40(34):2849–2855.
19. Shi J, Yang Z, Niu Y, et al. Large thigh circumference is associated with lower blood pressure in overweight and obese individuals: a community-based study. Endocr Connect. 2020;9(4):271–278. doi:10.1530/EC-19-0539
20. Kim Y, Seo D, Ko Y, Hong S, Kim K, Kim W. Subcutaneous fat area at the upper thigh level is a useful prognostic marker in the elderly with femur fracture. J Cachexia Sarcopenia Muscle. 2021;12:2238–2246. doi:10.1002/jcsm.12845
21. Malkov S, Cawthon PM, Peters KW, et al. Hip Fractures Risk in Older Men and Women Associated With DXA-Derived Measures of Thigh Subcutaneous Fat Thickness, Cross-Sectional Muscle Area, and Muscle Density. J Bone Miner Res. 2015;30(8):1414–1421. doi:10.1002/jbmr.2469
22. Chinese Society of Endocrinology. Expert Consensus on Integrated Management of Type 2 Diabetes Mellitus Complicated with Obesity in China. Drug Evaluation. 2016;13(17):5–12.
23. Bouxsein ML, Szulc P, Munoz F, et al. Contribution of trochanteric soft tissues to fall force estimates, the factor of risk, and prediction of hip fracture risk. J Bone Miner Res. 2007;22(6):825–831. doi:10.1359/jbmr.070309
24. Gilsanz V, Chalfant J, Mo AO, et al. Reciprocal relations of subcutaneous and visceral fat to bone structure and strength. J Clin Endocrinol Metab. 2009;94(9):3387–3393. doi:10.1210/jc.2008-2422
25. Chang CS, Chang YF, Wang MW, et al. Inverse relationship between central obesity and osteoporosis in osteoporotic drug naive elderly females: the Tianliao Old People (TOP) Study. J Clin Densitom. 2013;16(2):204–211. doi:10.1016/j.jocd.2012.03.008
26. Cherif R, Mahjoub F, Sahli H, et al. Clinical and body composition predictors of bone turnover and mineral content in obese postmenopausal women. Clin Rheumatol. 2019;38(3):739–747. doi:10.1007/s10067-018-4343-4
27. Turcato E, Bosello O, Di Francesco V, et al. Waist circumference and abdominal sagittal diameter as surrogates of body fat distribution in the elderly: their relation with cardiovascular risk factors. Int J Obes Relat Metab Disord. 2000;24(8):1005–1010. doi:10.1038/sj.ijo.0801352
28. Kim M, Shinkai S, Murayama H, et al. Comparison of segmental multifrequency bioelectrical impedance analysis with dual-energy X-ray absorptiometry for the assessment of body composition in a community-dwelling older population. Geriatr Gerontol Int. 2015;15(8):1013–1022. doi:10.1111/ggi.12384
29. Mozaffari H, Daneshzad E, Larijani B, Bellissimo N, Azadbakht L. Dietary intake of fish, n-3 polyunsaturated fatty acids, and risk of inflammatory bowel disease: a systematic review and meta-analysis of observational studies. Eur J Nutr. 2020;59(1):1–17. doi:10.1007/s00394-019-01901-0
30. Rebuffe-Scrive M, Lonnroth P, Marin P, et al. Regional adipose tissue metabolism in men and postmenopausal women. Int J Obes. 1987;11(4):347–355.
31. Frayn KN. Adipose tissue as a buffer for daily lipid flux. Diabetologia. 2002;45(9):1201–1210. doi:10.1007/s00125-002-0873-y
32. Ambrosi TH, Scialdone A, Graja A, et al. Adipocyte Accumulation in the Bone Marrow during Obesity and Aging Impairs Stem Cell-Based Hematopoietic and Bone Regeneration. Cell Stem Cell. 2017;20(6):771–784 e776. doi:10.1016/j.stem.2017.02.009
33. Krotkiewski M, Blohme B, Lindholm N, et al. The effects of adrenal corticosteroids on regional adipocyte size in man. J Clin Endocrinol Metab. 1976;42(1):91–97. doi:10.1210/jcem-42-1-91
34. Kameda T, Mano H, Yuasa T, et al. Estrogen inhibits bone resorption by directly inducing apoptosis of the bone-resorbing osteoclasts. J Exp Med. 1997;186(4):489–495.
35. Oshima K, Nampei A, Matsuda M, et al. Adiponectin increases bone mass by suppressing osteoclast and activating osteoblast. Biochem Biophys Res Commun. 2005;331(2):520–526. doi:10.1016/j.bbrc.2005.03.210
36. Ritland LM, Alekel DL, Matvienko OA, et al. Centrally located body fat is related to appetitive hormones in healthy postmenopausal women. Eur J Endocrinol. 2008;158(6):889–897. doi:10.1530/EJE-07-0836
 © 2022 The Author(s). This work is published and licensed by Dove Medical Press Limited. The full terms of this license are available at https://www.dovepress.com/terms.php and incorporate the Creative Commons Attribution - Non Commercial (unported, v3.0) License.
By accessing the work you hereby accept the Terms. Non-commercial uses of the work are permitted without any further permission from Dove Medical Press Limited, provided the work is properly attributed. For permission for commercial use of this work, please see paragraphs 4.2 and 5 of our Terms.
© 2022 The Author(s). This work is published and licensed by Dove Medical Press Limited. The full terms of this license are available at https://www.dovepress.com/terms.php and incorporate the Creative Commons Attribution - Non Commercial (unported, v3.0) License.
By accessing the work you hereby accept the Terms. Non-commercial uses of the work are permitted without any further permission from Dove Medical Press Limited, provided the work is properly attributed. For permission for commercial use of this work, please see paragraphs 4.2 and 5 of our Terms.