")
Back to Journals » Psychology Research and Behavior Management » Volume 15
The Influence of Industry Leaders’ Behavior on the Decisions of Common Enterprise Leaders in Enterprise Clustering: An Event-Related Potential Study
Authors Zhang W , Jiang P, Tong P, Xu T, Yuan R, Diao L
Received 16 July 2021
Accepted for publication 22 January 2022
Published 9 February 2022 Volume 2022:15 Pages 237—249
DOI https://doi.org/10.2147/PRBM.S329200
Checked for plagiarism Yes
Review by Single anonymous peer review
Peer reviewer comments 4
Editor who approved publication: Dr Igor Elman
Wuke Zhang,1 Pengtao Jiang,2,3 Pengcheng Tong,1 Ting Xu,1 Ruizhi Yuan,3 Liuting Diao1
1Business School, Ningbo University, Ningbo, Zhejiang Province, People’s Republic of China; 2International Affairs Office, NingboTech University, Ningbo, Zhejiang Province, People’s Republic of China; 3Business School, University of Nottingham Ningbo China, Ningbo, Zhejiang Province, People’s Republic of China
Correspondence: Liuting Diao, Business School, Ningbo University, 818 Fenghua Road, Ningbo, 315211, People’s Republic of China, Tel +86 15168164056, Email [email protected]
Purpose: This study aims to explore the influence of industry leaders’ behavior on common enterprise leaders’ decisions in enterprise clustering by recognizing top executives’ cognitive processes of brains.
Methods: Twenty-one real top executives from twelve textile enterprises were recruited in the lab experiment, and decisions about whether entering an industrial zone under two conditions of following an industry leader or a common enterprise were designed as the experiment task. Throughout the formal experimental task, participants’ electroencephalograms were recorded.
Results: The behavioral results preliminarily proved the effect of industry leaders’ behaviors on the real top executives’ decisions in common enterprises: participants had a higher acceptance rate with a shorter reaction time in the condition of following an industry leader rather than that in the condition of following a common enterprise. Event-related potential results indicated that choices of following an industry leader led to a more positive perception of emotional valence (reflected by a smaller P2 amplitude) and better evaluation categorization and greater decision confidence (reflected by a larger late positive potential amplitude) than choices of following a common enterprise.
Conclusion: Top executives from common enterprises tend to evaluate industry leaders’ behaviors better than other common enterprises’ behaviors, and they tend to make a similar business decision to keep their enterprises consistent with these industry leaders.
Keywords: leading effect, business decision, ERPs, P2, LPP
Introduction
People are often strongly influenced by formal and informal leaders’ decisions and tend to follow their behaviors. This leading effect of leaders’ behaviors has been widely found in people’s multiple behaviors and decision-makings, such as new technology acceptance,1 risk behavior intervention,2,3 consumer behavior,4 and so on. Previous studies mainly explored or explained similar phenomena under the framework of social influence theory (SIT).5 Under the framework of SIT, people’s attitudes, behaviors and decisions are significantly influenced by other people’s behaviors and attitudes, especially those important people such as formal and informal leaders.4,5 Therefore, it is reasonable to assume that the leading effect of leaders’ behaviors exists in various domains of human society. However, current studies on the leading effect of leaders’ behaviors mainly focused on people’s daily behaviors and decisions, while the potential leading effect of benchmarking enterprises’ behaviors are normally ignored. To fill this gap, the current study aims to explore this leading effect in business decisions, especially the benchmarking enterprises’ behaviors’ influence on common enterprises’ business decisions.
In business practices, enterprise decision is a complex process that is influenced by various factors, and it is finally made by top-level executives based on abundant relevant information.6 Thus, the present study chooses the decision of top-level executives as an agency of enterprise decision. Meanwhile, since the leaders’ leading effect has been partly observed but has not been empirically examined in the process of enterprise clustering,7 the current study chooses decisions about whether entering an industrial zone (a typical activity of enterprise clustering) under two conditions (ie, a leading or a common enterprise has entered) as the research background.
Decision-making is a complex cognitive process that includes various psychological and neural activities.8 In order to better understand the effect of leading enterprises’ behaviors on the decisions of top-level executives in common enterprises, the technology of event-related potentials (ERPs) is applied in the current study. The technology of ERPs has an advantage in tracking rapid temporal modulations in neural activities, which can offer insights into the cognitive processes on the brain level.9 A considerable amount of studies on Decision Neuroscience have shown its value in exploring the underlying conflict perception, emotional arousal, motivations, stimulus evaluation in decision-making.8,10–12 Thus, it provides foundations for us to conduct a study with ERPs to investigate the influence of industry leaders’ behaviors on common enterprise leaders’ decisions in enterprise clustering by recognizing top executives’ cognitive processes of brains. Moreover, ERPs have various components (eg P2, N200, P300 and LPP) and each component has its specific indication for cognitive process.8,10–12 Based on previous Decision Neuroscience studies, the current study focuses on two ERP components that are closely related to the processing of attention distribution (P2) and evaluative categorization (late positive potential, LPP).
Literature Review and Hypotheses Development
Behavioral Hypothesis
People tend to be strongly influenced by formal and informal leaders’ decisions and be willing to follow their behaviors and adopt their recommendations.1–3 For instance, opinion leaders’ application of a new technology will contribute to the innovation diffusion among their followers and further in general population.1 Meanwhile, similar leading effects of formal and informal leaders have also been found in business fields, such as consumers’ brand attitude and purchase intention.13 To explain this leading effect, scholars have suggested that making a decision of whether to use a new technology or purchase a product or not is accompanied by perceived uncertainty and risk.1,13 More specifically, people may not adopt a new technology or motivate their purchase intention at the very beginning; however, they are more willing to seek out others around them who have already adopted the innovation or purchased the same product. Successful people with higher social status, such as formal and informal leaders, are the ones people are more willing to turn to.14 These people can reduce their perceived uncertainty and risk, and finally result in subsequent adoption and purchase behaviors.15,16
In the business domain, enterprise decisions are often made by top executives based on relevant information.6 Due to the unlimitedness and changeableness of business information and the innate limitation of human’s ability in processing information,17 sometimes top executives may also make similar business decisions by following benchmarking enterprises (ie, industry leaders) in the same industry to reduce decisional uncertainty and improve decisional efficiency.7 Regarding the current study, the abovementioned tendency of following industry leaders generates a possible interesting decision-making pattern when top executives make decisions about whether to introduce their enterprises into an industrial zone or not: if an industry leader has entered a particular industrial zone, top executives of common companies in this industry are likely to believe that entering the same industrial zone is a good choice for their enterprises’ future performance and are more willing to follow. On the contrary, if the entering one is just a common enterprise in the same industry, it is hard for top executives to assure that entering the industrial zone is a good choice. They are likely to perceive more uncertainty and risk, which will lower the entering intention. Based on the above-mentioned discussion, the following hypothesis is thus proposed:
H1: The acceptance rate of entering an industrial zone will be different across conditions of following an industry leader or a common enterprise.
ERP Hypotheses
According to the above-proposed decision-making pattern, there seems to be a process of evaluative categorization about consistency with an industry leader or not. Meanwhile, as different decisional information is related to different levels of positive and negative perception, there is likely to be a process of emotional responses. Therefore, in investigating the neural mechanism of top executives’ decisions about following industry leaders in enterprise clustering, the present study focuses on two ERP components that are closely related to the valence of emotional response to stimuli (P2) and evaluative categorization (LPP).
P2
P2 is a relatively early positive ERP component over frontal regions that with a peak latency from 100 ms to 200 ms.18,19 It presumably reflects the early assessment of stimuli and indicates early rapid automatic activities, often followed by the progressive recruitment of slow, elaborative, and semantic processing under voluntary control.8,20 A considerable number of studies have suggested that the amplitude of P2 is sensitive to the emotional valence of presented stimuli.8,18–20 In more detail, negative or less positive stimuli will induce a greater P2 amplitude than positive ones.21–23 For example, negative framing messages, which highlighted the negative aspects of a product, elicited a larger P2 amplitude compared to positive framing messages.8
Regarding the current study, as people are strongly influenced by formal and informal leaders’ decisions and tend to follow their behaviors,1–3 we have speculated in the Behavioral hypothesis section that top executives are likely to believe that entering a particular industrial zone, where an industry leader has entered, is a good choice for their enterprises’ future performance. Inversely, while it is just a common enterprise in the same industry that has entered, top executives are likely to presume that entering the industrial zone is accompanied by more uncertainty and risk, and will not assure it is a good choice. In other words, a choice to follow an industry leader is perceived to be more positive than a choice to follow a common enterprise in the same industry. As greater P2 amplitudes will be induced by more negative stimuli,21–23 we thus propose the following hypothesis:
H2: The P2 amplitude will be different across conditions of following an industry leader or a common enterprise.
LPP
Late positive potential (LPP) is a late positive-going component that mainly distributes over the central-parietal regions and peaks at approximately 600 ms after the onset of stimuli.24 It is relatively similar with late positive complex (LPC), which is often found in memory judgement tasks25,26 and is also a positive-going ERP component that peaks around 600 ms after stimuli onset with a central posterior topography.25 In the past decade, studies on psychophysiology and neuroscience have consistently found that LPP will be strongly modulated by the emotional intensity of a stimulus.27 In more detail, either positive or negative valence stimuli will elicit a greater LPP amplitude than neutral ones28–30 and the LPP amplitude will also be positively influenced by the emotional arousal of stimuli.31
Recent decision studies have reported that LPP can reflect the cognitive process of evaluative categorization at the late stage of decision-making.8,10,32 Besides, stimuli of higher evaluation categorization are suggested to elicit a greater LPP amplitude than that of lower evaluation categorization.12,32 For example, products and shops’ better reputations that imply better product quality and service could elicit a greater LPP amplitude together with increased purchase intention.11,12 Furthermore, in a previous study on enterprise clustering, scholars also found that herding choices, which hinted better evaluation categorization and higher decision confidence, induced a larger LPP amplitude and increased clustering intention than anticonformity choices.10
Studies have shown that people tend to follow formal and informal leaders’ behaviors and adopt their recommendations,1–3 therefore it is reasonable to presume people evaluate a leader’s choice better than a common one’s choice. In the current study, we assume that a choice of following an industry leader is considered with less uncertainty and risk than a choice of following a common enterprise in the same industry. As increased LPP amplitude is positively related to higher evaluation categorization,12,32 we thus speculate that an industrial zone that an industry leader has entered, rather than one that a common enterprise has entered, will result in a better evaluation, which will be reflected in a greater LPP amplitude. Based on the above discussion, the following hypothesis is thus proposed:
H3: The LPP amplitude will be different across conditions of following an industry leader or a common enterprise.
Materials and Methods
General Experimental Design
A randomized within-subjects repeated measure design was adopted in the current experiment, with the following condition (ie, following an industry leader vs following a common enterprise) as the within-subject factor. For each decision presented in this experiment, participants (ie, top executives from textile enterprises) were asked to decide whether to settle their enterprises in a particular industrial zone where an industry leader or a common enterprise has entered. In order to better simulate the experimental scenario, detailed information about a real textile industrial zone in Ningbo was presented to participants before they started the ERP experiment.
Participants
Twenty-one participants (17 males; 4 females) were recruited to participate in the current study. All of them are top executives from twelve textile enterprises in Ningbo, aged from 22 to 57 years (mean = 37.81 years). Meanwhile, they were right-handed healthy native Chinese speakers with normal or corrected-to-normal vision, and none of them had a history of neurological disorder or mental disease. Each participant signed written informed consent forms before the experiment and was paid 500 Chinese yuan (approximately $73.70) as remuneration after the experiment. Because of excessive artifacts in the electroencephalogram (EEG) recordings, five cases (4 males; 1 female) were discarded. Thus, 16 valid participants (10 males;6 females) were included in the final analysis. The experiment was running under the approval by the Internal Review Board of the Academy of Neuroeconomics and Neuromanagement in Ningbo University.
Stimulus Materials
The experiment materials consisted of 50 stimuli. All of them could be separated equally into two conditions (ie, names of industry leaders vs names of common enterprises in textile industry). Specially, “★★★★★” was displayed under the name of each industry leader to indicate its leader status in industry, while “★★” was displayed under the name of each common textile enterprise to indicate its common status in industry. The selection of industry leaders in textile industry was based on China’s Textile Industry Ranks (2018), which was published by China Cotton Textile Association (http://www.ccta.org.cn). More specifically, top 25 in the above rank were selected as the industry leaders. On the other hand, 25 small and micro textile enterprises were randomly selected from China’s National Enterprise Credit Information Disclosure System (http://www.gsxt.gov.cn) to be the common textile enterprises in the current study.
Each stimulus displayed the enterprise name and five-pointed stars. The name placed above the five-pointed stars, and both of them were placed at the center of the gray background with center-align, 30 fonts, SimSun and font bold. All stimuli were repeated twice, classified into one block of 100 trials. They were presented in a pseudorandom order. The whole experiment was lasting about 6 minutes.
Procedure
At first, participants finished a pre-experiment questionnaire about their background information. Then, they were asked to sit 100 cm away from a 1024×768 pixels’ computer-controlled monitor (with a refresh rate of 60 Hz) in a sound-attenuated room. After that, detailed information (excluding the names of enterprises that had settled) of a real textile industrial zone in Ningbo was offered to them. After a careful reading, participants were informed that they would next browse various names of textile enterprises and their industry statuses (indicated by five or two five-pointed stars), imagining that they were making a decision about whether settle their enterprises into the mentioned industrial zone when an industry leader or a common textile enterprise has settled. In the meantime, participants were also instructed to make their decisions using a wireless keypad.
Figure 1 shows how sequential stimuli were presented within each trial. Each trial began with a 500ms fixation placed at the center of a gray background. After a blank screen for 400–600ms, an enterprise name and stars (which indicated the enterprise’s leading or common status in textile industry) were presented. Participants were asked to press the button to decide whether they would settle their enterprises into the industry zone when that enterprise had already entered. Participants were instructed to press the button “1” if they decided to settle, while press the button “3” if they would not. The name and stars would disappear either after 4000ms or participants pressed the button. Between each trial, an inter-stimulus interval lasted for 500ms.
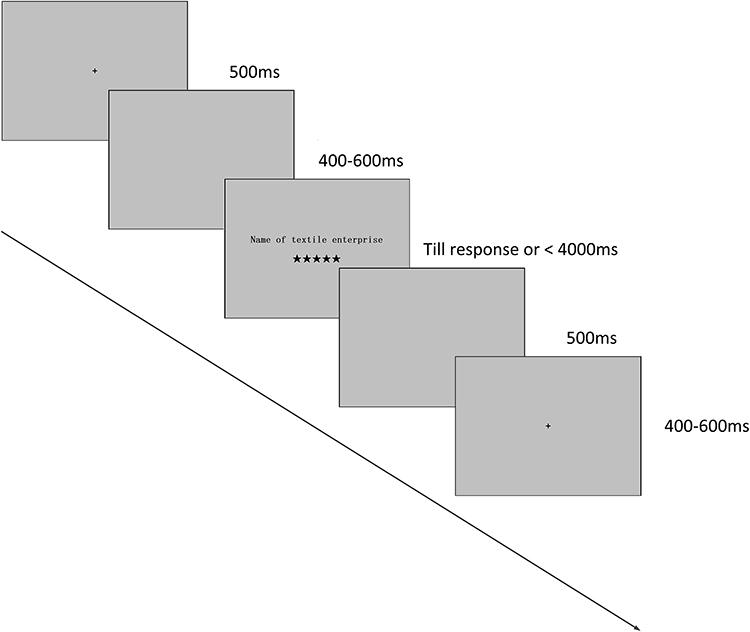 |
Figure 1 Experimental task: participants were instructed to make decisions about whether to enter a textile industrial zone according to different entered companies (ie industry leaders vs common enterprises). |
The stimuli were presented by e-prime 2.0 software together with trigger recording (Psychology Software tools, Pittsburgh, PA, USA). Prior to the formal experiment, there was a practice of four trials for participants to familiarize the task.
Electroencephalogram (EEG) Recording and Analysis
Electrooculograms were recorded using a 64 Ag/AgCl electrodes cap through a Neuroscan Synamp2 Amplifier (Scan 4.3.1, Neurosoft Labs, Inc). The forehead location and the left mastoid were used as the ground and the reference, respectively. Left and right mastoid references were used when data was transferred to average off-line. A pair of electrodes placed above and below the right eye were used to record the vertical EEG, and another pair of electrodes placed on the lateral canthi of both eyes were used to record the horizontal EEG. These four electrodes were all placed 10mm from eyes. Electrooculogram artifacts were corrected off-line. The experiment started when impedances of electrodes were below 5 kΩ.
The epochs used for analyses in this study had a duration of 1000ms, starting 200ms prior to the onset of stimuli of enterprise names and stars and ending 800ms after the onset. The 200ms pre-stimulus sampling period was used for baseline correction. The EEG was corrected using the method proposed by Semlitsch et al.33 If trials had bursts of electromyography activity, peak-to-peak deflection exceeding ±100μV and amplifier clipping, they would be rejected. Low pass filter at 30 Hz (24 dB/Octave) was used to digitally filter the average ERP.
According to previous research and the visual observation of the scalp distribution responding to the grand average waveforms in the current study, the time windows chosen to analyze the P2 and LPP components were 150–200ms and 350–550ms respectively. Meanwhile, nine electrodes (ie F1, Fz, F2, FC1, FCz, FC2, C1, Cz and C2) were chosen for the P2 component analysis, and fifteen electrodes (ie F1, Fz, F2, FC1, FCz, FC2, Cz, C2, CP1, CPz, CP2, P1, Pz, and P2) were chosen for the LPP component analysis. Then, a two (decision condition: following an industry leader vs following a common enterprise) × nine (electrode: F1/z/2, FC1/z/2, and C1/z/2) ANOVA was conducted for the mean amplitude of P2 component, while a two (decision condition: following an industry leader vs following a common enterprise) × fifteen (electrode: F1/z/2, FC1/z/2, C1/z/2, CP1/z/2, P1/z/2) ANOVA was performed for the mean amplitude of the LPP component. To determine significance, Greenhouse-Geisser corrections were used.34 Additionally, partial eta squared (η2p) values were reported to demonstrate the sizes of effects in ANOVA models, where 0.05 represents a small effect, 0.1 represents a medium effect, and 0.2 represents a large effect.35
Results
Behavioral Results
A pairwise t-test was used to analyze response time and acceptance rate, and results can be seen in Figure 2. For response time, there was a significant difference between the condition of following an industry leader and the condition of following a common enterprise [Mleader = 833.071ms, S.E. = 121.036; Mcommon = 956.075ms, S.E. =95.746; t (1, 15) = 2.869, p = 0.012, Cohen’s d = 0.282]. For acceptance rate, there was also a significant difference: participants exhibited a higher acceptance rate in the condition of following an industry leader relative to the condition of following a common enterprise [Mleader = 92.4%, S.E. = 0.148; Mcommon = 19.2%, S.E. = 0.083; t (1, 15) = 7.300, p < 0.001, Cohen’s d = 2.833]. Thus, H1 is supported.
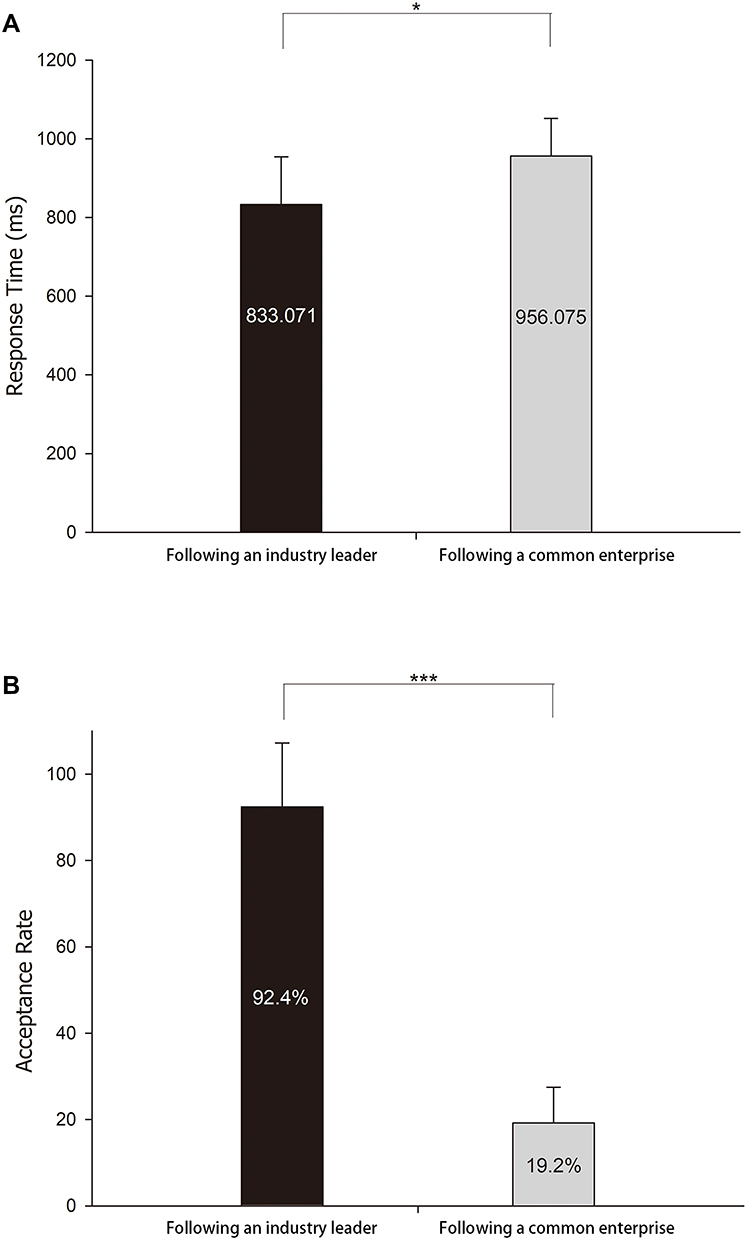 |
Figure 2 Behavioral results of reaction time and acceptance rate: (A) the reaction times in the conditions of following an industry leader and following a common enterprise. (B) The acceptance rates in two conditions (following an industry leader vs following a common enterprise). Note: *p < 0.05, ***p < 0.05. |
ERP Results
P2
The two-way 2 (conditions: following an industry leader or a common enterprise) × 9 (electrodes: F1/z/2, FC1/z/2, and C1/z/2) ANOVA for P2 in the time window from 150ms to 200ms produced a significant main effect for the two conditions [F (1, 15) = 4.699, p = 0.047, η2p = 0.239]. The condition of following an industry leader elicited a smaller P2 mean amplitude compared to the condition of following a common enterprise [Mleader = 0.301 μV, S.E. = 0.508; Mcommon = 1.213 μV, S.E. = 0.653; t (15) = 2.168, p = 0.047, Cohen’s d = 0.369]. These results of P2 support H2.
Meanwhile, three middle-line electrodes (ie Fz, FCz and Cz) were chosen and their neural dynamic activities under two conditions are illustrated in Figure 3A. Meanwhile, the brain topographies are shown in Figure 3B, which showed the main difference between the two conditions in the frontal-to-central region.
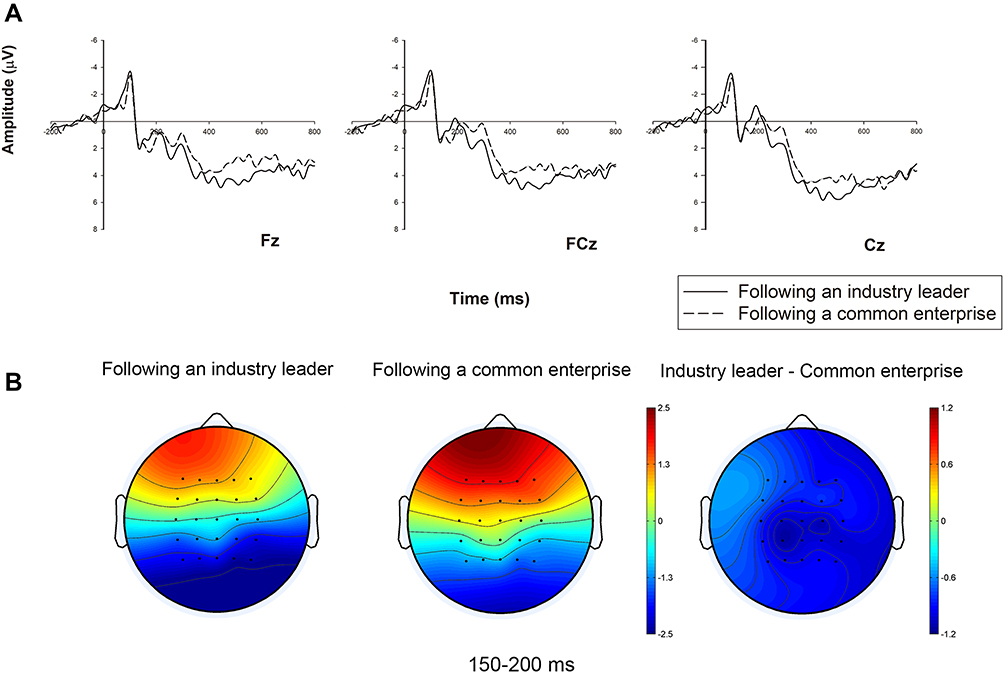 |
Figure 3 Grand-averaged event-related potential (ERP) waveforms of P2 in the frontal-to-central region with three electrodes, and related brain topographies: (A) the P2 amplitude comparison of the two conditions (ie following an industry leader vs following a common enterprise) in representative electrodes (ie Fz, FCz, and Cz). (B) The brain topographies of the two conditions and contrast at the P2 time window of 150–200 ms. |
LPP
The two-way 2 (conditions: following an industry leader or a common enterprise) × 15 (electrodes: F1/z/2, FC1/z/2, C1/z/2, CP1/z/2, P1/z/2) ANOVA for LPP in the time window from 350ms to 550ms produced a significant main effect for the two conditions [F (1, 15) = 5.825, p = 0.029, η2p = 0.280]. The condition of following an industry leader elicited a larger LPP mean amplitude than the condition of following a common enterprise [Mleader = 4.925 μV, S.E. = 1.257; Mcommon = 4.005 μV, S.E. = 1.237; t (15) = 2.414, p = 0.029, Cohen’s d = 0.184]. These results of LPP support H3.
Meanwhile, five representative middle-line electrodes (ie Fz, FCz, Cz, CPz and Pz) were chosen and their neural dynamic activities under the two conditions are illustrated in Figure 4A. Meanwhile, the brain topographies are shown in Figure 4B, which showed the main difference between the two conditions in the central-to-parietal region.
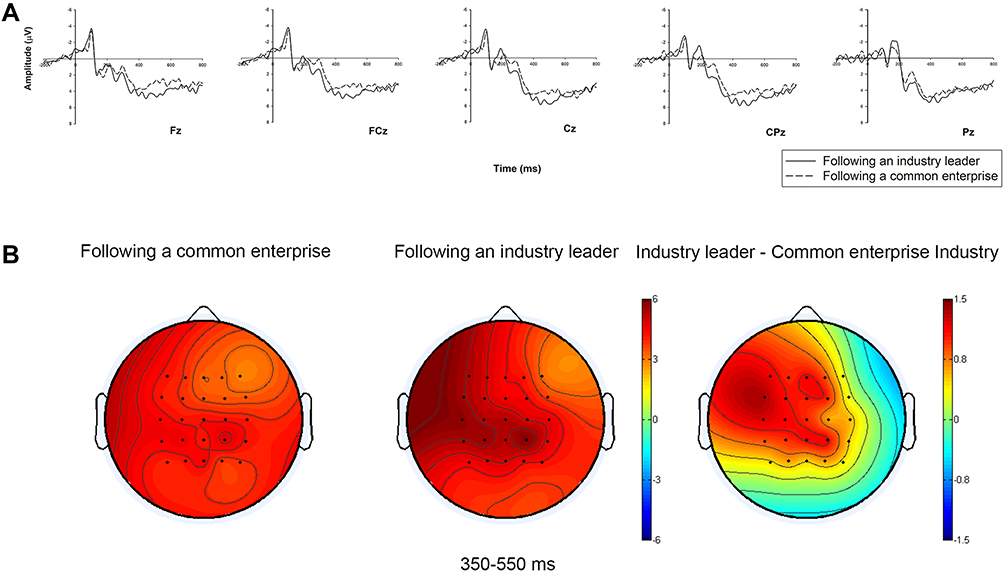 |
Figure 4 Grand-averaged event-related potential (ERP) waveforms of LPP in the frontal-to-parietal region with five electrodes, and related brain topographies: (A) the LPP amplitude comparison of the two conditions (ie following an industry leader vs following a common enterprise) in representative electrodes (ie Fz, FCz, Cz, CPz, and Pz). (B) The brain topographies of the two conditions and contrast at the LPP time window of 350–550 ms. |
Correlation Analysis of Response Time and ERP Components
A Spearman correlation analysis between the reaction time and the mean amplitude of P2 was conducted. The results showed that there was a significant positive correlation (r = 0.451, p = 0.010) between the reaction time and the mean amplitude of P2 in the Cz electrode, as shown in Table 1 and Figure 5A.
 |
Table 1 Correlation Between Reaction Time and the Mean Amplitude of P2/LPP in the Cz |
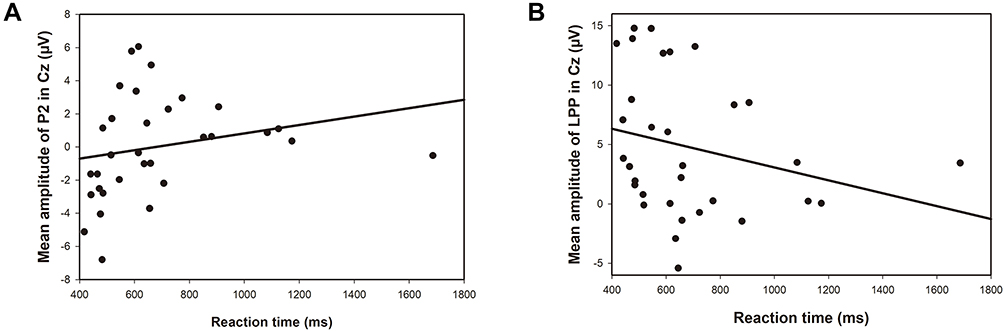 |
Figure 5 Results of Spearman correlations between response time and the mean amplitudes of P2 and LPP on Cz: (A) the Spearman correlation between response time and the P2 amplitude on Cz. (B) The Spearman correlation between response time and the LPP amplitude on Cz. |
We also conducted a Spearman correlation analysis between the reaction time and the mean amplitude of LPP. The results showed that there was a significant negative correlation (r = −0.375, p = 0.034) between the reaction time and the mean amplitude of LPP in the Cz electrode, as shown in Table 1 and Figure 5B.
Discussion
The current study used the decisions on whether entering an industrial zone under two conditions of following an industry leader or a common enterprise as the research context to explore the influence of industry leaders’ behaviors on followers’ decisions in enterprise clustering. Twenty-one top executives from twelve textile enterprises were recruited and the technology of event-related brain potentials (ERPs) was applied in the experiment to better understand the influence of industry leaders’ behaviors on followers’ decisions. The behavioral results showed that top executives from textile enterprises had a higher acceptance rate with a shorter reaction time in the condition of following an industry leader rather than the condition of following a common enterprise. The ERP results showed that a smaller P2 amplitude and a larger LPP amplitude were elicited in the condition of following an industry leader rather than the condition of following a common enterprise. Meanwhile, the mean amplitude of P2 in the Cz electrode was positively related with the reaction time (a Spearman correlation), and the mean amplitude of LPP in the Cz electrode was negatively related with the reaction time (a Spearman correlation).
The behavioral results of the current study preliminarily proved the influence of industry leaders’ behaviors on followers’ decisions in enterprise clustering. Previous studies have consistently suggested that the reaction time is positively related to decision difficulty and cognitive load8,12 and a longer reaction time generally indicates greater decision difficulty and higher cognitive load.36,37 In the current study, the discrepancy in reaction time indicates that top executives from textile enterprises needed more cognitive efforts during decision-making in the condition of following a common enterprise due to the greater decision difficulty, but felt easier to make decisions in the condition of following an industry leader. That means, compared with a choice of following a common enterprise, a choice of following an industry leader is accompanied with less decisional uncertainty and is more fit with participants’ preference. It is possible that the image of an industry leader conveys a more successful story and indicates more trustworthiness in a subtle way, which convinces executives more easily. Compared to a common enterprise, an industry leader is believed to possess competitive resources, timely information, and better capabilities with perspectives, and it is not surprise to see that they can attract followers more easily. Therefore, it is reasonable to see the top executives, as the representatives in the experiment, used less reaction time and exhibited higher accept rate in the condition of following an industry leader because an industry leader had been portrayed as a successful image with trustworthiness.
The ERP results showed that a smaller P2 amplitude was elicited in the condition of following an industry leader rather than the condition of following a common enterprise. Previous studies have consistently found that the amplitude of P2 is sensitive to the emotional valence of presented stimuli8,18,19 and negative or less positive stimuli will induce a greater P2 amplitude than positive ones.21,23 The discrepancy of P2 amplitudes across conditions where a higher P2 amplitude is found in the condition of following a common enterprise compared with a smaller P2 amplitude in the condition of following an industry leader indicated the results that top executives were likely to believe that following a common enterprise is with more uncertainty and risk and following an industry leader into a particular industrial zone seems to be a better and promising choice. Furthermore, this speculation is also verified by the results of Spearman correlation analysis between the mean amplitude of P2 and reaction time which shows there is a significant positive correlation between them. Compared with a choice of following a common enterprise, a choice of following an industry leader was regarded with less uncertainty and was more desirable to participants’ preference, thus participants made business decisions more easily. Therefore, the results of P2 component as well as the Spearman correlation between the P2 amplitude and reaction time show that a choice following an industry leader is tested to be more positive with a smaller P2 amplitude than a choice following a common enterprise with a greater P2 amplitude in the same industry, which further support the inference from previous behavior results that top executives are more willing to follow an industry leader rather than a common enterprise.
During the late cognitive processing stage in the current experiment, a larger LPP amplitude was elicited in the condition of following an industry leader rather than the condition of following a common enterprise. These results can be interpreted based on the differences in evaluative categorization and decisional confidence. Firstly, LPP has been considered to reflect the cognitive process of evaluative categorization at the late stage of decision-making, and a greater LPP amplitude is often related to the stimuli of better evaluation categorization.8,10,12,32 The discrepancy of LPP amplitudes across conditions indicates that participants in the current study evaluated an industrial zone that an industry leader had entered better (with a greater LPP amplitude) than an industrial zone that a common enterprise had entered (with a smaller LPP amplitude). We can infer that industry leaders are evaluated by top executives as a better social categorization with resources, capabilities and information and following an industry leader is evaluated as a more promising choice, which echoes with previous behavioral results that following an industry leader is accepted by more top executives and with less reaction time. Secondly, some studies have argued that the LPP amplitude will be positively related to decisional confidence in a decision task.32,38 Since people tend to follow formal and informal leaders’ behaviors and adopt their recommendations,1–3 participants’ perceived uncertainty and risk should be higher in the condition of following a common enterprise than that in the condition of following an industry leader. In other words, decisional confidence in the industry leader condition should be higher than that in the common enterprise condition, which was reflected by a larger LPP amplitude in the current study. Therefore, with a greater LPP amplitude, participants regarded their choice of following an industry leader was more promising and they were more confident in making this decision, which was also supported by the higher acceptance rate and less reaction time for following an industry leader from behavioral results.
All in all, from the experiment, the behavioral results are consistent with the results of P2 and LPP components from ERP. Participants, the top executives, are more willing to follow an industry leader to enter into an industry zone rather than to follow a common enterprise and they evaluate the choice following an industry leader is more promising with higher confidence.
Implications
Based on the above-mentioned findings and what we have discussed, the current study hopes to provide the following implications. Theoretically, formal and informal leaders’ leading effects exist among various domains of human society, not only in people’s daily behaviors and decisions, but also in business field. Previous studies have consistently found that people’s daily behaviors and decisions are strongly influenced by formal and informal leaders’ decisions and people tend to keep consistent with these formal and informal leaders.1–3 Our study amplifies the context by finding a similar leading effect in enterprise decision, where top executives in common enterprises have a tendency to make similar decisions with benchmarking enterprises in the same industry. Therefore, our empirical study proves the leader’s effects on business decision-making, which widens the context for formal and informal leaders’ leading effects and echo with the widely existence phenomenon for this effect in various domains of human society.
The second implication is for the practical application of the mentioned leading effect. In the practice of industrial clusters in China, attracting small and medium-sized enterprises to enter a new industrial zone remains to be a headache. To address this issue, introducing some benchmarking enterprises in advance could be a useful and feasible way. That is, promoting the agglomeration of small and medium-sized enterprises through the agglomeration of some benchmarking enterprises. In addition, this similar approach could also be applied as the settlement of brands in new malls.
Limitations and Future Research
We cannot deny there are still some limitations of the current study for further efforts. Firstly, although real top executives from enterprises were recruited as participants and detailed information about a real textile industrial zone in Ningbo was offered to them to simulate a real decision environment, a gap between the experimental scene and real decision circumstances cannot be ignored. Thus, it should be careful when generalizing the findings of the current study to the real world. Secondly, due to limited research resources, volunteers were recruited from textile enterprises and the experimental situation was about a real textile industrial zone. This leads to an open question that whether the findings which are specific to top executives of textile enterprises can be generalized to a wider industry or for a general enterprise decision.
According to social influence theory (SIT),5 people’s attitudes, behaviors and decisions are significantly influenced by other people’s behavior and attitudes, especially those important people such as formal and informal leaders.4,5 Previous studies have proved this leading effect in people’s daily behaviors, and our study further finds a similar leading effect on enterprise decision in business field. Based on what we have summarized and tested, an open question can be proposed that whether similar leading effects exist in other fields of human society. For example, whether key opinion leaders’ behaviors will influence people’s voting behavior in election events. More specifically, if formal and/or informal leaders’ attitudes and behaviors are presented in traditional media (eg TV and newspaper) or social media (eg Facebook and Twitter), whether it will affect common voters’ decisions or not, and furthermore, what factors may moderate this effect. Another interesting question can be that whether this leading effect can play a role in influencing people timely and effectively in public emergencies such as the COVID-19 pandemic. These questions and other possible questions about the leading effect of formal and informal leaders are worthy of further exploration and research.
Conclusion
With the method of event-related brain potentials (ERPs), the current study chose decisions about whether entering an industrial zone under two conditions of following an industry leader or a common enterprise as the research context to explore the influence of industry leaders’ behaviors on followers’ decisions in enterprise clustering. The behavioral results preliminarily proved the effect of industry leaders’ behaviors on the real top executives’ decisions in common enterprises: participants had a higher acceptance rate with a shorter reaction time in the condition of following an industry leader rather than in the condition of following a common enterprise. ERP results indicated that choices of following an industry leader led to more positive perception of emotional valence (reflected by a smaller P2 amplitude), and better evaluation categorization and greater decision confidence (reflected by a larger LPP amplitude) than choices of following a common enterprise.
Ethics Approval and Informed Consent
The procedures of this study were reviewed and approved by the Internal Review Board of the Academy of Neuroeconomics and Neuromanagement at Ningbo University. Written informed consent was obtained from each participant. All data collected from the subjects was kept anonymous and confidential to protect the privacy of the study subjects.
Acknowledgments
This work was supported by the Project of Philosophy and Social Science Key Research Base of Zhejiang Province [grant number 20JDZD024]; Zhejiang Provincial Natural Science Foundation of China [grant number LQ20G020010]; National Nature Science Foundation of China [grant number 71942002]; and the Fundamental Research Funds for the Provincial Universities of Zhejiang [grant number SJWY2020001].
Disclosure
The authors declare that there is no competing interest. And this study was conducted in accordance with the Declaration of Helsinki.
References
1. Hao H, Padman R. An empirical study of opinion leader effects on mobile technology implementation by physicians in an American community health system. Health Informatics J. 2018;24(3):323–333. doi:10.1177/1460458216675499
2. Young SD, Konda K, Caceres C, et al. Effect of a community popular opinion leader HIV/STI intervention on stigma in urban, coastal Peru. AIDS Behav. 2011;15(5):930–937. doi:10.1007/s10461-010-9826-5
3. Theall KP, Fleckman J, Jacobs M. Impact of a community popular opinion leader intervention among African American adults in a Southeastern United States community. Aids Educ Prev. 2015;27(3):275–287. doi:10.1521/aeap.2015.27.3.275
4. Xu XY, Li Q, Peng LF, Hsia TL, Huang CJ, Wu JH. The impact of informational incentives and social influence on consumer behavior during Alibaba’s online shopping carnival. Comput Human Behav. 2017;76:245–254. doi:10.1016/j.chb.2017.07.018
5. Kelman HC. Interests, relationships, identities: three central issues for individuals and groups in negotiating their social environment. Ann Rev Psychol. 2006;57:1–26. doi:10.1146/annurev.psych.57.102904.190156
6. Orth UR. Marketing research: an applied orientation. Australas Mark J. 2002;10(2):72–74. doi:10.1016/S1441-3582(02)70151-1
7. Lian YQ. The Analysis of Herd Behavior in Industrial Aggregation. Shanghai: Tongji Univ Press; 2005.
8. Jin J, Zhang W, Chen ML. How consumers are affected by product descriptions in online shopping: event-related potentials evidence of the attribute framing effect. Neurosci Res. 2017;125:21–28. doi:10.1016/j.neures.2017.07.006
9. Ma QG, Feng YD, Xu Q, Bian J, Tang HX. Brain potentials associated with the outcome processing in framing effects. Neurosci Lett. 2012;528(2):110–113. doi:10.1016/j.neulet.2012.09.016
10. Zhang WK, Yang DP, Jin J, Diao LT, Ma QG. The neural basis of herding decisions in enterprise clustering: an event-related potential study. Front Neurosci. 2019;13:9. doi:10.3389/fnins.2019.01175
11. Shen YC, Shan W, Luan J. Influence of aggregated ratings on purchase decisions: an event-related potential study. Eur J Mark. 2018;52(1–2):147–158. doi:10.1108/EJM-12-2016-0871
12. Wang Q, Meng L, Liu M, Wang Q, Ma Q. How do social-based cues influence consumers’ online purchase decisions? An event-related potential study. Electron Commer Res. 2016;16(1):1–26. doi:10.1007/s10660-015-9209-0
13. Winterich KP, Gangwar M, Grewal R. When celebrities count: power distance beliefs and celebrity endorsements. J Mark. 2018;82(3):70–86. doi:10.1509/jm.16.0169
14. Rogers EM. Diffusion of Innovations.
15. Carpenter CR, Sherbino J. How does an “opinion leader” influence my practice? Can J Emerg Med. 2010;12(5):431–434. doi:10.1017/S1481803500012586
16. Ohanian R. ‘The impact of celebrity spokesperson’s perceived image on consumers’ intention to purchase. J Advert Res. 1991;31(1):46–52.
17. Simon HA. Rational choice and the structure of the environment. Psychol Rev. 1956;63(2):129–138. doi:10.1037/h0042769
18. Paulmann S, Kotz SA. Early emotional prosody perception based on different speaker voices. Neuroreport. 2008;19(2):209–213. doi:10.1097/WNR.0b013e3282f454db
19. Lai VT, Huettig F. When prediction is fulfilled: insight from emotion processing. Neuropsychologia. 2016;85:110–117. doi:10.1016/j.neuropsychologia.2016.03.014
20. Ma Q, Wang C, Wang X. Two-stage categorization in brand extension evaluation: electrophysiological time course evidence. PLoS One. 2014;9(12):e114150. doi:10.1371/journal.pone.0114150
21. Carretié L, Mercado F, Tapia M, Hinojosa JA. Emotion, attention, and the ‘negativity bias’, studied through event-related potentials. Int J Psychophysiol. 2001;41(1):75–85. doi:10.1016/S0167-8760(00)00195-1
22. Huang Y-X, Luo Y-J. Temporal course of emotional negativity bias: an ERP study. Neurosci Lett. 2006;398(1):91–96. doi:10.1016/j.neulet.2005.12.074
23. Wang X, Huang Y, Ma Q, Li N. Event-related potential P2 correlates of implicit aesthetic experience. Neuroreport. 2012;23(14):862–866. doi:10.1097/WNR.0b013e3283587161
24. Herring DR, Taylor JH, White KR, Crites SL. Electrophysiological responses to evaluative priming: the LPP is sensitive to incongruity. Emotion. 2011;11(4):794. doi:10.1037/a0022804
25. Yang H, Laforge G, Stojanoski B, Nichols ES, McRae K, Kohler S. Late positive complex in event-related potentials tracks memory signals when they are decision relevant. Sci Rep. 2019;9:1–5.
26. Woodruff CC, Hayama HR, Rugg MD. Electrophysiological dissociation of the neural correlates of recollection and familiarity. Brain Res. 2006;1100:125–135. doi:10.1016/j.brainres.2006.05.019
27. Brown SBRE, van Steenbergen H, Band GPH, de Rover M, Nieuwenhuis S. Functional significance of the emotion-related late positive potential. Front Hum Neurosci. 2012;6. doi:10.3389/fnhum.2012.00033
28. Cuthbert BN, Schupp HT, Bradley MM, Birbaumer N, Lang PJ. Brain potentials in affective picture processing: covariation with autonomic arousal and affective report. Biol Psychol. 2000;52(2):95–111. doi:10.1016/S0301-0511(99)00044-7
29. Keil A, Bradley MM, Hauk O, Rockstroh B, Elbert T, Lang PJ. Large-scale neural correlates of affective picture processing. Psychophysiology. 2002;39(5):641–649. doi:10.1111/1469-8986.3950641
30. Hajcak G, MacNamara A, Olvet DM. Event-related potentials, emotion, and emotion regulation: an integrative review. Dev Neuropsychol. 2010;35(2):129–155. doi:10.1080/87565640903526504
31. Weinberg A, Hajcak G. Beyond good and evil: the time-course of neural activity elicited by specific picture content. Emotion. 2010;10(6):767–782. doi:10.1037/a0020242
32. Chen M, Ma Q, Li M, Lai H, Wang X, Shu L. Cognitive and emotional conflicts of counter-conformity choice in purchasing books online: an event-related potentials study. Biol Psychol. 2010;85(3):437–445. doi:10.1016/j.biopsycho.2010.09.006
33. Semlitsch HV, Anderer P, Schuster P, Presslich O. A solution for reliable and valid reduction of ocular artifacts, applied to the P300 ERP. Psychophysiology. 1986;23(6):695–703. doi:10.1111/j.1469-8986.1986.tb00696.x
34. Greenhouse SW, Geisser S. On methods in the analysis of profile data. Psychometrika. 1959;24(2):95–112. doi:10.1007/BF02289823
35. Cohen J. Statistical power analysis for the behavioral sciences. J Am Stat Assoc. 1988;2nd(4):19–74.
36. Cheng FF, Wu CS, Lin HH. Reducing the influence of framing on internet consumers’ decisions: the role of elaboration. Comput Human Behav. 2014;37:56–63. doi:10.1016/j.chb.2014.04.015
37. Cowen L, Ball LJ, Delin J. An eye movement analysis of web page usability. In: People and Computers XVI-Memorable Yet Invisible. Springer; 2002:317–335.
38. Finnigan S, Humphreys MS, Dennis S, Geffen G. ERP ‘old/new’effects: memory strength and decisional factor (s). Neuropsychologia. 2002;40(13):2288–2304. doi:10.1016/S0028-3932(02)00113-6
 © 2022 The Author(s). This work is published and licensed by Dove Medical Press Limited. The full terms of this license are available at https://www.dovepress.com/terms.php and incorporate the Creative Commons Attribution - Non Commercial (unported, v3.0) License.
By accessing the work you hereby accept the Terms. Non-commercial uses of the work are permitted without any further permission from Dove Medical Press Limited, provided the work is properly attributed. For permission for commercial use of this work, please see paragraphs 4.2 and 5 of our Terms.
© 2022 The Author(s). This work is published and licensed by Dove Medical Press Limited. The full terms of this license are available at https://www.dovepress.com/terms.php and incorporate the Creative Commons Attribution - Non Commercial (unported, v3.0) License.
By accessing the work you hereby accept the Terms. Non-commercial uses of the work are permitted without any further permission from Dove Medical Press Limited, provided the work is properly attributed. For permission for commercial use of this work, please see paragraphs 4.2 and 5 of our Terms.