")
Back to Journals » Journal of Inflammation Research » Volume 15
The Infiltration of Neutrophil Granulocytes Due to Loss of PTEN Was Associated with Poor Response to Immunotherapy in Renal Cell Carcinoma
Authors Wu F , Chen J, Yao K, Fan D, Wang M, Liu Y, Xin S , Sun Z, Li S, Sun Y, Liu Q
Received 15 September 2022
Accepted for publication 26 November 2022
Published 6 December 2022 Volume 2022:15 Pages 6553—6567
DOI https://doi.org/10.2147/JIR.S388990
Checked for plagiarism Yes
Review by Single anonymous peer review
Peer reviewer comments 2
Editor who approved publication: Professor Ning Quan
Fei Wu,1– 3,* Jie Chen,4,* Kang Yao,1 Daming Fan,5 Minglei Wang,2 Yongjun Liu,1 Shouhu Xin,1 Zeqiang Sun,1 Shun Li,1 Yang Sun,6 Qingyong Liu1
1Department of Urology, the First Affiliated Hospital of Shandong First Medical University, Shandong First Medical University and Shandong Academy of Medical Sciences, Jinan, 250014, People’s Republic of China; 2Shandong Provincial Key Laboratory of Radiation Oncology, Shandong Cancer Hospital and Institute, Shandong First Medical University and Shandong Academy of Medical Sciences, Jinan, 250117, People’s Republic of China; 3Department of Urology, Shandong Provincial Hospital, Shandong First Medical University, Jinan, 250021, People’s Republic of China; 4Department of Urology, Jinan Central Hospital, Cheeloo College of Medicine, Shandong University, Jinan, 250013, People’s Republic of China; 5Department of Pathology, Jinan Central Hospital, Cheeloo College of Medicine, Shandong University, Jinan, 250013, People’s Republic of China; 6Department of Dermatology, Qilu Hospital, Cheeloo College of Medicine, Shandong University, Jinan, 250012, People’s Republic of China
*These authors contributed equally to this work
Correspondence: Yang Sun; Qingyong Liu, Email [email protected]; [email protected]
Introduction: A primary impediment to the efficacy of immune checkpoint inhibitors is the lack of biomarkers for therapeutic responses and prognosis. Although patients with clear cell renal cell carcinoma (ccRCC) could be precisely selected for targeted therapy based on somatic mutations, it remains controversial to choose the suitable patients with a high response rate to immune checkpoint inhibitors (ICIs). The immune-dependent roles of tumor suppressor PTEN in the formation of tumor immune microenvironment remain elusive.
Methods: We comprehensively analyzed the genomic and transcriptomic data from multiple ccRCC datasets, including bulk-RNA sequencing and single-cell RNA sequencing data. In vitro, immunoblotting, qRT-PCR, and RNA sequencing were conducted in ccRCC cell lines upon PTEN depletion. Gene ontology and gene set enrichment analysis were performed to screen the critical pathway and molecules in response to PTEN deletion. Immunohistochemistry staining and further bioinformatic analysis were used to validate our data.
Results: Based on multi-omics analysis of public datasets of renal cancer, the frequently mutated or deleted PTEN was found to be correlated with a suppressive tumor immune microenvironment in ccRCC. Furthermore, we depleted PTEN via CRISPR-Cas9 in Caki-1 cells, which led to the upregulation of multiple neutrophil chemokines, particularly CXCL1, CXCL2, CXCL5, CXCL6, and CXCL8. The roles of neutrophil chemokines and neutrophil markers were further validated and investigated for the association with prognosis in vitro, clinical samples, and the publicly available databases. The expression of CXCL1, CXCL8, and neutrophil markers, S100A9 and BCL2A1, were significantly associated with a poor immunotherapy-related prognosis in public dataset of renal cancer patients receiving ICIs treatment.
Conclusion: These results add a new layer to understanding the association between PTEN status and the role of neutrophil infiltration in ccRCC. Moreover, our findings propose low expression of PTEN as candidate factor of resistance to anti-PD-1-based immunotherapy in ccRCC.
Keywords: PTEN, kidney cancer, CXCL1, renal cancer, prognosis
Introduction
The incidence of kidney cancer represents the sixth cancer in males and tenth in females, accounting for 5% and 3% of all malignancies in human.1 The clinical management of kidney cancer has dramatically changed over the past two decades. To date, beyond surgical resection, including radical nephrectomy, systemic therapy for clear cell renal cell carcinoma (ccRCC), the most common histologic subtype of kidney cancer, has expanded with the approval of new tyrosine-kinase inhibitors (TKIs), inhibitors of mTOR signaling, and immune-checkpoint inhibitors (ICIs).2 Notably, the development of ICIs targeting the programmed death-1/programmed death ligand 1 (PD-1/PD-L1) pathways has the potential to enable long-term survival in patients with kidney cancer, where anti-PD-1-based therapies are now standard-of-care options in both the first-line and second-line strategies.3 However, the remarkable response to immunotherapy varies across patients with advanced ccRCC.3 Thus, screening out potentially immunotherapy-responsive patients based on molecular features is critical.
Patients with ccRCC frequently possess characteristic loss of chromosome arm 3p (encoding VHL) and mutations of histone methyltransferase genes (including SETD2 and MLL3) and PI3K-AKT-mTOR pathway genes (including PTEN, MTOR, and PIK3CA).4 Notably, the PI3K-AKT-mTOR regulates multiple aspects of ccRCC, including cell proliferation, angiogenesis, proliferation, metabolism, and migration. Targeting the mTOR signaling pathway with small molecular inhibitors is a promising and essential strategy for ccRCC.5 In addition, among all these frequently mutated genes, VHL and PTEN are the most potent tumor suppressors, where the loss of PTEN significantly activates the PI3K–AKT–mTOR signaling. In glioblastoma, PTEN mutations were associated with an immunosuppressive microenvironment in patients with poor response to ICIs.6 Nevertheless, the mechanism of how PTEN mutations in tumor cells alter the immune microenvironment and affect the response to ICIs remains elusive.
The tumor microenvironment plays critical roles in carcinogenesis, pathophysiology, and therapy.7 Emerging evidence indicated that neutrophils, the most dominant immune cells in the blood of a human, play vital and multiple roles in cancer.8 Neutrophils with CXCR2 expression can be attracted to tumor tissues via chemokine CXCL1, CXCL2, CXCL5, and cytokine CXCL8.9 It is well acknowledged that persistent neutrophil infiltration is a hallmark of chronic inflammation and contributes to tissue damage. In addition to the context of inflammation and tumor initiation, neutrophils can also facilitate tumor progression by suppressing the function of the T cell function in the tumor microenvironment.10 Controversially, many studies also suggested the anti-tumor effects of infiltrating neutrophils through direct cytotoxicity, secretion of proteases, nitric oxide, reactive oxygen species, and modulation of other immune cells.11–13 More importantly, neutrophil chemokines secreted by ccRCC were reported to build a barrier for preventing lung metastasis.14 Nevertheless, the regulation of neutrophil infiltration in ccRCC and its role in the prognosis and immune therapy are still unclear.
Above all, to precisely select patients with responses to ICIs, it is crucial to illustrate the molecular links between genomic features and the immune microenvironment in ccRCC. In this study, we comprehensively integrate the single-cell RNA sequencing (sc-RNA-seq) data, bulk-RNA sequencing data, and genomic information of ccRCC. The frequently mutated tumor suppressor PTEN was found to be correlated with a suppressive tumor immune microenvironment. Depletion of PTEN in vitro dramatically increased the expression of multiple neutrophil chemokines, which were further confirmed in vitro, clinical samples, and publicly available databases. In keeping with that, the expression of neutrophil markers in ccRCC, validated by sc-RNA-seq, was significantly associated with a poor prognosis and response to the ICIs. In conclusion, our study provides insight into the association between genomic alternation and neutrophil infiltration, which indicated a poor prognosis and therapeutic response of ICIs in ccRCC. Molecular targeting of the PI3K-AKT-mTOR signaling pathway could synergistically affect ccRCC patients with PTEN mutation.
Materials and Methods
Cell Culture and Reagents
Cell lines were obtained from American Type Culture Collection and detected for mycoplasma contamination. Human renal cell carcinoma cell line (Caki-1) was cultured in McCoy’s 5A medium (Gibco, 16600082) containing 10% fetal bovine serum (FBS, 10100147, Gibco, Rockville, Maryland, United States), 100 unit/mL penicillin, and 100 mg/mL streptomycin. Cells were incubated in a humidified incubator with 5% CO2 at 37°C.
Plasmids Constructs
According to the gene sequence of human PTEN (NM_000314), the sgRNA target sequences were designed (#1: 5’-CTACCTGTTAAAGAATCATC-3’; #2:5’- AACTTGTCTTCCCGTCGTGT-3’; #3: 5’AATCCAGATGATTCTTTAAC-3’), synthesized and purified by PAGE. The single-stranded DNA oligo was cloned into the Lenti-CAS9-sgRNA-tag vector (puromycin GV392). The correct plasmids after ligation were transformed with Top10 competent cells, and positive clones were obtained by PCR and sequenced to obtain an overexpression lentiviral plasmid expressing sgRNA with the correct sequence.
Retroviral Transduction
To generate renal cancer cells with stable depletion of indicated genes, lentiviral sgRNA packaging and infection of cell lines were performed according to the protocol described previously.15 In brief, lentiviral constructs were co-transfected with the pCMVdR8.91 (Delta 8.9) plasmid containing gag, pol, and rev genes and the VSV-G envelope-expressing plasmid into 293T cells. Transfection with jetPRIME (101000046, Polyplus Transfection, Illkirch, France) was performed based on the manufacturer’s instructions. The supernatant was harvested and filtered with a 0.45 mm syringe filter post-transfection at 48 hours and 72 hours. The medium containing virus was used for infecting ccRCC cell lines in the presence of Polybrene (4 mg/mL). Infected cells were selected using 2 μg/mL puromycin dihydrochloride hydrate (A610593-0025, Sangon Biotech, Shanghai, China) for three days.
The High Throughput RNA Sequencing
Total RNA was extracted from control CAKI cells infected with or without the indicated lentiviral sgRNA vectors against PTEN using the RNeasy Mini Kit (74106, Qiagen, Hilden, Germany). The library was constructed from 300 to 500 ng of total RNA according to the manufacturer’s instructions of Illumina’s TruSeq Stranded Total RNA kit. Then the libraries were loaded onto Illumina HiSeq 3000 (Illumina, San Diego, CA, United States) for 2×75 base pair paired-end read sequencing. The raw data were generated using bcl2fastq software for subsequent downstream analysis. Quality confirmed RNA-Seq reads from each library were aligned and mapped with HISAT2. FeatureCounts was employed for gene-level abundance estimation. The RNA-seq data generated by this article are available in the NCBI Sequence Read Archive repository with the following SRA accession number: PRJNA874209.
Reverse Transcription and qRT-PCR
RNA was extracted using QIAGEN RNeasy mini kit, according to the manufacturer’s instructions (74104, Qiagen). For each sample, 1 μg total RNA was reverse transcribed using the iScrip Reverse Transcription Supermix (1708841, Bio‑Rad Laboratories, Richmond, CA, USA). The generated cDNA template was mixed with primers for CXCL1, CXCL1, CXCL5, CXCL6, CXCL8, MT2A, RSPO3, AGFG2, ABCB1, ALDH1A1, GAPDH (Supplementary Table S1), as well as ChamQ Universal SYBR qPCR Master Mix (Q711, Vazyme, Nanjing, China), and the real‑time RT‑PCR reaction was conducted with the qTOWER3 Real‑Time PCR Detection System (Analytikjena, Jena, Germany). Data quantitation was performed using the comparative CT (ΔΔCT) method, with GAPDH gene expression as an endogenous reference.
Immunoblotting Analysis
Renal cancer cells were lysed in EBC buffer (50 mM Tris pH 7.5, 120 mM NaCl, 0.5% NP40) supplemented with phenylmethylsulfonyl fluoride (PMSF) (Sigma, Taufkirchen, Germany) and protease inhibitors (Complete Mini, Roche Biochemicals, IN, United States). The cell lysates were centrifuged at 12,000 g for 10 min at 4°C. The protein concentrations were measured with the Bradford Protein Assay Kit (Beyotime, Shanghai, China). According to the manufacturer’s instructions, protein lysis was resolved by SDS-PAGE and immunoblotted with indicated antibodies. The antibodies used in the immunoblot assay are listed as follows: rabbit monoclonal antibody against PTEN (1:2000 dilution, #9188, Cell Signaling Technology, Beverly, MA, United States); mouse monoclonal antibody against VHL (1:2000 dilution, ab140989, Abcam, Cambridge, MA, United States); rabbit monoclonal antibody against GAPDH (1:5000 dilution, #2118, Cell Signaling Technology).
Tissue Microarray Analysis
A tissue microarray (TMA) containing kidney tumor tissues from 159 ccRCC patients was provided by the Department of Pathology, The First Affiliated Hospital of Shandong First Medical University. In brief, from each corresponding paraffin block, two 2.0-mm cores were made. All the samples collected prior to targeted therapy or immunotherapy were stained with antibodies against CXCL1 (1:400 dilution, #12335-1-AP, Proteintech, United States) and S100A9 (1:400 dilution, #26992-1-AP, Proteintech, United States). The protocol for immunohistochemistry (IHC) staining was described as previously.16 Briefly, the universal secondary protocol and the 3,3’-Diaminobenzidine (DAB, ZLI-9019, ZSGB-Bio, Beijing, China) were used to amplify the signaling. Next, to quantify the IHC staining, the numerical value for overall intensity (Score A) is based on a 4-point system: 0, 1, 2, and 3 (for none, weak, medium, or strong staining). A 5-point system determines the numerical value for staining proportion (Score B): no stain = 0; ≤25% cells stained = 1; 25–50% cells stained = 2, 50–75% cells stained = 3; all cells stained = 4. Multiply of scores A and B give the total score (IHC score). All cores in the TMA were scored twice by two independent investigators. Furthermore, the slides were discussed together before a final score was made.
Datasets Used for Analysis
We collected datasets from six independent studies in the Gene Expression Omnibus (GEO) database (https://www.ncbi.nlm.nih.gov/geo/), The Cancer Genome Atlas (TCGA) program (https://gdc.cancer.gov/), and Genotype-Tissue Expression (GTEx) project (https://gtexportal.org/home/). The expression profile of mRNA in cell lines derived from renal tissues was obtained from the Omics data from the Cancer Cell Line Encyclopedia (CCLE, https://depmap.org/portal/download/). Two single-cell RNA sequencing (scRNA-seq) studies (GSE152938, GSEGSE171306) on renal cancer were obtained from the GEO database.17,18 The scRNA-seq data of normal kidneys were obtained from the Tabula Sapiens Single-Cell Dataset.19 The RNA profiles of Checkmate-009, Checkmate −010, and Checkmate-025 were obtained from the Tumor Immune Dysfunction and Exclusion (TIDE) database (http://tide.dfci.harvard.edu/).20 The batch effects normalized mRNA data of pan-cancer atlas (n = 11,060) were downloaded from XENA (https://xenabrowser.net/), which were handled by the “RSEM” pipeline and log2 transformed. Ethical approval was waived by the institutional ethics committee because data are obtained from public databases, and all the patients are de-identified.
Analysis of Single-Cell RNA Sequencing Data
Three independent studies (GSE152938, GSEGSE171306, and the Tabula Sapiens Single-Cell Dataset) of single-cell transcriptome profiles were integrated by the Seurat R package (http://satijalab.org/seurat/). The standard Seurat workflow was performed with the pooled scRNA-seq data from 10X Genomics using the R software (version 4.1.3) package Seurat (version 4.2.1).21 Briefly, quality control before analysis on each case was performed on “nFeature_RNA”, “nCount_RNA”, “percent_mt”, “percent_ribo”, and “percent_hb” in each cell. Samples with less than 3 cells and/or less than 300 detected genes per cell, as well as percent_mito < 5, percent_ribo > 3 and percent_hb < 0.1, were excluded from further analysis. Doublets were identified and filtered by R package DoubletFinder(v3), with 4% doublets expected.22 Integration anchors were identified in the list of samples using the Canonical Correlation Analysis (CCA) method to integrate multiple samples.23 For clustering, principal component analysis (PCA), T-distributed Stochastic Neighbor Embedding (t-SNE), and Uniform Manifold Approximation and Projection (UMAP) were performed for dimension reduction. Furthermore, marker genes of each respective cluster were identified by the function of ‘FindAllMarkers’ and the package of ‘SingleR’ previous to manual annotation.24
Analysis of Differentially Expressed Genes
The mRNA expression profile from four bulk-RNA sequencing studies (TCGA-KIRC) was included to analyze differentially expressed genes (DEGs). The open-source Limma R package was used for analysis, linear models, and differential expression of the indicated dataset.25 An empirical Bayesian method was conducted to estimate the fold change between the PTEN-low group and the PTEN-high group identified by the mRNA expression levels of PTEN. The adjusted P-value for multiple testing was calculated using the Benjamini–Hochberg correction. The genes with an absolute log2 fold change more remarkable than two were identified as DEGs between the two groups. Gene Ontology (GO) and Gene Set Enrichment Analysis (GSEA) were conducted with the DEGs using the R package ClusterProfiler (v4.0) and visualized by GseaVis (https://github.com/junjunlab/GseaVis).26
Copy Number Variation and Mutation Burden
All available somatic mutation data were downloaded from the TCGA database in the form of TCGA project mutation annotation files (MAF format). The mutations outside coding regions and silent mutations were filtered out to obtain nonsynonymous counts. Variant numbers and types in each case were calculated, analyzed, and visualized using the MAF files from the TCGA website via the R package maftools.27
Statistics
All data were analyzed using GraphPad Prism software (version 9.0.0, San Diego, CA, United States). Data were shown as means ± SD (Error bars represent standard deviation). Student’s t-test determined the significance levels for comparison between samples with only two groups. One-way ANOVAs followed by Fisher’s least significant difference was applied to test the differences between multiple groups for continuous variables. All images are representative of results from three independent experiments unless otherwise stated. P > 0.05 was considered not significant(ns). The statistical significance computed by the Wilcoxon rank-sum test or t-test is annotated by the number of stars (*P < 0.05, **P < 0.01, ***P < 0.001).
Results
The Cellular Constitution and Communications in Renal Cell Carcinoma
Since the outcome of systematic therapy, especially the anti-PD1-based immunotherapeutic strategies, largely depends on the tumor immune microenvironment, we comprehensively explored the constitution of renal cell carcinoma with scRNA-seq data (Figure 1A). In keeping with previous findings, the myeloid immune cells, including macrophages and myeloid-derived suppressor cell (MDSC) increased in ccRCC compared with normal kidney tissues (Figure 1B and C). Lymphoid immune cells, particularly CD8+T and CD4+T cells, also increased in infiltration in cancer (Figure 1B and C). Significantly, the epithelial cells could be divided into four clusters according to the transcriptomic space (Figure 1A and B). As MDSC, type 2 macrophages (M2), and Tregs play a pivotal role in the immunosuppressive environment, we next explore the interaction between the epithelial clusters and the primary immunosuppressive cells. Compared with the normal kidney, the interaction numbers between epithelial and MDSC and M2 significantly increased in ccRCC (Figure 1D).
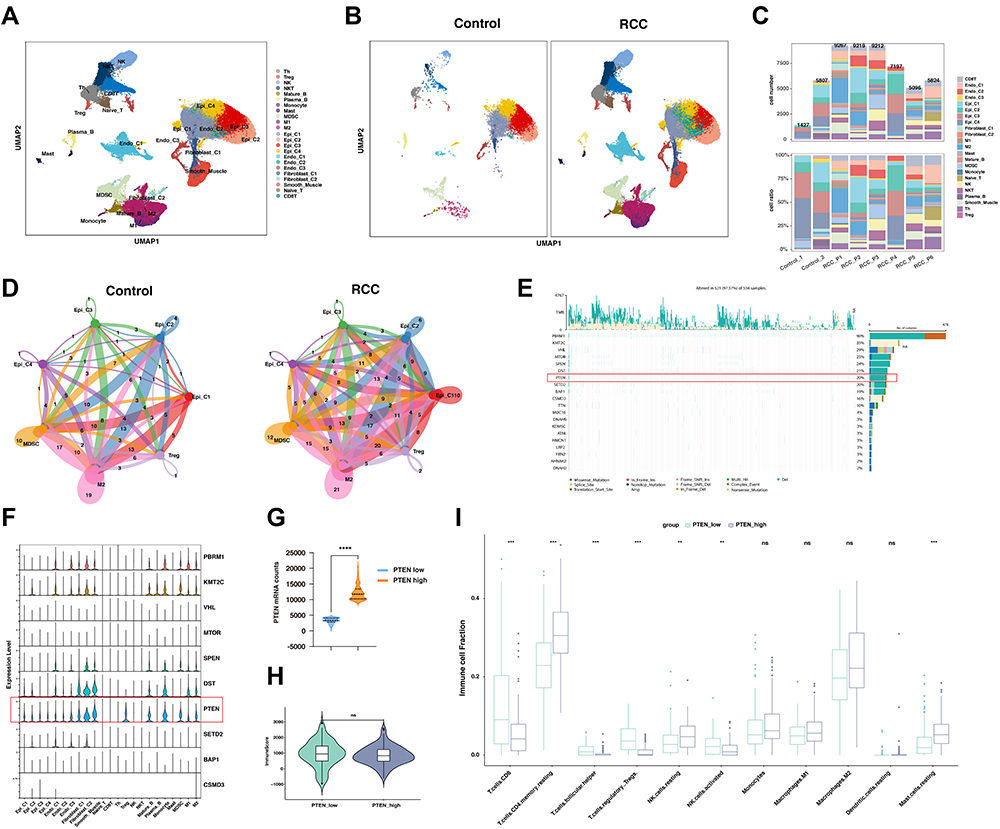 |
Figure 1 PTEN was correlated with anti-tumor immune microenvironment based on the single-cell and bulk RNA sequencing analysis. (A) Uniform Manifold Approximation and Projection (UMAP) embedding of jointly analyzed single-cell transcriptomes from renal cell cancers and normal kidney. (B) UMAP splitted by malignant type embedding of jointly analyzed single-cell transcriptomes from clear cell renal cell cancers (ccRCC) and normal kidney. (C) Cell proportion in each sample in human kidney, including normal kidney and renal cancer. (D) Network view of the number of secreting signals among selected cell types in the control group and RCC groups. The amount of ligand-receptor interaction pairs was labeled and in accordance with the stroke width. (E) Oncoplot displaying the somatic mutation landscape of top 20 genes in the renal cancer cohort from TCGA. The Oncoplot provided an overview of somatic mutations in particular genes (rows) affecting individual samples (columns). Genes are ordered by their mutation frequency. (F) Expression of the top 10 most frequently mutated genes among different subtypes of cells types in kidney, visualized in violin plot. (G) The mRNA expression of PTEN was compared between the PTEN low and high groups in the dataset of ccRCC from the TCGA-KIRC datasets. (H) Box plot analysis exhibiting distinct scores of immune infiltration in ccRCC at different PTEN expression levels (PTEN _low and PTEN _high). (I) Box plot analysis exhibiting distinct infiltration of immune cells subpopulation in ccRCC at different PTEN expression levels (PTEN _low and PTEN _high). Abbreviations: ns, not significant. Notes: **: P < 0.01; ***: P < 0.001; ****: P < 0.0001. |
The Association of PTEN Expression and the Tumor Immune Microenvironment
To explore the potential links between genomic alternation and the tumor immune microenvironment, we first explore the mRNA expression of top-ranked mutated genes in ccRCC. Here, in the ccRCC cohort of TCGA, we found that the top 20 mutated genes could be classified into several pathways (Figure 1E). Notably, PTEN, mTOR, and PIK3CA, key regulators in the PI3K-AKT-mTOR pathway, were frequently mutated in ccRCC (Figure 1E). Notably, genomic alterations of PTEN frequently occurred in ccRCC including mutation, deletion, or gain of copy number (Figure 1E, Supplementary Figure 1A). To further verify its expression in cancer cells, the scRNA-seq analysis found that the expression of PTEN, but not other frequently mutated genes, could be detected in both epithelial cells, mesenchymal cells and immune cells in ccRCC (Figure 1F). In addition, the deletion or mutation of PTEN leads to a significant decrease of mRNA expression in ccRCC (Supplementary Figure 1B and C). Next, we sought to understand whether the expression of PTEN was associated with immune states in ccRCC. The patients in ccRCC cohort of TCGA were classified into PTEN low and PTEN high groups, according to the mRNA expression of PTEN (Figure 1G, Supplementary Table S2). However, the overall immune scores between the two groups were not significantly different (Figure 1H). Nevertheless, the infiltration of CD8+T cells, follicular CD4+T cells, Tregs, NK cells, and mast cells were significantly altered in between the indicated groups (Figure 1I). Gene ontology enrichment analysis indicated that the humoral immune response was the most significantly enriched signaling pathway. Overall, these analyses suggested that the expression levels of PTEN were associated with the tumor immune microenvironment in ccRCC.
Depletion of PTEN Leads to the Upregulation of CXC Chemokines
It should be noted that the expression levels of PTEN could be covered up by mesenchymal cells or immune cells in the bulk RNA sequencing dataset. In that case, to further explore the immune regulator role of PTEN in PTEN mutated cells, we depleted PTEN with specific sgRNAs in the PTEN wildtype Caki-1 cell lines, which had relatively high levels of PTEN expression at mRNA and protein levels among all kidney cell lines (Supplementary Figure 1D–G). Then the RNA in Caki-1 cells infected with sgRNA targeting Control or PTEN was sequenced, followed by bioinformatic analysis (Figure 2A). As a potent tumor suppressor in human cells, the genomic depletion of PTEN leads to significant alternation of transcriptomic profile (Figure 2A and B). Volcano plot of differential expression genes after PTEN depletion indicated that CXC chemokines, including CXCL5, CXCL6, and CXCL8, were significantly increased (Figure 2B). Moreover, when the expression levels of differential genes were taken into consideration, CXCL1, CXCL6, CXCL5, CXCL8, and MT2A were the top 5 most significantly increased genes upon PTEN depletion (Figure 2C). Gene ontology enrichment analysis indicated that the Class 1 MHC-mediated antigen processing and presentation was one of the most significantly enriched signaling pathways (Figure 2D and E). In keeping with previous findings, depletion of PTEN leads to activation in ribosome biogenesis and metabolic processes (Supplementary Figure 2, Supplementary Table S3). GSEA analysis suggested that the neutrophil migration and chemotaxis were significantly enriched in the PTEN deletion group, while the T cell migration pathway was dominantly enriched in the wildtype group (Figure 2F and G, Supplementary Figure 2). As a result, it is plausible that the CXC chemokines mediated neutrophil infiltration could participate in the formation of tumor immune microenvironment upon PTEN depletion.
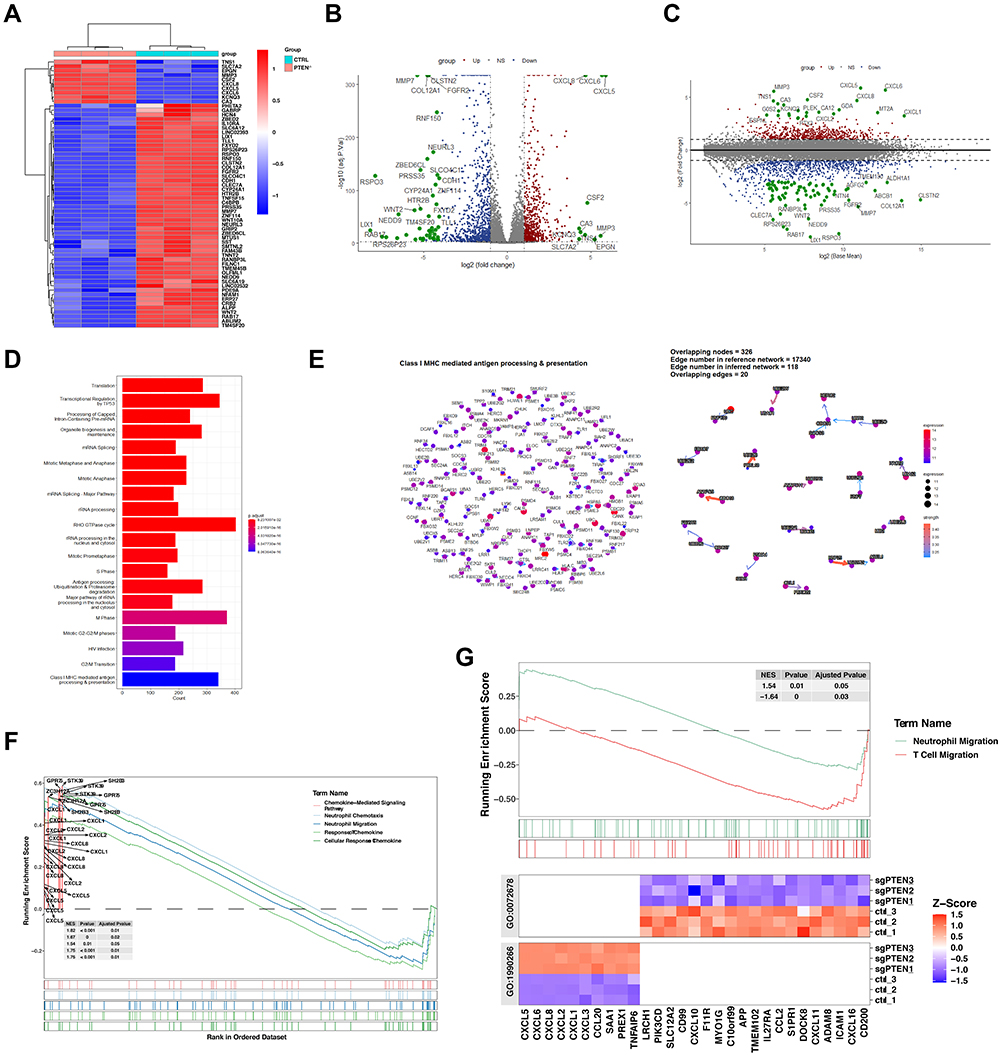 |
Figure 2 The high throughput RNA sequencing analysis of Caki-1 cells with or without the depletion of PTEN. (A) Heatmap of the differentially expressed genes in Caki-1 cells infected with sgRNA targeting Control or PTEN. The Red indicates genes that have significant increases in the indicated group. Blue dots show genes that have significant decreases in the indicated group. (B and C) Volcano plot (B) and MA plot (C) of the differentially expressed genes (DEGs) in Caki-1 cells infected with sgRNA targeting PTEN. The Red dots show genes that have significant increases in the PTEN-depleted group. Blue dots show genes that have significant decreases in the PTEN-depleted group. (D) Gene ontology analysis-enrichment plots the gene sets of biological processes in Caki-1 cells infected with sgRNA targeting PTEN. (E) CBNplot of the Class1-MHC mediated antigen processing and presentation pathway. (F) Gene Set Enrichment Analysis (GSEA) of five signaling pathways related to neutrophil chemotaxis and cellular response to chemokine based on the DEGs in Caki-1 cells with or without PTEN depletion. (G) GSEA analysis of neutrophil migration and T cell migration signaling pathway based on the DEGs in Caki-1 cells with or without PTEN depletion. |
The CXC Chemokine Family Was Upregulated in the Clear Cell Subtype of Renal Cell Carcinoma
Next, we sought to validate the results from our mRNA sequencing in ccRCC cell lines in vitro. As previously described, three sgRNA targeting PTEN were transfected into Caki-1 cells with CRISPR-Cas9, which was further confirmed by immunoblotting (Figure 3A). As the first constructs (sgPTEN #1) led to the most significant depletion of PTEN, it was selected for the following qRT-PCR to test the differentially expressed genes based on RNA sequencing (Figure 3B). The PCR results were highly consistent with the differential analysis with limma package (Figure 2B and C). Briefly, CXCL1, CXCL2, CXCL5, CXCl6, CXCL8, and MT2A were dramatically increased upon PTEN depletion (Figure 3B). As the papillary ccRCC (pRCC) has distinct genomic features and driver force, we next explore whether the increased of CXC chemokines was a generous characteristic of all subtypes of RCC (Figure 3C and D). In addition to ccRCC, patient 4 (RCC_P4, GSM4630030) was pathologically confirmed as chromophobe RCC (chRCC), and patient 1 (RCC_P1, GSM4630027) was papillary RCC (pRCC, Figure 3C). Importantly, CXCL1 was exclusively overexpressed in ccRCC samples, but not pRCC or chRCC samples (Figure 3D). Also, in ccRCC cohort of TCGA, the CXCL1 and CXCL2 were significantly upregulated in groups with low expression of PTEN (Figure 3E and F).
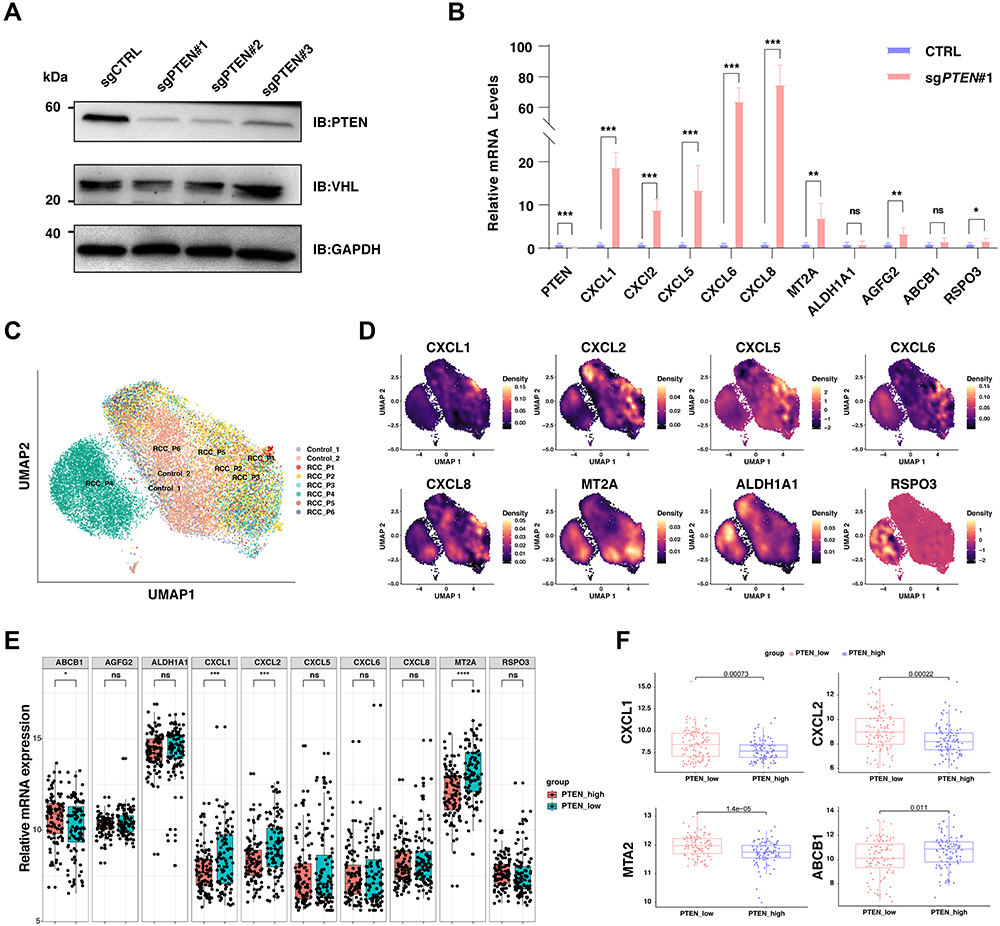 |
Figure 3 The validation of CXC chemokine family in Caki-1 cells, scRNA-seq dataset, and the bulk-RNA sequencing datasets. (A) The immunoblot (IB) analysis of whole cell lysates derived from C aki-1 cells infected with the indicated lentiviral sgRNA vectors against PTEN. Forty-eight hours post-infection, cells were selected with 2μg/mL puromycin for 72 hours to eliminate the non-infected cells before harvesting. (B) Relative mRNA expression of selected genes upregulated upon PTEN depletion in wildtype C aki-1 cells and cells with the knockout of PTEN. (C) Uniform Manifold Approximation and Projection (UMAP) embedding of jointly analyzed single-cell transcriptomes from renal cell cancers and normal kidneys, and clustered by samples. (D) Density plot visualizing the expression of selected genes upregulated upon PTEN depletion among different subpopulations in renal cell carcinoma. (E) Box plots of the differential expression of selected genes upregulated upon PTEN depletion between PTEN-low and PTEN-high renal cancers. The red color labels renal cancer with high expression of PTEN (n=100), and the green indicates renal cancer with low expression of PTEN (n=100). (F) Box plots of the differential expression of selected genes (CXCL1, CXCL2, MTA2, ABCB1) upregulated upon PTEN depletion between PTEN-low and PTEN-high renal cancers. Abbreviations: ns, not significant. Notes: *: P < 0.05; **: P < 0.01; ***: P < 0.001; ****: P < 0.0001. |
Neutrophil Marker Were Correlated with the Upregulated Neutrophil Chemokines Upon PTEN Deletion in ccRCC
Notably, the neutrophil chemokines upregulated upon PTEN deletion, including CXCL1, CXCL2, CXCL5, CXCL6, and CXCL8, play a critical role in attracting and activating neutrophil granulocytes, the most abundant immune cells in human blood. Hence, we sought to explore whether these CXC chemokines were correlated with the infiltration of neutrophil granulocytes in ccRCC. To this end, we found that the expression of CXCL1 was positively correlated with CXCL2, CXCL5, and CXCL6 in 32 kidney cell lines from the CCLE database, suggesting the general transcription regulation in RCC. Significantly, the classic neutrophil marker S100A9 was not correlated with CXCL1 in ccRCC cell lines (Figure 4A). However, in TCGA datasets with bulk-RNA sequencing dataset of ccRCC tissues, the expression of CXCL1 was highly correlated with the abundance of multiple neutrophil markers, particularly S100A8, S100A9, S100A11, and S100A12 (Figure 4B). In addition, in normal kidney tissues with bulk-RNA sequencing, the mRNA levels of CXCL1 were also positively correlated with neutrophil markers (Figure 4C). To extend these findings, the correlation between CXCL1/CXCL2/CXCL5/CXCL6/CXCL8 and S100A9 was further analyzed across 33 cancer types from TCGA (Supplementary Figure 3A–F). There was a remarkable positive correlation between the indicated genes in most cancer types (Supplementary Figure 3A–F). Furthermore, we found that the infiltration of neutrophil granulocytes might be correlated with a poor prognosis in ccRCC (Figure 4D and E). The infiltration of neutrophil granulocytes could be predicted by the expression of specific marker S100A11, or a ten-genes signatures (S100A8, S100A9, S100A11, S100A12, ADGRG3, BCL2A1, SLC25A37, IL1R2, MMP9, and NFE4), both of which significantly associated with poor overall survival and disease-free survival (Figure 4D and E).
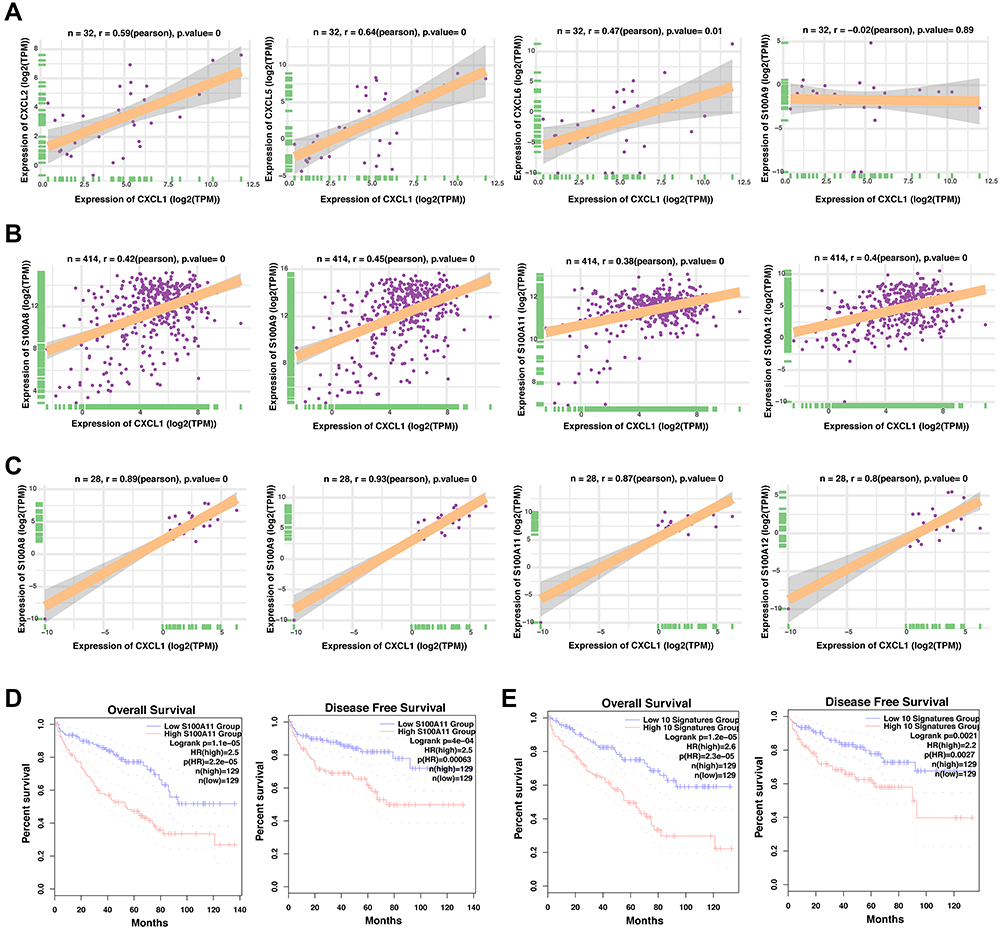 |
Figure 4 The correlation between the CXC chemokines in ccRCC and the role of neutrophil related genes in ccRCC prognosis. (A) The correlation analysis of the CXCL1 mRNA levels and indicated genes (CXCL2, CXCL5, CXCL6, and S100A9) of the 32 cell lines derived from the human kidney in CCLE database. (B) The correlation analysis of the CXCL1 mRNA levels and indicated genes (CXCL2, CXCL5, CXCL6, and S100A9) of the 414 renal cancer tissues in TCGA database. (C) The correlation analysis of the CXCL1 mRNA levels and indicated genes (CXCL2, CXCL5, CXCL6, and S100A9) of the 28 normal kidney tissues in GTEX database. (D) Comparison of the overall survival (left) and disease-free survival (right) of clear cell renal cell carcinoma between the S100A11-low and S100A11-high groups. (E) Comparison of the overall survival (left) and disease-free survival (right) of clear cell renal cell carcinoma between the neutrophil signatures-low and neutrophil signatures-high groups. |
Neutrophil Marker Genes Were Correlated with a Poor Prognosis of ccRCC
To further confirm the role of neutrophil marker genes in the prognosis of ccRCC, eighty-four marker genes that were explicitly overexpressed in renal cell carcinoma were comprehensively analyzed with the univariate cox analysis (Figure 5A). Except for KCNJ15, most of the neutrophil marker genes were correlated with an increased hazard ratio in ccRCC (Figure 5A). With the above eighty-four marker genes, a LASSO regression analysis was performed (Figure 5B). Ten-time cross-validation for tuning parameter selection in the LASSO Cox regression model showed that BCL2A1, CEBPB, CXCL8, IL1RN, MCEMP1, NAMPT, RGS2, S100A9, SELL, and SLC25A37 were the top 10 with significance (Figure 5C). With these significant marker genes, a ten-genes signature was constructed to predict the survival time of ccRCC patients (Figure 5D and E). In keeping with previous findings, the expression of the ten-genes signature was significantly correlated with the overall survival but not the disease-free survival in the context of 50% cutoff (Figure 5D) and 25% cutoff (Figure 5E).
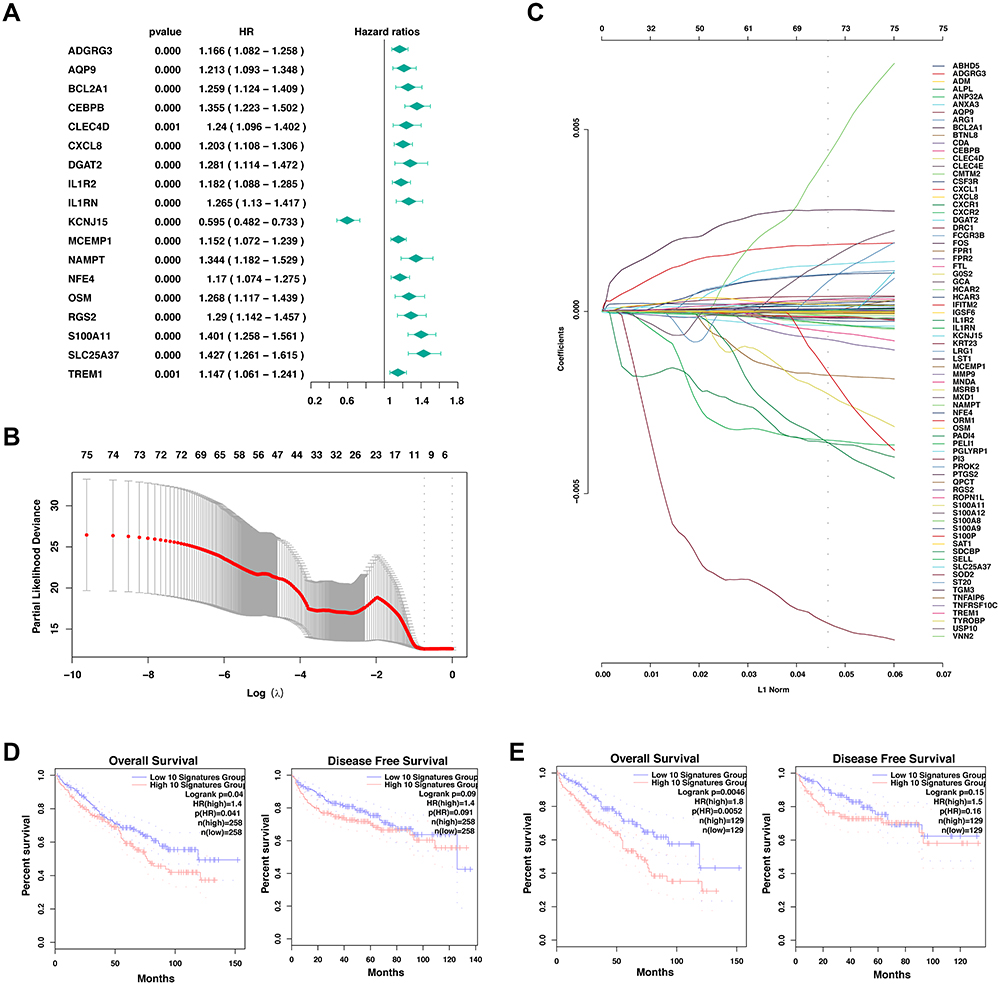 |
Figure 5 Development of prognostic signature with neutrophil marker genes in TCGA cohort. (A) Results of the univariate cox analysis of the neutrophil marker genes and the OS in TCGA-KIRC cohort. (B) LASSO coefficient profiles of the eighty-four marker genes of neutrophil granulocytes. (C) Ten-time cross-validation for tuning parameter selection in the LASSO Cox regression model. (D-E) Comparison of the overall survival (left) and disease-free survival (right) of clear cell renal cell carcinoma between the neutrophil signatures-low and neutrophil signatures-high groups with the cutoff value of 50% (d) and 25% (E). |
The Role of Chemokines and Neutrophil Marker Genes in Response to Anti-PD1-Based Immunotherapy
A subset of MDSC, namely polymorphonuclear MDSC (PMN-MDSC), are histologically functional neutrophils that can suppress immune responses to cancer. With the scRNA-seq dataset, we found that the MDSCs in ccRCC and normal kidney were mainly the subpopulation of PMN-MDSC (Figure 6A and B). To further confirm previous findings at protein levels, we performed immunohistochemistry staining for CXCL1 and S100A9 in 159 primary human ccRCC samples and found there was a positive correlation between CXCL1 and S100A9 (Figure 6C–E, Supplementary Tables S4–S6). Our results above demonstrate that high expression of CXCL1 in tumor cells might shape a suppressive tumor immune microenvironment through the attraction of neutrophils, which might lead to resistance to PD-1/PD-L1 blockade therapy. In keeping with the notion, we found that ccRCC patients with high expression of CXCL1, CXCL8, or the neutrophil markers, especially S100A9 and BCL2A1, displayed a worse overall survival than patients with low expression of indicated genes when all patients were treated with anti-PD-1 therapy from CheckMate-009, CheckMate-010, and CheckMate-025 (Figure 6F and G). Notably, the expression of CXCL8/BCL2A1/S100A9 was not significantly associated with the progression-free survival of renal cancer (P = 0.3 for CXCL8, P = 0.1 for BCL2A1, and P = 0.37 for S100A9, Figure S3H–J). Together, this evidence indicated that the neutrophil markers and chemokines play a role in the prognosis of immunotherapy in renal cancer patients.
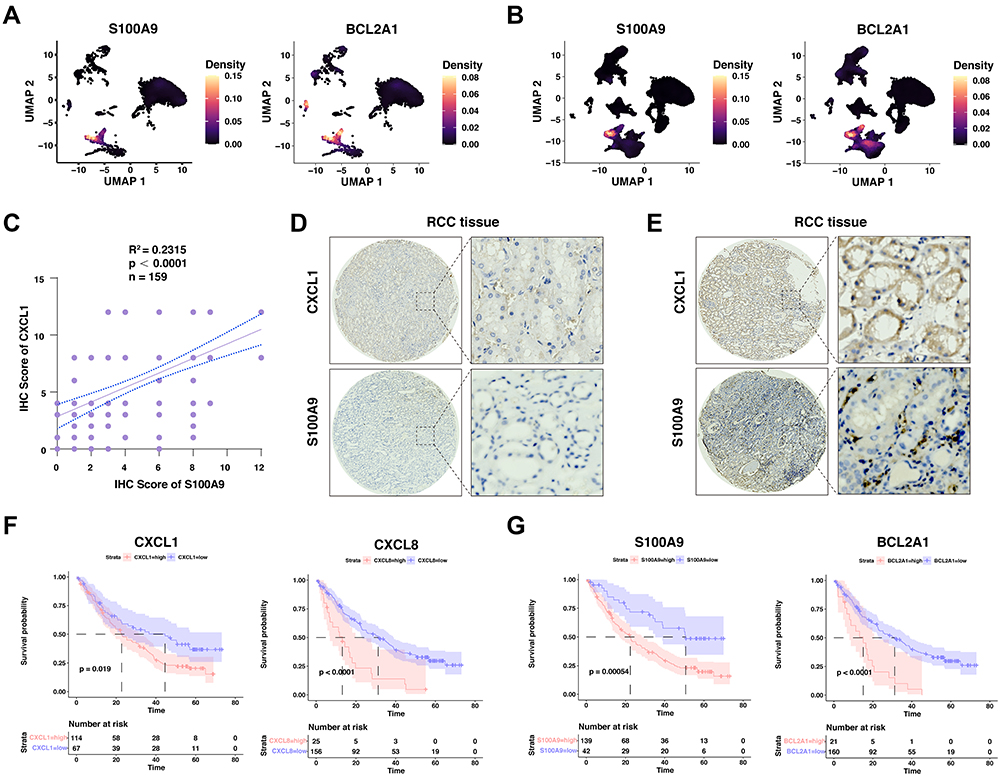 |
Figure 6 The validation of neutrophil marker genes in our ccRCC cohort, and its role in the prognosis of anti-PD1-based immunotherapy. (A and B) Density plot visualizing the expression of selected genes upregulated among different subpopulations in the normal kidney (A) and renal cell carcinoma tissues (B). Correlation between the immunohistochemistry scores between CXCL1 and S100A9 in renal cell carcinoma cohort. (C) Quantification of CXCL1 and S100A9 staining intensities were performed by semi-quantitative scoring. R2=0.2315, n = 159, r =, p < 0.0001; correlation coefficients were calculated using the Pearson test; two-sided p-value was given. (D) Representative images from IHC staining for low CXCL1 expression and low S100A9 expression in human renal cell carcinoma patients. (E) Representative images from IHC staining for high CXCL1 expression and high S100A9 expression in human renal cell carcinoma patients. (F and G) Kaplan-Meier plots showing the integrated survival time of three independent CheckMate trials with anti-PD-1 therapy based on CXCL1 (F) or S100A9 (G) expression levels. Two-sided Log rank test. |
Discussion
In this study, we comprehensively analyzed the genomic and transcriptomic data from multiple ccRCC datasets, and found that PTEN was correlated with a suppressive tumor immune microenvironment. Furthermore, depletion of PTEN in vitro dramatically increased the expression of neutrophil chemokines, including CXCL1, CXCL2, CXCL5, CXCL6, and CXCL8, which were further confirmed both in vitro, clinical samples, and the publicly available databases. Significantly, these biomarkers were associated with a poor prognosis in ccRCC patients receiving anti-PD1-based immunotherapy. Taken together, our data highlighted the potential association between genomic alternation of PTEN and neutrophil-mediated immune suppression, which could serve as novel evidence for individualized therapy in ccRCC.
The constitution of immune microenvironment in ccRCC is closely associated with clinical outcomes.28 Emerging evidence suggests that tumor-infiltrating neutrophils can regulate cancer progression, instead of being inert bystanders, which causes endure inflammation similar to “wounds that do not heal”.29 In addition to defending against microbial infection, neutrophils display remarkable plasticity in cancer development and progression, providing novel unexplored opportunities for cancer treatment.8,10 The recruitment and activation of neutrophils in the tumor microenvironment are mediated by chemokines, cytokines, lipid, or growth factors that produced via cancer cells or cancer-associated fibroblasts.30 Swati and colleagues reported that GM-CSF expressed by mesothelioma cells suppresses the T-cell function through enhancing the release of reactive oxygen species (ROS) from neutrophils.31 Furthermore, a critical neutrophil chemokine, CXCL1, was closely associated with tumor progression and poor survival in lung adenocarcinoma.32 Several theories have been proposed on the regulation of the secretory mediators in cancer, including the epithelial to mesenchymal transition (EMT), autophagy, and extracellular vesicles.30 Nevertheless, the molecular upstream regulation of these neutrophil chemokines in cancer cells, especially the genomic driving force, remains unclear.
The association between tumor-infiltrating neutrophils and the prognosis of renal cancer has been reported recently.33 Of note, the higher neutrophil-to-lymphocyte ratio (NLR) correlated with the worse outcomes in locally advanced ccRCC.34 Although these studies provide supportive evidence for the pro-tumor role of neutrophils in ccRCC, little is known about the underlining mechanism and its relationship with immunotherapy. Emerging evidence indicated that the neutrophil extracellular traps (NETs), where neutrophils degranulate and extrude genetic material, are associated with tumor migration, angiogenesis, and hypercoagulability.35 The NETs presented in the liver metastases from various cancers were reported to attract cancer cells from circulation, instead of acting as traps.36 In addition, the breast-to-lung metastasis is facilitated by the recruitment of neutrophils and formation of NETs, which was promoted by tumor-secreted protease cathepsin C37. However, the formation and roles of NETs in ccRCC have not been extensively investigated. Further experimental studies are warranted to comprehend the potential molecular role of neutrophil in tumor immune microenvironment of ccRCC.
Importantly, inhibition of neutrophils by blocking the chemokine receptor CXCR2 effectively suppressed tumor growth.38 In addition, molecular inhibition of IL8 or its receptors (CXCR1 and CXCR2) is being investigated for drug development, and clinical trials with ICIs are already ongoing.39 All these reports support our findings that infiltration of neutrophils associated with PTEN dysfunction could serve as potential targets for facilitating immunotherapy in ccRCC.
Nonetheless, multiple limitations of the current study should be underscored. The role of PTEN depletion in attracting neutrophils had not been testified in immune competent murine models for further translational research. To date, our understanding of neutrophils in tumor development has mainly been experimental investigation on murine tumor models, which have both pro-tumor and anti-tumor effects.14,29 However, the murine cell lines used in transplanted mouse tumor models have undergone substantial cancer immunoediting.40 Therefore, these widely used tumor models largely mimic the immune response at the “escape phase”, where pro-tumoral mechanisms already prevail.41 In this study, since the mutation or deletion of PTEN are early events during the cancer development, it is plausible that the transplanted mouse tumor models might not be faithful to the theory based on human renal cancer. More importantly, Seok and colleagues have postulated that mouse models have largely failed to mimic human inflammatory diseases, as the genes significantly altered in humans might be randomly altered in murine models.42 Kidney-specific transgenic mouse with PTEN deletion would be more suitable for further mechanistical and translational research in the future.
In conclusion, our data collectively highlight the association between PTEN alteration and neutrophil infiltration through the CXC chemokine family. Our study proposes low expression of PTEN as candidate factor of resistance to anti-PD-1-based immunotherapy in ccRCC. Moreover, molecular targeting of the PI3K-AKT-mTOR signaling pathway or neutrophil chemokines could promisingly facilitate immunotherapy in ccRCC patients with PTEN mutation, which need further translational study.
Data and Code Availability
The RNA-seq data generated by this article are available in the NCBI Sequence Read Archive repository with the following SRA accession number: PRJNA874209. The accession numbers for the scRNA-seq reported in this paper are GSE152938 and GSEGSE171306. The TCGA-PRAD dataset was obtained from the Genomic Data Commons (https://gdc.cancer.gov/). The pan-cancer datasets used in this study can be obtained and downloaded from XENA (https://xenabrowser.net/). The scripts used during the current study are available from the corresponding author on reasonable request.
Ethics Approval
This study was approved by the Ethics Committee of The First Affiliated Hospital of Shandong First Medical University.
Acknowledgments
We thank Dr. Tong Chen for his general help in the data analysis. We thank Dr. Jianming Zeng (University of Macau) and all the members of his bioinformatics team, biotrainee, for generously sharing their experience and codes. We appreciate the use of the biorstudio high-performance computing cluster (https://biorstudio.cloud) at Biotrainee and The shanghai HS Biotech Co., Ltd for conducting the research reported in this paper.
Funding
This project was supported by the Shandong Provincial Key Research and Development Project (2019GSF107058), the Natural Science Foundation of Shandong Province (ZR2020QH240), the Clinical Medicine Innovation Program of Jinan City (202019125), the National Natural Science Foundation of China (82002719, 81902608), and the China Postdoctoral Science Foundation (2022M711977).
Disclosure
The authors declare that they have no competing interests in this work.
References
1. Siegel RL, Miller KD, Fuchs HE, Jemal A. Cancer statistics, 2022. CA Cancer J Clin. 2022;72:7–33. doi:10.3322/caac.21708
2. Bedke J, Albiges L, Capitanio U, et al. The 2021 Updated European Association of Urology Guidelines on Renal Cell Carcinoma: immune Checkpoint Inhibitor-based Combination Therapies for Treatment-naive Metastatic Clear-cell Renal Cell Carcinoma Are Standard of Care. Eur Urol. 2021;80:393–397. doi:10.1016/j.eururo.2021.04.042
3. Quhal F, Mori K, Bruchbacher A, et al. First-line immunotherapy-based combinations for metastatic renal cell carcinoma: a systematic review and network meta-analysis. Eur Urol Oncol. 2021;4:755–765. doi:10.1016/j.euo.2021.03.001
4. Ricketts CJ, De Cubas AA, Fan H, et al. The cancer genome atlas comprehensive molecular characterization of renal cell carcinoma. Cell Rep. 2018;23(1):313–326 e315. doi:10.1016/j.celrep.2018.03.075
5. Dell’Atti L, Bianchi N, Aguiari G. New therapeutic interventions for kidney carcinoma: looking to the future. Cancers (Basel). 2022;14(15):3616. doi:10.3390/cancers14153616
6. Zhao J, Chen AX, Gartrell RD, et al. Immune and genomic correlates of response to anti-PD-1 immunotherapy in glioblastoma. Nat Med. 2019;25:462–469. doi:10.1038/s41591-019-0349-y
7. Diaz-Montero CM, Rini BI, Finke JH. The immunology of renal cell carcinoma. Nat Rev Nephrol. 2020;16:721–735. doi:10.1038/s41581-020-0316-3
8. Giese MA, Hind LE, Huttenlocher A. Neutrophil plasticity in the tumor microenvironment. Blood. 2019;133:2159–2167. doi:10.1182/blood-2018-11-844548
9. Capucetti A, Albano F, Bonecchi R. Multiple roles for chemokines in neutrophil biology. Front Immunol. 2020;11:1259. doi:10.3389/fimmu.2020.01259
10. Quail DF, Amulic B, Aziz M, et al. Neutrophil phenotypes and functions in cancer: a consensus statement. J Exp Med. 2022:219. doi:10.1084/jem.20220011
11. Yan J, Kloecker G, Fleming C, et al. Human polymorphonuclear neutrophils specifically recognize and kill cancerous cells. Oncoimmunology. 2014;3:e950163. doi:10.4161/15384101.2014.950163
12. Gershkovitz M, Caspi Y, Fainsod-Levi T, et al. TRPM2 mediates neutrophil killing of disseminated tumor cells. Cancer Res. 2018;78:2680–2690. doi:10.1158/0008-5472.CAN-17-3614
13. Hagerling C, Gonzalez H, Salari K, et al. Immune effector monocyte-neutrophil cooperation induced by the primary tumor prevents metastatic progression of breast cancer. Proc Natl Acad Sci U S A. 2019;116:21704–21714. doi:10.1073/pnas.1907660116
14. Lopez-Lago MA, Posner S, Thodima VJ, et al. Neutrophil chemokines secreted by tumor cells mount a lung antimetastatic response during renal cell carcinoma progression. Oncogene. 2013;32:1752–1760. doi:10.1038/onc.2012.201
15. Wu F, Dai X, Gan W, et al. Prostate cancer-associated mutation in SPOP impairs its ability to target Cdc20 for poly-ubiquitination and degradation. Cancer Lett. 2017;385:207–214. doi:10.1016/j.canlet.2016.10.021
16. Fragkoulis C, Ntoumas G, Glykas I, et al. Expression of proto-oncogene c-Myc in patients with urinary bladder transitional cell carcinoma. Curr Urol. 2021;15:231–233. doi:10.1097/CU9.0000000000000053
17. Yu Z, Lu W, Su C, et al. Single-Cell RNA-seq identification of the cellular molecular characteristics of sporadic bilateral clear cell renal cell Carcinoma. Front Oncol. 2021;11:659251). doi:10.3389/fonc.2021.659251
18. Su C, Lv Y, Lu W, et al. Single-Cell RNA Sequencing in Multiple Pathologic Types of Renal Cell Carcinoma Revealed Novel Potential Tumor-Specific Markers. Front Oncol. 2021;11:719564. doi:10.3389/fonc.2021.719564
19. Liu Z, Zhang Z. Mapping cell types across human tissues. Science. 2022;376:695–696. doi:10.1126/science.abq2116
20. Braun DA, Hou Y, Bakouny Z, et al. Interplay of somatic alterations and immune infiltration modulates response to PD-1 blockade in advanced clear cell renal cell carcinoma. Nat Med. 2020;26:909–918. doi:10.1038/s41591-020-0839-y
21. Hao Y, Hao S, Andersen-Nissen E, et al. Integrated analysis of multimodal single-cell data. Cell. 2021;184:3573–3587 e3529. doi:10.1016/j.cell.2021.04.048
22. McGinnis CS, Murrow LM, Gartner ZJ. DoubletFinder: doublet Detection in Single-Cell RNA sequencing data using artificial nearest neighbors. Cell Syst. 2019;8:329–337 e324. doi:10.1016/j.cels.2019.03.003
23. Butler A, Hoffman P, Smibert P, Papalexi E, Satija R. Integrating single-cell transcriptomic data across different conditions, technologies, and species. Nat Biotechnol. 2018;36:411–420. doi:10.1038/nbt.4096
24. Aran D, Looney AP, Liu L, et al. Reference-based analysis of lung single-cell sequencing reveals a transitional profibrotic macrophage. Nat Immunol. 2019;20:163–172. doi:10.1038/s41590-018-0276-y
25. Ritchie ME, Phipson B, Wu D, et al. limma powers differential expression analyses for RNA-sequencing and microarray studies. Nucleic Acids Res. 2015;43:e47–e47. doi:10.1093/nar/gkv007
26. Wu T, Hu E, Xu S, et al. clusterProfiler 4.0: a universal enrichment tool for interpreting omics data. Innovation. 2021;2:100141. doi:10.1016/j.xinn.2021.100141
27. Mayakonda A, Lin DC, Assenov Y, Plass C, Koeffler HP. Maftools: efficient and comprehensive analysis of somatic variants in cancer. Genome Res. 2018;28:1747–1756. doi:10.1101/gr.239244.118
28. Dai S, Zeng H, Liu Z, et al. Intratumoral CXCL13(+)CD8(+)T cell infiltration determines poor clinical outcomes and immunoevasive contexture in patients with clear cell renal cell carcinoma. J Immunother Cancer. 2021:9. doi:10.1136/jitc-2020-001823
29. Coffelt SB, Wellenstein MD, de Visser KE. Neutrophils in cancer: neutral no more. Nat Rev Cancer. 2016;16:431–446. doi:10.1038/nrc.2016.52
30. SenGupta S, Hein LE, Parent CA. The recruitment of neutrophils to the tumor microenvironment is regulated by multiple mediators. Front Immunol. 2021;12:734188. doi:10.3389/fimmu.2021.734188
31. Khanna S, Graef S, Mussai F, et al. Tumor-Derived GM-CSF Promotes Granulocyte Immunosuppression in Mesothelioma Patients. Clin Cancer Res. 2018;24:2859–2872. doi:10.1158/1078-0432.CCR-17-3757
32. Yu S, Yi M, Xu L, et al. CXCL1 as an Unfavorable Prognosis Factor Negatively Regulated by DACH1 in Non-small Cell Lung Cancer. Front Oncol. 2019;9:1515. doi:10.3389/fonc.2019.01515
33. Tessier-Cloutier B, Twa DD, Marzban M, et al. The presence of tumour-infiltrating neutrophils is an independent adverse prognostic feature in clear cell renal cell carcinoma. J Pathol Clin Res. 2021;7:385–396. doi:10.1002/cjp2.204
34. Cordeiro MD, Ilario EN, Abe DK, et al. Neutrophil-to-lymphocyte ratio predicts cancer outcome in locally advanced clear renal cell carcinoma. Clin Genitourin Cancer. 2022;20:102–106. doi:10.1016/j.clgc.2021.10.009
35. Efrimescu CI, Buggy PM, Buggy DJ. Neutrophil extracellular trapping role in cancer, metastases, and cancer-related thrombosis: a narrative review of the current evidence base. Curr Oncol Rep. 2021;23:118. doi:10.1007/s11912-021-01103-0
36. Yang L, Liu Q, Zhang X, et al. DNA of neutrophil extracellular traps promotes cancer metastasis via CCDC25. Nature. 2020;583:133–138. doi:10.1038/s41586-020-2394-6
37. Xiao Y, Cong M, Li J, et al. Cathepsin C promotes breast cancer lung metastasis by modulating neutrophil infiltration and neutrophil extracellular trap formation. Cancer Cell. 2021;39(3):423–437 e427. doi:10.1016/j.ccell.2020.12.012
38. Mittmann LA, Haring F, Schaubächer JB, et al. Uncoupled biological and chronological aging of neutrophils in cancer promotes tumor progression. J Immunother Cancer. 2021:9. doi:10.1136/jitc-2021-003495
39. Teijeira A, Garasa S, Ochoa MC, et al. IL8, Neutrophils, and NETs in a Collusion against Cancer Immunity and Immunotherapy. Clin Cancer Res. 2021;27:2383–2393. doi:10.1158/1078-0432.CCR-20-1319
40. Schreiber RD, Old LJ, Smyth MJ. Cancer immunoediting: integrating immunity’s roles in cancer suppression and promotion. Science. 2011;331:1565–1570. doi:10.1126/science.1203486
41. Eruslanov EB, Singhal S, Albelda SM. Mouse versus Human Neutrophils in Cancer: a Major Knowledge Gap. Trends Cancer. 2017;3:149–160. doi:10.1016/j.trecan.2016.12.006
42. Seok J, Warren HS, Cuenca AG, et al. Genomic responses in mouse models poorly mimic human inflammatory diseases. Proc Natl Acad Sci U S A. 2013;110:3507–3512. doi:10.1073/pnas.1222878110
 © 2022 The Author(s). This work is published and licensed by Dove Medical Press Limited. The full terms of this license are available at https://www.dovepress.com/terms.php and incorporate the Creative Commons Attribution - Non Commercial (unported, v3.0) License.
By accessing the work you hereby accept the Terms. Non-commercial uses of the work are permitted without any further permission from Dove Medical Press Limited, provided the work is properly attributed. For permission for commercial use of this work, please see paragraphs 4.2 and 5 of our Terms.
© 2022 The Author(s). This work is published and licensed by Dove Medical Press Limited. The full terms of this license are available at https://www.dovepress.com/terms.php and incorporate the Creative Commons Attribution - Non Commercial (unported, v3.0) License.
By accessing the work you hereby accept the Terms. Non-commercial uses of the work are permitted without any further permission from Dove Medical Press Limited, provided the work is properly attributed. For permission for commercial use of this work, please see paragraphs 4.2 and 5 of our Terms.