")
Back to Journals » International Journal of General Medicine » Volume 11
The impact of sarcopenic obesity on inflammation, lean body mass, and muscle strength in elderly women
Authors Nascimento DC , Oliveira SC, Leite Vieira DC, Schwerz Funghetto S , Silva AO , Valduga R, Schoenfeld BJ, Prestes J
Received 12 September 2018
Accepted for publication 1 October 2018
Published 22 November 2018 Volume 2018:11 Pages 443—449
DOI https://doi.org/10.2147/IJGM.S187285
Checked for plagiarism Yes
Review by Single anonymous peer review
Peer reviewer comments 2
Editor who approved publication: Dr Scott Fraser
Dahan da Cunha Nascimento,1,2 Samuel da Cunha Oliveira,1 Denis Cesar Leite Vieira,2,3 Silvana Schwerz Funghetto,4 Alessandro Oliveira Silva,5,6 Renato Valduga,7 Brad Jon Schoenfeld,8 Jonato Prestes1
1Department of Physical Education, Catholic University of Brasilia (UCB), Brasilia, Brazil; 2Department of Physical Education, University Center of the Federal District (UDF), Brasilia, Brazil; 3Department of Physical Education, University of Brasilia (UNB), Brasilia, Brazil; 4Department of Nursing, University of Brasilia (UNB), Brasilia, Brazil; 5University Center of Brasilia (UniCEUB), Brasilia, Brazil; 6Department of Medicine and Physical Education, Integrated Colleges of the Central Plateau Educational Union (FACIPLAC), Brasilia, Brazil; 7Department of Physiotherapy, Secretary of State for Health of the Federal District, Emergency Unit, Ceilandia Regional Hospital, Brasilia, Brazil; 8Department of Health Sciences, CUNY Lehman College, Bronx, NY, USA
Objective: The objective of this study was to apply the newly standardized definition for sarcopenia from the Foundation for the National Institutes of Health (FNIH) and the current definition for obesity to 1) determine the prevalence of sarcopenic obesity (SO) in obese elderly women; 2) compare the muscle strength, lean body mass, and markers of inflammation between obese elderly women with SO and nonsarcopenic obesity (NSO), and 3) elucidate the relationship between appendicular lean mass adjusted for body mass index (aLM/BMI) with muscle strength, lean body mass, and obesity indices.
Methods: A total of 64 elderly obese women (age: 68.35±6.04 years) underwent body composition analysis by dual-energy X-ray absorptiometry. Participants were classified into two groups according to the definition of SO and NSO. Blood samples were collected for total cholesterol, triglycerides, high-density lipoprotein, low-density lipoprotein, uric acid, urea, interleukin-6 (IL-6), glucose, and creatine kinase (CK) measurements.
Results: The SO group presented a significantly greater BMI, fat (%), glucose, a marginal trend toward significance for uric acid, and IL-6 compared to the NSO group. In addition, the SO group displayed lower values for muscle strength and lean body mass. From a correlation standpoint, a higher aLM/BMI was positively associated with lean body mass and muscle strength and negatively associated with a lower BMI and percentage body fat.
Conclusion: The definition criteria from FNIH and obesity permit the ability to illustrate the prevalence and identify SO in elderly women with low muscle mass, low muscle strength, and impaired markers of inflammation.
Keywords: aging, fat mass, muscles, obesity, sarcopenia, sarcopenic obese
Introduction
During aging, a decline in muscle mass coupled with an increase in fat mass has important consequences for older adults.1 Four body composition phenotype characteristics exist in older adults: normal, sarcopenic, obese, and a combination of sarcopenic and obese.2 Although the definition of sarcopenic obesity (SO) combines those of sarcopenia and obesity, few diagnostic methods have been proposed in recent years.2–4
Obesity can be diagnosed by total fat mass, percentage body fat, body mass index (BMI), visceral fat area, and waist circumference, while sarcopenia can be diagnosed by appendicular lean mass adjusted for height squared (aLM/height2 or BMI [aLM/BMI]).6 The aLM/height2 method has been widely used in many studies, while the aLM/BMI method represents a new clinically relevant criteria for weakness and low muscle mass based on a large, diverse, and well characterized set of populations of community-dwelling elderly persons that permit generalizability of findings.1,5–9
The combination of sarcopenia and obesity has a detrimental impact on physical functional status in obese elderly women, which in turn exacerbates disability.2,10 SO is also associated with systemic inflammation (eg, higher C-reactive protein, fibrinogen, interleukin-6 [IL-6]), lower handgrip strength, lower lean body mass, higher mortality risk, lower muscle quality caused by fat infiltration, impaired quality of life, higher cardiovascular disease risk, and more physical disabilities when compared with subjects without SO.3,8,11–16
Considering that SO research is in its infancy and different mathematical thresholds can over- and under-diagnose this clinical condition, our goal was to 1) apply the newly standardized definition for SO used in previous studies and proposed by the Foundation for the National Institutes of Health (FNIH) and illustrate the prevalence of SO in obese elderly women; 2) observe the degree of impairment of muscle strength, lean body mass, and markers of inflammation in those fulfilling such criteria; and 3) elucidate the association between aLM/BMI with obesity indices and strength parameters.6,8,9,11,17
We hypothesized that obese elderly women with SO will have higher pro-inflammatory markers when compared to NSO elderly women. Furthermore, we hypothesized that a higher aLM/BMI will be positively associated with lean body mass and muscle strength and negatively associated with obesity indices.
Materials and methods
Ninety elderly women from a local community were recruited through posters and lectures about the study at the Federal District, Brazil. To be eligible, women needed to be aged ≥60 years with a body fat percentage ≥38% as assessed by dual-energy X-ray absorptiometry (DXA).11,17 Exclusion criteria included history of heart failure, valvular or congenital disease, pacemaker implantation, or osteo-articular disorders. A total of 90 older women were assessed for eligibility and completed a self-report questionnaire that accounted for cardiovascular disease, hypertension, diabetes, osteoporosis, or musculoskeletal conditions that may have precluded participants from safely completing physical function tests assessed in this study. Elderly women were classified as hypertensive and with type 2 diabetes mellitus by the diagnostic criteria used in previous studies.18–20 From the initial applicants, 26 were excluded (did not meet inclusion criteria) and thus a total of 64 women who met the inclusion criteria were selected to participate. The present study was approved by the Institutional Research Ethic Committee of Catholic University of Brasília (UCB) (protocol #035/2011). The study design and employed procedures were in accordance with ethical standards and the Declaration of Helsinki. Each participant was fully informed about the risks associated with study participation and gave their written informed consent.
Muscle strength evaluation
Muscle strength was evaluated by the ten-repetition maximum (10 RM) test according to the protocol used in previous research from our laboratory.21,22 The test-retest reproducibility for the leg extension 10 RM was R=0.99. In addition, the relative muscle strength was calculated by dividing the 10 RM test value by body mass.23 In addition, the leg extension exercise was chosen because lower limb strength has a strong correlation with elderly survival time and dependency.24
Blood samples and biochemical parameters
Lipid profile glycerol phosphate dehydrogenase/p-chlorophenol in presence of peroxidase, urea (Ureasi-glutamate dehydrogenase), and uric acid (uricase/peroxidase method) were measured by the enzymatic colorimetric method using Autohumalyzer equipment (Human GMBH, Wiesbaden, Germany). High-density lipoprotein cholesterol was determined by ionic exchange followed by colorimetric reaction with the Linco Research Inc. kit (St Louis, MO, USA), and blood glucose was measured by the hexokinase enzymatic assay. IL-6 concentration was measured by Quantikine high-sensitivity commercial enzyme-linked immunosorbent assay kit (R&D Systems, Minneapolis, MN, USA). The intraassay coefficient of variation of the kit was 1.5%–5.6% for IL-6. The inter-assay coefficient of variation was 4.3%–6.4% for IL-6. Creatine kinase (CK) concentration was determined by using a commercially available Reflotron CK assay using the Reflotron system (Boehringer Mannheim GmbH, Mannheim, Germany). The measures for CK and IL-6 were performed in triplicate and then averaged.
Body composition
Body composition procedures have been described in detail elsewhere, and percent body fat and appendicular skeletal muscle mass were determined via DXA (General Electric-GE model 8548 BX1L, year 2005, Lunar DPX type, Software Encore 2005; Rommelsdorf, Germany). The coefficient of variation for the percent body fat estimated by DXA was 10.12% and 12.13% for the SO and nonsarcopenic obesity (NSO) groups, respectively. All metal objects were removed from the participants before the scan.25
Sarcopenia and SO
Prevalence of sarcopenia was defined by the aLM adjusted for BMI <0.512.6,8 Obesity was considered as a body fat percentage ≥38%. SO was determined if elderly women fulfilled the criteria for both sarcopenia and obesity using these definitions.4–6,11,17
Statistical analysis
All analyses were conducted with SPSS software version 18.0 (SPSS Inc., Chicago, IL, USA) and the normality was verified by the Shapiro–Wilk test. For the parametric and non-parametric data, an independent Student’s t-test and Mann–Whitney U test were employed, respectively. In addition, the Spearman’s rank correlation coefficient was used to test the association of aLM/BMI with biochemical parameters, muscle strength, and body composition. A chi-squared test for proportions (Fisher’s exact test when cells with expected values were <5 for essential hypertension and type 2diabetes mellitus) was also employed. An alpha level of P≤0.05 was considered significant. In addition, GraphPad Prism 7.0 software was also used (GraphPad Software, Inc., La Jolla, CA, USA). An effect size d of 2.31, a power >80%, alpha error probability of 0.05, allocation ratio of 1.06, and two tails were considered. The post hoc power analysis was used to calculate the sample size necessary to identify differences between two independent groups. Sixty-two elderly (31 vs 31) women were necessary to identify a difference on aLM adjusted for BMI. For the power calculation, the software G*Power 3.1.6 was used (Heinrich-Heine-University Düsseldorf, Düsseldorf, Germany).
Results
The SO group presented a significantly lower absolute muscle strength (35.60±7.88 kg [37.71–38.50 95% CI] vs 40.30±8.38 kg [37.32–43.27 95% CI]) and relative muscle strength (0.51±0.12 kg/kg [0.47–0.56 95% CI] vs 0.60±0.12 kg/kg [0.56–0.65 95% CI]), arm lean body mass (3.76±0.55 kg [3.56–3.97 95% CI] vs 4.02±0.60 kg [3.80–4.23 95% CI]), leg lean body mass (10.90±1.28 kg [10.43–11.37 95% CI] vs 11.76±1.22 kg [11.33–12.20 95% CI]), and aLM (14.67±1.58 kg [14.09–15.25 95% CI] vs 15.79±1.60 kg [15.22–16.36 95% CI]) compared to the NSO group (Figure 1).
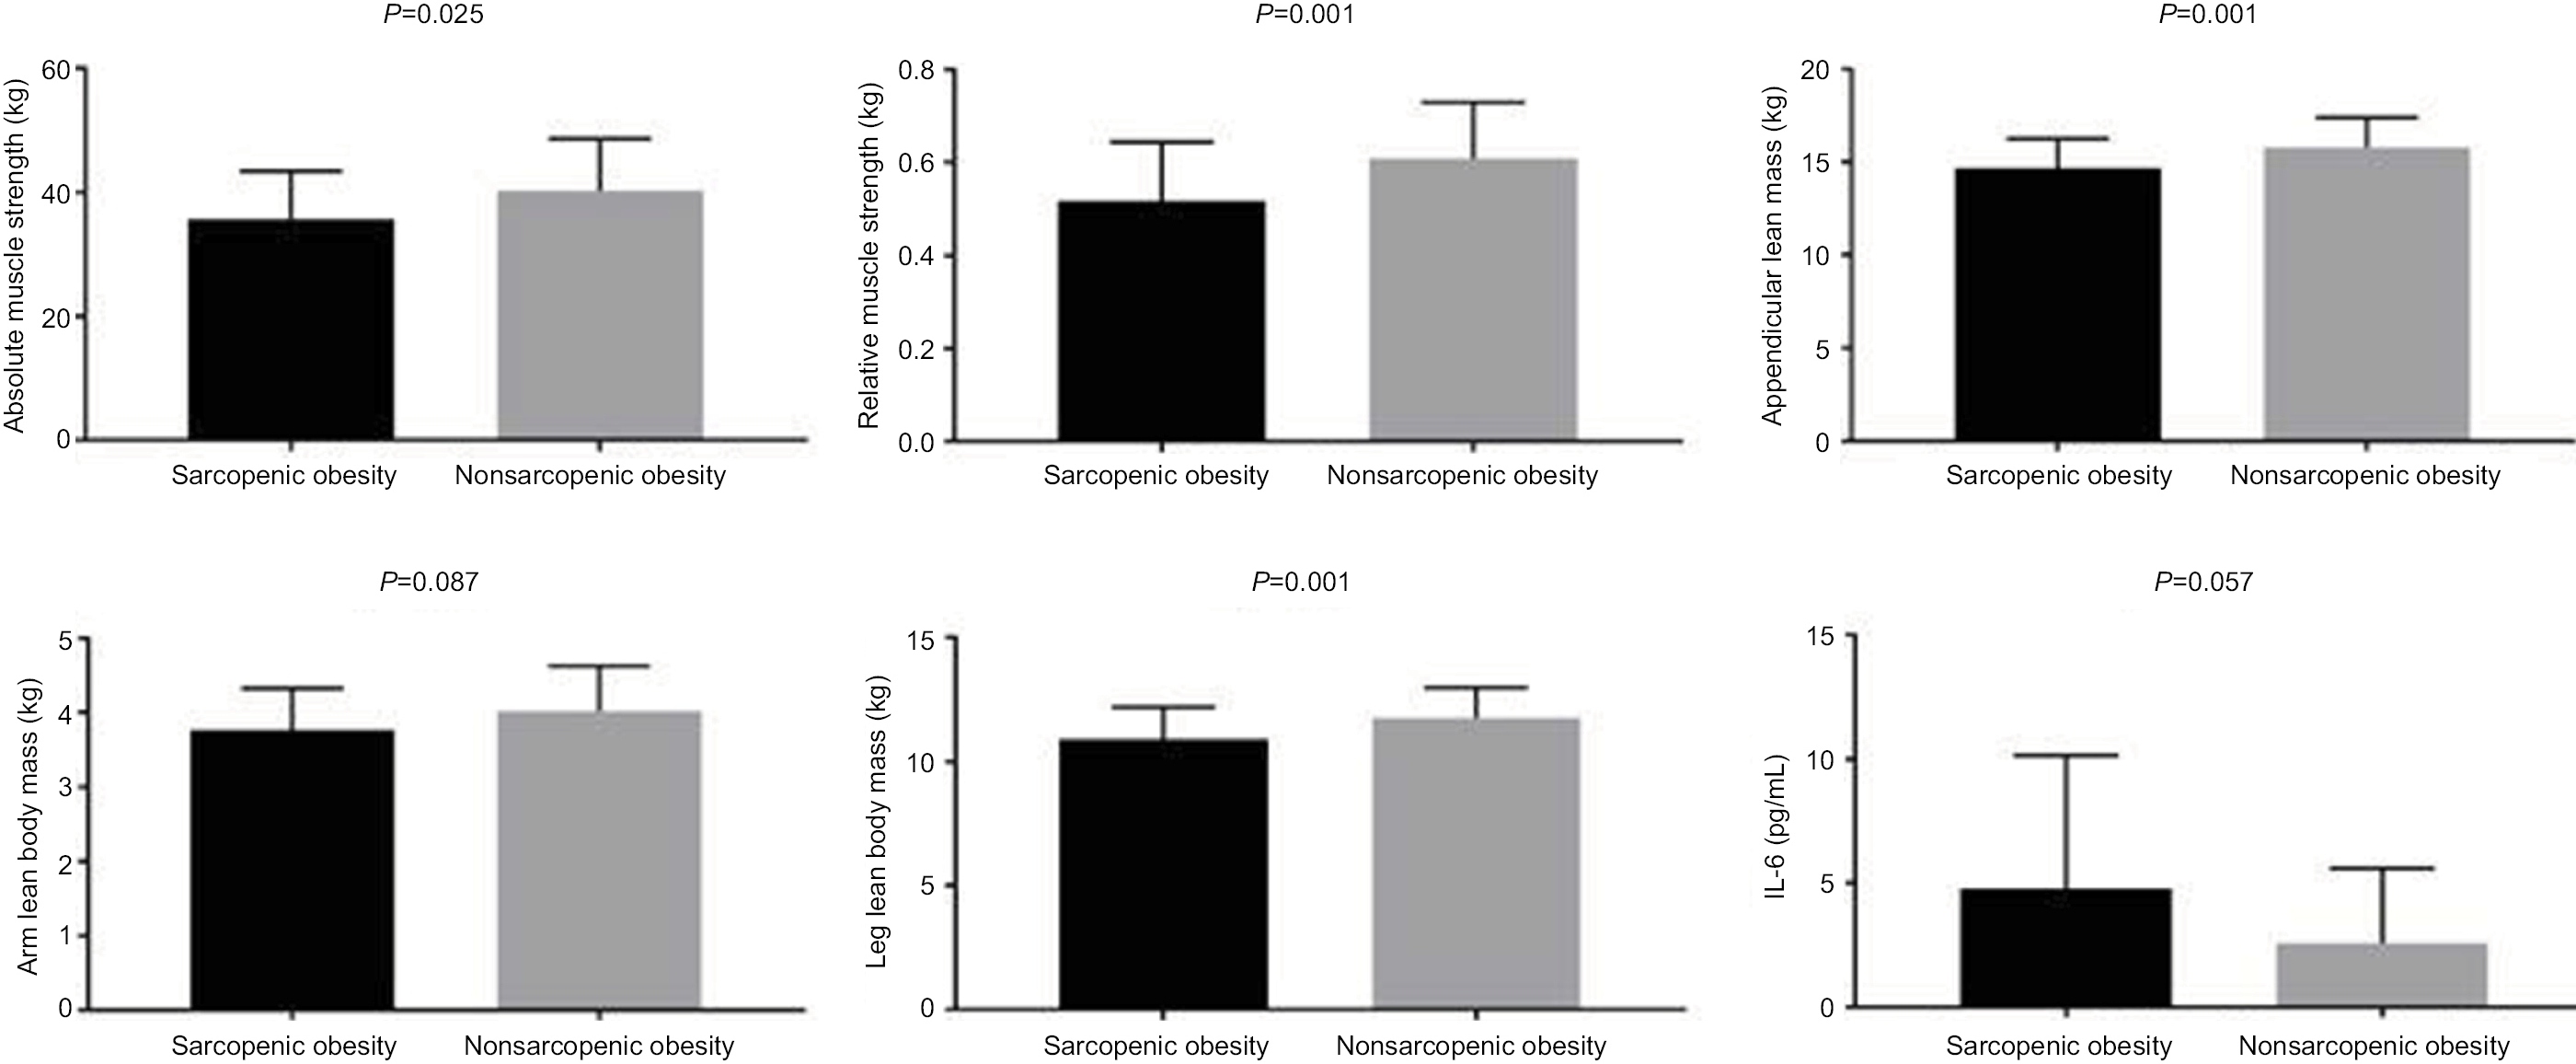 | Figure 1 Comparisons between sarcopenic obesity and nonsarcopenic obesity presented by mean and SD. Notes: Non-normal data (relative muscle strength, leg lean mass, appendicular lean mass, and interleukin-6), P≤0.05. |
Furthermore, the SO group presented a significantly greater BMI, fat (%), glucose, and a marginal trend toward significance for uric acid, and IL-6 (4.76±5.46 pg/ml [2.76–6.80 95% CI] vs 2.58±3.00 pg/ml [1.51–3.64 95% CI]) compared to the NSO group (Table 1; Figure 1). In addition, there was a significant positive correlation between aLM/BMI with relative muscle strength, arm lean body mass, leg lean body mass, and aLM. However, there was also a significant negative correlation between aLM/BMI with body fat percentage (Table 2). Furthermore, a marginal trend was observed for a negative correlation with glucose.
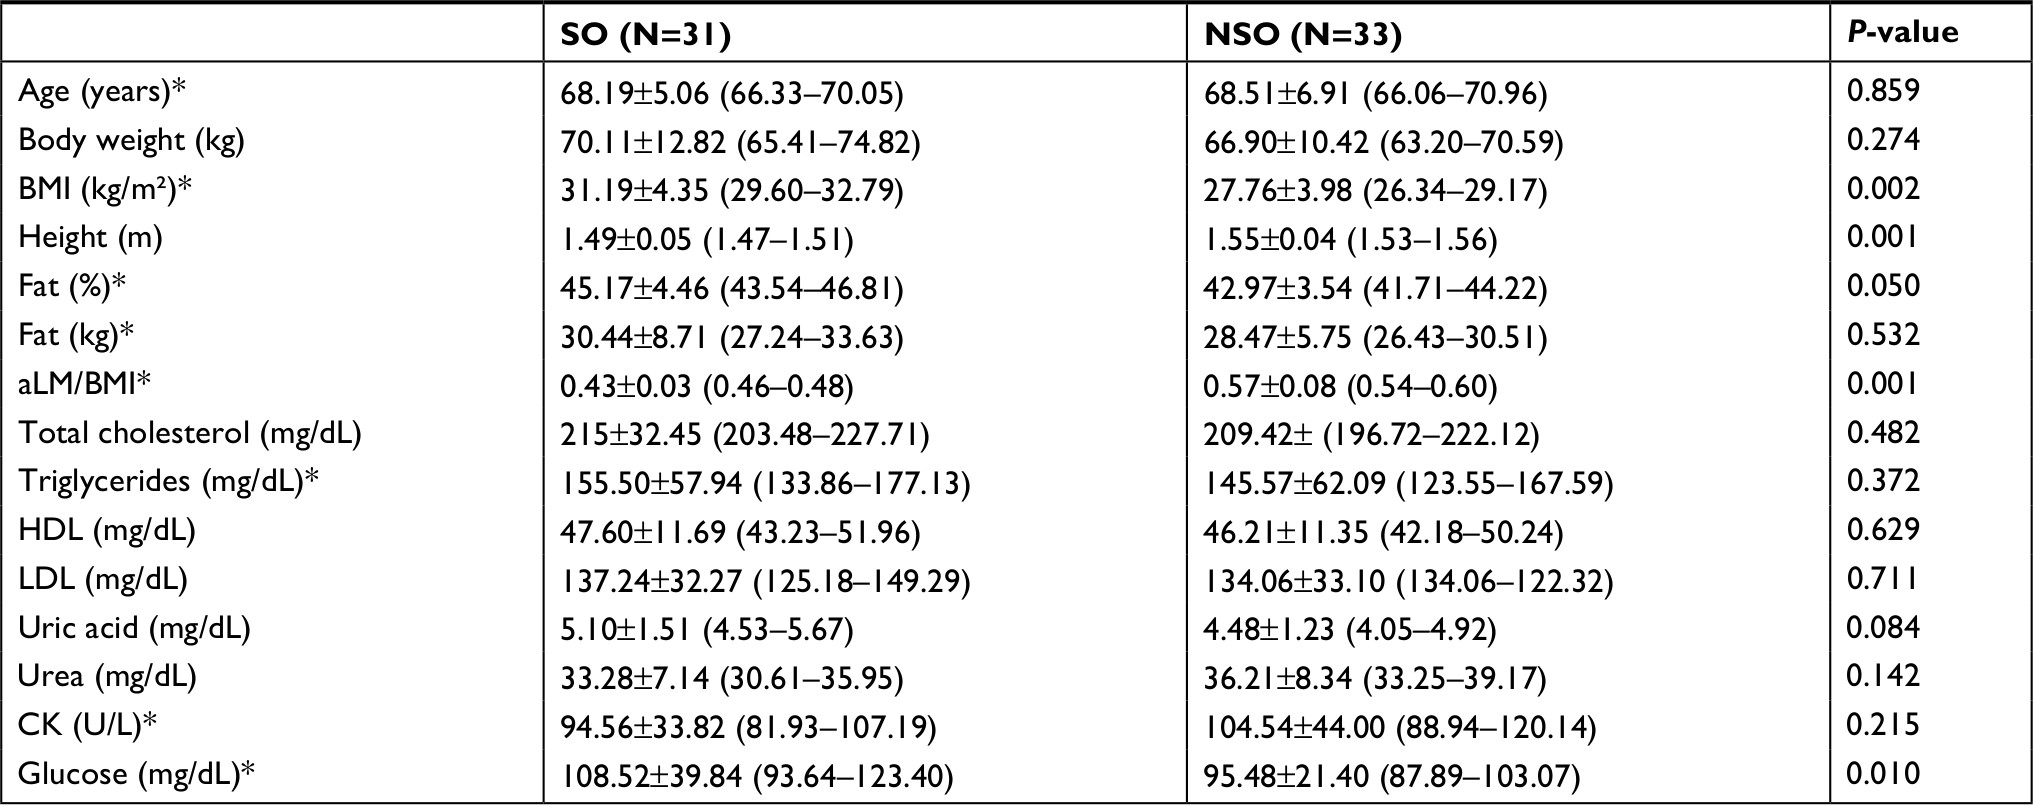 | Table 1 Participant characteristics presented by mean, SD, and 95% CI Note: *Non-normal data. Abbreviations: aLM, appendicular lean mass, BMI, body mass index, HDL, high-density lipoprotein, LDL, low-density lipoprotein, CK, creatine kinase, SO, sarcopenic obesity, NOS, nonsarcopenic obesity. |
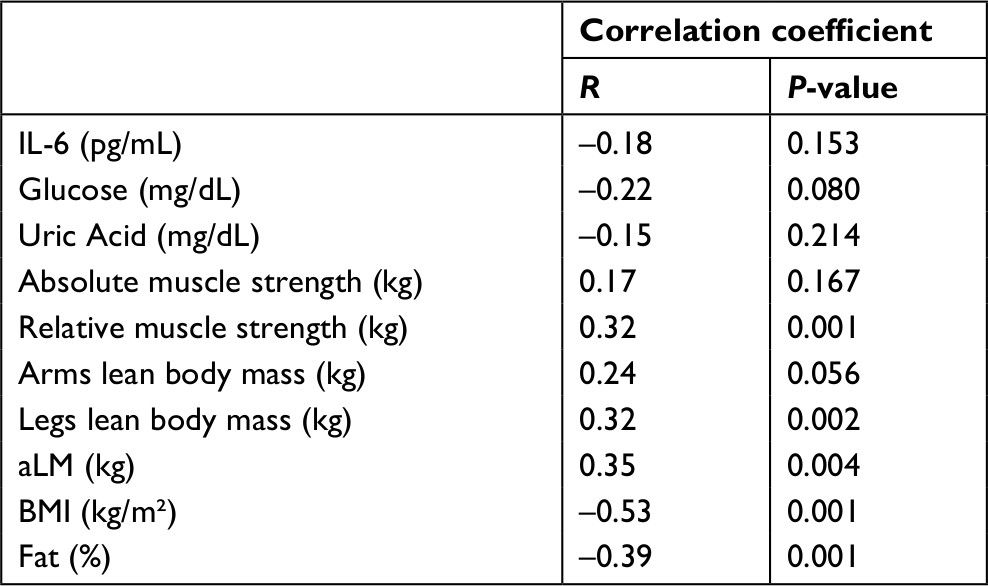 | Table 2 Correlation coefficient between aLM/BMI and biochemical parameters, muscle strength, and body composition Note: P≤0.05, significant difference. Abbreviations: IL-6, interleukin-6, aLM, appendicular lean mass, BMI, body mass index. |
There was no statistical difference between groups for the presence of hypertension (X2(1) =0.21, P=0.80, Cramer’s V=0.05) and diabetes (X2(1) =0.00, P=1.00, Cramer’s V=0.01).
Discussion
Our results highlight the prevalence of SO in a relatively small sample of obese elderly women using the newly standardized FNIH definition of ALM combined with obesity based on body composition. In addition, our results indicate that elderly women with SO present lower levels of lean body mass and muscle strength, higher glucose, and a trend toward a statistical significance for a higher uric acid and IL-6 serum levels as compared with NSO elderly women. Other important findings include a positive correlation between aLM/BMI with lean body mass and muscle strength, and a negative association with BMI and percentage body fat.
Inflammation associated with SO plays an important role in insulin resistance, glucose tolerance, reduced lean body mass, and lower muscle strength.3,16,26,27 An alternative hypothesis for the higher glucose levels observed in the SO group is that rather than low levels of lean body mass being responsible for glucose intolerance, the condition may instead be primarily a function of the higher accumulation of visceral fat.28
This might be explained by the superior IL-6 serum levels when compared with the NSO group. In addition, chronic IL-6 elevations activate the transcription nuclear factor-kB and JUN N-terminal kinase pathways associated with insulin resistance,27,29 thus promoting a higher level of glucose in the SO group compared with NSO group as verified in this study.
Furthermore, higher IL-6 serum levels are observed in individuals with obesity and poor muscle strength.16 Consistent with this result, we found a trend for greater IL-6 serum levels in the SO group. Moreover, the low muscle strength and lean body mass observed in the SO group might be explained by the activation of molecular pathways as FOXO, Smad 2/3, p38MAPK promoted by IL-6 that causes protein degradation by the ubiquitin ligases and thereby negatively regulates muscle mass and strength in sarcopenic individuals.30 Although no standard for IL-6 serum levels has been established for reference in clinical practice, older women with high IL-6 serum levels (>3.10 pg/mL) have a higher risk of developing physical disabilities (eg, associated with low muscle strength) as observed in the present study for the SO group when compared with the NSO group (4.76 vs 2.58 pg/mL for IL-6, respectively).22,26
On the basis of this finding, SO demonstrated a statistical trend for higher uric acid when compared to NSO group. One possible explanation is that visceral adiposity demonstrates a higher urinary excretion (eg, overproduction-type hyperuricemia).31 In addition, central obesity (aka visceral adiposity) is associated with a proinflammatory condition and insulin resistance.16,32 Central obesity to a greater extent directly affects inflammation, functional impairment, and uric acid serum levels.16,31,33 SO group in our study might have a central obesity characteristic rather than regional obesity when compared with NSO, although not directly verified by DXA. Furthermore, uric acid might also induce insulin resistance, which could partially explain the higher glucose serum levels observed in the SO group.32
SO has been shown to be related to physical limitations, impaired basic activities of daily living, and impaired instrumental activities of daily living.9 The low muscle strength observed in our SO group may increase the likelihood for these maladies and lead to premature mortality.12 Thus, maintaining a higher aLM/BMI is positively associated with lean body mass and muscle strength while negatively associated with a lower BMI and percent body fat. Furthermore, there was a trend toward a negative association with glucose tolerance, which may have beneficial health implications.
Our exploratory analysis provides additional insight into the relationship between SO, inflammation, low muscle strength, glucose intolerance, and uric acid concentrations. However, these important findings are highly dependent on the specific definitions used for sarcopenia and obesity, which may result in over- or under-diagnosis of this clinical condition.6,11,17
Accordingly, our findings would necessarily change when a different method is employed.5,7 Although this represents an important limitation, our results corroborate the relationship between SO and functional disabilities and inflammation where using the aLM/BMI method demonstrated stronger strengths of associations and clinical applicability.8,9 Our findings are also limited by the relatively small sample size that compromises statistical power, how well the sample reflected the true underlying population of obese elderly women, and the cross-sectional design employed precludes the determination of causality.
In addition, we suggest the need of other strength measures to be comparable with other studies of sarcopenia and the need for future research including more details regarding visceral fat such as waist–hip ratio or separation of fat deposits using DXA or other imaging measures.
Conclusion
Our results suggest that SO in elderly women is associated with higher IL-6 serum levels, lower muscle strength, lower lean body mass, higher glucose, and higher uric acid levels. Furthermore, the use of definition criteria from FNIH and obesity might permit the identification of elderly women with SO and allow researchers in clinical geriatric practice to plan possible interventions to reduce the burden of disability downstream.6,11,17
Acknowledgments
The authors thank the laboratory LAFIT (Daniele Garcia and contributors) of the Catholic University of Brasilia. In addition, the first author wants to dedicate this paper to his family (Rita de Cassia and Nicolas Cunha). The authors also acknowledge the financial support from Coordenação de Aperfeiçoamento de Pessoal de Nível Superior (CAPES), University of Brasilia, Fundação de Amparo a Pesquisa do Distrito Federal - process: 0193.001450/2016 and CNPQ process: 421836/2016-4.
Author contributions
All authors contributed to the study design, data collection, and article preparation; took part in drafting the article or revising it critically for important intellectual content; gave final approval of the version to be published; and agree to be accountable for all aspects of the work.
Disclosure
The authors report no conflicts of interest in this work.
References
Cauley JA. An Overview of Sarcopenic Obesity. J Clin Densitom. 2015;18(4):499–505. | ||
Waters DL, Baumgartner RN. Sarcopenia and obesity. Clin Geriatr Med. 2011;27(3):401–421. | ||
Zamboni M, Mazzali G, Fantin F, Rossi A, di Francesco V. Sarcopenic obesity: a new category of obesity in the elderly. Nutr Metab Cardiovasc Dis. 2008;18(5):388–395. | ||
Lee DC, Shook RP, Drenowatz C, Blair SN. Physical activity and sarcopenic obesity: definition, assessment, prevalence and mechanism. Future Sci OA. 2016;2(3):FSO127. | ||
Newman AB, Kupelian V, Visser M, et al. Sarcopenia: alternative definitions and associations with lower extremity function. J Am Geriatr Soc. 2003;51(11):1602–1609. | ||
Studenski SA, Peters KW, Alley DE, et al. The FNIH sarcopenia project: rationale, study description, conference recommendations, and final estimates. J Gerontol A Biol Sci Med Sci. 2014;69(5):547–558. | ||
Delmonico MJ, Harris TB, Lee JS, et al. Alternative definitions of sarcopenia, lower extremity performance, and functional impairment with aging in older men and women. J Am Geriatr Soc. 2007;55(5):769–774. | ||
Batsis JA, Mackenzie TA, Jones JD, Lopez-Jimenez F, Bartels SJ. Sarcopenia, sarcopenic obesity and inflammation: Results from the 1999-2004 National Health and Nutrition Examination Survey. Clin Nutr. 2016;35(6):1472–1483. | ||
Batsis JA, Mackenzie TA, Lopez-Jimenez F, Bartels SJ. Sarcopenia, sarcopenic obesity, and functional impairments in older adults: National Health and Nutrition Examination Surveys 1999-2004. Nutr Res. 2015;35(12):1031–1039. | ||
Roubenoff R. Sarcopenic obesity: the confluence of two epidemics. Obes Res. 2004;12(6):887–888. | ||
Baumgartner RN. Body composition in healthy aging. Ann N Y Acad Sci. 2000;904(1):437–448. | ||
Batsis JA, Mackenzie TA, Barre LK, Lopez-Jimenez F, Bartels SJ. Sarcopenia, sarcopenic obesity and mortality in older adults: results from the National Health and Nutrition Examination Survey III. Eur J Clin Nutr. 2014;68(9):1001–1007. | ||
Villareal DT, Banks M, Siener C, Sinacore DR, Klein S. Physical frailty and body composition in obese elderly men and women. Obes Res. 2004;12(6):913–920. | ||
Goodpaster BH, Carlson CL, Visser M, et al. Attenuation of skeletal muscle and strength in the elderly: The Health ABC Study. J Appl Physiol. 2001;90(6):2157–2165. | ||
Stephen WC, Janssen I. Sarcopenic-obesity and cardiovascular disease risk in the elderly. J Nutr Health Aging. 2009;13(5):460–466. | ||
Schrager MA, Metter EJ, Simonsick E, et al. Sarcopenic obesity and inflammation in the InCHIANTI study. J Appl Physiol. 2007;102(3):919–925. | ||
Baumgartner RN, Koehler KM, Gallagher D, et al. Epidemiology of sarcopenia among the elderly in New Mexico. Am J Epidemiol. 1998;147(8):755–763. | ||
Lima-Costa MF, Peixoto SV, Firmo JO. Validade da hipertensão arterial auto-referida e seus determinantes [Validity of self-reported hypertension and its determinants (the Bambuí study)]. Rev Saude Publica. 2004;38(5):637–642. Portuguese. | ||
Alonso A, Beunza JJ, Delgado-Rodríguez M, Martínez-González MA. Validation of self reported diagnosis of hypertension in a cohort of university graduates in Spain. BMC Public Health. 2005;5:94. | ||
Nishime EO, Cole CR, Blackstone EH, Pashkow FJ, Lauer MS. Heart rate recovery and treadmill exercise score as predictors of mortality in patients referred for exercise ECG. JAMA. 2000;284(11):1392–1398. | ||
Funghetto SS, Prestes J, Silva AO, et al. Interleukin-6 -174G/C gene polymorphism affects muscle damage response to acute eccentric resistance exercise in elderly obese women. Exp Gerontol. 2013;48(11):1255–1259. | ||
da Cunha Nascimento D, de Sousa NM, de Sousa Neto IV, et al. Classification of pro-inflammatory status for interleukin-6 affects relative muscle strength in obese elderly women. Aging Clin Exp Res. 2015;27(6):791–797. | ||
Prestes J, Tibana RA. Muscular static strength test performance and health: absolute or relative values? Revista da Associação Médica Brasileira. 2013;59(4):308–309. | ||
Frontera WR, Hughes VA, Fielding RA, Fiatarone MA, Evans WJ, Roubenoff R. Aging of skeletal muscle: a 12-yr longitudinal study. J Appl Physiol. 2000;88(4):1321–1326. | ||
Prestes J, da Cunha Nascimento D, Tibana RA, et al. Understanding the individual responsiveness to resistance training periodization. Age. 2015;37(3):9793. | ||
Ferrucci L, Penninx BW, Volpato S, et al. Change in muscle strength explains accelerated decline of physical function in older women with high interleukin-6 serum levels. J Am Geriatr Soc. 2002;50(12):1947–1954. | ||
Tanti JF, Ceppo F, Jager J, Berthou F. Implication of inflammatory signaling pathways in obesity-induced insulin resistance. Front Endocrinol. 2012;3:181. | ||
Kohrt WM, Holloszy JO. Loss of skeletal muscle mass with aging: effect on glucose tolerance. J Gerontol A Biol Sci Med Sci. 1995;50 Spec No:68–72. | ||
Donath MY, Shoelson SE. Type 2 diabetes as an inflammatory disease. Nat Rev Immunol. 2011;11(2):98–107. | ||
Gumucio JP, Mendias CL. Atrogin-1, MuRF-1, and sarcopenia. Endocrine. 2013;43(1):12–21. | ||
Tsushima Y, Nishizawa H, Tochino Y, et al. Uric acid secretion from adipose tissue and its increase in obesity. J Biol Chem. 2013;288(38):27138–27149. | ||
Johnson RJ, Nakagawa T, Sanchez-Lozada LG, et al. Sugar, uric acid, and the etiology of diabetes and obesity. Diabetes. 2013;62(10):3307–3315. | ||
Batsis JA, Germain CM, Vásquez E, Bartels SJ. Prevalence of weakness and its relationship with limitations based on the Foundations for the National Institutes for Health project: data from the Health and Retirement Study. Eur J Clin Nutr. 2016;70(10):1168–1173. |
 © 2018 The Author(s). This work is published and licensed by Dove Medical Press Limited. The full terms of this license are available at https://www.dovepress.com/terms.php and incorporate the Creative Commons Attribution - Non Commercial (unported, v3.0) License.
By accessing the work you hereby accept the Terms. Non-commercial uses of the work are permitted without any further permission from Dove Medical Press Limited, provided the work is properly attributed. For permission for commercial use of this work, please see paragraphs 4.2 and 5 of our Terms.
© 2018 The Author(s). This work is published and licensed by Dove Medical Press Limited. The full terms of this license are available at https://www.dovepress.com/terms.php and incorporate the Creative Commons Attribution - Non Commercial (unported, v3.0) License.
By accessing the work you hereby accept the Terms. Non-commercial uses of the work are permitted without any further permission from Dove Medical Press Limited, provided the work is properly attributed. For permission for commercial use of this work, please see paragraphs 4.2 and 5 of our Terms.