")
Back to Journals » Clinical Ophthalmology » Volume 14
The Impact of IOL Abbe Number on Polychromatic Image Quality of Pseudophakic Eyes
Authors Bradley A, Xu R, Wang H, Jaskulski M , Hong X, Brink N, Van Noy S
Received 1 October 2019
Accepted for publication 20 January 2020
Published 11 August 2020 Volume 2020:14 Pages 2271—2281
DOI https://doi.org/10.2147/OPTH.S233099
Checked for plagiarism Yes
Review by Single anonymous peer review
Peer reviewer comments 2
Editor who approved publication: Dr Scott Fraser
Arthur Bradley,1 Renfeng Xu,1,2 Huachun Wang,2 Matt Jaskulski,1 Xin Hong,3 Nicolette Brink,3 Stephen Van Noy3
1School of Optometry, Indiana University, Bloomington, IN 47405, USA; 2Department of Ophthalmology and Vision Science, University of Nebraska Medical Center, Omaha, NE 68198, USA; 3Alcon Research Laboratories, Fort Worth, TX 76134-2001, USA
Correspondence: Arthur Bradley
Indiana University, 800 E Atwater Ave, Bloomington, IN 47405, USA
Tel +1 812-855-2465
Fax +1 812-855-7045
Email [email protected]
Purpose: The human eye exhibits large amounts (2.5 diopters) of longitudinal chromatic aberration (LCA). Its impact on polychromatic image quality, however, has been shown experimentally and by computer modeling to be small or absent. We hypothesized that modest changes in pseudophakic LCA created by higher and lower Abbe number materials will have little or no impact on polychromatic image quality in pseudophakic eyes.
Materials and Methods: Using published chromatic and monochromatic aberration data from pseudophakic eyes and higher and lower Abbe number materials (37 and 55), we computed monochromatic point spread functions for 21 wavelengths across the visible spectrum. After weighting by either the RGB spectra of a liquid crystal display or by a flat white spectrum, they were weighted by the human spectral sensitivity function (Vλ) before being added to generate polychromatic PSFs.
Results: In the absence of monochromatic aberrations, the reduced LCA due to higher Abbe number intraocular lens (IOL) materials resulted in a reduction of 0.08 diopters in the mean defocus generated by LCA. At the retinal plane, the higher Abbe number pseudophakic model produced improvements in polychromatic modulation transfer functions (MTFs) similar to those generated by a 0.05 diopter reduction in spherical defocus. When monochromatic aberrations were added to make the model more representative of actual pseudophakic eyes, the differences in image quality became sub-threshold for human vision or disappeared completely.
Conclusion: The anticipated gains in polychromatic image quality from employing higher Abbe number IOL materials with reduced LCA do not materialize in plausible aberrated models of pseudophakic eyes.
Keywords: Abbe number, chromatic aberrations, IOL, image quality
Introduction
Unlike engineered optics that utilize combinations of positive and negative powered surfaces and materials of higher and lower chromatic dispersion1 to create approximately achromatic lens designs, all of the high powered optical surfaces in the human eye have positive power. The human eye, therefore, has significant chromatic aberration, with spherical refractive errors varying by approximately 2.5 diopters across the visible spectrum.2,3 In spite of this large magnitude of ocular longitudinal chromatic aberration (LCA), experimental studies report that polychromatic contrast sensitivity of phakic subjects4,5 and polychromatic image quality6 are only slightly reduced by ocular chromatic aberration. Furthermore, in the presence of typical or elevated levels of monochromatic aberrations, the drop in image quality and contrast sensitivity created by chromatic aberrations approaches zero,4–7 far less than expected from an aberration exceeding 2 diopters.8,9
Chromatic dispersion by the optical components of the human eye is similar from one eye to the next,2 creating little between-eye variability in longitudinal chromatic aberration.10 However, the diversity of polymers used in the manufacture of intraocular lenses (IOLs) create IOLs with significantly different levels of chromatic dispersion (eg, Abbe numbers ranging from 37–5511), which create measurably different levels of longitudinal chromatic aberration in pseudophakic eyes.12,13 In the absence of typical ocular monochromatic aberrations, higher Abbe numbers and the accompanying lower LCA can produce significantly higher polychromatic image quality,11,12 but in the presence of monochromatic aberrations pseudophakic polychromatic image quality was unaffected by Abbe number.12 Polychromatic contrast sensitivity (CS) of aberrated pseudophakic eyes has, however, been reported to increase by correcting LCA,14 and increase by reducing LCA with higher Abbe number IOLs.15 These varied optical and psychophysical results create some uncertainty about the possible benefits and costs of using high Abbe number materials in IOL designs.
The present study was designed to assess the impact of different levels of LCA present in pseudophakic eyes with and without representative levels of monochromatic aberrations, which vary significantly with pupil diameter.16 Consistent with earlier studies of phakic and pseudophakic eyes, differences in ocular chromatic aberration created by higher and lower IOL Abbe numbers have no detectable impact on polychromatic image quality in optically representative models of pseudophakic eyes.
Materials and Methods
Using published IOL parameters (Table 1 of Zhao and Mainster11) and commercial ray tracing software (Zemax, Kirkland, WA), the longitudinal chromatic aberration of an age-relevant model eye17 was computed for the natural lens case and with implanted +21 diopter IOLs made from materials with higher (55) and lower (37) Abbe numbers. Over the visible range (400–700 nm), LCA in our pseudophakic models was approximately 14% more (Abbe number = 37) and 20% less (Abbe number = 55) than LCA in our phakic model. Scaled versions of a chromatic model eye3 with 1.14 and 0.8 times the phakic LCA were used to define refractive state across the visible spectrum. Using the methods described by Ravikumar,6 monochromatic point spread functions (PSFs) were computed at each of 21 wavelengths across the visible spectrum for pseudophakic models containing the higher order monochromatic aberrations (HOA) of older eye corneas (HOA coefficients of a 6mm pupil diameter used for modeling from Wang et al, 2003A)18 added to the spherical aberrations of their IOLs,19 as well as for an older phakic eye model (HOA coefficients of a 6mm pupil diameter used for modeling from Wang et al, 2003B).20 Models with representative levels of monochromatic aberrations did not include the signed mean HOAs, because they are typically zero or close to zero.16,18,20 Instead, we employed two models that included either the mean absolute Zernike coefficients (3rd through 6th order), or models that used the signed mean +1 or +2 standard deviations.
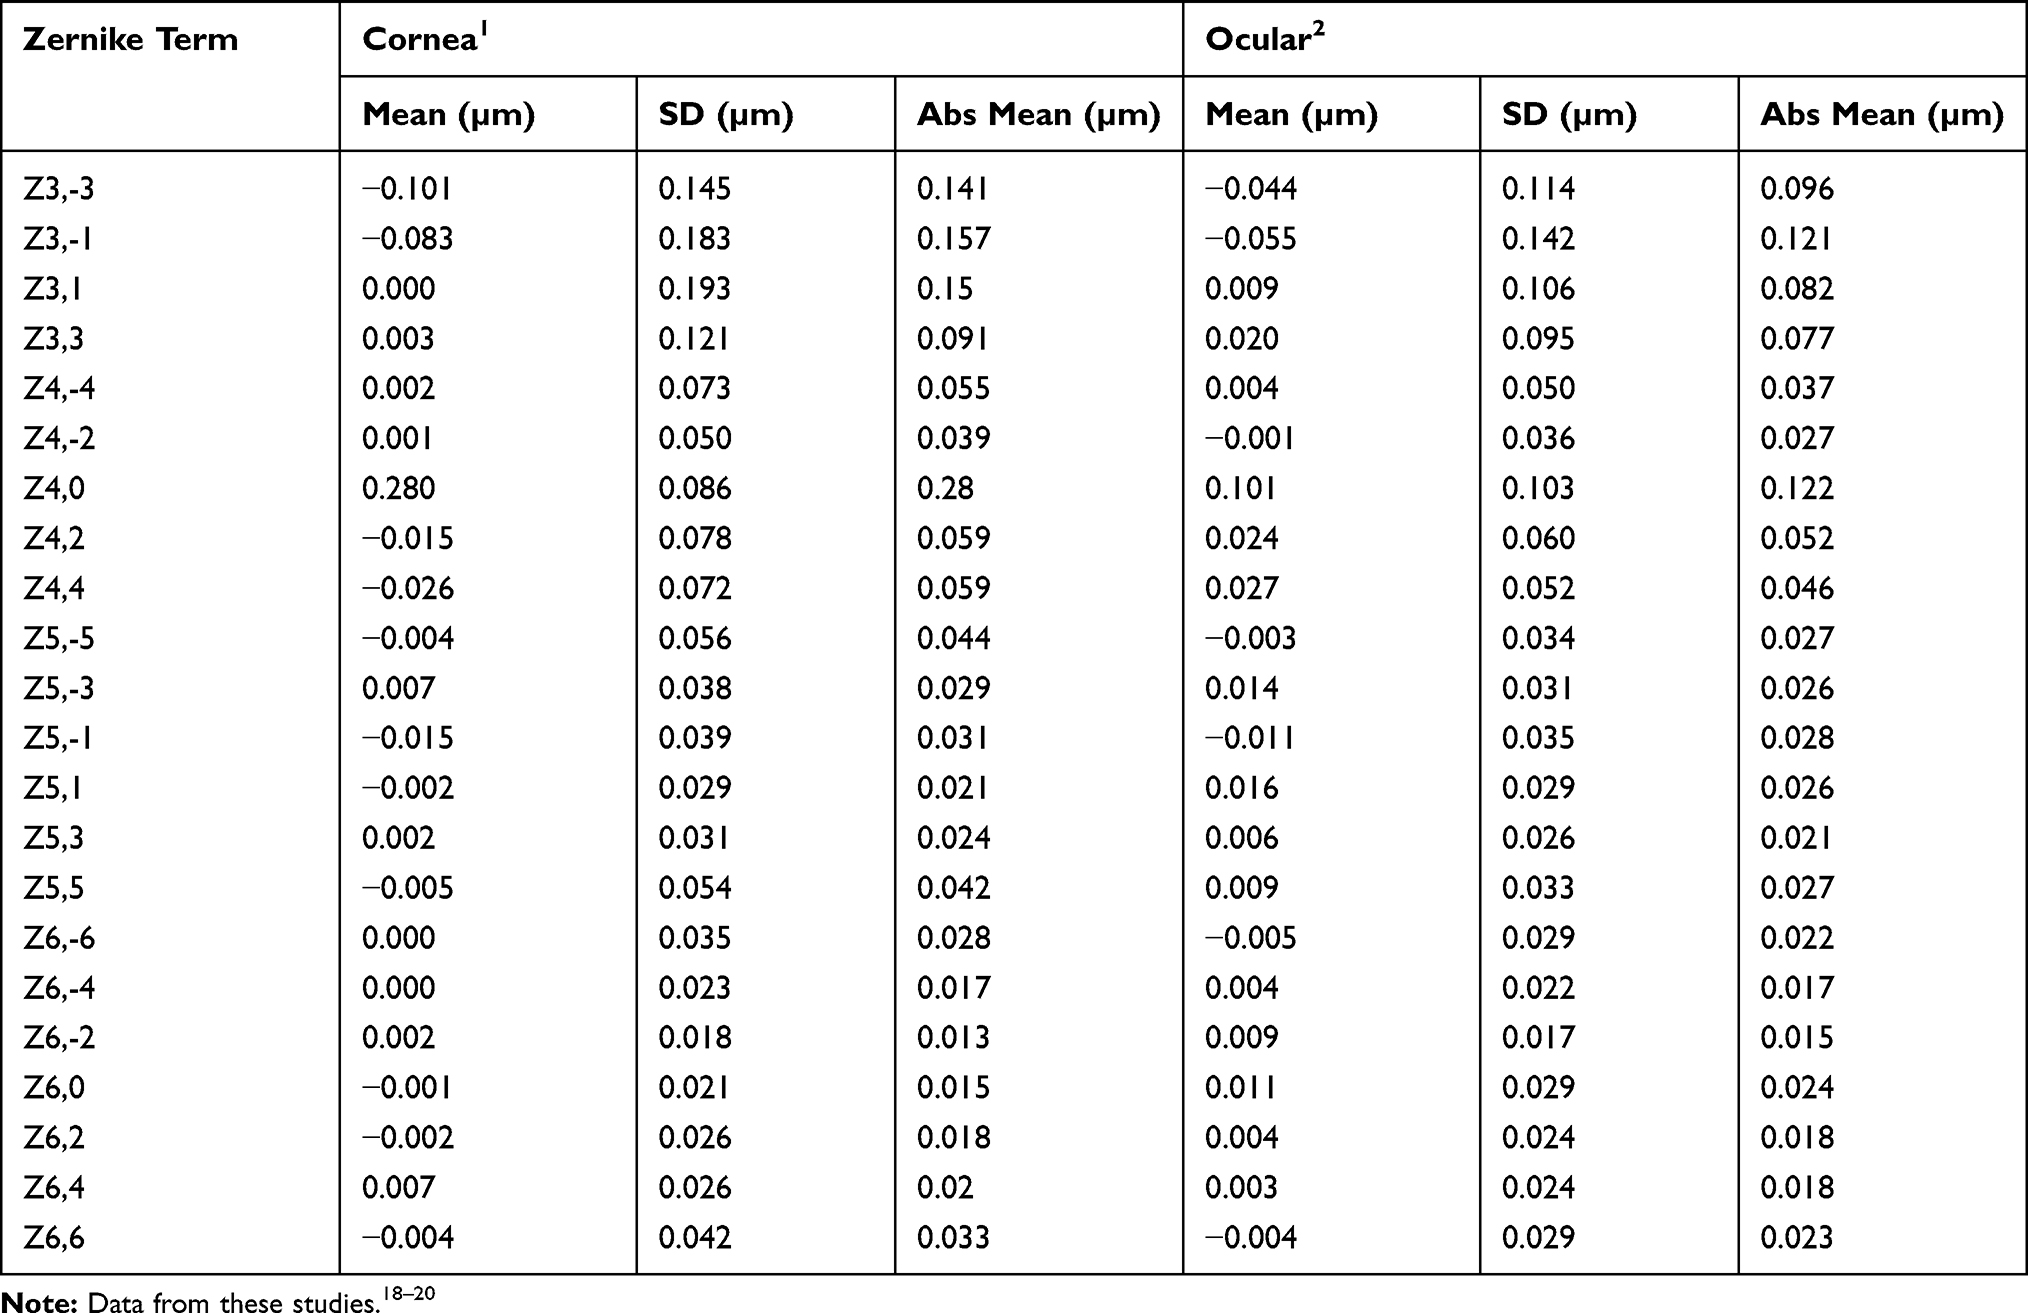 |
Table 1 Zernike Coefficients Used in Our Modeling |
Polychromatic images of two targets (Figure 1) were computed. The colored picture of balloons in flight (Figure 1A) was represented by the triplet RGB spectra used to create colored images on electronic displays (Figure 1C), and the white logMAR chart was represented by either the same RGB spectra or a flat white spectrum with equal radiance at each wavelength. Calculations were performed for a range of Stiles Crawford Effect apodized pupil diameters (3.5mm-6mm). The polychromatic RGB and flat white PSFs were computed by the linear sum of each monochromatic PSF after being weighted by the radiance spectrum of the source (flat white, or each of the RGB spectra), and by the spectral sensitivity of the human visual system21 (Figure 1C). For example, at 400 nm, where the defocus is approximately 2 diopters, the visual sensitivity is 0.0025, and therefore the 2 diopter defocused 400 nm PSFs were weighted by 0.25%, whereas any defocus at 555nm was weighted by 100%, or equivalently the 555nm PSFs contribute 400x more light to the polychromatic images than does the 400nm PSFs. Polychromatic images were simulated by convolving the polychromatic PSF with the stimuli, and polychromatic MTFs were computed by Fourier methods. A single flat white spectrum polychromatic image was computed, but three polychromatic images, one for each of the RGB polychromatic spectra, were computed for the RGB stimuli.
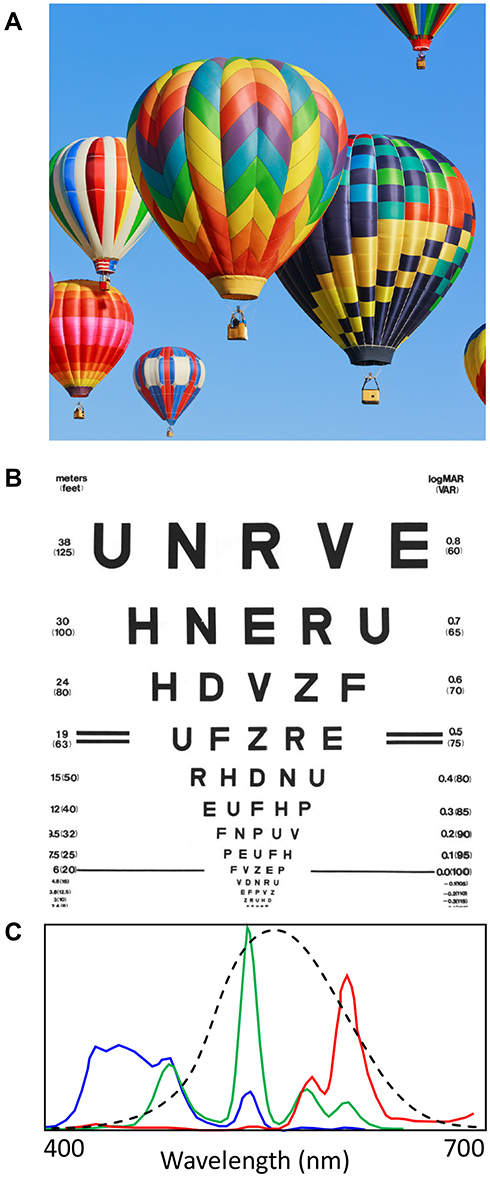 |
Figure 1 Two source images used for optical modeling. (A) A 3.4 x 3.4 degree colored image represented by three color planes (RGB). (B) A white light image of a 5 x 5 degree logMAR chart that can be represented as three separate RGB spectra (colored lines in C) or a single flat white spectrum. The human spectral sensitivity curve is plotted in (C) (black dashed line). |
Results
Impact of Spectral Sensitivity on the Effect of LCA
Although LCA can exceed 2.5 diopters across the full visible range (400–800 nm),2,3 the maximum defocus for a phakic eye focused at 550 nm is less than 2D, with a mean defocus of 0.51D. After weighting by the human spectral sensitivity function (CIE photopic spectral sensitivity, http://www.cvrl.org, Figure 1C), the mean defocus is reduced to 0.21D. The visually weighted average defocus experienced by the higher and lower Abbe number pseudophakic eyes is 0.17D and 0.25D, respectively, a difference of 0.08D.
The impact of the spectral weighting imposed by human vision (Figure 1C) can be seen by comparing the separate RGB images (Figures 2 and 3) created by the highly colored and the black and white stimuli displayed on a typical liquid crystal RGB display. The three left-most images show individually the polychromatic Blue, Green and Red simulated images, and the right-most image is the linear sum of these three (as it is on a colored RGB display). The significant LCA present in this phakic model (5mm pupil diameter) contributes to the obvious blur in the Blue image, and also to a lesser extent in the Red images in Figure 2. The Green images appear well focused, because the model was made to be focused at 550nm and most of the energy within the green spectrum (Figure 1C) is concentrated near to this focused wavelength. The impact of LCA on the full RGB images can just be detected in the right panels. After Vλ weighting is applied (Figure 3), the blur within the Blue and Red polychromatic images is greatly reduced because the images are now dominated by the more central and better focused wavelengths within each of the Red and Blue spectra (Figure 1C). When the RG&B images are combined, blur is difficult to detect in either image (Figure 3 right panels).
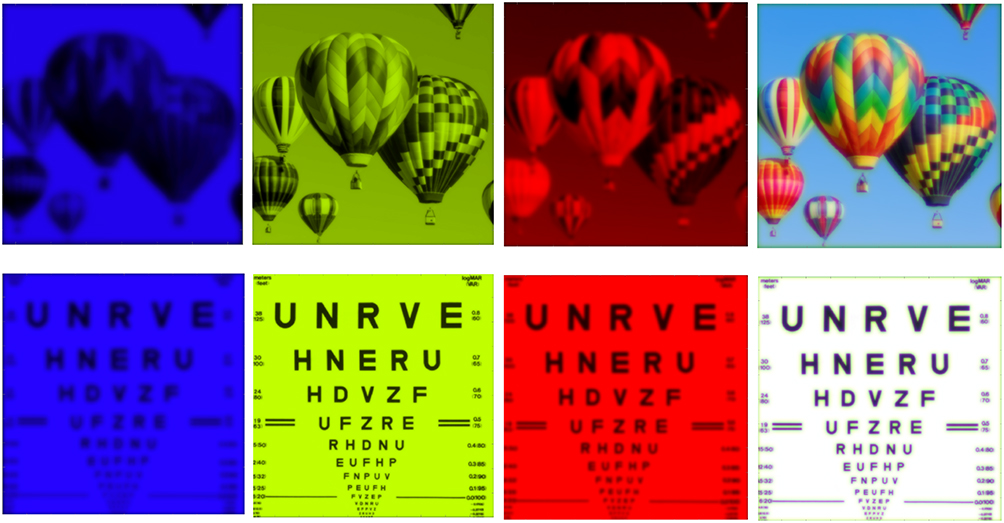 |
Figure 2 Examples of simulated RGB retinal images for a 5mm pupil diameter phakic eye model lacking monochromatic aberrations. Top row: images of a highly colored RGB object subtending 3.4 degrees. Bottom row: RGB images of a white object subtending 5 degrees (logMAR 0.00 letters subtend 5 arc minutes). Model included LCA of a phakic eye, but without Vλ spectral weighting applied to individual monochromatic PSFs. |
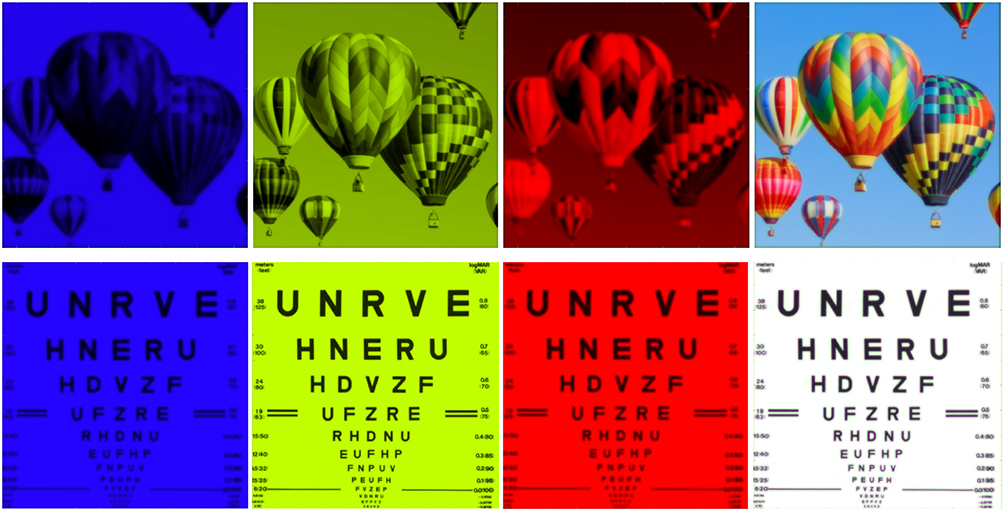 |
Figure 3 Examples of simulated retinal images with CRT spectra after Vλ weighting has been applied to each monochromatic PSF. Top row a highly colored object subtending 3.4 degrees, and bottom row a white object subtending 5 degrees of visual angle (logMAR 0.00 letters subtend 5 arc minutes). Model includes LCA of a phakic eye model, zero monochromatic aberrations. |
When visualizing these computed polychromatic images, the observer’s optical imperfections will further degrade each image, but these low pass filtering of the observer’s eye will be the same when viewing images in Figures 2 and 3. Notably, the subtle image differences shown in Figures 2 and 3 are difficult to quantify visually. Quantification of the resulting impact of LCA on polychromatic image quality for RGB images can, however, be obtained from the polychromatic RGB MTFs. Figure 4 shows these RGB polychromatic MTFs generated by three models. When only diffraction is present (dotted lines), the shorter wavelengths that make up the blue image provide superior diffraction-limited image quality (blue dotted lines). When LCA is added, the large defocus present at short wavelengths degrades the blue MTF more than the red and much more than the green (dashed lines), but when Vλ weighting is included, the LCA-induced demodulation of the Red and Blue images is reduced resulting in increased image modulation (solid lines). Although Vλ weighting improves the image quality of the polychromatic Blue and Red images, LCA still significantly lowers the MTFs relative to the well-focused polychromatic Green MTF. However, when the three are added together (Figure 3), the blur in the resulting RGB images is difficult to detect by visual inspection largely because the better focused Green image dominates our perception because it contains more light because of the observer’s Vλ weighting.
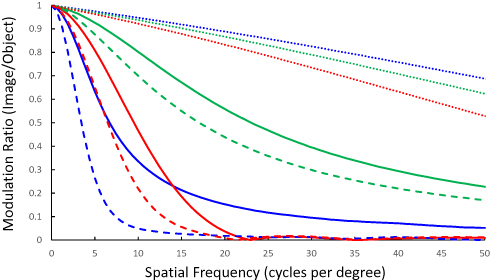 |
Figure 4 MTFs showing the impact of phakic LCA on polychromatic image quality for a 5mm pupil model. Polychromatic RGB images from a CRT display (line color represents display color) created with a model containing only diffraction (dotted lines); diffraction + LCA (dashed lines); diffraction + LCA + Vλλ weighting (solid lines). |
The MTFs in Figure 5 show flat white spectrum polychromatic image quality in the presence of LCA and Vλ weighting for three model eyes, one with typical phakic levels of LCA (red dashed lines), one pseudophakic model with slightly elevated LCA due to lower Abbe number (LCA=1.14 x phakic, red dotted line), and one pseudophakic model with reduced LCA due to a higher Abbe number (LCA= 0.8 x phakic, red solid line). MTFs computed for 4.5 and 3.5 mm pupil diameters (fairly typically of older eyes in interior lighting environments set to low photopic or high mesopic levels22–24) are shown in Figure 5A and B, respectively. For comparison, monochromatic MTFs (black lines) created by diffraction + defocus are shown for zero, 0.1D, 0.15D, 0.2D, and 0.25 diopters of defocus. These plots confirm the earlier report by Bradley25 that the impact of LCA in human eyes is typically less than that generated by ¼ D of pure defocus. Significantly, the MTFs generated by the pseudophakic models with elevated (1.14 x phakic) and reduced (0.8 x phakic) LCA differ from each other by less than the MTF differences produced by 0.05D.
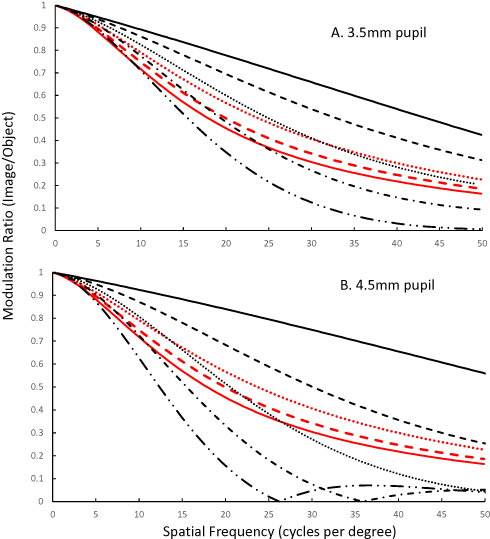 |
Figure 5 MTFs showing the impact of LCA on flat white polychromatic image quality for 3.5 (A) and 4.5mm (B) pupil models. Polychromatic images are generated for models containing diffraction and LCA with Vλ weighted spectra. Modulation ratios are plotted for a polychromatic phakic model (red dashed lines), and pseudophakic models with either a higher Abbe number IOL (LCA = 80% of the phakic model, red dotted lines) or a lower Abbe number IOL (LCA= 114% of a typical phakic eye, solid red lines). For comparison, monochromatic MTFs for defocus of 0.00, 0.1D, 0.15D, 0.2D and 0.25 D are plotted as solid, dashed, dotted, dash-dot, and dash-double dot black lines. |
Polychromatic Image Quality in Presence of LCA and Monochromatic Aberrations
In the above section, the impact of LCA is evaluated for model eyes containing only LCA and diffraction. In this section, the models include mean absolute values of monochromatic aberrations as a series of Zernike coefficients (up to 6th order). The phakic model includes mean absolute values of HOAs observed in phakic older eyes,20 and the pseudophakic models employed mean absolute values of anterior corneal aberrations18 in combination with the published spherical aberration levels of the lower Abbe number AMO Tecnis IOL (−0.27 microns for a 6mm pupil) and the higher Abbe number Alcon Clareon IOL (−0.20 microns for a 6mm pupil).19 These pseudophakic models assume no IOL tilt or decentration. For each model, a thorough focus analysis was performed to identify the spherical defocus value that produced peak image quality (defined by maximum Strehl Ratio and maximum Light in the Bucket26). These optimum polychromatic RGB images of the balloons and the flat white spectrum images of the logMAR chart were calculated for the two pseudophakic and phakic models with 3.5mm (Figure 6) and 4.5 mm (Figure 7) pupil diameters. Differences between the images generated by each model are not easily visible by inspection.
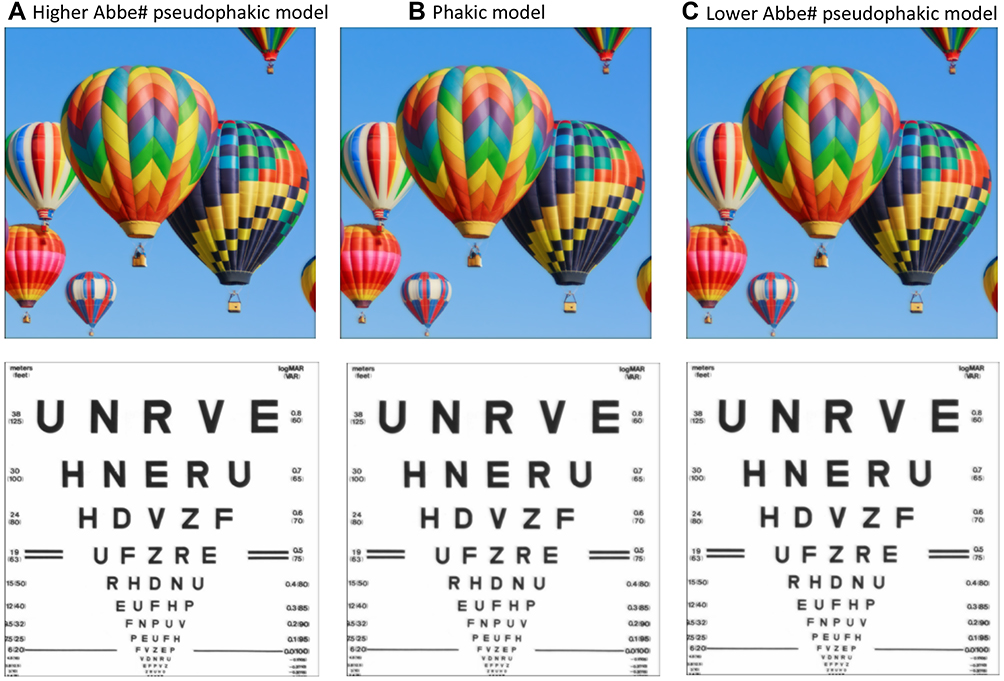 |
Figure 6 Polychromatic RGB (top row) and flat spectrum white (bottom row) images computed for 3.5mm pupils. Pseudophakic models with higher Abbe number (LCA=80% of phakic, A), and lower Abbe number (LCA = 114% of a phakic eye, C) are compared with the phakic model (B). Pseudophakic models include diffraction, LCA, corneal monochromatic aberrations, and spherical aberration of IOL. The phakic model includes monochromatic HOA from older phakic eyes. |
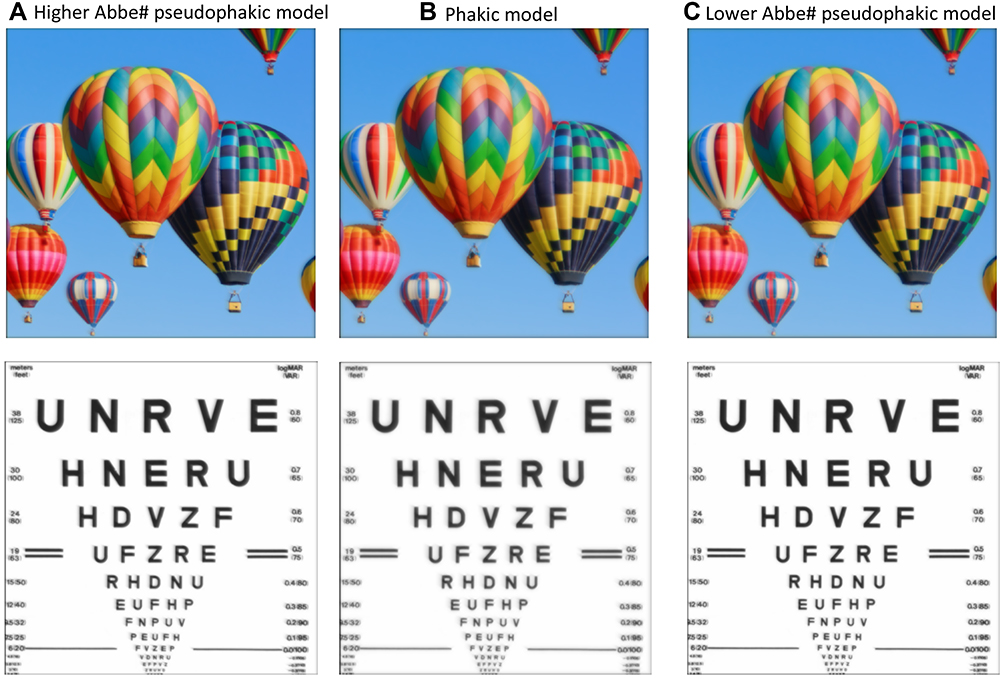 |
Figure 7 Polychromatic RGB (top row) and flat spectrum white (bottom row) images computed for 4.5mm pupils. Pseudophakic models with higher Abbe number (LCA=80% of phakic, A), and lower Abbe number (LCA = 114% of a phakic eye, C) are compared with the phakic model (B). Pseudophakic models include diffraction, LCA, corneal monochromatic aberrations, and spherical aberration of IOL. The phakic model includes monochromatic HOA from older phakic eyes. |
Flat white spectrum polychromatic MTFs from the same two pseudophakic models are compared with those from the phakic model for 3.5, 4.5, and 6.0 mm pupils in Figure 8. The similarity between the three models is clear (overlapping symbols), and for each pupil size the same pattern is revealed: polychromatic MTFs are similar to those produced by 0.25D of pure defocus below 15 cpd and superior to those produced by 0.25 D at spatial frequencies above 20 cpd. For each pupil size, the higher Abbe number and lower SA model produces slightly higher MTF values. Average MTF ratios for these two pseudophakic models for spatial frequencies below 30 cpd are approximately 0.84–0.88 (MTF lower abbe number/MTF higher Abbe number). These MTF ratios can be interpreted by observing that the MTF ratios for monochromatic defocus of 0.25D/0.2D range between 0.8 (3.5mm pupil) to 0.7 (6mm pupil) for spatial frequencies below the defocused MTF zeros, revealing that the differences between the two pseudophakic models would be generated by defocus of <1/20 diopter.
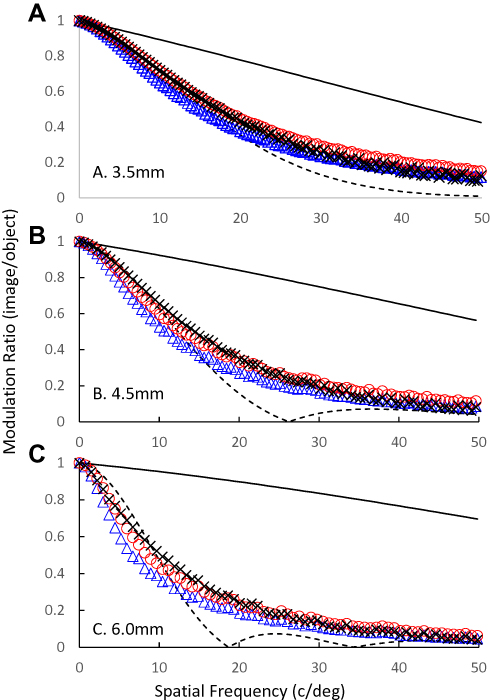 |
Figure 8 Flat white spectrum polychromatic MTFs for 3.5mm (A), 4.5mm (B), and 6.0mm (C) pupils diameters of pseudophakic models containing elevated LCA (lower Abbe number, LCA=1.14 x phakic, blue triangles) and reduced LCA (higher Abbe number, LCA=0.8 x phakic, red circles) and HOAs contributed by the cornea and the IOL. Polychromatic MTFs for the phakic model (black Xs) include published ocular HOAs for older phakic eyes. Monochromatic diffraction limited (black line) and 0.25D defocused (black dashed line) are included for comparison. |
The above analysis of pseudophakic models containing diffraction, LCA and the mean absolute valued monochromatic aberrations is representative of phakic and pseudophakic eyes, but it affords the pseudophakic models an advantage in that we have included the mean corneal spherical aberration of 0.28 microns (6mm pupils). The higher Abbe number pseudophakic model is designed specifically to correct this average level of SA (eg, Tecnis with −0.27 microns of C40) and the lower Abbe number pseudophakic model is designed to correct most of this corneal SA (eg, Clareon with −0.20 microns of C40). However, levels of SA vary greatly between individual eyes, as do other higher order aberrations.18,20,27 Therefore, we adopted a second approach to model representative pseudophakic eyes with models that included the signed mean + 1SD or mean + 2SD of corneal HOAs.18 Flat white spectrum polychromatic MTFs for pseudophakic eyes fit with higher and lower Abbe number IOLs containing mean + 1SD or mean + 2SD of monochromatic HOAs were computed, and from these MTFs, the AreaMTF metric of image quality was calculated.26 This metric quantifies the area between the radially averaged optical MTF and the neural contrast thresholds, which is an integral of the visible contrast within the image. Any image contrast outside of these limits either cannot be generated or seen. To capture the through focus characteristics of these models, we plot the image quality AreaMTF metric as a function of defocus (0.1D increments) for 3.5 and 4.5 mm pupils (Figure 9). These results emphasize that for eyes with HOAs not equal to the mean (the majority of eyes), the Abbe number and spherical aberration differences between our two pseudophakic models have little influence on polychromatic image quality, which is dominated by the magnitude of the HOAs (note the drop in peak IQ as pupil size increases), and level of defocus. Also, the width of the through focus plots for these aberrated pseudophakic models reveal no obvious differences in depth of focus associated with small increases or decreases in LCA.
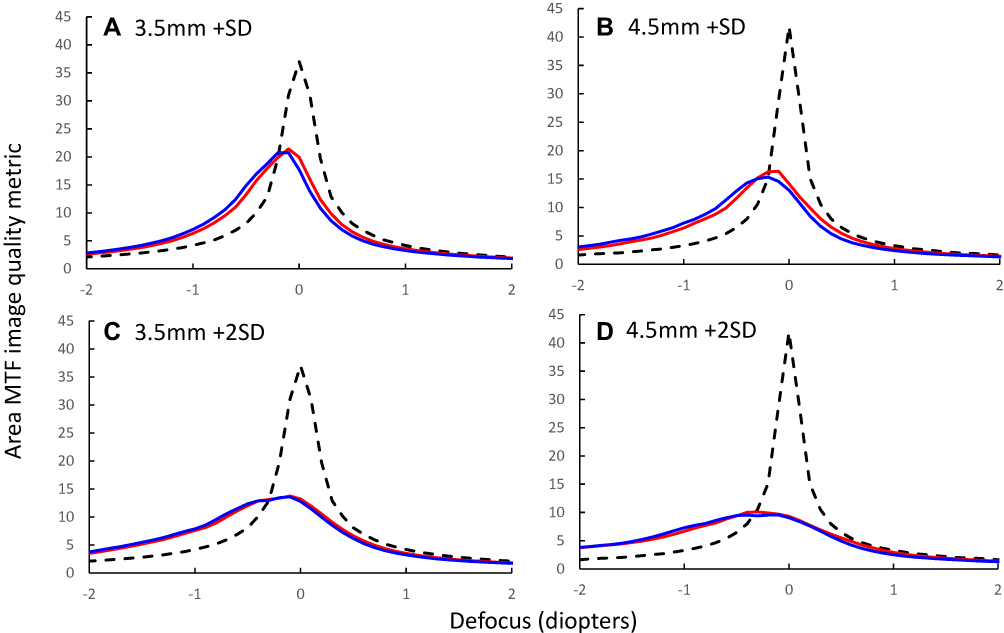 |
Figure 9 Through focus plots of the polychromatic image quality metric AreaMTF for 3.5mm (A and C) and 4.5mm (B and D) pupil diameters of pseudophakic models with elevated LCA (1.14x phakic, blue lines) and reduced LCA (0.8 x phakic, red lines) with 2 different levels of monochromatic HOAs: (A and B) Mean+SD corneal HOAs + IOL spherical aberration; (C and D) Mean +2SD corneal HOAs + IOL spherical aberration. Black dashed lines show equivalent calculations for diffraction-limited models. |
When coma due to normal levels of IOL decentration and astigmatism due to typical levels of IOL tilt28 were included in the models, polychromatic image quality declined, but again, no differences were observed between the higher and lower Abbe number pseudophakic models.
Discussion
Because of reduced visual sensitivity at the spectral margins (a product of the wavelength specificity of optical transparency and photopigment absorption21), and the ubiquitous presence of monochromatic aberrations (both high and low order16), the impact of LCA on polychromatic image quality in a typical eye is small and comparable to that produced by <0.25D of defocus25 (Figures 2–4 and 8). Its effect is even smaller (Figures 8 and 9) as aberration levels increase.4–6,12 Contrary to initial speculation,29 pseudophakic eyes with elevated LCA exhibit polychromatic image quality that is indistinguishable from that of older aberrated phakic eyes and pseudophakic eyes with lower levels of LCA (Figures 6–9). Pseudophakic models including HOAs (with or without IOL tilt and decentration, data not shown) revealed an absence of any clinically significant impact of Abbe number in pseudophakic eyes fit with currently available IOLs. Maximum differences between these higher and lower Abbe number models were approximately equivalent to the image changes produced by <1/20 diopter of defocus (Figure 8), and for many aberrated pseudophakic eyes, the differences disappear completely (Figure 9). This 1/20 D value has been computed for a typical pseudophakic eye with a +21D IOL power, and we might anticipate a slightly larger effect with high power IOLs. For example, Nakajima et al12 report 10% higher LCA values in eyes fit with +27D lenses, and Song et al30 report slightly larger effects of LCA in the higher powered IOLs.
These results highlight two questions. First, the somewhat surprising observation that a 2.5D aberration has little or no impact on image quality and vision was first addressed by Campbell and Gubisch in 19674 who attributed the result to ocular spherical aberration. Their hypothesis was confirmed experimentally,5 and with optical modeling,6 and demonstrated most dramatically in the study by McLellan et al7 who argue that monochromatic aberrations are “the eye’s defense against chromatic blur”. The explanation for how monochromatic aberrations can mask or remove the impact of LCA is simple. In the absence of monochromatic aberrations, LCA will defocus the full pupil for non-focused wavelengths. However, in the presence of monochromatic aberrations, some parts of the pupil will actually have improved focus due to LCA. For example, in an eye that is paraxially focused for 550 nm, if positive spherical aberration is added, LCA will defocus long wavelengths in the pupil center but refocus them at the pupil margins.
The second issue raised by our analysis examines the visual impact of small amounts of image degradation. The polychromatic MTFs for the aberration-free and aberrated models (Figures 5 and 8) reveal small, but obvious differences in the polychromatic MTFs generated by models with different levels of LCA. However, upon visual inspection, the polychromatic images generated by the same models appear indistinguishable (Figures 3, 6 and 7). There are two bases for this observation. First, typical defocus thresholds are about 0.25 diopters,31,32 and therefore although the polychromatic images are just noticeably blurred compared to the original objects (compare Figure 1 with 6 and 7), the differences between models with different levels of LCA (approximately equivalent to <1/20D defocus) are <10% of the defocus threshold. Also, the average MTF ratios (lower Abbe number/higher Abbe number models) are approximately 0.8 or higher (Figures 8 and 9) or, equivalently, polychromatic image contrast in the higher Abbe number model is between 25% and 0% higher than in the lower Abbe number model. Psychophysical studies of contrast discrimination report contrast increment thresholds of approximately ≥30% for high spatial frequency and low contrast stimuli,33,34 indicating that the image contrast differences produced by the different pseudophakic models are subthreshold, which explains the perceptual equivalence of the images generated by these different models (Figures 6 and 7).
The failure to achieve meaningful improvements in polychromatic image quality in eyes implanted with higher Abbe number IOLs raises the issue of other consequences of IOL Abbe number. For example, the higher Abbe number materials used in IOLs achieve lower dispersion by using lower refractive index materials (eg, n555 = 1.477) than the more dispersive materials used in lower Abbe number IOLs (eg, n555 = 1.555). Reduced lens curvatures and thicknesses are possible if high refractive index materials are used,12 whereas lower refractive indices require higher lens curvatures, and for a given lens diameter this results in a thicker lens. To avoid excessive thickness, optic diameters with low refractive index materials can be reduced,35 which can increase dysphotopsias produced by peripheral light sources. Also, the differences in polychromatic image quality generated by altering IOL Abbe number are likely to be much smaller than those generated by other defocus sources. For example, recent data indicate that about 28% of pseudophakic eyes experience a residual spherical refractive error >0.5D,36 which has been attributed to challenges of estimating post-op anterior chamber depth37 and post-operative IOL axial instabilities,38 which can vary with both IOL design39 and surgical procedure.38 Unlike the absence of a measurable visual impact of changing IOL Abbe number,15,40 the larger spherical refractive errors attributable IOL axial power and position errors produce significant reductions in visual acuity.41
Disclosure
X Hong, N Brink, and S Van Noy are employees of Alcon Laboratories Inc. A Bradley reports grants, personal fees from Alcon, during the conduct of the study. The authors report no other conflicts of interest in this work.
References
1. Kingslake R, Johnson RB. Lens Design Fundamentals. Academic Press; 2009.
2. Atchison DA, Smith G. Chromatic dispersions of the ocular media of human eyes. J Opt Soc Am A Opt Image Sci Vis. 2005;22(1):29–37. doi:10.1364/JOSAA.22.000029
3. Thibos LN, Ye M, Zhang X, Bradley A. The chromatic eye: a new reduced-eye model of ocular chromatic aberration in humans. Appl Opt. 1992;31(19):3594–3600. doi:10.1364/AO.31.003594
4. Campbell FW, Gubisch RW. The effect of chromatic aberration on visual acuity. J Physiol. 1967;192(2):345–358. doi:10.1113/jphysiol.1967.sp008304
5. Yoon GY, Williams DR. Visual performance after correcting the monochromatic and chromatic aberrations of the eye. J Opt Soc Am A Opt Image Sci Vis. 2002;19(2):266–275. doi:10.1364/JOSAA.19.000266
6. Ravikumar S, Thibos LN, Bradley A. Calculation of retinal image quality for polychromatic light. J Opt Soc Am A Opt Image Sci Vis. 2008;25(10):2395–2407. doi:10.1364/JOSAA.25.002395
7. McLellan JS, Marcos S, Prieto PM, Burns SA. Imperfect optics may be the eye’s defence against chromatic blur. Nature. 2002;417(6885):174–176. doi:10.1038/417174a
8. Atchison DA, Woods RL, Bradley A. Predicting the effects of optical defocus on human contrast sensitivity. J Opt Soc Am A Opt Image Sci Vis. 1998;15(9):2536–2544. doi:10.1364/JOSAA.15.002536
9. Campbell FW, Green DG. Optical and retinal factors affecting visual resolution. J Physiol. 1965;181(3):576–593. doi:10.1113/jphysiol.1965.sp007784
10. Howarth PA, Zhang XX, Bradley A, Still DL, Thibos LN. Does the chromatic aberration of the eye vary with age? J Opt Soc Am A. 1988;5(12):2087–2092. doi:10.1364/JOSAA.5.002087
11. Zhao H, Mainster MA. The effect of chromatic dispersion on pseudophakic optical performance. Br J Ophthalmol. 2007;91(9):1225–1229. doi:10.1136/bjo.2007.118745
12. Nakajima M, Hiraoka T, Yamamoto T, et al. Differences of longitudinal chromatic aberration (LCA) between eyes with intraocular lenses from different manufacturers. PLoS One. 2016;11(6):e0156227. doi:10.1371/journal.pone.0156227
13. Perez-Merino P, Dorronsoro C, Llorente L, Duran S, Jimenez-Alfaro I, Marcos S. In vivo chromatic aberration in eyes implanted with intraocular lenses. Invest Ophthalmol Vis Sci. 2013;54(4):2654–2661. doi:10.1167/iovs.13-11912
14. Artal P, Manzanera S, Piers P, Weeber H. Visual effect of the combined correction of spherical and longitudinal chromatic aberrations. Opt Express. 2010;18(2):1637–1648. doi:10.1364/OE.18.001637
15. Negishi K, Ohnuma K, Hirayama N, Noda T. Policy-based medical services network study group for intraocular L, Refractive S. Effect of chromatic aberration on contrast sensitivity in pseudophakic eyes. Arch Ophthalmol. 2001;119(8):1154–1158. doi:10.1001/archopht.119.8.1154
16. Thibos LN, Hong X, Bradley A, Cheng X. Statistical variation of aberration structure and image quality in a normal population of healthy eyes. J Opt Soc Am a Opt Image Sci Vis. 2002;19(12):2329–2348. doi:10.1364/JOSAA.19.002329
17. Navarro R. Adaptive model of the aging emmetropic eye and its changes with accommodation. J Vis. 2014;14(13):21. doi:10.1167/14.13.21
18. Wang L, Dai E, Koch DD, Nathoo A. Optical aberrations of the human anterior cornea. J Cataract Refract Surg. 2003;29(8):1514–1521. doi:10.1016/S0886-3350(03)00467-X
19. Taketani F, Hara Y. Characteristics of spherical aberrations in 3 aspheric intraocular lens models measured in a model eye. J Cataract Refract Surg. 2011;37(5):931–936. doi:10.1016/j.jcrs.2010.12.044
20. Wang L, Koch DD. Ocular higher-order aberrations in individuals screened for refractive surgery. J Cataract Refract Surg. 2003;29(10):1896–1903. doi:10.1016/S0886-3350(03)00643-6
21. Sharpe LT, Stockman A, Jagla W, Jagle H. A luminous efficiency function, V*(lambda), for daylight adaptation. J Vis. 2005;5(11):948–968. doi:10.1167/5.11.3
22. Cardona G, Lopez S. Pupil diameter, working distance and illumination during habitual tasks. Implications for simultaneous vision contact lenses for presbyopia. J Optom. 2016;9(2):78–84. doi:10.1016/j.optom.2015.06.005
23. Hutz WW, Eckhardt HB, Rohrig B, Grolmus R. Reading ability with 3 multifocal intraocular lens models. J Cataract Refract Surg. 2006;32(12):2015–2021. doi:10.1016/j.jcrs.2006.08.029
24. Johansson B, Sundelin S, Wikberg-Matsson A, Unsbo P, Behndig A. Visual and optical performance of the Akreos Adapt Advanced Optics and Tecnis Z9000 intraocular lenses: Swedish multicenter study. J Cataract Refract Surg. 2007;33(9):1565–1572. doi:10.1016/j.jcrs.2007.05.025
25. Bradley A, Glenn A. Fry Award Lecture 1991: perceptual manifestations of imperfect optics in the human eye: attempts to correct for ocular chromatic aberration. Optom Vis Sci. 1992;69(7):515–521. doi:10.1097/00006324-199207000-00002
26. Thibos LN, Hong X, Bradley A, Applegate RA. Accuracy and precision of objective refraction from wavefront aberrations. J Vis. 2004;4(4):329–351. doi:10.1167/4.4.9
27. Holladay JT, Piers PA, Koranyi G, van der Mooren M, Norrby NE. A new intraocular lens design to reduce spherical aberration of pseudophakic eyes. J Refract Surg. 2002;18(6):683–691.
28. McKelvie J, McArdle B, McGhee C. The influence of tilt, decentration, and pupil size on the higher-order aberration profile of aspheric intraocular lenses. Ophthalmology. 2011;118(9):1724–1731. doi:10.1016/j.ophtha.2011.02.025
29. Nagata T, Kubota S, Watanabe I, Aoshima S. [Chromatic aberration in pseudophakic eyes]. Nihon Ganka Gakkai Zasshi. 1999;103(3):237–242. Japanese.
30. Song H, Yuan X, Tang X. Effects of intraocular lenses with different diopters on chromatic aberrations in human eye models. BMC Ophthalmol. 2016;16:9. doi:10.1186/s12886-016-0184-6
31. Atchison DA, Charman WN, Woods RL. Subjective depth-of-focus of the eye. Optom Vis Sci. 1997;74(7):511–520. doi:10.1097/00006324-199707000-00019
32. Campbell F. The depth of field of the human eye. J Mod Optic. 1957;4(4):157–164.
33. Bradley A, Ohzawa I. A comparison of contrast detection and discrimination. Vision Res. 1986;26(6):991–997. doi:10.1016/0042-6989(86)90155-0
34. Meese TS, Georgeson MA, Baker DH. Binocular contrast vision at and above threshold. J Vis. 2006;6(11):1224–1243. doi:10.1167/6.11.7
35. Das KK, Werner L, Collins S, Hong X. In vitro and schematic model eye assessment of glare or positive dysphotopsia-type photic phenomena: comparison of a new material IOL to other monofocal IOLs. J Cataract Refract Surg. 2019;45(2):219–227. doi:10.1016/j.jcrs.2018.09.017
36. Lundstrom M, Dickman M, Henry Y, et al. Risk factors for refractive error after cataract surgery: analysis of 282 811 cataract extractions reported to the European Registry of Quality Outcomes for cataract and refractive surgery. J Cataract Refract Surg. 2018;44(4):447–452. doi:10.1016/j.jcrs.2018.01.031
37. Norrby S. Sources of error in intraocular lens power calculation. J Cataract Refract Surg. 2008;34(3):368–376. doi:10.1016/j.jcrs.2007.10.031
38. Stifter E, Menapace R, Luksch A, Neumayer T, Sacu S. Anterior chamber depth and change in axial intraocular lens position after cataract surgery with primary posterior capsulorhexis and posterior optic buttonholing. J Cataract Refract Surg. 2008;34(5):749–754. doi:10.1016/j.jcrs.2007.12.035
39. Lane S, Collins S, Das KK, et al. Evaluation of intraocular lens mechanical stability. J Cataract Refract Surg. 2019;45(4):501–506. doi:10.1016/j.jcrs.2018.10.043
40. Caporossi A, Martone G, Casprini F, Rapisarda L. Prospective randomized study of clinical performance of 3 aspheric and 2 spherical intraocular lenses in 250 eyes. J Refract Surg. 2007;23(7):639–648. doi:10.3928/1081-597X-20070901-02
41. Gyldenkerne A, Ivarsen A, Hjortdal J. Optical and visual quality after small-incision lenticule extraction. J Cataract Refract Surg. 2019;45(1):54–61. doi:10.1016/j.jcrs.2018.08.026
 © 2020 The Author(s). This work is published and licensed by Dove Medical Press Limited. The full terms of this license are available at https://www.dovepress.com/terms.php and incorporate the Creative Commons Attribution - Non Commercial (unported, v3.0) License.
By accessing the work you hereby accept the Terms. Non-commercial uses of the work are permitted without any further permission from Dove Medical Press Limited, provided the work is properly attributed. For permission for commercial use of this work, please see paragraphs 4.2 and 5 of our Terms.
© 2020 The Author(s). This work is published and licensed by Dove Medical Press Limited. The full terms of this license are available at https://www.dovepress.com/terms.php and incorporate the Creative Commons Attribution - Non Commercial (unported, v3.0) License.
By accessing the work you hereby accept the Terms. Non-commercial uses of the work are permitted without any further permission from Dove Medical Press Limited, provided the work is properly attributed. For permission for commercial use of this work, please see paragraphs 4.2 and 5 of our Terms.