")
Back to Journals » International Journal of Nephrology and Renovascular Disease » Volume 13
The Impact of Intravenous Fluid Therapy on Acid-Base Status of Critically Ill Adults: A Stewart Approach-Based Perspective
Authors Kilic O, Gultekin Y, Yazici S
Received 30 June 2020
Accepted for publication 14 August 2020
Published 30 September 2020 Volume 2020:13 Pages 219—230
DOI https://doi.org/10.2147/IJNRD.S266864
Checked for plagiarism Yes
Review by Single anonymous peer review
Peer reviewer comments 2
Editor who approved publication: Professor Pravin Singhal
Ozgur Kilic,1 Yucel Gultekin,2 Selcuk Yazici1
1Siyami Ersek Thoracic and Cardiovascular Surgery Center, Cardiology Department, Cardiac Intensive Care Unit, Istanbul, Turkey; 2Mersin University Hospital, General Surgery Department, Mersin, Turkey
Correspondence: Ozgur Kilic
Siyami Ersek Thoracic and Cardiovascular Surgery Center, Cardiology Department, Cardiac Intensive Care Unit, Istanbul, Turkey
Tel +90 505 826 09 12
Email [email protected]
Abstract: One of the most important tasks of physicians working in intensive care units (ICUs) is to arrange intravenous fluid therapy. The primary indications of the need for intravenous fluid therapy in ICUs are in cases of resuscitation, maintenance, or replacement, but we also load intravenous fluid for purposes such as fluid creep (including drug dilution and keeping venous lines patent) as well as nutrition. However, in doing so, some facts are ignored or overlooked, resulting in an acid-base disturbance. Regardless of the type and content of the fluid entering the body through an intravenous route, it may impair the acid-base balance depending on the rate, volume, and duration of the administration. The mechanism involved in acid-base disturbances induced by intravenous fluid therapy is easier to understand with the help of the physical-chemical approach proposed by Canadian physiologist, Peter Stewart. It is possible to establish a quantitative link between fluid therapy and acid–base disturbance using the Stewart principles. However, it is not possible to accomplish this with the traditional approach; moreover, it may not be noticed sometimes due to the normalization of pH or standard base excess induced by compensatory mechanisms. The clinical significance of fluid-induced acid-base disturbances has not been completely clarified yet. Nevertheless, as fluid therapy may be the cause of unexplained acid-base disorders that may lead to confusion and elicit unnecessary investigation, more attention must be paid to understand this issue. Therefore, the aim of this paper is to address the effects of different types of fluid therapies on acid-base balance using the simplified perspective of Stewart principles. Overall, the paper intends to help recognize fluid-induced acid-base disturbance through bedside evaluation and choose an appropriate fluid by considering the acid-base status of a patient.
Keywords: Stewart approach, fluid therapy, acid-base disturbance, strong ion difference, total weak acid concentration
Introduction
Intravenous fluid therapy is a standard part of intensive care management, and has been shown to impact the acid-base status of a patient. Historically, the origin of fluid-associated acid-base disorders is based on the recognition of complex metabolic acid-base disorders that occur after performing different infusion regimens, particularly with the development of intensive care medicine. The most typical example of an acid-base disorder is saline-related hyperchloremic acidosis. In addition, for the mechanistic explanation of complex acid-base disturbances induced by different fluid types, the Stewart approach is superior to the traditional approach.1
According to their similarity to plasma, fluid regimes can be broadly categorized as balanced and unbalanced in terms of the ionic composition of the fluid. Current data have shown that resuscitation with unbalanced fluids is associated with the risk of acidosis, whereas the acid-base balance is better preserved with the use of balanced fluids. However, the vast majority of such data were obtained from shock and perioperative cases in which high-volume fluids were rapidly given and analyzed with the traditional approach. In contrast to the roughly defined relationship established with the traditional approach, by using the simplified Stewart method for bedside evaluation, we can predict and quantify the effects of individual commercially available fluids on acid-base balance. Therefore, fine adjustment can be made on fluid management to optimize the acid-base status of critically ill patients who are under the risk of developing fluid-induced acid-base disorders.
Stewart Perspective
According to the Stewart model, there are three independent factors that determine the acid-base balance. Of the three factors, the arterial carbon dioxide tension (PaCO2) determines the respiratory component of the acid-base balance, while the two described below determine the metabolic component:
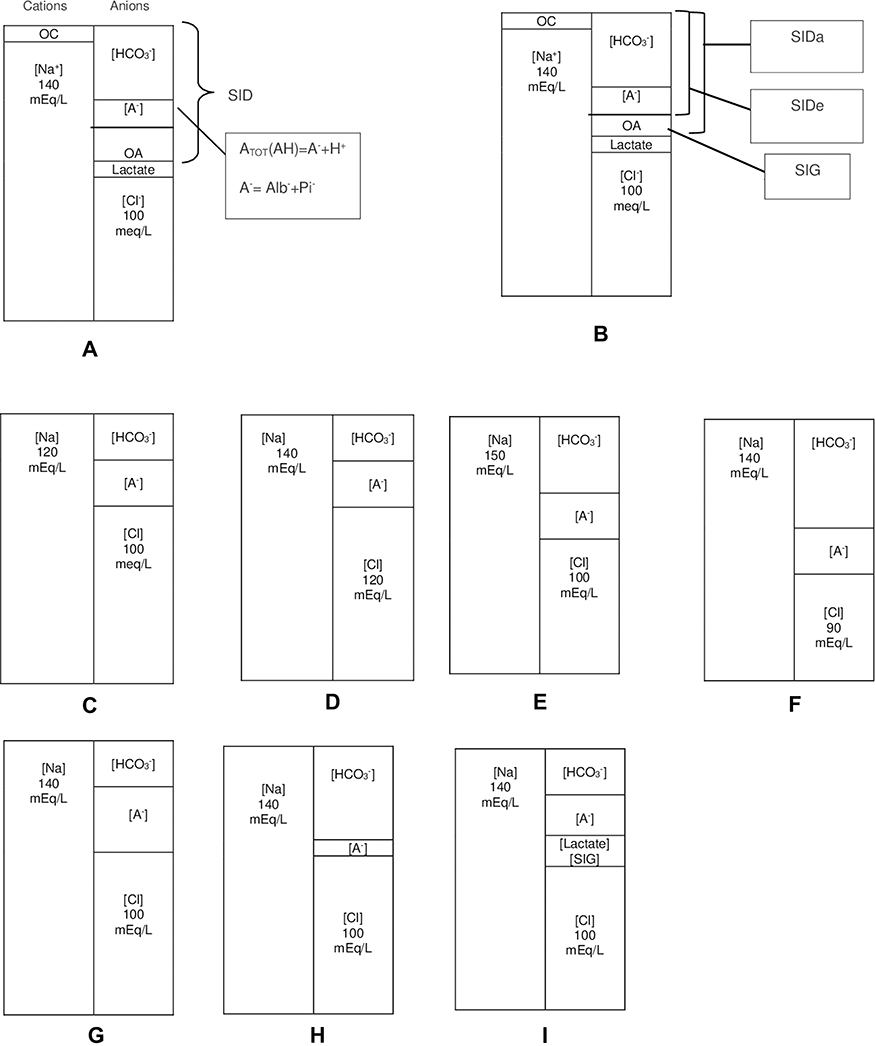 |
Figure 1 Simplified illustration of normal acid-base status and metabolic acid-base disturbances with gamblegrams based on the Stewart approach. (A–B) Normal states: As a result of the electroneutrality law, the concentration of total cations is equal to that of total anions. While strong ions dissolve in water completely, weak ions only dissolve partially. There are two major strong ions in the ECF—[Na] as the cation and [Cl] as the anion. Strong cations besides [Na], such as [K], [Ca], [Mg], [Li], [Al], and others, are represented as OC. Moreover, OA represents other strong anions besides Cl and lactate. OA contains strong anions, including ketone, sulfate, acetate, and others. The difference between all strong cations and all strong anions is known as [SID]. Since Na and Cl are the principal ions of the ECF,[SID] can be simplified as the difference between Na and Cl. In order to preserve electroneutrality, [A TOT] and [HCO3] fill the space formed by the SID. SIDa is simply calculated as Na–(Cl+Lactate), and SIDe is the sum of A− + HCO3. A− is the dissociated part of ATOT that indicates [Alb−]+ [Pi−]. Additionally, SIG is the difference between SIDa and SIDe. Notably, while SIDa is a calculated parameter, SIDe is a measured one. OA also represents SIG. (C) The reduced SID due to water surplus or sodium loss. (D) Hyperchloremic acidosis: SID is narrowed due to the presence of excess chloride. (E) Hypernatremic alkalosis: SID is widened due to sodium surplus or water loss. (F) Hypochloremic alkalosis: SID is increased due to chloride loss. (G) Increased [ATOT] due to hyperphosphatemia or hyperalbuminemia squeezes [HCO3] and, subsequently, acidosis. (H) Hypoalbuminemia or hypophosphatemia widened [HCO3] with a decrease in [A TOT], resulting in alkalosis. (I) Lactic acidosis: Lactate is considered a strong anion that decreases SID upon accumulation; SIG acidosis; eg, ketoacidosis. |
As the influence of fluid therapy on acid-base balance involves the metabolic component,1 the respiratory component is beyond the scope of this review.
In normal states, SID corresponding to the difference between sodium and chloride concentration is approximately 40 mEq/L within limits of 38 and 42 mEq/L.2,3 As illustrated with the gamblegrams in Figure 1, when SID is narrowed in the case of either sodium decrease or chloride increase, it results in acidosis (Figure 1C and D).4 However, SID can be widened in the case of hypernatremia (eg, infusion of sodium bicarbonate) or by hypochloremia (eg, loss of chloride due to vomiting or loop diuretics.) (Figure 1E–F). Elevated levels of other anions also lead to acidosis (ie, lactic acidosis and ketoacidosis) due to a decrease in SID (Figure 1I).4 Additionally, ATOT is the third variable that can cause independent variations in the pH level. The approximate amount of ATOT is calculated using the following equation:
2.5 x albumin (g/dL) + 0.6 x phosphate (mg/dL)
Here, the coefficients in front of albumin and phosphate are the mEq/L equivalents of the electrical charge that each generates for each one gram of albumin per deciliter and one milligram of phosphate per deciliter when dissolved in plasma. If phosphate is given in mmol/L, then it will be multiplied by 1.5.5–7 The mid-reference valuesare10 mEq/L and 2 mEq/L for albumin and inorganic phosphate, respectively.5,7 An increase in ATOT is associated with acidosis, whereas its decrease results in alkalosis. This increase can be caused by high levels of phosphates, which occurs during renal failure. On the other hand, typically, a reduction in ATOT is due to low concentrations of albumin (Figure 1G–H).4,8,9
ATOT is principally composed of albumin. In the majority of long-term critically ill patients, hypoalbuminemia is observed due to reasons such as volume overload, endothelial leak due to inflammation, and nutritional deficiency.4,10 Although hypoalbuminemic alkalosis seems to prevent acidosis, it is actually not true. Moreover, as a compensatory response, low ATOT and high pH stimulate Cl retention, which subsequently decreases SID.11 Most critically ill patients only have a very mild alkalosis (if at all) and a low SID to compensate for the low ATOT. Lower SID means that they can tolerate an acid load less well.
The contribution of inorganic phosphate is relatively low and mostly neglected, except in the case of hyperphosphatemic acidosis, which may be significant in renal failure.5,11 Apart from these independent parameters, another concept has been proposed by the Stewart model—strong ion gap (SIG). In order to define SIG, it is necessary to know about its relationships with the anion gap and SID. Since, in the past, the concentrations of albumin, phosphate, lactate, ketone, sulfate, citrate, acetate, and others could not be measured in the laboratory, the number of these unmeasurable anions was determined by subtracting measurable anions from measurable cations, assigning a value known as the anion gap (AG).12 On the other hand, SIG is the total concentration of the remaining unmeasured anions other than albumin, phosphate, and lactate that constitute the main components of AG.5,8,13,14 In other words, SIG is equal to anion gap – (lactate + ATOT). As can be seen, the term “unmeasured” is quite a misnomer. Although measurable in modern times, since they (eg, ketone) are not included in the anion gap calculation, they are still referred to as unmeasured. Therefore, both AG and SIG quantify unmeasured anion concentration. However, unlike AG, SIG is not affected by a change in albumin concentration, and thus, it does not require correction for the albumin.14
Moreover, SIG can be explained in terms of its relationship with SID. SIG is equal to the difference between the apparent SID (SIDa) and the effective SID (SIDe). SIDa is the electrical gap between strong cations and strong anions, which is formulated as ([Na+]+[K+]+[Ca++]+[Mg++]) – ([Cl]+[Lactate]+[Urate]) but simply as ([Na]) – ([Cl]+[Lactate]). SIDe is the anionic charge filling this gap, which is determined as[A−]+[HCO3−]. [A−] represents the dissociated form of ATOT(Figure 1B). Conceptually, SIDa is equal to SIDe, as required by the electroneutrality law. In the case of increased unmeasured anions or SIG, SIDa increases but not SIDe.14 Based on the equation SIG=SIDa – SIDe, a marked deviation from zero should suggest an increase of unknown ions in the body.
No standard range for SIG has been mentioned in the literature. It is expected to be below 2 mEq/L,15 but in most studies, it was determined to be approximately 5 mEq/L for intensive care unit (ICU) patients.16–18
Physiopathology of Fluid-Related Acid-Base Disturbances
Fluid-induced acid-base disturbances can be mechanistically explained as follows. The SID of each fluid is different from the plasma. If an excessive amount of fluid is rapidly delivered through an intravenous route, the plasma SID moves toward the SID of the fluid after infusion; hence, based on the alteration of SID, the acid-base balance may be disturbed.1,19-21
The rate and dosage of the fluid are crucial for causing post-infusion change to the SID. It is best documented in the case of the administration of crystalloids up to 70 mL/kg/h for two hours for intraoperative fluid replacement.22 Within the infusion period, the strong ions in the infusate (eg, Na+, K+, Mg++, Ca++, Cl−, lactate, and acetate) fill the extracellular fluid compartment, changing the ion balance of the plasma.21,23 As the plasma undergoes hemodilution, the SID will change linearly.19 In this context, for instance, in the saline-induced hyperchloremic acidosis, the mechanism is not the dilutional reduction of bicarbonate but the narrowing of the plasma SID after dilution with zero SID,1 and change in bicarbonate concentration is only a consequence.
Concurrent volume increase with fluid therapy leads to dilution of ATOT and the alkalotic effect.20 If this dilutional effect is accompanied by increased SID, alkalosis further increases but due to reduced SID, alleviating acidosis. Fluids with weak acid content such as albumin, phosphate, or gelatine have acidosis potential due to the ATOT activity.1,25 Experimental studies have shown that SID should be 24 mEq/L for a solution to not affect the acid-base balance in healthy conditions.19,24,25 In view of this finding, it can be asserted that the fluid SID should be equal to the bicarbonate concentration in the patient to prevent a change in pH when the plasma is mixed with fluids. As a result, if it is lower than the bicarbonate value of the patient, the tendency to develop acidosis may be generated, and vice versa for alkalosis.19,26,27
According to the electroneutrality law, the in-vitro SID of all fluids (SID in a bag) is zero. However, when the fluids called balanced crystalloids are mixed with the plasma, the anions, such as lactate, gluconate, acetate, or malate, are eliminated by converting them to bicarbonate. Due to this gap, the in-vivo SID becomes higher than zero. Thus, in order to predict the iatrogenic effects of fluids on acid-base balance, we need to know their ionic composition and the in vivo SID values. A detailed list of some commercially available balanced and unbalanced fluids has been provided in Table 1.
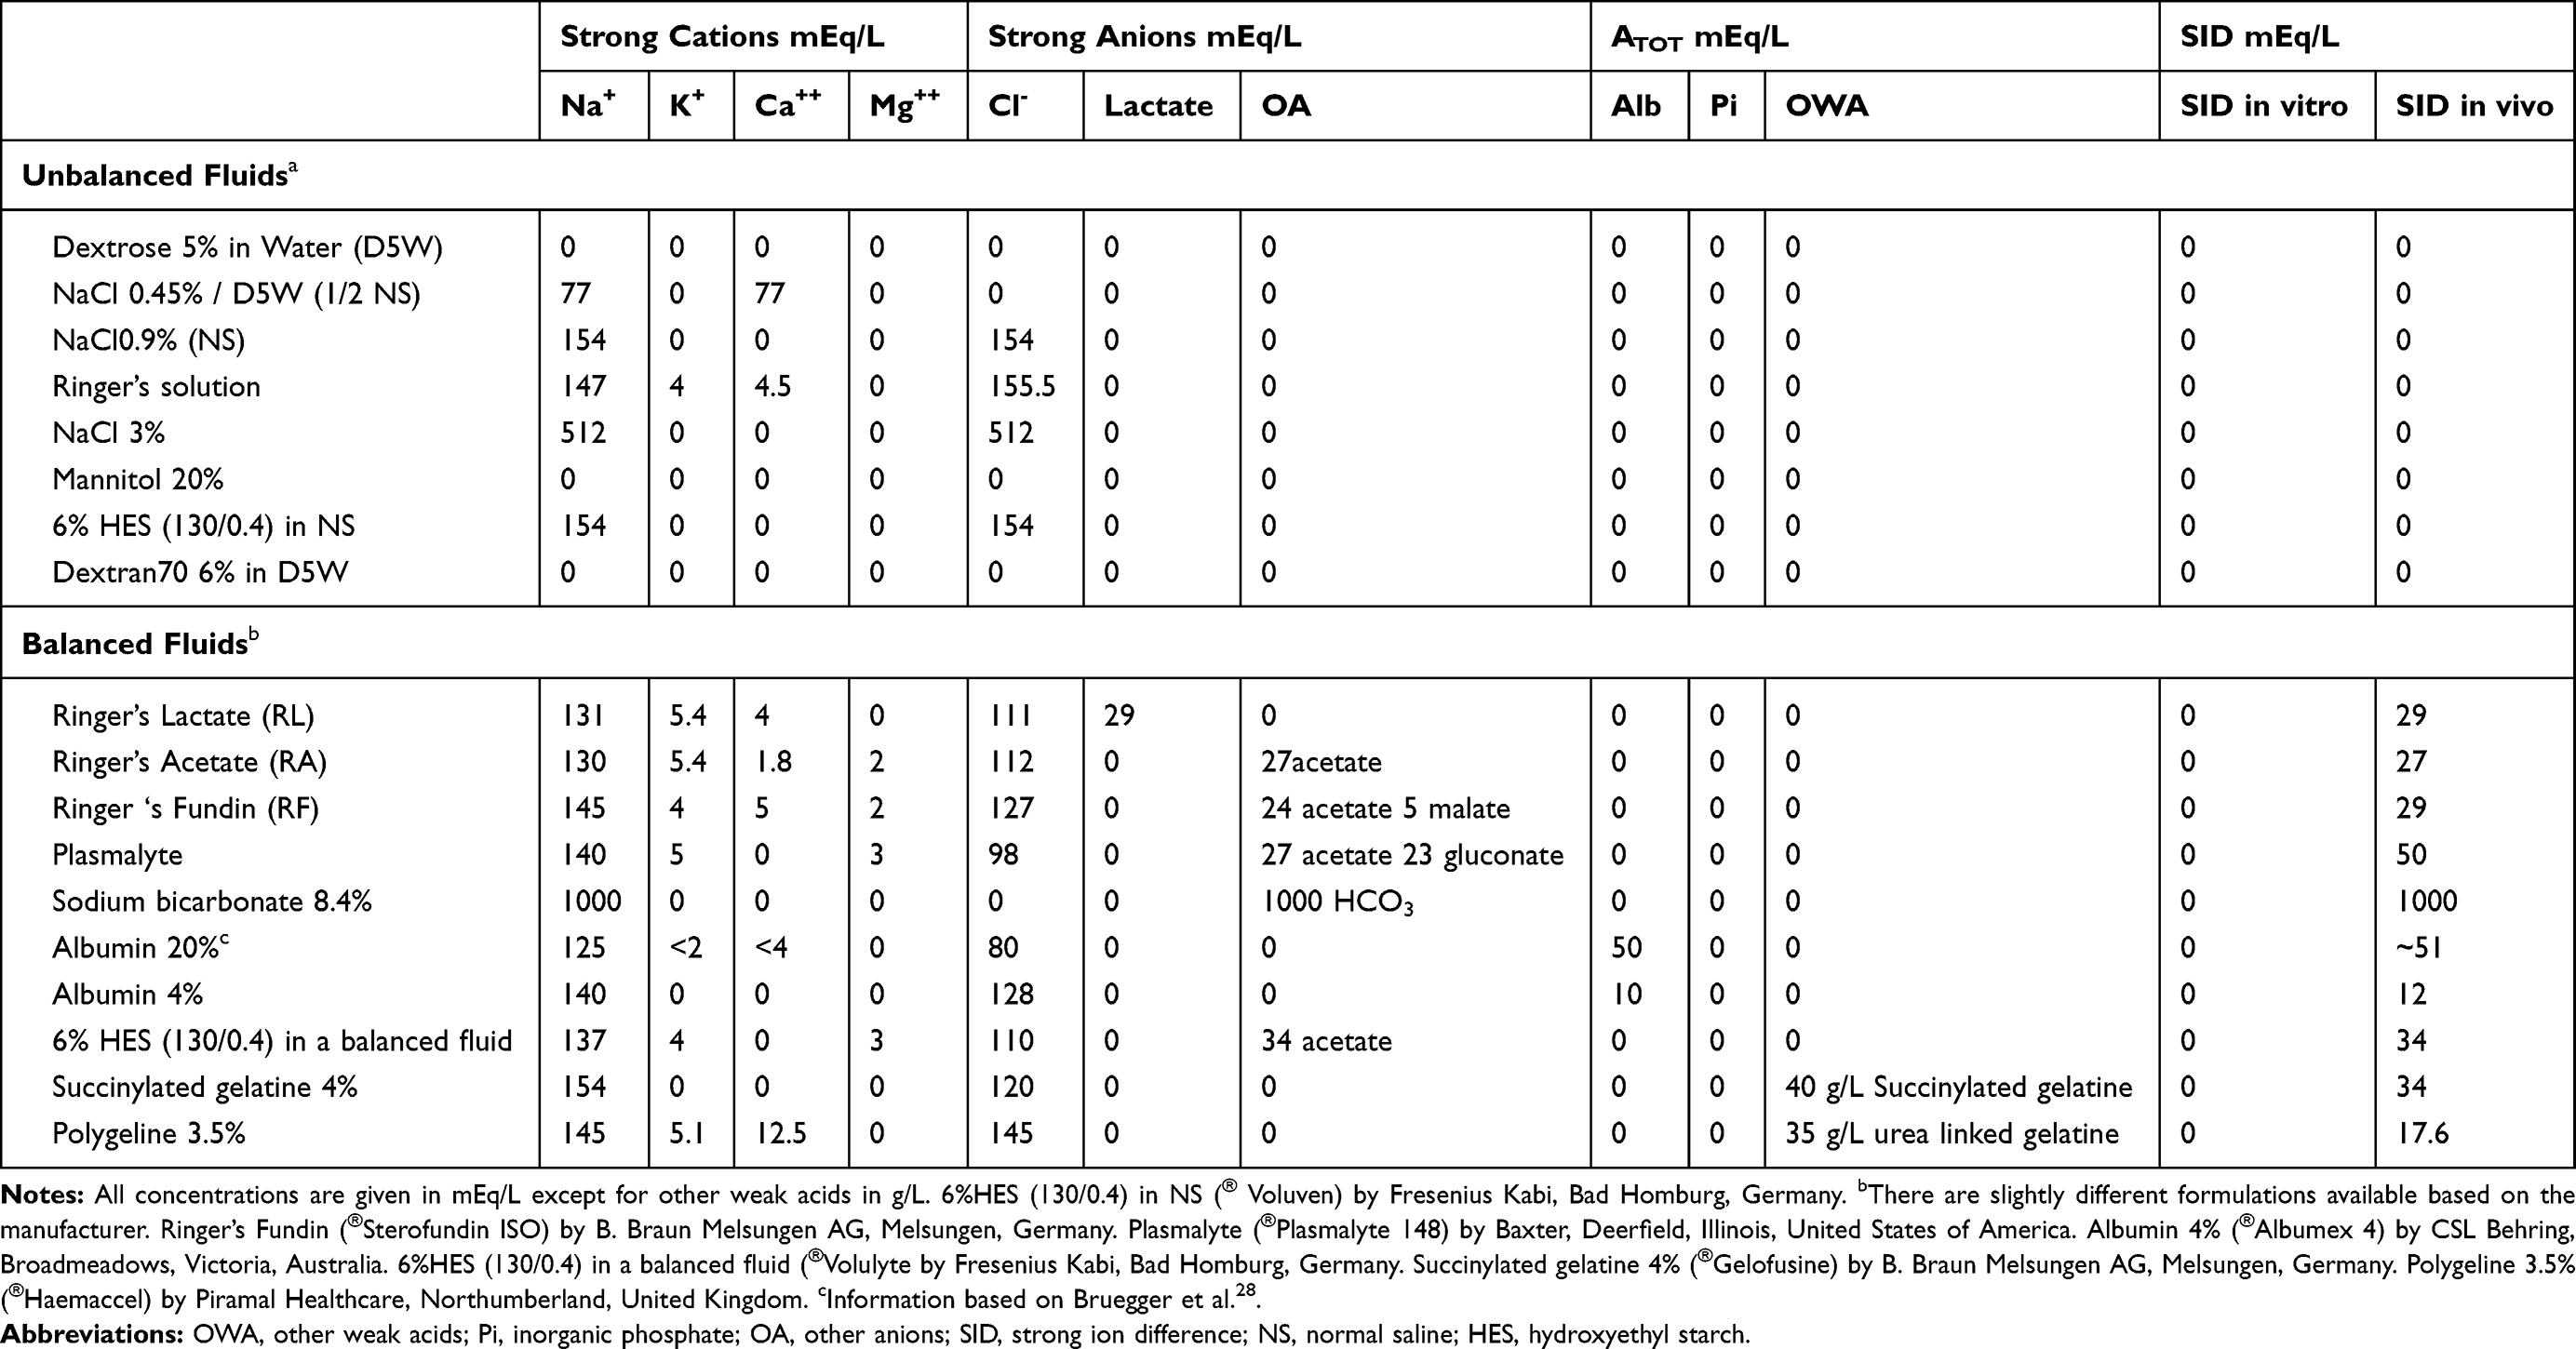 |
Table 1 Some Examples of Commonly Known Fluids with Their Composition and SID Values |
Quantification of Fluid Effect on Acid-Base Balance
Prior to the Stewart model, researchers following the traditional approach developed standard bicarbonate, base excess, and standard base excess (SBE) to isolate the metabolic component from the compensatory effects of the respiratory component.29–34 Of these, the most widely accepted and recommended tool for clinical use is the SBE.35–37 SBE is defined as the amount of acid or base to return in vitro one-liter extracellular fluid to normal pH (7.40) under standard conditions (at 37°C at a PaCO2 of 40 mmHg). It ranges from −3 to +3 mEq/L.
Non-normal negative values indicate acidosis, while positive values indicate alkalosis. It is considered that a patient with an SBE of –8 mEq/L has an excess of 8 mEq of acid per liter of extracellular fluid. Therefore, it is assumed that 8 mEq sodium bicarbonate per liter of extracellular fluid will be needed to neutralize acidosis. Extracellular fluid accounts for approximately 30% of the body fluid; therefore, we can estimate the total required dose of sodium bicarbonate. We can apply the same estimation for the conceptual dose of hydrochloric acid for alkalosis with an SBE of +8 mEq/L.
SBE helps quantify the amount of metabolic acid-base disorder but does not differentiate the causative pathologies. In response to this question, in the research studies, the Stewart principles were simplified, and the components of acid-base disorder could be individually displayed with their corresponding quantitative contributions.5,38-40
Accordingly, the components of SBE and their quantitative effects are claimed to be as follows:
Note that the mid-reference values taken for lactate and albumin are 1 mEq/L and 4 g/dL, respectively. To better understand the methodology, we can examine a hypothetical case where pH=7.38, PaCO2=25 mmHg, sodium=150 mEq/L, chloride =102 mEq/L, albumin=2 g/dL, lactate=6 mEq/L, and SBE=0 mEq/L.
In this case, there seems no metabolic acid-base disturbance according to SBE; however, if we analyze according to the Stewart principles, we obtain the following results:
Assuming that the sum of the above ionic charge is equal to SBE, it can be inferred that the alkalosis of +4 mEq/L is offset by the SIG of −4 mEq/L. If the respiratory change was acute, alkalosis of +10 mEq/L would be offset by the SIG of −10 mEq/L to reach an SBE of 0 mEq/L.
The effect of the post-infusion change in ATOT, SID, and SIG on acid-base balance can be estimated using this methodology.
Fluid Type
Broadly, fluids can be divided into two categories according to their ionic composition: balanced and unbalanced fluids. The term “balanced fluids” refers to intravenous solutions whose electrolyte composition is closer to the composition of plasma, as compared to previously available solutions, such as normal saline. Thus, balanced solutions should minimally affect the acid-base equilibrium. However, more recently, researchers have started to employ the term “balanced solution” to also indicate intravenous solutions with low chloride content.41,42 Fluids with electrolyte content outside the physiological limits compared to normal plasma are considered as unbalanced fluids. The SID of all unbalanced fluids is zero, whereas that of balanced fluids is greater than zero.
Unbalanced Fluids
The most widely used unbalanced fluid is normal saline (0.9% NaCl) for either resuscitation or drug dilution. Normal saline has zero SID and contains a supraphysiologic amount of sodium—154 mEq/L—and chloride—154 mEq/L—as compared to plasma. After an IV infusion of normal saline in a large volume, the increase in chloride will be higher than that in sodium. Inevitably, hyperchloremic acidosis will develop with a decrease in SID. However, in the case of neutral pH, due to superimposed alkalotic conditions, acidosis may not be recognized. This hidden condition can be revealed by calculating SID; if SID decreases tending toward below 40 mEq/L, acidosis develops. However, acidosis may be without hyperchloremia. All saline (not just 0.9%) and dextrose solutions have a SID of zero and will result in acidosis. For example, 0.45% saline has exactly the same effect as 0.9% saline does. The only difference is that Na falls more than Cl for 0.45% saline, whereas Cl increases more than Na for 0.9% saline. However, the effect on SID is the same.43 Hypertonic saline and mannitol produce the same effect on the acid-base balance due to zero SID but with the further dilution of hypertonicity, it further reduces the SID.44
Hydroxyethyl starch and dextran solutions are unbalanced colloids acting on acid-base balance through the in-vivo SID of the carrier fluid. As expected, all colloids in this category will show acidotic effect due to zero SID of the carrier fluid.25
Balanced Fluids
Although there are many commercially available balanced crystalloid fluids, the ones most commonly used are Ringer’s lactate and Plasmalyte, only varying in terms of the type and number of anions called bicarbonate precursors. The in-vitro SID of Ringer’s lactate bag is 0, and it contains 29 mEq/L of lactate. However, after infusion, lactate disappears upon conversion to bicarbonate. In vivo, the SID of the fluid rises from 0 to 29 mEq/L. Likewise, Plasmalyte contains 50 mEq/L of anions composed of 23 mEq acetate per liter and 27 mEq gluconate per liter serving as buffers, generating an in-vivo SID of 50 mEq/L. Actually, lactate, gluconate, acetate, and malate do not convert to bicarbonates. They go right into the Krebs cycle and are ultimately metabolized. Moreover, bicarbonate increases (from CO2) due to an increase in SID.
The higher the in-vivo SID value of the fluid, the more it creates the tendency toward alkalosis. Therefore, they can be a good option to neutralize or prevent fluid-related acidosis.
However, there are some limitations to using balanced fluids. Firstly, in the presence of liver dysfunction, oliguric renal dysfunction, hyperkalemia, and brain damage, they should be used cautiously. Secondly, the fact that these fluids cannot be used for drug dilution is also a limitation. However, it is worth mentioning that in two randomized trials that compared Ringer’s lactate and normal saline during renal transplantation, less hyperkalemia was observed in the former group.45,46 This effect is thought to be caused by a potassium shift out of the cell caused by acidosis, which developed more in the saline group. As with most balanced fluids, a small amount of potassium, such as 5 mEq/L, can be found in Ringer’s lactate, which is not thought to be as risky as hyperkalemia induced by acidosis. In the case of hepatic insufficiency, Ringer’s lactate may cause lactic acidosis, since lactate clearance is reduced.
There are two prototypes of balanced colloid fluids—human albumin solutions and gelatine preparations. Since these colloids are suspended in a balanced crystalloid solution, they are expected to produce a neutral or alkalotic effect, depending on the SID of the carrier fluid. However, they also have an acidic effect due to their respective ATOT activity. As a result of this dual effect, they carry much less acidosis potential than unbalanced colloids. The effect of change in albumin concentration on acid-base balance can be quantified, whereas it is not clear for gelatin.
Total Parenteral Nutrition Solutions
There are two well-known groups of commercially available products of total parenteral nutrition (TPN) solutions. These are ready-to-use and pre-filled solutions with three unmixed chambers containing amino acids with electrolytes, lipids, and dextrose (Table 2).
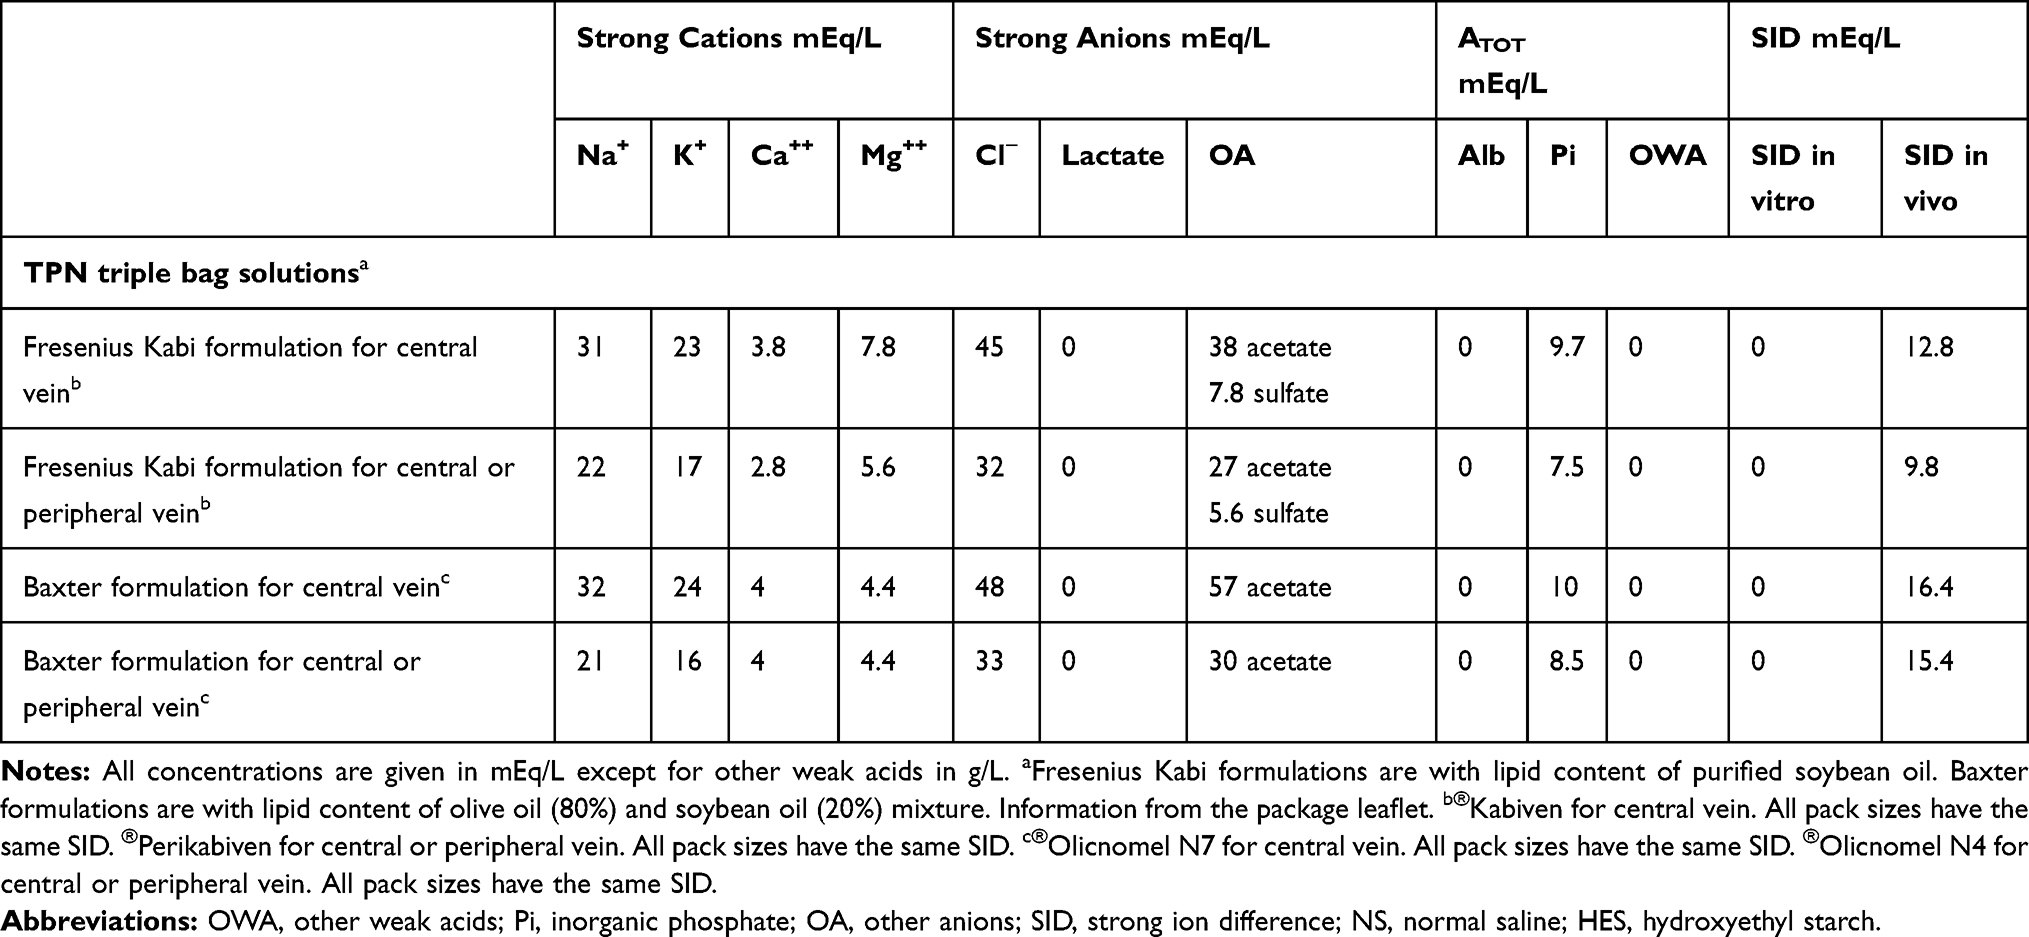 |
Table 2 Some TPN Solutions with Their Composition and SID Values |
Triple bag TPN solutions vary with their lipid content and can be categorized into two groups—one group with purified soybean oil and the other with a mixture of refined olive oil (80%) and refined soybean oil (20%). The electrolyte content of both is predominantly chloride-based, with SID ranging from 9.8 to 16.4 mEq/L. TPN solutions also have an ATOT impact on phosphate content. They may accumulate particularly in patients with renal insufficiency and lead to hyperphosphatemic acidosis.
The group with purified soybean oil carries the risk of acidosis in another way: sulfate, another strong ion in its content, can accumulate in the case of renal failure and cause acidosis by reducing SID such as lactate. The amount of possible acidosis due to sulfate can be estimated by calculating SIG.
Additionally, since thiamine is the cofactor of the enzyme pyruvate dehydrogenase, which helps convert lactate to pyruvic acid in patients with long-term thiamine-free TPN, lactic acidosis may occur due to impaired lactate metabolism.47
Hyperchloremia and Hyperchloremic Acidosis
Chloride and sodium are the two main strong ions of extracellular fluid. However, the clinical effects of chloride, especially in relation to ICU, have been subjected to research in recent years, much later than that of sodium. While fluid-related chloride disorder is mostly presented as hyperchloremia or hyperchloremic acidosis,48 hypochloremia and/or hypochloremic alkalosis is mostly associated with diuretic therapy rather than fluid.49,50 Hyperchloremia caused by underlying diseases or fluid therapy is common in ICUs, within 25–45%.51–53 Saline-induced hyperchloremia does not seem to have a negative impact on the clinical outcomes of patients with normal acid-base balance and renal function prior to surgery.23 However, it is still unclear for critically ill patients mostly having reduced host reserve, multiorgan failure, and acid-base disturbance.23
It is common to confuse hyperchloremia with hyperchloremic acidosis. Although there is no clear limit for diagnosing hyperchloremia, the most commonly accepted one is [Cl] >110 mEq/L.42,54-56 When hyperchloremia is associated with acidosis, then it is called hyperchloremic acidosis. Considering the Stewart paradigm, the difference between sodium and chloride should be narrowed, instead of increasing chloride concentration to determine whether hyperchloremia is the source of acidosis.57 Suppose there are two patients, one with sodium and chloride concentrations of 135 and 112 mEq/L, respectively, and the other with 155 and 115 mEq/L, respectively. The first patient has hyperchloremic acidosis due to the acidic SID (23 mEq/L), while despite a higher chloride concentration, the second patient only has hyperchloremia due to normal SID (40 mEq/L). We can interpret the latter scenario to be a balancing effect of hypernatremic alkalosis against hyperchloremic acidosis.
Consistent with this paradigm, although Ringer’s lactate and Ringer’s fundin are chloride-liberal fluids in terms of chloride content (112 and 127 mEq/L, respectively), theoretically, both are expected to cause hyperchloremia without acidosis, as the SID for both is 29 mEq/L.
The most well-known fluid associated with hyperchloremic acidosis is normal saline. However, it should be emphasized that fluid-associated acidosis can be without hyperchloremia or with hypochloremia.57,58 Consider a healthy individual with 140 mEq/L of sodium and 100 mEq/L of chloride. Theoretically assuming that this person’s plasma is diluted with an equal amount of water, sodium concentration will drop to 70 mEq/L and chloride to 50 mEq/L. A decrease in the SID from 40 to 20 mEq/L results in acidosis. In this case, it might be interpreted that hypochloremic alkalosis is being suppressed by hyponatremic acidosis.
One of the most impressive examples of fluid-induced hyperchloremic acidosis in practice is observed during the treatment of diabetic ketoacidosis. According to the current guidelines, normal saline and 1/2 normal saline are recommended for the treatment of diabetic ketoacidosis.59 Since both fluids have zero SID, although ketoacidosis improves after the patient is hydrated with a large volume of these fluids, metabolic acidosis persists due to fluid-induced hyperchloremic acidosis. Balanced crystalloids can be thought to be used as a replacement of these fluids to overcome this complication. This putative benefit is supported by two studies that compared fluid resuscitation with Plasmalyte and normal saline in diabetic ketoacidosis. Hyperchloremia was observed in the saline-treated group, whereas in the Plasmalyte group, faster recovery of metabolic acidosis was observed and hyperchloremic acidosis was prevented.60,61
However, the same effect could not be demonstrated in the statistical significance for Ringer’s lactate in comparison with normal saline.62
Literary Data
There are an ample number of studies in the literature reporting data associated with fluid therapy for acid-base disturbances. Besides two large meta-analyses,63,64 preclinical65–68 and clinical22,45,46,60-62,69–76 studies, comparing different fluids on the basis of two main categories of balanced and unbalanced fluids, confirmed that while more acidosis was observed for the latter category, the acid-base balance was better maintained in the former category.
However, there are several gaps in this field of literature. First, there is almost no major randomized controlled trial (RCT) dealing primarily with the effects of fluids on acid-base balance. The current evidence of fluid-related acid-base disturbances is based on experimental studies, small-scale, mostly single-center RCTs, reviews, and meta-analyses. Moreover, in these studies, the effects of fluid therapy on acid-base balance are presented as a part of the secondary outcome rather than being the primary point of investigation.22,45,46,60–76
Second, although there are several studies that use the Stewart model, the majority of the data from the remaining were reported according to the interpretation of pH, SBE, chloride, and bicarbonate values, which fall within the scope of the traditional approach.
Third, there is no study investigating the influence of TPN solutions on acid-base balance through the Stewart perspective. Moreover, available data on TPN solutions are limited to a few studies.77–80 It is revealed that TPN solutions may the cause of metabolic acidosis that is thought to be a result of excess hydrogen burden resulting from the metabolism of amino acids and nitrogen sources in its content according to the traditional approach.77–80
Fourth, the risk of hyperkalemia is a common concern, which leads to avoiding balanced fluids and choosing normal saline. In contrast, studies have shown that both lactate Ringer and Plasmalyte develop less hyperkalemia than normal saline.45,46,81 However, these studies are limited only to patients undergoing renal transplantation. In order to clarify this concern, a more wide variety of well-designed studies is needed.
Finally, most of the available data are based on the effects of the fluids given in extreme doses for initial resuscitation in both surgical and non-surgical critical settings. However, the volume change due to non-resuscitation fluids is much more than in the case of resuscitation.82,83 Studies investigating the effects of cumulative fluid intake in long-term critically ill patients should also be conducted.
Conclusion
Theoretically, the Stewart approach helps not only in understanding the mechanisms of fluid-associated acid-base disorders but also in tailoring appropriate fluid therapy according to patient acid-base status. The clinical significance of fluid-induced acid-base disturbance has not been completely clarified yet. Nevertheless, since fluid therapy may be the source of unexplained acid-base disorder, probably causing confusion and eliciting unnecessary investigation, more attention should be paid to this issue. Analytical calculations using the Stewart method may be useful, as some disturbances may be hidden in conditions with normal pH or SBE. Moreover, the relationship between fluid therapy and acid-base balance needs to be demonstrated in a more rational way. Therefore, more powerful and high quality studies are needed, which take into account the above-mentioned gaps in the literature.
Acknowledgment
The authors would like to thank John A Kellum for reviewing the paper and for his invaluable suggestions and corrections.
Funding
There is no funding to report.
Disclosure
The authors report no conflicts of interest in this work.
References
1. Morgan TJ. The meaning of acid-base abnormalities in the intensive care unit: part III – effects of fluid administration. Crit Care. 2005;9(2):204–211. doi:10.1186/cc2946
2. Stewart PA. Modern quantitative acid-base chemistry. Can J Physiol Pharmacol. 1983;61(12):1444–1461. doi:10.1139/y83-207
3. Boniatti MM, Cardoso PR, Castilho RK, Vieira SR. Acid-base disorders evaluation in critically ill patients: we can improve our diagnostic ability. Intensive Care Med. 2009;35(8):1377–1382. doi:10.1007/s00134-009-1496-2
4. Fencl V, Jabor A, Kazda A, et al. Diagnosis of metabolic acid-base disturbances in critically ill patients. Am J Respir Crit Care Med. 2000;162(6):2246–2251. doi:10.1164/ajrccm.162.6.9904099
5. Figge J, Mydosh T, Fencl V. Serum proteins and acid-base equilibria: a follow-up. J Lab Clin Med. 1992;120(5):713–719.
6. Kellum JA. Disorders of acid-base balance. Crit Care Med. 2007;35(11):2630–2636. doi:10.1097/01.CCM.0000286399.21008.64
7. Figge J, Jabor A, Kazda A, Fencl V. Anion gap and hypoalbuminemia. Crit Care Med. 1998;26(11):1807–1810. doi:10.1097/00003246-199811000-00019
8. Stewart PA. How to Understand Acid-Base: A Quantitative Acid-Base Primer for Biology and Medicine. New York: Elsevier North Holland Inc; 1981.
9. Corey HE. Bench-to-bedside review: fundamental principles of acid-base physiology. Crit Care. 2005;9(2):184–192. doi:10.1186/cc2985
10. Fencl V, Rossing TH. Acid-base disorders in critical care medicine. Annu Rev Med. 1989;40(1):17–29. doi:10.1146/annurev.me.40.020189.000313
11. Wilkes P. Hypoproteinemia, strong-ion difference, and acid-base status in critically ill patients. J Appl Physiol. 1998;84(5):1740–1748. doi:10.1152/jappl.1998.84.5.1740
12. Kraut JA, Madias NE. Serum Anion Gap: its Uses and Limitations in Clinical Medicine. Clin J Am Soc Nephrol. 2007;2(1):162–174. doi:10.2215/CJN.03020906
13. Jones NL. A quantitative physicochemical approach to acid-base physiology. Clin Biochem. 1990;23(3):189–195. doi:10.1016/0009-9120(90)90588-L
14. Kellum JA, Kramer DJ, Pinsky MR. Strong ion gap: a methodology for exploring unexplained anions. J Crit Care. 1995;10(2):51–55. doi:10.1016/0883-9441(95)90016-0
15. Kellum JA, Moviat M, van der Hoeven JG. Using the Stewart Model at the Bedside. In: Kellum JA, Elbers PWG, editors. Stewart’s Textbook of Acid Base, 2 Ndedn. Lulu.com. United States of America; 2009:339–351.
16. Kaplan LJ, Kellum JA. Initial pH, base deficit, lactate, anion gap, strong ion difference, and strong ion gap predict outcome from major vascular injury. Crit Care Med. 2004;32(5):1120–1124. doi:10.1097/01.CCM.0000125517.28517.74
17. Gunnerson KJ, Srisawat N, Kellum JA. Is there a difference between strong ion gap in healthy volunteers and intensive care unit patients? J Crit Care. 2010;25(3):520–524. doi:10.1016/j.jcrc.2009.11.001
18. Dondorp AM, Chau TT, Phu NH, et al. Unidentified acids of strong prognostic significance in severe malaria. Crit Care Med. 2004;32(8):1683–1688. doi:10.1097/01.CCM.0000132901.86681.CA
19. Morgan TJ, Venkatesh B, Hall J. Crystalloid strong ion difference determines metabolic acid-base change during acute normovolaemic haemodilution. Intensive Care Med. 2004;30(7):1432–1437. doi:10.1007/s00134-004-2176-x
20. Morgan TJ. The ideal crystalloid - what is ‘balanced’? CurrOpinCrit Care. 2013;19(4):299–307. doi:10.1097/MCC.0b013e3283632d46
21. Langer T, Carlesso E, Protti A, et al. In vivo conditioning of acid-base equilibrium by crystalloid solutions: an experimental study on pigs. Intensive Care Med. 2012;38(4):686–693. doi:10.1007/s00134-011-2455-2
22. Scheingraber S, Rehm M, Sehmisch C, Finsterer U. Rapid saline infusion produces hyper chloremic acidosis in patients undergoing gynecologic surgery. Anesthesiology. 1999;90(5):1265–1270. doi:10.1097/00000542-199905000-00007
23. Omron EM, Omron RM. A physicochemical model of crystalloid infusion on acid-base status. J Intensive Care Med. 2010;25(5):271–280. doi:10.1177/0885066610371633
24. Morgan TJ, Venkatesh B. Designing ‘balanced’ crystalloids. Crit Care Resusc. 2003;5:284–291.
25. Morgan TJ, Vellaichamy M, Cowley DM, Weier SL, Venkatesh B, Jones MA. Equivalent metabolic acidosis with four colloids and saline on ex vivo haemodilution. Anaesth Intensive Care. 2009;37(3):407–414. doi:10.1177/0310057X0903700304
26. Carlesso E, Maiocchi G, Tallarini F, et al. The rule regulating pH changes during crystalloid infusion. Intensive Care Med. 2011;37(3):461–468. doi:10.1007/s00134-010-2095-y
27. Gattinoni L, Carlesso E, Maiocchi G, et al. Dilutional acidosis: where do the protons come from? Intensive Care Med. 2009;35(12):2033–2043. doi:10.1007/s00134-009-1653-7
28. Bruegger D, Jacob M, Scheingraber S, et al. Changes in acid-base balance following bolus infusion of 20% albumin solution in humans. Intensive Care Med. 2005;31(8):1123–1127. doi:10.1007/s00134-005-2683-4
29. Singer RB, Hastings AB. An improved clinical method for the estimation of disturbances of the acid-base balance of human blood. Medicine. 1948;27(2):223–242. doi:10.1097/00005792-194805000-00003
30. Astrup P, Jorgensen K, Siggaard-Andersen O, Engel K. Acid-base metabolism. A new approach. Lancet. 1960;1(7133):1035–1039. doi:10.1016/S0140-6736(60)90930-2
31. Siggaard-Andersen O, Engel K, Jorgensen K, Astrup PA. Micro method for determination of pH, carbon dioxide tension, base excess and standard bicarbonate in capillary blood. Scand J Clin LabInvest. 1960;12:172–176. doi:10.3109/00365516009062419
32. Severinghaus JW. Acid-base balance nomogram: a Boston-Copenhagen detente. Anesthesiology. 1976;45(5):539–541. doi:10.1097/00000542-197611000-00013
33. Siggaard-Andersen O. The van Slyke equation. Scand J Clin Lab Invest Suppl. 1977;146(sup146):15–20. doi:10.3109/00365517709098927
34. Schlichtig R, Grogono AW, Severinghaus JW. Human PaCO2 and standard base excess compensation for acid-base imbalance. Crit Care Med. 1998;26(7):1173–1179. doi:10.1097/00003246-199807000-00015
35. Blood Gas and pH Analysis and Related Measurements: Approved Guideline NCCLS Document No. C46. Wayne, PA: National Committee for Clinical Laboratory Standards; 2001.
36. Ibrahim I, Chor WP, Chue KM, et al. Is arterial base deficit still a useful prognostic marker in trauma? A systematic review. Am J Emerg Med. 2016;34(3):626–635. doi:10.1016/j.ajem.2015.12.012
37. Story DA. Bench-to-bedside review: a brief history of clinical acid-base. Crit Care. 2004;8(4):253–258. doi:10.1186/cc2861
38. Gilfix BM, Bique M, Magder S. A physical chemical approach to the analysis of acid-base balance in the clinical setting. J Crit Care. 1993;8(4):187–197. doi:10.1016/0883-9441(93)90001-2
39. Balasubramanyan N, Havens PL, Hoffman GM. Unmeasured anions identified by the Fencl–Stewart method predict mortality better than base excess, anion gap, and lactate in patients in the pediatric intensive care unit. Crit Care Med. 1999;27(8):1577–1581. doi:10.1097/00003246-199908000-00030
40. Story DA, Morimatsu H, Bellomo R. Strong ions, weak acids and base excess: A simplified Fencl-Stewart approach to clinical acid-base disorders. Br J Anaesth. 2004;92(1):54–60. doi:10.1093/bja/aeh018
41. Langer T, Santini A, Scotti E, Van Regenmortel N, Malbrain ML, Caironi P. Intravenous balanced solutions: from physiology to clinical evidence. Anaesthesiol Intensive Ther. 2015;47(J):s78–s88. doi:10.5603/AIT.a2015.0079
42. Malbrain MLNG, Langer T, Annane D, et al. Intravenous fluid therapy in the perioperative and critical care setting: executive summary of the International Fluid Academy (IFA). Ann Intensive Care. 2020;10(1):64. doi:10.1186/s13613-020-00679-3
43. Morgan TJ. The Stewart Approach – one Clinician’s Perspective. Clin Biochem Rev. 2009;30(2):41–54.
44. Makoff DL, da Silva JA, Rosenbaum BJ, Levy SE, Maxwell MH. Hypertonic expansion: acid-base and electrolyte changes. Am J Physiol. 1970;218(4):1201–1207. doi:10.1152/ajplegacy.1970.218.4.1201
45. O’Malley CM, Frumento RJ, Hardy MA, et al. A randomized, double-blind comparison of lactated Ringer’s solution and 0.9% NaCl during renal transplantation. AnesthAnalg. 2005;100(5):1518–1524.
46. Khajavi MR, Etezadi F, Moharari RS, et al. Effects of normal saline vs. lactated ringer’s during renal transplantation. Ren Fail. 2008;30(5):535–539. doi:10.1080/08860220802064770
47. Kushner RF. Total parenteral nutrition-associated metabolic acidosis. JPEN J Parenter Enteral Nutr. 1986;10(3):306–310. doi:10.1177/0148607186010003306
48. Berend K, van Hulsteijn LH, Gans RO. Chloride: the queen of electrolytes? Eur J Intern Med. 2012;23(3):203–211. doi:10.1016/j.ejim.2011.11.013
49. Tonnesen AS. Clinical pharmacology and use of diuretics. In: Hershey SG, Bamforth BJ, Zauder H, editors. Review Courses in anesthesiology. Lippincott, Philadelphia; 1983:217–226.
50. Zazzeron L, Ottolina D, Scotti E, et al. Real-time urinary electrolyte monitoring after furosemide administration in surgical ICU patients with normal renal function. Ann Intensive Care. 2016;6(1):72. doi:10.1186/s13613-016-0168-y
51. Pfortmueller CA, Uehlinger D, von Haehling S, Schefold JC. Serum chloride levels in critical illness—the hidden story. Intensive Care Med Exp. 2018;6(1):10. doi:10.1186/s40635-018-0174-5
52. Neyra JA, Canepa-Escaro F, Li X, et al. Association of Hyperchloremia with Hospital Mortality in critically ill septic patients. Crit Care Med. 2015;43(9):1938–1944. doi:10.1097/CCM.0000000000001161
53. Shao M, Li G, Sarvottam K, et al. Dyschloremia is a risk factor for the development of acute kidney injury in critically ill patients. PLoS One. 2016;11(8):e0160322. doi:10.1371/journal.pone.0160322
54. Yessayan L, Neyra JA, Canepa-Escaro F, Vasquez-Rios G, Heung M, Yee J. Effect of hyperchloremia on acute kidney injury in critically ill septic patients: a retrospective cohort study. BMC Nephrol. 2017;18(1):346. doi:10.1186/s12882-017-0750-z
55. Huang K, Hu Y, Wu Y, et al. Hyperchloremia Is Associated With Poorer Outcome in Critically Ill Stroke Patients. Front Neurol. 2018;9:485. doi:10.3389/fneur.2018.00485
56. Van Regenmortel N, Verbrugghe W, Van den Wyngaert T, Jorens PG. Impact of chloride and strong ion difference on ICU and hospital mortality in a mixed intensive care population. Ann Intensive Care. 2016;6(1):91. doi:10.1186/s13613-016-0193-x
57. Yunos NM, Bellomo R, Story D, Kellum J. Bench-to-bedside review: chloride in critical illness. Crit Care. 2010;14(4):226. doi:10.1186/cc9052
58. Story DA. Hyperchloraemic acidosis: another misnomer? Crit Care Resusc. 2004;6(3):188–192.
59. Kitabchi AE, Umpierrez GE, John MM, Fisher JN. Hyperglycemic Crises in Adult Patients With Diabetes: a consensus statement from the American Diabetes Association. Diabetes Care. 2009;32(7):1335–1343. doi:10.2337/dc09-9032
60. Mahler SA, Conrad SA, Wang H, Arnold TC. Resuscitation with balanced electrolyte solution prevents hyperchloremic metabolic acidosis in patients with diabetic ketoacidosis. Am J Emerg Med. 2011;29(6):670–674. doi:10.1016/j.ajem.2010.02.004
61. Chua HR, Venkatesh B, Stachowski E, et al. Plasma-Lyte 148 vs 0.9% saline for fluid resuscitation in diabetic ketoacidosis. J Crit Care. 2012;27(2):138–145. doi:10.1016/j.jcrc.2012.01.007
62. Van Zyl DG, Rheeder P, Delport E. Fluid management in diabetic-acidosis Ringer’s lactate versus normal saline: a randomized controlled trial. QJM. 2012;105(4):337–343. doi:10.1093/qjmed/hcr226
63. Odor PM, Bampoe S, Dushianthan A, et al. Perioperative administration of buffered versus non-buffered crystalloid intravenous fluid to improve outcomes following adult surgical procedures: a Cochrane systematic review. Perioper Med. 2018;7:27. doi:10.1186/s13741-018-0108-5
64. Xue M, Zhang X, Liu F, et al. Effects of chloride content of intravenous crystalloid solutions in critically ill adult patients: a meta-analysis with trial sequential analysis of randomized trials. Ann Intensive Care. 2019;9:30.
65. Zhou F, Peng ZY, Bishop JV, Cove ME, Singbartl K, Kellum JA. Effects of fluid resuscitation with 0.9% saline versus a balanced electrolyte solution on acute kidney injury in a rat model of sepsis. Crit Care Med. 2014;42(4):e270–e278. doi:10.1097/CCM.0000000000000145
66. Todd SR, Malinoski D, Muller PJ, Schreiber MA. Lactated Ringer’s is superior to normal saline in the resuscitation of uncontrolled hemorrhagic shock. J Trauma. 2007;62(3):636–639. doi:10.1097/TA.0b013e31802ee521
67. Aksu U, Bezemer R, Yavuz B, Kandil A, Demirci C, Ince C. Balanced vs unbalanced crystalloid resuscitation in a near-fatal model of hemorrhagic shock and the effects on renal oxygenation, oxidative stress, and inflammation. Resuscitation. 2012;83(6):767–773. doi:10.1016/j.resuscitation.2011.11.022
68. Kellum JA. Fluid resuscitation and hyperchloremic acidosis in experimental sepsis: improved short-term survival and acid-base balance with Hextend compared with saline. Crit Care Med. 2002;30(2):300–305. doi:10.1097/00003246-200202000-00006
69. Wu BU, Hwang JQ, Gardner TH, et al. Lactated Ringer’s solution reduces systemic inflammation compared with saline in patients with acute pancreatitis. Clin Gastroenterol Hepatol. 2011;9(8):710–717.e1. doi:10.1016/j.cgh.2011.04.026
70. Reid F, Lobo DN, Williams RN, Rowlands BJ, Allison SP. (Ab)normal saline and physiological Hartmann’s solution: a randomized double-blind crossover study. Clin Sci (Lond). 2003;104(1):17–24. doi:10.1042/
71. Chowdhury AH, Cox EF, Francis ST, Lobo DN. A randomized, controlled, double-blind crossover study on the effects of 2-L infusions of 0.9% saline and plasma-lyte® 148 on renal blood flow velocity and renal cortical tissue perfusion in healthy volunteers. Ann Surg. 2012;256(1):18–24. doi:10.1097/SLA.0b013e318256be72
72. Young JB, Utter GH, Schermer CR, et al. Saline versus Plasma-Lyte A in initial resuscitation of trauma patients: a randomized trial. Ann Surg. 2014;259(2):255–262. doi:10.1097/SLA.0b013e318295feba
73. Bhaskaran K, Arumugam G, Vinay Kumar PV. A prospective, randomized, comparison study on effect of perioperative use of chloride liberal intravenous fluids versus chloride restricted intravenous fluids on postoperative acute kidney injury in patients undergoing off-pump coronary artery bypass grafting surgeries. Ann Card Anaesth. 2018;21(4):413–418. doi:10.4103/aca.ACA_230_17
74. Dey A, Adinarayanan S, Bidkar PU, Bangera RK, Balasubramaniyan V. Comparison of normal saline and balanced crystalloid (plasmalyte) in patients undergoing elective craniotomy for supratentorial brain tumors: A randomized controlled trial. Neurol India. 2018;66(5):1338–1344. doi:10.4103/0028-3886.241347
75. Verma B, Luethi N, Cioccari L, et al. A multicentre randomised controlled pilot study of fluid resuscitation with saline or Plasma-Lyte 148 in critically ill patients. Crit Care Resusc. 2016;18(3):205–212.
76. Roquilly A, Loutrel O, Cinotti R, et al. Balanced versus chloride-rich solutions for fluid resuscitation in brain-injured patients: a randomised double-blind pilot study. Crit Care. 2013;17(2):R77. doi:10.1186/cc12686
77. Chan JC, Asch MJ, Lin S, Hays DM. Hyperalimentation with amino acid and casein hydrolysate solutions. Mechanism of acidosis. JAMA. 1972;220(13):1700–1705. doi:10.1001/jama.1972.03200130032007
78. Heird WC, Dell RB, Driscoll JM, Grebin B, Winters RW. Metabolic acidosis resulting from intravenous alimentation mixtures containing synthetic amino acids. N Engl J Med. 1972;287(19):943–948. doi:10.1056/NEJM197211092871901
79. Caldwell MD, O’Neill JA, Meng HC, Stahlman MH. Evaluation of a new amino acid source for use in parenteral nutrition. Ann Surg. 1977;185(2):153–161. doi:10.1097/00000658-197702000-00004
80. Kato K, Sugiura S, Yano K, et al. Latent Risk of Acidosis in Commercially Available Total Parenteral Nutrition (TPN) Products: a randomized Clinical Trial in Postoperative Patients. J ClinBiochemNutr. 2009;45(1):68–73.
81. Weinberg L, Harris L, Bellomo R, et al. Effects of intraoperative and early postoperative normal saline or Plasma-Lyte 148® on hyperkalaemia in deceased donor renal transplantation: a double-blind randomized trial. Br J Anaesth. 2017;119(4):606–615. doi:10.1093/bja/aex163
82. Van Regenmortel N, Verbrugghe W, Roelant E, Van den Wyngaert T, Jorens PG. Maintenance fluid therapy and fluid creep impose more significant fluid, sodium, and chloride burdens than resuscitation fluids in critically ill patients: a retrospective study in a tertiary mixed ICU population. Intensive Care Med. 2018;44(4):409–417. doi:10.1007/s00134-018-5147-3
83. Langer T, Limuti R, Tommasino C, et al. Intravenous fluid therapy for hospitalized and critically ill children: rationale, available drugs and possible side effects. Anaesthesiol Intensive Ther. 2018;50(1):49–58. doi:10.5603/AIT.a2017.0058
 © 2020 The Author(s). This work is published and licensed by Dove Medical Press Limited. The full terms of this license are available at https://www.dovepress.com/terms.php and incorporate the Creative Commons Attribution - Non Commercial (unported, v3.0) License.
By accessing the work you hereby accept the Terms. Non-commercial uses of the work are permitted without any further permission from Dove Medical Press Limited, provided the work is properly attributed. For permission for commercial use of this work, please see paragraphs 4.2 and 5 of our Terms.
© 2020 The Author(s). This work is published and licensed by Dove Medical Press Limited. The full terms of this license are available at https://www.dovepress.com/terms.php and incorporate the Creative Commons Attribution - Non Commercial (unported, v3.0) License.
By accessing the work you hereby accept the Terms. Non-commercial uses of the work are permitted without any further permission from Dove Medical Press Limited, provided the work is properly attributed. For permission for commercial use of this work, please see paragraphs 4.2 and 5 of our Terms.