")
Back to Journals » Clinical Ophthalmology » Volume 15
The Impact of Inherited Retinal Diseases in the United States of America (US) and Canada from a Cost-of-Illness Perspective
Authors Gong J, Cheung S, Fasso-Opie A, Galvin O , Moniz LS, Earle D, Durham T, Menzo J, Li N, Duffy S, Dolgin J, Shearman MS, Fiorani C, Banhazi J, Daly A
Received 4 May 2021
Accepted for publication 16 June 2021
Published 1 July 2021 Volume 2021:15 Pages 2855—2866
DOI https://doi.org/10.2147/OPTH.S313719
Checked for plagiarism Yes
Review by Single anonymous peer review
Peer reviewer comments 2
Editor who approved publication: Dr Scott Fraser
Jennifer Gong,1 Simone Cheung,2 Alivia Fasso-Opie,3 Orla Galvin,4 Larissa S Moniz,5 Doug Earle,5 Todd Durham,6 Jason Menzo,6 Nan Li,7 Stephanie Duffy,7 Jill Dolgin,8 Mark S Shearman,8 Chiara Fiorani,9 Judit Banhazi,9 Avril Daly4
1Health Economics and Social Policy, Deloitte Access Economics, Melbourne, Victoria, Australia; 2Health Economics and Social Policy, Deloitte Access Economics, Sydney, New South Wales, Australia; 3Health Economics and Social Policy, Deloitte Access Economics, Canberra, Australian Capital Territory, Australia; 4Retina International, Dublin, D08 R9CN, Ireland; 5Fighting Blindness Canada, Toronto, Ontario, Canada; 6The Foundation Fighting Blindness, Raleigh, North Carolina, USA; 7The Janssen Pharmaceutical Companies of Johnson and Johnson, Raritan, New Jersey, USA; 8Applied Genetic Technologies Corporation, Cambridge, Massachusetts, USA; 9Novartis Pharma AG, Basel, Switzerland
Correspondence: Avril Daly Email [email protected]
Objective: To estimate the annual cost of inherited retinal diseases (IRDs) in the United States of America (US) and Canada from a societal perspective – including costs to the health system, individual and family productivity costs, lost wellbeing and other societal economic costs – by setting and payer. Findings will inform the need for policy action to mitigate the impact of IRDs.
Methods: The costs of IRDs were estimated using a cost-of-illness methodology, based on the prevalence of IRDs in each country. Intangible costs of reduced wellbeing were also estimated using disability-adjusted life years which were then converted to monetary values using the value of a statistical life.
Results: Using base prevalence rates, total costs attributable to IRDs in the US were estimated to range between US$13,414.0 and US$31,797.4 million in 2019, comprising both economic costs (between US$4,982 and US$11,753.9 million; 37% of total costs) and wellbeing costs (between US$8,431.7 and US$20,043.6 million; 63%). Total costs attributable to IRDs in Canada were estimated to range between CAN$1637.8 and CAN$6687.5 million in 2019, comprising both economic costs (between CAN$566.6 and CAN$2,305.7 million; 34%) and wellbeing costs (between CAN$1,071.4 and CAN$4,381.9 million; 66% of total costs).
Conclusion: The impact of IRDs in the US and Canada is substantial when considering both economic costs and reduced wellbeing. The wellbeing costs due to IRDs in the US and Canada are considerable, accounting for over 60% of total costs. Vision loss from IRDs often manifests in childhood, meaning some people live with vision impairment and blindness for their whole lives. Further research into current and emerging cost-effective therapies and interventions is required given the substantial economic burden faced by those living with vision loss.
Keywords: genetic diagnosis, inherited retinal disease, cost-of-illness
Introduction
Inherited retinal diseases (IRDs) are a diverse group of progressive conditions characterized by photoreceptor cell death and loss of the retinal pigment epithelium (RPE).1 The genetic mutations that cause IRDs impact retina function and, as a consequence, can lead to significant vision loss. There are three modes of inheritance for IRDs, autosomal dominant, autosomal recessive and X-linked, however, there are cases of individuals living with an IRD who do not have a family history of the condition.2 The genetic and clinical heterogeneity of IRDs classifies each condition as a rare disease.3 In the United States of America (US), a disease is classified as rare if it affects one in 1,500 people.4 In Canada, a disease is classified as rare if it affects less than one in 2,000.5 Although there are commonalities in the clinical pathology of IRDs, it should be noted that the physical and psychosocial disability of each condition is highly varied and it can be difficult to compare the degree of disability of each condition. For example, Usher syndrome does not only impact vision loss but also causes deafness, causing profound disrupted sensory function for those with the condition.1
For people living with IRDs, the current treatment is to manage the condition as there are no effective treatments to restore vision. Several therapies are currently in clinical development to provide alternative treatment and cure options to slow down the disease progression, with some clinical trials reporting the success of gene and neurotrophic factor therapy. Currently, the most advanced treatment success has been gene augmentation therapy for IRDs caused by biallelic mutations in the RPE65 gene, which has received approval from the federal health agency within the US and Canada.6
People living with a vision impairment often live with other comorbidities. There exists literature which suggests that individuals living with visual impairment are associated with an increased risk of developing mental health conditions including depression and anxiety.7 A study with community samples found that after adjusting for demographic factors, the group with reduced vision individuals were 1.6–2.8 times more likely to develop depression compared to the group with no vision impairment.8 Further, as IRDs typically manifest during childhood, this has lifelong implications for both the child and their family. Focus group discussion with parents of children with vision impairment revealed that the most common concerns included frustrations around the lack of cure for their child’s ocular condition, and psychosocial problems faced by family members who were worried that their child was being teased by other children.9 These findings indicate that vision impairment does not only have a physical impact but also has a wider non-clinical impact on the mental health and wellbeing of those living with a visual impairment and their families.
The lack of consistent data and the underdiagnosis and misdiagnosis of IRDs highlights the opportunity to identify and describe the burden and impact of IRDs. These important measures will inform health policy and planning and ensure funding and programs are available to improve the development of emerging interventions for people living with IRDs.
There is currently a lack of similar studies that estimate the prevalence and economic impact of IRDs. This is largely driven by inconsistent data collection leading to large data gaps in the literature. A cost-of-illness study conducted in the United Kingdom (UK) and Republic of Ireland (RoI) has estimated the prevalence and socioeconomic impact of IRDs in 2019.10,11 The overall prevalence of IRDs was estimated to be 0.03% - 0.05% which represented 20,814–35,126 cases in the UK and 1,522–2,569 cases in RoI in 2019. Using the lower band estimates, the study found the total cost due to IRDs in the UK to be US$765.1 million in 2019, comprising both economic costs (US$478.4 million; 62.5%) and wellbeing costs (US$286.7 million; 37.5%).10,11 In RoI, the total cost attributed to IRDs was estimated to be US$61.3 million in 2019, comprising both economic (US$41.5 million; 67.7%) and wellbeing costs (US$ 19.8 million; 32.3%).10,11 Although these findings highlight the significant economic and wellbeing costs attributed to IRDs in the UK and RoI, their applicability to other countries is limited given the lack of similar prevalence or economic impact studies in other countries. Furthermore, given the difference in healthcare systems amongst countries, for example, the UK healthcare system is predominantly a public system compared to the US healthcare system which has a larger private sector system, the expenditure on health care and subsequently which payer bears the costs differ significantly between countries. Although neighboring countries, the US and Canadian health care system differ considerably, with the US healthcare system being primarily privately owned and the Canadian health primarily a public healthcare system. It is therefore important to estimate country-specific costs pertaining to the qualities of each healthcare system.
This study aimed to contribute to the knowledge gaps in the literature and presents data from two cost-of-illness reports for the US and Canada, which used a targeted literature review and primary data (survey) collection approach for real-world evidence data generation from patients and their caregivers.
Materials and Methods
A cost-of-illness methodology applying a prevalence approach was used to estimate the socioeconomic burden of IRDs in the US and Canada. This methodology involved estimating the number of persons living with an IRD and its attributable cost in 2019. An overview of the epidemiological and cost of illness approach is provided in the subsections below with a detailed description of the methodology found in Tables S1 and S2. The analysis was based on a targeted literature review and primary data collection (survey). Fourteen IRDs were included in this cost-of-illness study including: achromatopsia, Bardet-Biedl Syndrome (BBS), best disease, blue cone monochromacy (BCM), choroideremia, cone dystrophy, cone-rod dystrophy, Leber congenital amaurosis (LCA), Leber’s hereditary optic neuropathy (LHON), retinitis pigmentosa (RP), rod-cone dystrophy, Stargardt disease, Usher syndrome and X-linked retinoschisis (XLRS).
Epidemiological Approach
This study uses a prevalence approach to estimate the costs of IRDs in the US and Canada separately, in 2019. In the prevalence approach, only the costs incurred in 2019 are considered.
A lower bound (approach 1) and an upper bound (approach 2) were used to derive the prevalence estimates for this cost-of-illness modeling in the absence of country-specific prevalence estimates for IRDs. Both lower and upper bound estimates rely upon an available point prevalence estimate (either for a specific condition, or for total IRDs) which was sourced from the literature and then used to derive the relative prevalence of the remaining IRDs. The prevalence of IRDs in the US and Canada was then distributed by age and sex.
Cost Approach
Costs were categorized into groups, including costs to the health system, individual productivity losses, other costs and wellbeing costs. Each cost category was disaggregated by payer type. The cost estimate is the first round of societal impacts only.
Health System Costs
Costs to the health system include primary and secondary care, diagnostic tests, pharmaceuticals, vitamins and supplements, and medical research. In the US, health system costs are largely borne by private health insurers; however, sub-groups of the population may have their costs covered by federal programs, such as Medicare and Medicaid, or pay out-of-pocket payments.12 In Canada, the primary source of payment is financed through provincial governments followed by federal funding.13 International literature on the economic cost of IRDS is scarce, but there does exist literature in Canada on estimating the cost of vision loss.14 Health services utilization data was sourced from country-specific survey results and unit costs were obtained from country-specific reference prices including the Canadian National Institute of the Blind (CNIB).15
The disaggregation of health system costs by payer in Canada was obtained from published material from the Canadian Institute for Health Information. In the US, the disaggregation of health system costs by payer was obtained from the Agency for Healthcare Research and Quality16 for hospitalization costs and the Centers for Medicare and Medicaid Services17 for non-hospital costs. Both sources publish an estimated share of health system costs borne by government, private health insurance, patients (that is out-of-pocket costs) and others.
Productivity Costs
Factors which affect a patients’ ability to participate fully in the workforce include higher absenteeism, lower employment, premature death and premature retirement.18 Persons living with an IRD may face productivity losses in terms of lost productive time and reduced workforce participation. A human capital approach, calculating the difference in employment rate between persons living with an IRD and the general population, was adopted to estimate the productivity losses attributable to IRDs.
Other Costs
Costs for aids and modifications, informal and formal care, travel, education, and deadweight losses of taxation payments were captured in other costs. Where possible, country-specific survey results were used to inform this section supplemented with reference costs and other data obtained from grey literature.
Loss of Wellbeing
A non-financial approach detailed in the World Health Organization (WHO) burden of disease methodology, measuring disability adjusted life years (DALYs), was used to estimate the loss of wellbeing.19 DALYs are calculated by assigning disability weights to various health states, where a weight between zero and one reflects the quality of life that is lost due to a particular condition. A disability weight, obtained from the IHME’s Global Burden of Disease Study 2017, was applied to the prevalence of IRDs in the US and Canada and discounted at a rate of 3% consistent with WHO methodology.15
Data Collection Methods
Targeted Literature Review
A targeted literature review of publicly available databases including PubMed and Cochrane Library was conducted to identify the most relevant inputs for this report. In the absence of appropriate scientific literature to inform the inputs of the modeling, additional ad-hoc searches were performed.
Survey Data Collection and Analysis
Persons living with an IRD and/or the parent of children (under 18) living with an IRD in Canada or the US were invited to self-register their interest in completing the survey via an online registration form. The survey was intended to address any data gaps identified in the targeted literature review and collect health service utilization data and productivity impacts of persons living with an IRD and the parents of children (under 18) living with an IRD. Ethical and patient consent procedures complied with relevant data protection, ethical and compliance obligations.
Results
A total of 838 responses were received from persons with an IRD or the parents of children (under 18) living with an IRD. Of the 838 survey responses, approximately 20% (n=151) were received from Canada and 80% (n=687) were received from the US.
Prevalence
In 2019, the lower and upper bound estimate for the 14 IRDs was estimated to range between 184,048 and 437,511 prevalent cases (0.056% to 0.133%) in the US; and between 20,947 and 85,672 prevalent cases (0.056% to 0.228%) in Canada (Table 1).
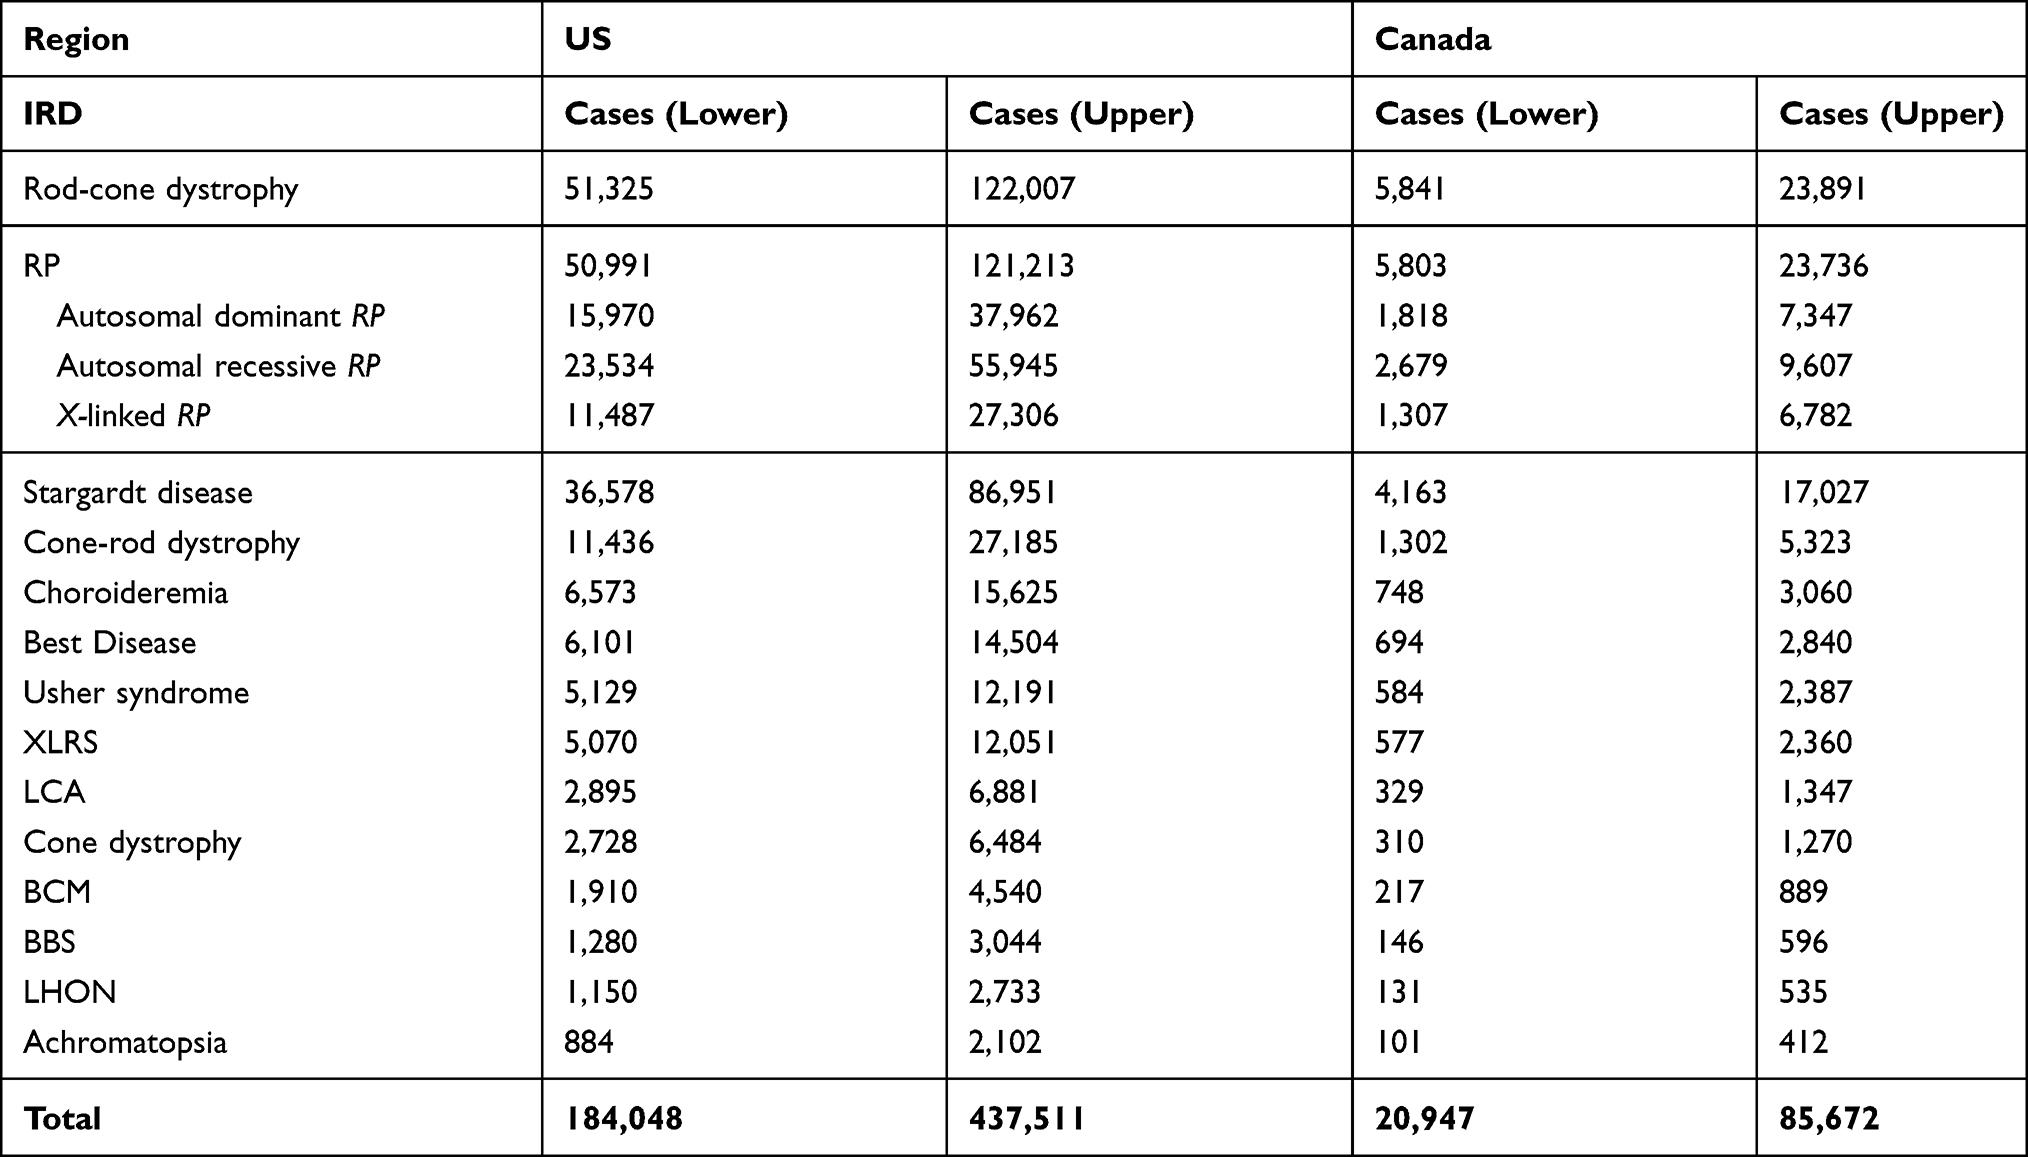 |
Table 1 Prevalence Case of People Living with IRDs in the US and Canada |
Total Costs
Total costs attributable to IRDs in Canada were estimated to range between CAN$1,637.8 to CAN$6,687.5 million in 2019. Wellbeing costs make up the majority of costs (between CAN$1,071.4 to CAN$4,381.9 million; 66%), followed by economic costs (between CAN$566.6 to CAN$2,305.7 million; 34%). The greatest proportion of total costs was incurred by rod-cone dystrophy (between CAN$459.1 to CAN$1,874.4 million; 28.0%), followed by RP (between CAN$452.5 to CAN$1,847.5 million, 27.6%), Stargardt disease (between CAN$322.6 to CAN$1,317.3 million, 19.7%) and cone-rod dystrophy (between CAN$102.3 to CAN$417.6 million, 6.2%). The cost breakdown by IRD in Canada can be located in Table 2.
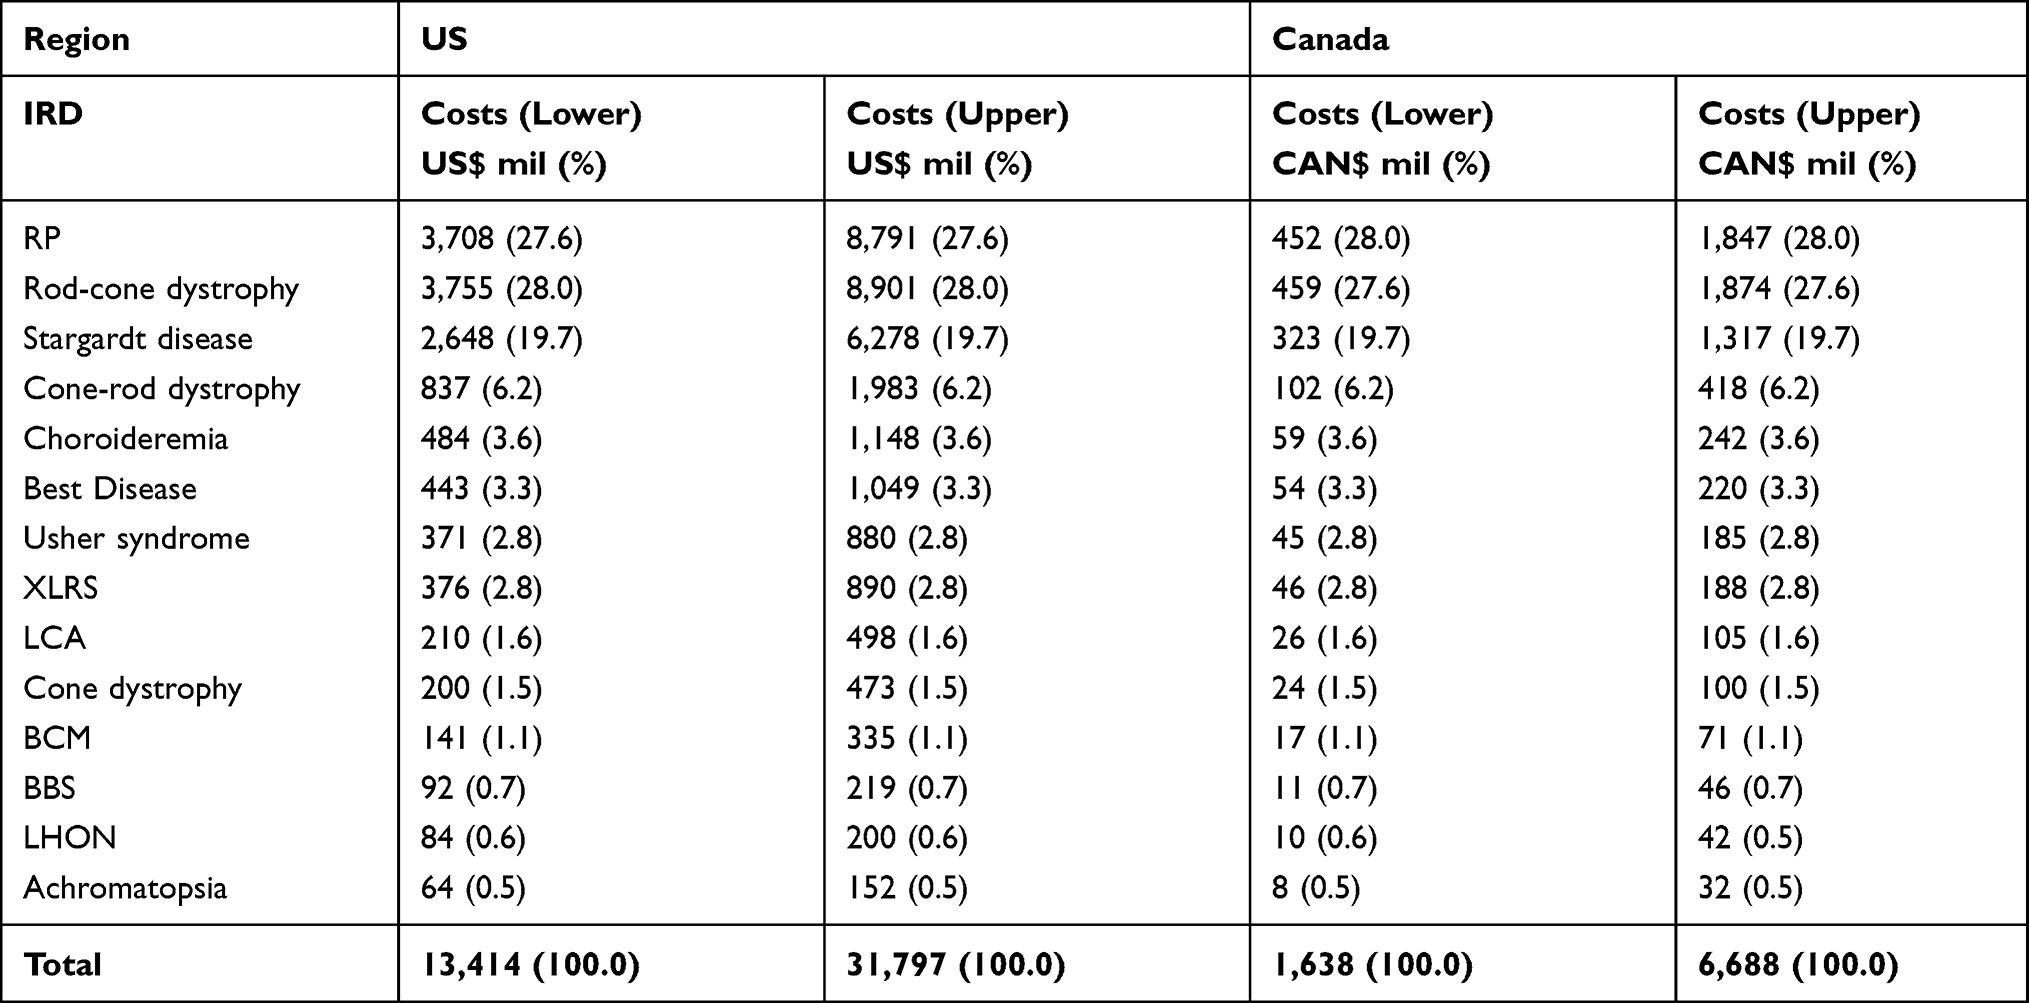 |
Table 2 Estimated Total Cost and Proportion (%) of Total Cost in the US and Canada by IRD |
In Canada, the greatest share of total costs was attributed to loss of wellbeing (between CAN$1107.4 to $4,381.9 million, 65.4%), followed by productivity losses (between CAN$219.0 to $895.5 million, 13.4%), informal caregiver costs (between CAN$162.0 to CAN$1,063.3 million, 9.9%), other costs (between CAN$109.4 to CAN$447.4 million, 6.7%), deadweight losses (between CAN$38.3 to CAN$155.7 million, 2.3%) and health system costs (between CAN$37.8 to CAN$144.3 million, 2.3%). The cost breakdown by cost type in Canada can be located in Table 3 and Figure 1A. These costs indicate that IRDs not only impose an economic cost but are also associated with substantial wellbeing costs due to the long-term pain and suffering faced by persons living with an IRD.
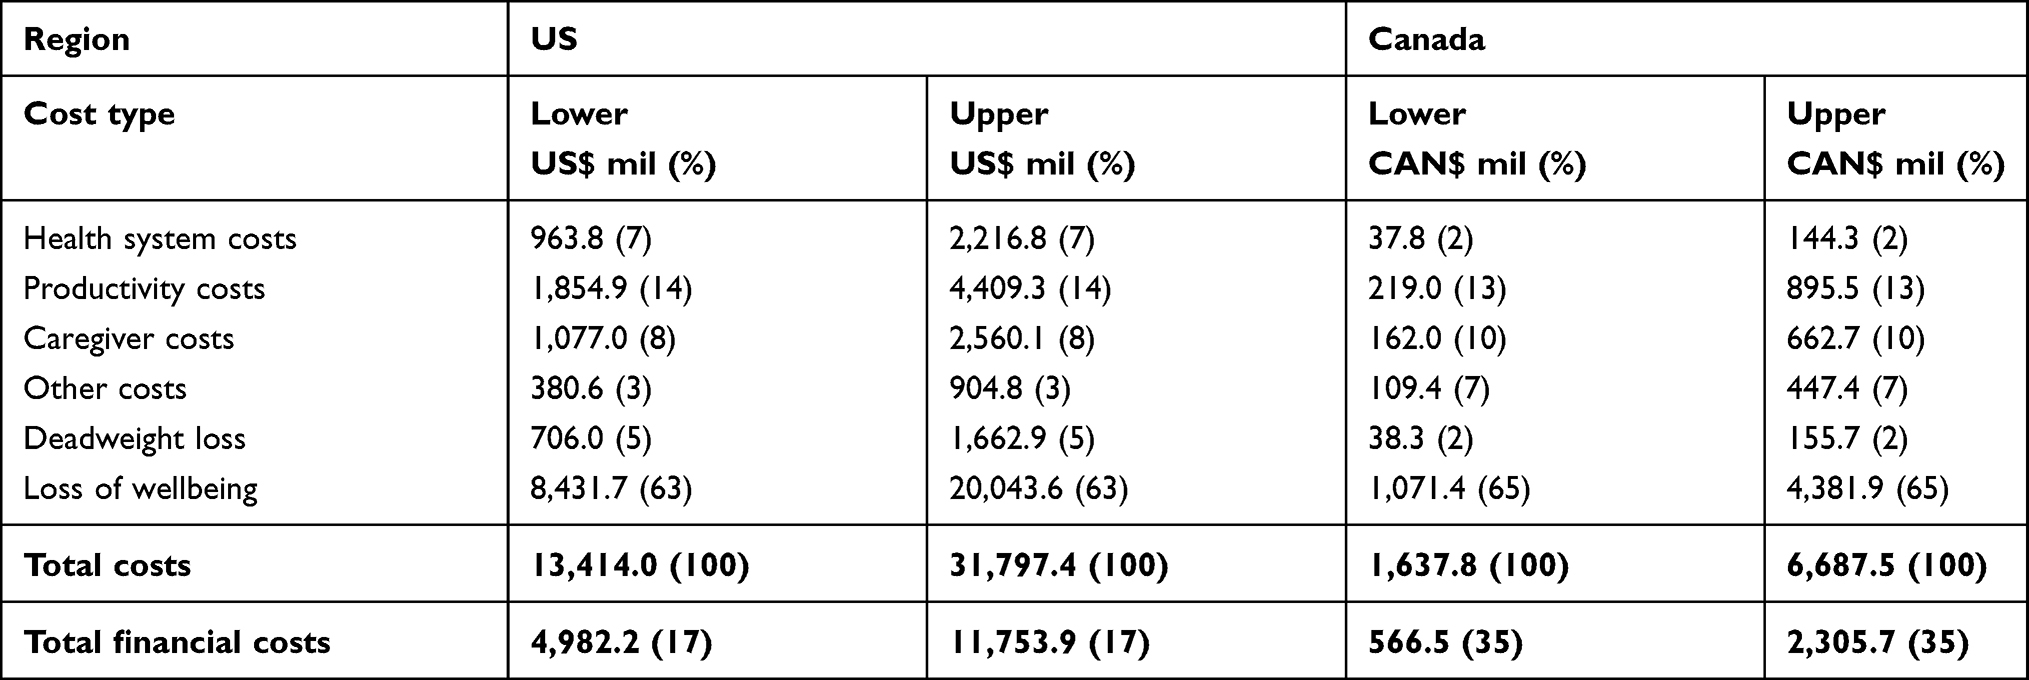 |
Table 3 Estimated Total Cost and Proportion of Total Cost in the US and Canada by Cost Component |
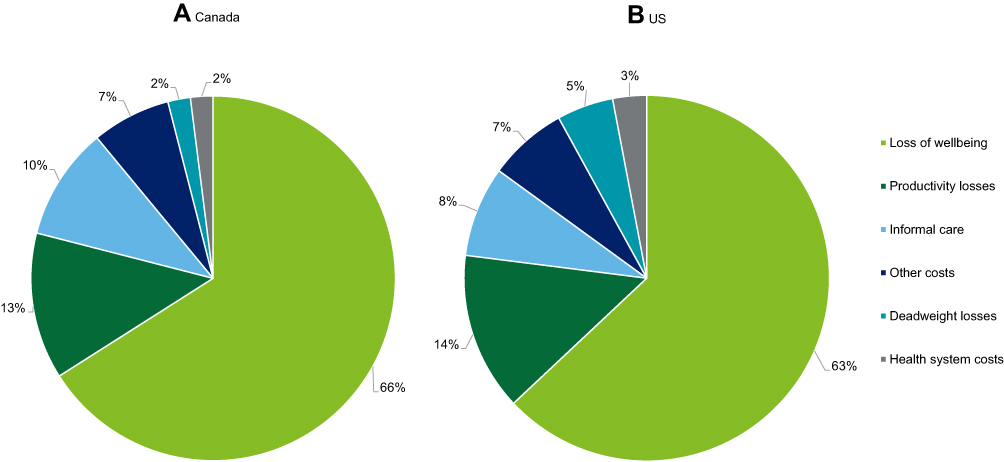 |
Figure 1 Proportion (%) of total costs of IRDs in Canada (A) and the US (B) by cost type in 2019. |
Total costs attributable to IRDs in the US were estimated to range between US$13,414.0 and US$31,797.4 million in 2019. Wellbeing costs make up the majority of costs (between US$8,431.7 and US$20,043.6 million; 63%), followed by economic costs (between US$4,982.2 and US$11,753.9 million; 37.0%). The greatest proportion of total costs was incurred by rod-cone dystrophy (between US$3,754.9 and US$8,900.9 million); 28.0%, followed by RP (between US$3,708.4 and US$8,790.6 million, 27.6%), Stargardt disease (between US$2,648.3 and US$6,277.5 million, 19.7%) and cone-rod dystrophy (between US$836.7 and US$1,983.3 million, 6.2%). The cost breakdown by IRD in the US can be located in Table 2.
Similar to Canada, the greatest share of total costs was attributed to loss of wellbeing (between US$8,431.7 and $20,043.6 million; 62.9%), followed by productivity losses (between US$1,854.9 and US$4,409.3, 13.8%), informal care (between US$1077.0 and US$2,560.1 million, 8.0%), health system costs (between US$963.8 and US$2,216.8 million, 7.2%), deadweight loss (between US$706.0 and US$1,662.9 million, 5.3%) and other costs (between US$308.6 and US$904.8 million, 2.8%). The cost breakdown by cost type in the US can be located in Table 3 and Figure 1B.
Financial Costs of IRDs
Health System Costs
In the US, health system costs attributed to IRDs were estimated to range between US$963.8 to US$2,216.8 million in 2019. Pharmaceutical costs were the most costly component, comprising of 50.5% of total health system costs (between US$487.0 and US$1,157.6 million), followed by primary health care (between US$249.9 and US$594.1 million; 25.9%). The least costly component of the health system was accounted for by vitamins and supplements, totaling between US$2.8 and US$6.7 million (0.3%).
In Canada, health system costs attributed to IRDs were estimated to range between CAN$37.8 and CAN$144.3 million in 2019. Primary health care was the most costly component, comprising of 59.5% of total health system costs (between CAN$22.5 and CAN$92.1 million), followed by diagnostic tests (between CAN$7.3 and CAN$29.9 million; 19.3%). The least costly component of the health system was accounted for by pharmaceuticals and medical research (lower and upper bound, respectively,), totaling CAN$1.0 (2.6%) and CAN$2.0 million (1.4%) respectively.
Productivity Costs
In the US, the productivity losses associated with IRDs were estimated to range between US$1,706.2 and US$4,056.0 million in 2019. Reduced workforce participation comprised the largest share of productivity losses (between US$1,515.8 and US$3,603.3 million; 88.8%), followed by absenteeism (between US$177.4 and US$421.7 million; 10.4%) and presenteeism (between US$13.1 and US$31.1 million; 0.8%).
In Canada, the productivity losses associated with IRDs were estimated to range between CAN$205.2 and CAN$839.2 million in 2019. Reduced workforce participant comprised the largest share of productivity losses (between CAN$148.7 and CAN$608.1 million; 72.5%), followed by absenteeism (between CAN$49.9 and CAN$204.2 million; 24.3%) and presenteeism (between CAN$6.6 and CAN$27.0 million; 3.2%).
Other Costs
In the US, total other costs attributed to IRDs were estimated to range between US$2163.6 and US$5127.7 million in 2019. The largest share of other costs were accounted for by informal care (between US$1,065.0 and US$2,531.8 million; 49.2%), followed by deadweight loss (between US$706.0 and US$1,662.9 million, 32.6%) and aids and modifications (between US$380.6 and $904.8 million, US17.6%). Families borne the largest component of other costs (39%), followed by society (33%) and individuals (12%).
In Canada, total other costs attributed to IRDs in Canada were estimated to range between CAN$309.8 and CAN$1265.9 million in 2019. The largest share of other costs were accounted for by informal care (between CAN$129.5 and CAN$529.5 million; 41.8%), followed by aids and modifications (between CAN$109.4 and CAN$447.4 million, 35.5%), deadweight losses (between CAN$38.3 and CAN$155.7 million, 12.4%), formal care (CAN$16.4 to CAN$67.3 million, 5.3%) and residential care costs (between CAN$16.1 and CAN$66.0 million, 5.2%). Families borne the largest component of other costs (37%), followed by individuals (34%) government (17%) and society (12%).
Non-Financial Costs of IRDs
Loss of Wellbeing
In the US, the total burden associated with persons living with an IRD was estimated to be 28,236 to 67,121 DALYs. This results in an overall wellbeing cost estimated to range between US$8,431.7 and US$20,043.6 million or US$45,813 per person with an IRD.
In Canada, the total burden associated with persons living with an IRD was estimated to be 3,205 to 13,108 DALYs. This results in an overall wellbeing cost estimated to range between CAN$1,071.4 and CAN$4,381.9 million or CAN$51,147 per person with an IRD.
According to the US survey responses, the majority of participants living with an IRD reported their wellbeing was negatively impacted due to having an IRD. Approximately three-quarters (76.0%) of respondents reporting experiencing anxiety, three-fifths (67.1%) reporting depression and over one-third (36.5%) reporting social isolation. The Canadian survey responses show similar trends on wellbeing, with over four-fifths of persons living with an IRD reporting experiencing anxiety, three-quarters (74.2%) reporting depression and close to half (48.4%) of respondents reporting social isolation.
Deadweight Losses
The deadweight loss due to lost taxation revenue or additional expenditure on government programs was estimated by applying the marginal burden of taxation to the total of lost taxation and government expenditures. In Canada and the US, the marginal burden was estimated to be 14%20 and 33%, respectively.21–24 The total deadweight losses in Canada and the US attributed to IRDs were estimated to range between CAN$38.3 and CAN$155.7 million and between US$706.0 and US$1,662.9 million, respectively, in 2019.
Costs by Payer
The economic costs of IRDs in the US and Canada for persons living with an IRD and their family members are significant. However, costs of IRDs in the US and Canada are also borne by other payers, including the government, employers and society/other (such as health insurers).
Figure 2A and B illustrate the percentage of cost by payer in Canada and in the US respectively. In Canada, the greatest share of total costs was borne by individuals (80.0%), followed by government (7.5%), family/friends (7.0%), employers (2.9%), and society/other (2.7%). In Canada, some low vision aids can be accessed for free through provincial assistive device programs25 and charitable organizations, such as guide dog charities.26 In the US, the greatest share of total costs was borne by individuals (74.7%), followed by government (9.6%), family/friends (6.4%), society/other (5.4%), private health insurer (2.1%) and employers (1.7%).
 |
Figure 2 Proportion (%) of total costs of IRDs in Canada (A) and the US (B) by payer in 2019. |
Discussion
This study shows the substantial economic and wellbeing costs of IRDs in the US and Canada in 2019 – which may well yet to be an under-estimation. Our findings highlight that persons living with an IRD incur significant economic costs and face a lower quality of life. The highest cost attributed to IRDs is related to wellbeing costs, at 66% and 63% in Canada and the US respectively. This highlights the significant burden IRDs have on the quality of life from initial diagnosis in early childhood and into adulthood. The prevalence estimates of IRDs in the US reported in this study are similar to those found in the literature, where approximately 200,000–300,000 people were affected by an IRD in the US.27 The wellbeing cost per person with IRDs was estimated to be US$45,813 in the US and CAN$51,147 in Canada in 2019. These costs are higher than those previously found in the literature, where the value of lost wellbeing as a result of vision loss was valued at $33,704 per person per annum in 2007.12 However, this is not surprising given that IRDs are a subset of visual impairment and due to their rarity, people living with IRDs have limited treatments to slow down the progression of vision loss.
One of the findings from this study, further supported by existing literature, is the relative lack of awareness of – and consequently, investment in – IRDs and their cost to society. The IRD community – both patients and caregiver – report frustration with a lack of awareness of their, and their dependents’, condition, with 63.6% in the US and 75.7% in Canada agreeing or strongly agreeing with this sentiment. Furthermore, despite their high costs to society, IRDs receive proportionally less research investment than other non-fatal diseases. In the US in 2019, Parkinson’s disease has costed the economy US$53.8 billion, attracting US$224 million in research funding.28 By contrast, IRDs cost the US economy between US$13.4 billion and $31.8 billion, but only received US$11 million of research funding; a small proportion of funding compared to the $985 million dedicated towards vision research in 2019.29 This implies Parkinson’s research was funded between 4 and 14 times as much per dollar of cost to society than research into IRDs.
In Canada, arthritis receives considerable research funding, totaling $206 million over a period of 5 years.30 Though it should be noted that the prevalence of arthritis is much higher than IRDs in Canada, affecting 1 in 5 persons, research funding into this area means those living with arthritis can manage and treat their condition and live a reasonably comfortable life.31 Evidently, IRDs are significantly underfunded as an area of research – increasing awareness of them as a condition would increase government and research bodies’ commitment to funding research and alleviate some of the significant costs to society they impose. Furthermore, given the high cost of wellbeing of IRDs and the limited number of interventions to slow the progression of vision loss, there is an urgent need to focus on reducing the burden of disease on the wellbeing and quality of life of those living with IRDs as well as their family and friends.
It should be noted that the financial cost of rare conditions varies considerably depending on the impact of the condition on the individual’s day-to-day living. Juvenile Idiopathic Arthritis (JIA) is a rare type of arthritis that occurs in children and affects 1 in 1,000 children.32 A cost study based in Nova Scotia Canada found that the annual median direct medical cost per JIA patient was CAN$619.5 in 2009 (CAN$736.1 in 2019 dollars).33 This is in comparison to the average health system cost borne by each IRD patient in Canada, which this study estimated was between CAN$1,684 to $1,802. Although it should be noted that the cost studies capture different cost types, the comparison of these two rare illnesses highlights the impact of the financial burden on patients living with a rare illness, and the significant costs incurred by those living with a rare condition.
IRD patients and caregivers can be frustrated by a lack of awareness in the community of their conditions. Therefore, it is important to build strong awareness of IRDs across the ophthalmic and healthcare settings, to ensure health professionals are equipped with the knowledge to best inform and support their IRD patients. As a first step, this may be targeting a cohort of professionals, such as retinal specialists or ophthalmologists, who can perform a range of tasks from test selection, interpretation of test results, initiation of genetic testing, and directing patients and families to additional information and support services.34
The wellbeing status of survey participants in the US and Canada critically highlights the significant and ongoing negative impacts experienced by persons living with an IRD. Approximately three in four persons living with an IRD in the US and over four in five persons living with an IRD in Canada reported experiencing anxiety. It is important to note that these findings, amongst the others described, relate to a period prior to the COVID-19 pandemic. As the pandemic has been a major disruption to people’s lives, it is expected that individuals are experiencing heightened negative feelings. A recent report published by the Canadian Council of the Blind found over 50% of survey respondents in the vision loss community said they were concerned that the additional stress from the pandemic crisis may cause them to feel overwhelmed.35 Further, 40% of respondents said they were experiencing more than moderate stress due to the impacts of the COVID-19 pandemic. Since people with IRDs are particularly likely to have severe vision loss and blindness compared to those surveyed, it is likely they experience even more substantial impacts as a result of the disruption caused by the pandemic. These impacts may continue to affect the lives of those living with an IRD for years to come and at least until the pandemic is under control.
Although IRDs are a heterogenic and complex group of conditions, they are also actionable conditions. For patients to make informed decisions regarding their condition requires the support from health and policy makers at the national and regional levels. This means ensuring individuals living with an IRD and their family have equitable access to genetic testing, which is integral in making critical life decisions, developing a holistic care plan, and access to appropriate clinical trials and emerging therapies. Patients know that the quality and availability of genetic testing and subsequent care can vary significantly, and as a result, the wellbeing of patient and family, and the financial costs incurred, can be influenced significantly by the availability of high-quality testing, genetic counseling, and considered care from medical professionals.
The costs of disease are borne by different payers in society. Understanding the distinction of these costs will help make informed decisions regarding interventions and policy decisions. While the findings of this study show that persons living with an IRD borne the majority of the cost, family members and other parts of society also borne considerable cost attributable to IRDs. In the US and Canada, 86% and 90% of the total IRD costs were borne by individuals affected, their families, friends and society, respectively.
Given the lack of estimating the socioeconomic impact of IRDs in the US and Canada, current methods for therapeutic reimbursement assessment do not adequately incorporate the impact and cost burden for each payer. As this paper provides the most updated cost and burden estimates for IRDs in the US and Canada to date, the findings can be used to inform decisions to allow the promise of genetic, pharmacological, technological and regenerative medicine to be realized and transform the lives of millions of patients and families worldwide.
Furthermore, appropriate reimbursement assessments should be developed for the IRD community. Current methods of reimbursement are suitable for populations whose conditions necessitate close engagement with the health system. For example, the direct health care costs for people with stroke and cardiovascular disease represent 50% and 60% of total associated costs, respectively. However, the IRD population does not rely heavily on the health care system; health costs only represent 7.2% of total costs in the US and 2.3% of total costs in Canada. This also reinforces that, as IRD patients do not frequently use the health care system, the holistic cost-of-illness study outlined in this study is most appropriate for this condition.
Considering that the US and Canada currently underestimate and underfund investment in IRDs relative to their burden on the economy, and that current needs for testing and care services are in many cases unmet, there is a case for greater investment in these avenues to reduce the cost of IRDs to society. This investment should consider the need for reimbursement to individuals and families who bear the greatest burden of the cost, due to limited availability of treatments, and who do not benefit as significantly from compensation through the health system as patients of other diseases.
Our study has several limitations, including: (1) the limited availability of estimates of population prevalence of IRDs, and a lack of data on the prevalence in the US and Canada; (2) the discrepancy in definition of different IRDs in the literature; (3) the low overall prevalence of IRDs in the US and Canadian population, resulting in sensitivity of total cost calculations to prevalence estimates. To counter these limitations, survey data were collected to inform some inputs of the model; while survey participants were selected using a non-probabilistic convenience sampling method, bias may exist as the responses skew towards those with access to internet and computer technology. In this way, the survey results may not generalize perfectly to the broader IRD community of the US and Canada.
Acknowledging the limitations of the study, from these data, some important themes emerge. These include the relative lack of awareness of IRDs, and underinvestment compared to other diseases; the importance of better access to genetic testing and general care for the IRD community; and the necessity of more considered methods of reimbursement, incorporating the full scope of personal and societal costs of IRDs.
Conclusion
In conclusion, this study highlights the significant annual cost of IRDs to the US and Canadian society, a cost driven by the lack of investment in and awareness of these rare conditions. These costs were estimated at minimum to total an annual cost of US$13.4 billion in the US and CAN$1.6 billion in Canada and may reach as high as US$31.8 billion in the US and CAN$6.7 billion in Canada. Ongoing research funding and the implementation of more considered and tailored policy could contribute to reducing the cost burden of IRDs on society. This includes providing continual research funds to identify remaining unknown casual genes, ongoing research to develop treatment and therapies, improve access to genetic testing and counseling, reassessing and developing policy regarding methods of reimbursement for the IRD and vision loss community with regard to care and treatment and ongoing education of all professionals involved in eye care in identification and management pathways for patients living with IRDs.
Further investment in policies to improve the experience of the medical system for people living with IRDs will help to reduce the frustration of the IRD community with the lack of available interventions and treatments to manage their condition. In addition, appropriate approaches to reimbursement should be developed for the IRD community that considers the lower rates of engagement with the health system and the greater proportion of costs borne by individuals, their families and broader society. It is therefore clear that IRD patients and their families have a need for greater investment in research for their condition; timely equitable access to genetic testing and care; and a revision of the reimbursement decision and framework which currently focuses on the cost-of-illness of the healthcare system.
Ethics
Ethical and patient consent procedures complied with all requirements set out in the Declaration of Helsinki's ethical and compliance obligations and were reviewed and approved by the Retina International Ethics and Accessibility Review Board.
Acknowledgments
Retina International would like to thank Chad Andrews (Fighting Blindness Canada) for his support in progressing this study in Canada, Mary Sunderland (Novartis Canada) for her support in reviewing this publication, and to all the patients and caregivers who gave their time freely to participate in this research. Deloitte Access Economics conducted the study on which this manuscript is based. The study was funded by Retina International. Retina International also funded the manuscript preparation.
Funding
Retina International engaged Deloitte Access Economics in 2020 to estimate the socioeconomic impact of inherited retinal dystrophies (IRDs) in Canada and the US.Retina International received funding and support for the project from a consortium of patient organizations and industry partners led by Retina International, who recognized the need to better understand the real-world impact of inherited retinal dystrophies (IRDs) in the United States of America (USA) and Canada. The consortium collaboration partners involved in this study were Applied Genetic Technologies Corporation (AGTC), Fighting Blindness Canada, Foundation Fighting Blindness USA, The Janssen Pharmaceutical Companies of Johnson and Johnson, Biogen, MeiraGTX, F. Hoffmann-LaRoche AG, Novartis Pharma AG, and Retina International. Each partner funded and assisted in the design of the project and recruitment of survey participants.
Disclosure
Simone Cheung, Alivia Fasso-Opie and Jennifer Gong are employees of Deloitte Access Economics and wrote the original reports from which this manuscript has been derived. Orla Galvin and Avril Daly are employees of Retina International, Larissa Moniz and Doug Earl are employees of Fighting Blindness Canada, Todd Durham and Jason Menzo are employees of The Foundation Fighting Blindness, Nan Li and Stephanie Duffy are employees of The Janssen Pharmaceutical Companies of Johnson and Johnson, Jill Dolgin and Mark Shearman are employees of Applied Genetic Technologies Corporation, and Chiara Fiorani and Judit Banhazi are employees of Novartis Pharma. The authors report no other conflicts of interest in this work.
References
1. Duncan JL, Pierce EA, Laster AM, et al. Foundation Fighting Blindness Scientific Advisory Board. Inherited retinal degenerations: current landscape and knowledge gaps. Trans Vis Sci Tech. 2018;7(4):1–15. doi:10.1167/tvst.7.4.6
2. Hafler BP. Clinical progress in inherited retinal degenerations: gene therapy clinical trials and advances in genetic sequencing. Retina. 2017;37(3):417–423. doi:10.1097/IAE.0000000000001341
3. Sergouniotis PI. Inherited Retinal Disorders: using Evidence as a Driver for Implementation. Ophthalmologica. 2019;242(4):187–194. doi:10.1159/000500574
4. National Center for Advancing Translational Sciences. Rare Diseases are not Rare!; 2019. Available from: https://ncats.nih.gov/director/feb-2019.
5. Canadian Agency for Drugs and Technologies in Health (CADTH). The impact of inherited retinal diseases on Canadian patients: patient input on Luxturna;
6. Canadian Agency for Drugs and Technologies in Health (CADTH). Voretigene Neparvove, 2021. Available from: https://cadth.ca/voretigene-neparvovec. 10, 2021.
7. Mayro EL, Murchison AP, Hark LA, et al. Prevalence of depressive symptoms and associated factors in an urban, ophthalmic population. Eur J Ophthalmol. 2020;1–8.
8. Zhang X, Bullard KM, Cotch MF, et al. Association between depression and functional vision loss in persons 20 years of age or older in the United States, NHANES 2005-2008. JAMA Ophthalmol. 2013;131(5):573–581. doi:10.1001/jamaophthalmol.2013.2597
9. DeCarlo D, McGwin G, Bixler ML, et al. Impact of Pediatric Vision Impairment on Daily Life: results of Focus Groups. Optom Vis Sci. 2013;89(9):1409–1416. doi:10.1097/OPX.0b013e318264f1dc
10. Deloitte Access Economics. The socioeconomic impact of inherited retinal dystrophies (IRDs) in the United States of America. 2020. Available from: https://www2.deloitte.com/au/en/pages/economics/articles/socioeconomic-impact-inherited-retinal-dystrophies-us-canada.html.
11. Deloitte Access Economics. The socioeconomic impact of inherited retinal dystrophies (IRDs) in Canada. 2020. Available from: https://www2.deloitte.com/au/en/pages/economics/articles/socioeconomic-impact-inherited-retinal-dystrophies-us-canada.html.
12. Ridic G, Gleason S, Ridic O. Comparisons of Health Care Systems in the United States, Germany and Canada. Mater Sociomed. 2012;24(2):112–120. doi:10.5455/msm.2012.24.112-120
13. Government of Canada. Canada’s Health Care System. 2019. Available from: https://www.canada.ca/en/health-canada/services/health-caresystem/reports-publications/health-care-system/canada.html.
14. Cruess AF, Gordon KD, Bellan L, et al. The cost of vision loss in Canada. 2. Results. Can J Ophthalmol. 2011;56(4):218–315. doi:10.1016/j.jcjo.2011.06.006
15. Canadian National Institute of the Blind. 2021. Available from: https://cnibsmartlife.ca/.
16. AHRQ. Agency for Healthcare Research and Quality Healthcare Cost and Utilization Project (HCUP); 2019. Available from: https://www.ahrq.gov/data/hcup/index.html.
17. Centers for Medicare & Medicaid Services (CMS). National Health Expenditure Data; 2019. Available from: https://www.cms.gov/Research-StatisticsData-and-Systems/Statistics-Trends-andReports/NationalHealthExpendData. 27, 2020.
18. Vision Loss in Canada. 2011. Available from: https://www.cos-sco.ca/wp-content/uploads/2012/09/VisionLossinCanada_e.pdf.
19. GBD. 2017 Disease and Injury Incidence and Prevalence Collaborators. Global, regional, and national incidence, prevalence, and years lived with disability for 354 diseases and injuries for 195 countries and territories, 1990-2017: a systematic analysis for the Global Burden of Disease Study 2017. Lancet. 2018;392(10159):1789–1858. doi:10.1016/S0140-6736(18)32279-7
20. Dahlby B, Ferede E The Marginal Cost of Raising Tax Revenue: implications for Tax Policy Options in Alberta. 2011. Available from: https://papers.ssrn.com/sol3/papers.cfm?abstract_id=1805108.
21. Blomquist S, Simula L Marginal deadweight loss when the income tax is nonlinear. CESifo Working Paper No. 3053. 2010;211:47–60.
22. Fullerton D, Ta CL. Public Finance in a Nutshell: a Cobb Douglas Teaching Tool for General Equilibrium Tax Incidence and Excess Burden (No. w23064). Natl Bureau Econ Res. 2017.
23. Saez E, Slemrod J, Giertz SH. The elasticity of taxable income with respect to marginal tax rates: a critical review. J Econ Lit. 2012;50(1):3–50. doi:10.1257/jel.50.1.3
24. Baicker K, Skinner J. Health care spending growth and the future of US tax rates. Natl Bur Econ Res Bull Aging Health. 2011;25(1):39–68.
25. Ontario Health. Assistive Devices Program. 2021. Available from: https://www.ontario.ca/page/assistive-devices-program.
26. Canadian Guide Dogs for the Blind; 2021. Available from: https://www.guidedogs.ca/.
27. Daiger SP, Sullivan LS, Bowne SJ. Genes and mutations causing retinitis pigmentosa. Clin Genet. 2013;84(2):132–141. doi:10.1111/cge.12203
28. National Institute of Neurological Disorders and Stroke. Focus on Parkinson’s Disease Research; 2021. Available from: https://www.ninds.nih.gov/Current-Research/Focus-Disorders/Parkinsons-Disease#:~:text=At%20the%20National%20Institutes%20of,in%20NIH%2Dsupported%20PD%20research.
29. National Institute of Health. Research Portfolio Online Reporting Tools. 2020. Estimates of Funding for Various Research, Condition, and Disease Categories (RCDC). Available from: https://report.nih.gov/funding/categorical-spending#/.
30. Canadian Arthritis Network. Canadian Arthritis Funding Landscape Review. Available from: https://www.arthrite.ca/AS/media/pdf/Researchers/Arthritis-Funding-Final-Final-Landscape-Review.pdf.
31. Statistics Canada. Arthritis; 2016. Available from: https://www150.statcan.gc.ca/n1/pub/82-229-x/2009001/status/art-eng.htm.
32. Petty RE, Southwood TR, Manners P, et al. International League of Associations for Rheumatology classification of juvenile idiopathic arthritis: second revision, Edmonton, 2001. J Rheumatol. 2004;31(2):390–392.
33. Ens A, Lang B, Ramsey S, et al. The financial burden of juvenile idiopathic arthritis: a Nova Scotia experience. Pediatr Rheumatol Online J. 2013;11(1):24. doi:10.1186/1546-0096-11-24
34. Davis K, Schoenbaum SC, Audet AMA. 2020 vision of patient-centered primary care. J Gen Intern Med. 2005;20(10):953–957. doi:10.1111/j.1525-1497.2005.0178.x
35. Gordon KD The Impact of the COVID-19 Pandemic on Canadians who are Blind, Deaf-Blind and Partially-Sighted; 2020. Available from: https://ccbnational.net/shaggy/2020/05/05/covid-19-survey-results/.
 © 2021 The Author(s). This work is published and licensed by Dove Medical Press Limited. The full terms of this license are available at https://www.dovepress.com/terms.php and incorporate the Creative Commons Attribution - Non Commercial (unported, v3.0) License.
By accessing the work you hereby accept the Terms. Non-commercial uses of the work are permitted without any further permission from Dove Medical Press Limited, provided the work is properly attributed. For permission for commercial use of this work, please see paragraphs 4.2 and 5 of our Terms.
© 2021 The Author(s). This work is published and licensed by Dove Medical Press Limited. The full terms of this license are available at https://www.dovepress.com/terms.php and incorporate the Creative Commons Attribution - Non Commercial (unported, v3.0) License.
By accessing the work you hereby accept the Terms. Non-commercial uses of the work are permitted without any further permission from Dove Medical Press Limited, provided the work is properly attributed. For permission for commercial use of this work, please see paragraphs 4.2 and 5 of our Terms.