")
Back to Journals » ClinicoEconomics and Outcomes Research » Volume 11
The impact of increased post-progression survival on the cost-effectiveness of interventions in oncology
Authors Retzler J , Davies H , Jenks M, Kiff C, Taylor M
Received 18 October 2018
Accepted for publication 8 March 2019
Published 3 May 2019 Volume 2019:11 Pages 309—324
DOI https://doi.org/10.2147/CEOR.S191382
Checked for plagiarism Yes
Review by Single anonymous peer review
Peer reviewer comments 2
Editor who approved publication: Professor Giorgio Colombo
Jenny Retzler,1,2 Heather Davies,2 Michelle Jenks,2 Christopher Kiff,3 Matthew Taylor2
1Department of Psychology, University of Huddersfield, Huddersfield, UK; 2York Health Economics Consortium, University of York, York, UK; 3Bristol-Myers Squibb Pharmaceuticals Ltd, Uxbridge, UK
Purpose: Cost-effectiveness analyses (CEA) of new technologies typically include “background” costs (eg, all “related” health care costs other than the specific technology under evaluation) as well as drug costs. In oncology, these are often expensive. The marginal cost-effectiveness ratio (ie, the extra costs and QALYs associated with each extra period of survival) calculates the ratio of background costs to QALYs during post-progression. With high background costs, the incremental cost-effectiveness ratio (ICER) can become less favorable as survival increases and the ICER moves closer to the marginal cost-effectiveness ratio, making cost-effectiveness prohibitive. This study assessed different methods to determine whether high ICERs are caused by high drug costs, high “background costs” or a combination of both and how different approaches can alter the impact of background costs on the ICER where the marginal cost-effectiveness ratio is close to, or above, the cost-effectiveness threshold.
Methods: The National Institute for Health and Care Excellence oncology technology appraisals published or updated between October 2012 and October 2017 were reviewed. A case study was selected, and the CEA was replicated. Three modeling approaches were tested on the case study model.
Results: Applying one-off “transition” costs during post-progression reduced the ongoing “incremental” costs of survival, which meant that the marginal cost-effectiveness ratio was substantially reduced and problems associated with additional survival were less likely to impact the ICER. Similarly, the use of two methods of additional utility weighting for end-of-life cases meant that the marginal cost-effectiveness ratio was reduced proportionally, again lessening the impact of increased survival.
Conclusion: High ICERs can be caused by factors other than the cost of the drug being assessed. The economic models should be correct and valid, reflecting the true nature of marginal survival. Further research is needed to assess how alternative approaches to the measurement and application of background costs and benefits may provide an accurate assessment of the incremental benefits of life-extending oncology drugs. If marginal survival costs are incorrectly calculated (ie, by summing total post-progressed costs and dividing by the number of baseline months in that state), then the costs of marginal survival are likely to be overstated in economic models.
Keywords: cancer, cost, economics, overall survival, quality of life, modeling
Introduction
Modeling in National Institute for Health and Care Excellence oncology technology appraisals
In England and Wales, oncology drugs are assessed for recommendation for use in the NHS by the National Institute for Health and Care Excellence (NICE) via the technology appraisal (TA) programme. TAs review the clinical and economic evidence associated with a new technology, with economic evaluation of cost-effectiveness being a key factor in the recommendation made by NICE. If the incremental cost-effectiveness ratio (ICER) is £20,000 or less per quality-adjusted life year (QALY) gained, a technology is usually judged to be cost-effective,1 although if the technology meets end of life criteria or if a highly specialized technology delivers long-term benefits, the threshold may be increased.2
Oncology technologies are commonly modeled using partitioned survival models with three health states.3 On entry into the model, patients enter the “pre-progressed” health state, typically reflecting the time in which patients are receiving the active treatment which may delay further disease progression. This period is known as “progression-free survival” (PFS). Patients may then proceed to the “post-progressed” health state (PPS). The definition of “progressed” varies from model to model, but usually represents a more severe health state. Patients remain in this state until death, the final health state. The number of patients in each health state at any one time is estimated from clinical trial data or by means of parametric equations derived from clinical trial data, with some form of extrapolation function. Costs and QALYs associated with being in each health state are applied to the cohort over a defined time horizon and aggregated to estimate the overall cohort costs and QALYs in each treatment arm.
NICE technology appraisal requirements
In line with the published NICE manual for the development of NICE guidelines, economic evaluations include not only treatment-related costs, but all costs relevant to the disease.4 This includes the “background” or “supportive care” health care costs, such as monitoring, concomitant medications, management of adverse events and follow-on treatments (both pharmaceutical and surgical), which may change as a result of an intervention, thus being relevant to the economic analysis.1,5 These costs are often drawn from HRGs and published unit costs. In oncology, these background costs can be considerable and may include expensive treatments such as radiotherapy and surgery.6,7 Background costs are typically applied in economic models at a constant rate each cycle.
Background costs of disease management are often particularly high in the post-progression stage of the disease, when service provision shifts from active treatment using outpatient services, to an increased requirement for acute inpatient support. For example, a US study found that in the 6 months before death, cancer-related acute inpatient care increased from $1,785 per patient at 6 months before death to $20,559 1 month before death.6 However, it is important to note that a marginal change in life expectancy may simply push back the “high” (pre-death) part of the cost and mean that the total cost changes by only a small amount. In addition, in the later stages of disease, health-related quality of life (HRQoL) may be relatively low. Of course, the costs and utility inputs are likely to vary for different types of cancer, with some tumor types having substantially higher costs and/or lower utility than others. Therefore, in some cases, with extended patient survival following the intervention, the higher health care costs may outweigh the benefits accrued through that survival gain and ultimately, this can decrease an intervention’s likelihood of being cost-effective.
The paradox of the marginal cost-effectiveness ratio
A NICE Decision Support Unit (DSU) paper8 describes four scenarios, supported by examples of TAs, in which clinically effective new technologies may not be considered cost-effective even if it were possible to acquire and administer them at zero price. Three of these scenarios describe situations in which costs relating to the disease of interest from additional life years gained outweigh the QALY benefits accrued in that period, generating a negative net benefit impact. The increased incremental cost may be accrued through one, or a combination, of the following: (i) survival gain for patients requiring continued resource use to treat ongoing health care needs; (ii) survival gain in the post-progressed health state where costs are high for palliative care and HRQoL is low; or (iii) survival gain in the pre-progressed health state, in which active treatment costs remain high. The fourth scenario describes a situation in which the survival gain increases the risk for an unrelated high-cost event that would not be experienced by patients in the comparator arm. Again, the associated costs outweigh the QALY gain from the increased survival. No TA was identified that demonstrated this scenario.
In oncology treatments that extend overall survival (OS), it is common for much of the survival gain to be accrued in the post-progressed health state. We report the cost-effectiveness ratio of marginal survival, which calculates the ratio of background costs during post-progression to background QALYs obtained during the same period. Assuming that the intervention is not used after disease progression, as OS increases, the overall ICER will be influenced to a greater extent by the background costs and QALYs associated with the post-progressed health state, and the ICER value will tend towards the marginal cost-effectiveness ratio. If the marginal cost-effectiveness ratio exceeds the NICE cost-effectiveness threshold, which may happen in cases where PPS background costs are high or PPS utility is low, it becomes very difficult or, in some cases impossible, for the technology to achieve an ICER below the threshold, and the problem becomes greater the longer that the intervention increases survival. Whilst this might be a legitimate cause of high ICERs, it is often conflated with discussions around drug costs (eg, patient access schemes).
Study objectives
The aim of this study was to explore which effects can drive the ICER in a three-state oncology model, with particular emphasis on assessing the relative impact of intervention costs, “background” related health care costs and the costs associated with marginal survival. Different scenarios were tested to determine whether or not different approaches to costing can help to address some of the problems outlined in the NICE Decision Support Unit document.
Methods
Review
All oncology technology appraisals published or updated by NICE between October 2012 and October 2017 were screened for inclusion in the review. Any that reported a conventional late-stage oncology partitioned survival model were included for data extraction. From each included TA, the details of the appraisal, the technology and the model included in the company submission were extracted.
Where possible, the marginal cost-effectiveness ratio was calculated for each TA by dividing the marginal monthly cost of post-progression survival by the monthly QALY gained by being in that state. Where multiple inputs were used in models (eg, different utility values for different comparators), an average of all relevant values was applied. Where transition costs or PPS background costs for different stages of PPS were used in models (eg, greater costs close to death), the monthly PPS costs (not one-off transition costs) for the first stage of PPS were applied only (ie, assuming that any marginal survival would be represented by the costs and utilities from the earlier stages of progression).
Ethics Approval
Review and/or approval by an institutional review board or ethics committee was not required for this research, since the analysis was desk-based and built on published research only.
Case study
Following data extraction, a case study was selected to explore whether alternative approaches may be useful in avoiding some of the problems outlined in the DSU report. To select a case study appraisal, the following criteria were used: (i) well-reported data available in the submission, (ii) a marginal cost-effectiveness ratio close to, or above, £20,000, (iii) a technology that was “not recommended” by NICE, (iv) a simple three-state partitioned survival model, and (v) a combination therapy (ie, associated with higher therapy costs).
Following selection of a case study, the model was replicated as closely as possible by matching inputs to those reported. A model schematic and the PFS/OS partitioned survival curves are shown in Figures 1 and 2. Please see Supplement B for full commentary on the model replication.
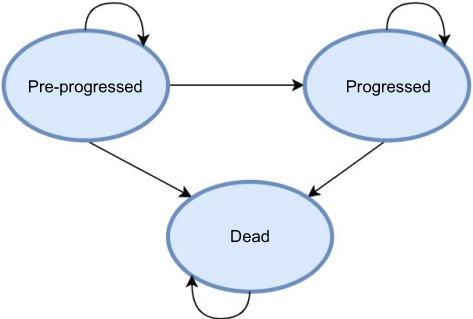 | Figure 1 Model schematic. |
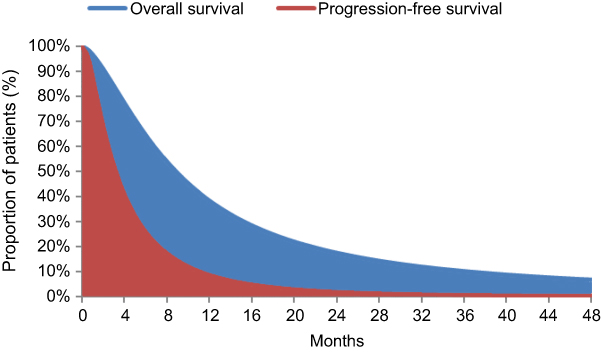 | Figure 2 Progression-free survival and overall survival curves. |
The case study model was then used to test a variety of scenarios. This paper presents 3 “test” scenarios that illustrate instances where conventional modeling approaches may miss important aspects of how the costs and benefits associated with marginal survival are implemented. It evaluates whether alternative approaches, that may better reflect the true distribution of costs and benefits, alleviate the problems associated with background costs. These test scenarios (described in detail below) were as follows:
Test scenario 1: separation of post-progression background costs into ongoing and one-off costs.
Test scenario 2: adopting end-of-life criteria using the arbitrary QALY weighting approach.
Test scenario 3: adopting end-of-life criteria using the “population norm” weighting approach.
The impact of these test scenarios on the ICER was assessed with reference to the case study model as the base case, as well as two different disease scenarios in which the proportion of time spent in pre- and post-progression was varied from the base case relative to OS, but absolute gains between the treatment and comparator arms were kept stable. These disease scenarios represent the impact that these modeling approaches might have on drugs with comparative treatment benefits, but differing disease trajectories. In Disease Scenario 1, OS was shorter than in the base case, with the survival gain equating to approximately 50% of treatment OS, while Disease Scenario 2 had longer OS compared with the base case, with survival gain equating to approximately 15% of treatment OS.
Test scenario 1: separation of post-progression background costs
In oncology models, background costs are typically applied on a monthly (or cyclical) basis, using a constant rate for each period. This does not necessarily reflect the true distribution of service use, whereby some costs are likely to be incurred as one-offs. The impact of adjusting the way these are applied was investigated by splitting the total PPS background costs into a combination of one-off costs and smaller monthly costs as follows (we should be clear that these would not be optional approaches; each model should be designed to best represent the true nature of the costs associated with marginal survival):
Timing of costs 1: all PPS costs applied at a constant monthly rate.
Timing of costs 2: 80% of the total PPS cost applied as a one-off cost on transition from pre-progression to progression, with the remaining costs spread at a constant monthly rate.
Timing of costs 3: 80% of the total PPS cost applied as a one-off cost on transition from PPS to death, with the remaining costs spread at a constant monthly rate.
Timing of costs 4: 40% of the total PPS cost applied as a one-off cost on transition from pre-progression to progression, 40% of the total PPS cost applied as a one-off cost on transition from PPS to death, with the remaining costs spread at a constant monthly rate.
Test scenario 2: adopting “end-of-life” criteria – arbitrary QALY weighting
To reflect the added value of interventions that extend survival in conditions with a shorter life expectancy, NICE allows some modification of the utility gain for those patients. This can be approached in different ways. The first method is to weight all QALYs throughout the model so that the survival benefit has a greater impact on the ICER. There is little guidance about the extent to which the QALYs can be weighted; however, the maximum QALY weighting that may be considered “reasonable” under certain circumstances, according to NICE DSU guidance, is 2.5.9
Test scenario 3: adopting “end-of-life” criteria – population norm QALY weighting
The second approach to weighting the QALY is to apply population norm utilities to the QALY gains achieved during the period of extended survival (as outlined in the NICE Methods Guide). Within test scenario 3, this was calculated by multiplying the difference between the utility applied during post-progression and the population norm utility, by the mean survival gain in years, to generate additional QALYs for the treatment arm. These were discounted at 3.5% before this additional QALY gain was added to the total treatment QALYs.
Analysis
The above test scenarios were compared in order to determine whether or not each approach would be likely to avoid the problems outlined in the NICE DSU paper. Specifically, for each test scenario, we estimated the marginal cost-effectiveness ratio to determine the likely effect of each additional month of survival (ie, testing whether an additional month of survival, at no extra drug cost, would reduce or increase the ICER).
Results
Review
Following screening of 40 technology appraisals, 29 were included for data extraction (Table 1; see Supplement A for details of exclusions).
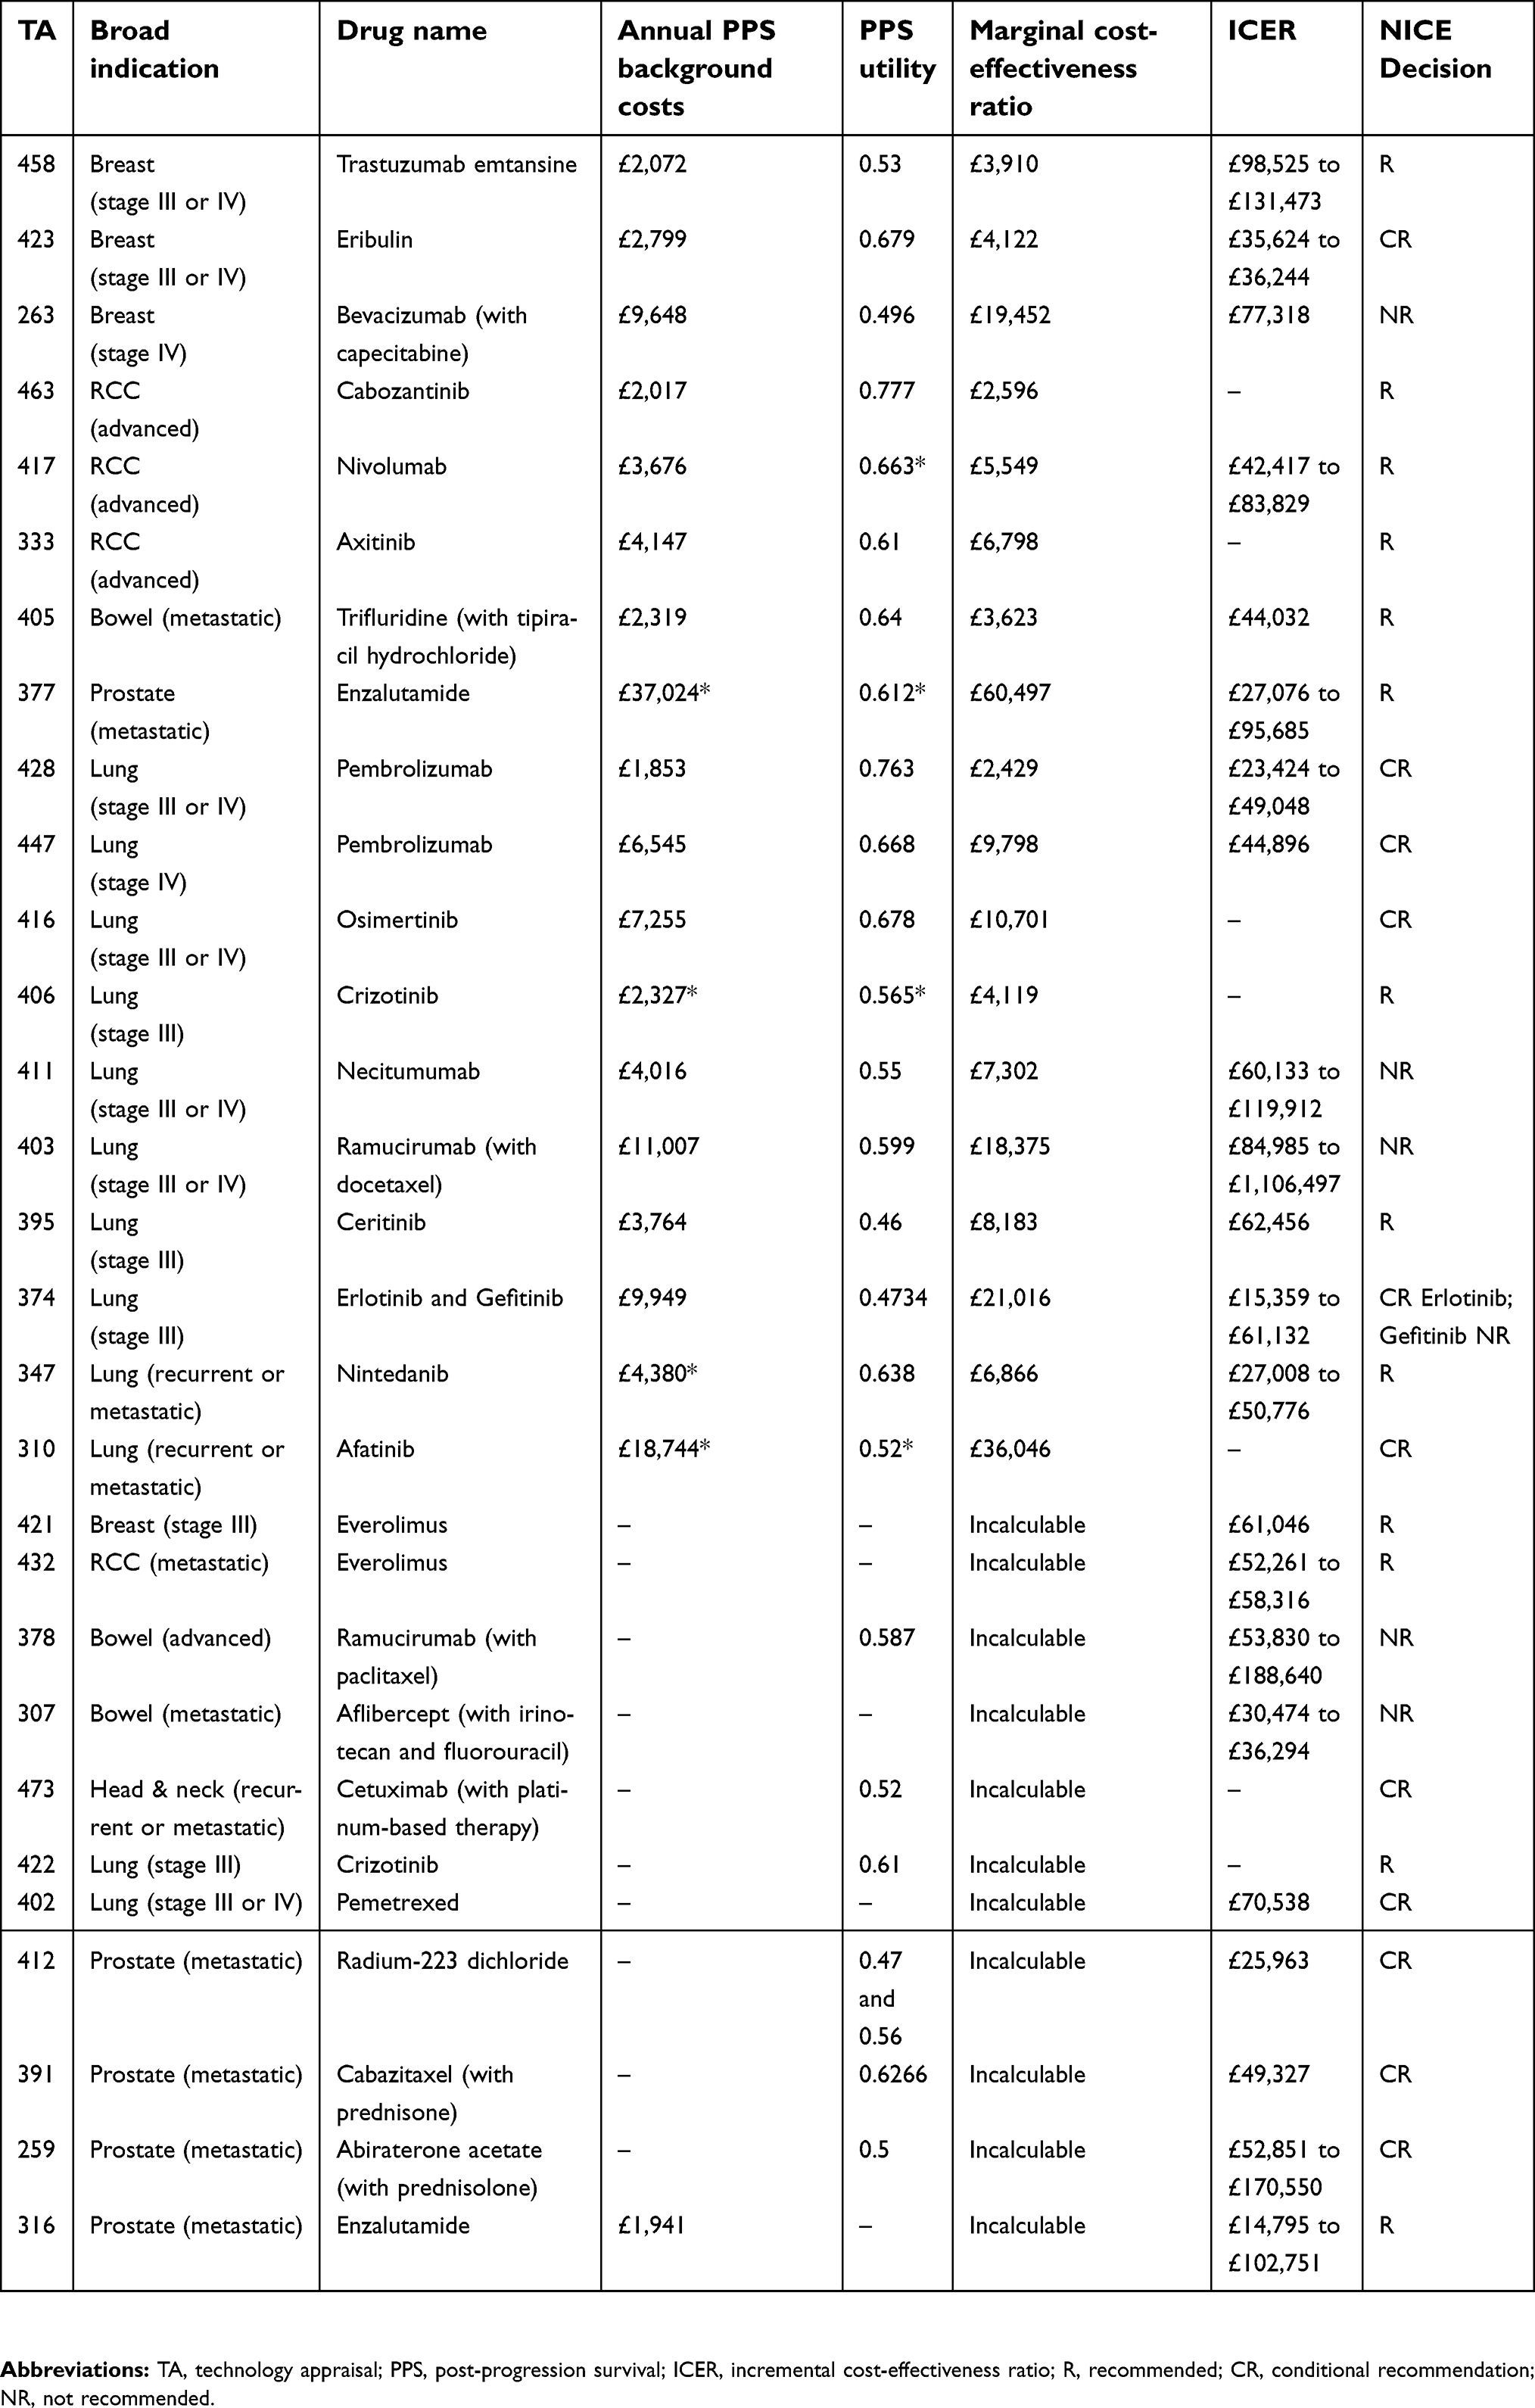 | Table 1 Details of TAs and marginal cost-effectiveness ratios |
Case study
TA403 was selected as a case study as the model that best fit our selection criteria (see Methods). The model could not be replicated exactly due to insufficient detail included in the submission for precise replication of the survival curves. Model results reported in the company submission and those estimated by our replication are reported in full in Supplement B. While total and incremental costs were closely replicated, total and incremental QALYs were higher in our replication, particularly in the pre-progressed state, reducing the overall ICER. In recognition of this, we explored the impact of artificially deflating the utilities to produce a closer model match. The pattern of results following the subsequent application of modeling approaches was the same; thus, this paper reports only the results for the replication in which the original model inputs reported by the company submission were used. In addition, the ERG noted that an error in the company submission resulted in the application of an effective discount rate of 10.9%. In our analyses, the discount rate was corrected to 3.5% in line with the NICE reference case.5 Table 2 shows the results of the model replication used in the current study as a base case and to which different modeling approaches were applied.
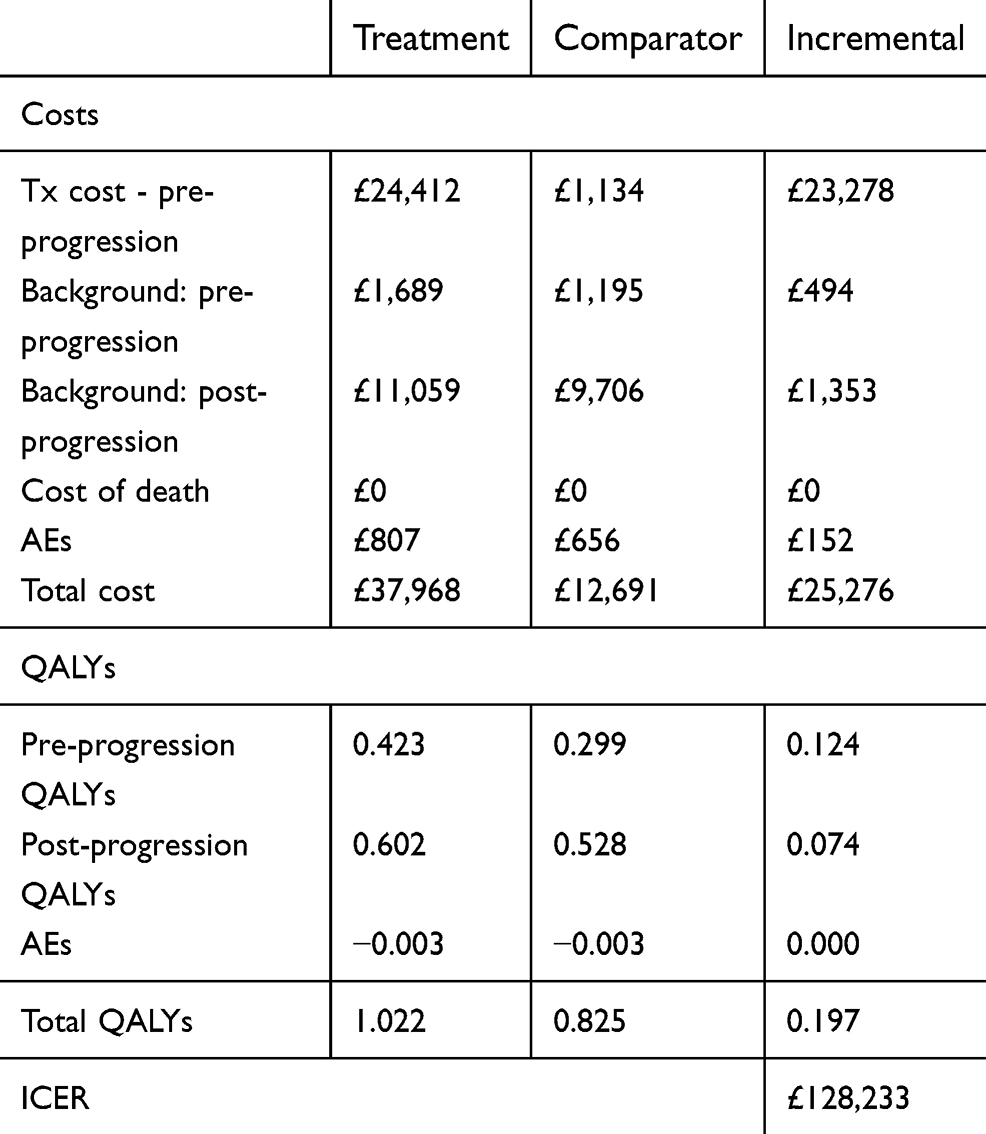 | Table 2 Replicated TA403 model results with corrected discount rate |
The marginal cost-effectiveness ratio for this model was £12,721 (with the corrected discount rate). All else being equal, in order for the case study treatment to come below the NICE cost-effectiveness threshold of £20,000 per QALY, a drug cost discount of over 90% would be required. It should be noted that, even in a biologically implausible scenario where OS remained at 100% in the treatment arm for the whole duration of the model (ie, reflecting no deaths across the 15-year time horizon), the ICER remained above the £20,000 threshold, at £21,833 per QALY, due to a combination of the drug cost and the high “background” cost of living with the disease.
Test scenario 1: separation of post-progression background costs
In the base case (case study) model, total PPS background costs were £11,059 in the treatment arm and £9,706 in the comparator arm. On average, patients in the treatment arm spent approximately 14 months in post-progression, while those in the comparator arm spent 12 months in post-progression.
In Disease Scenario 1 (where OS was shorter than the base case), total PPS background costs were £3,017 in the treatment arm and £1,826 in the comparator arm. On average, patients in the treatment arm spent approximately 4 months in post-progression, while those in the comparator arm spent around 2 months in post-progression.
In Disease Scenario 2 (where OS was longer than in the base case), total PPS background costs were £10,015 in the treatment arm and £8,781 in the comparator arm. On average, patients in the treatment arm spent approximately 13 months in post-progression, while those in the comparator arm spent around 11 months in post-progression.
Accordingly, where substantial one-off costs were applied (as opposed to spreading the costs evenly across all months), monthly background costs were £162, £160 and £157 in the base case, disease scenario 1 and disease scenario 2, respectively.
Regardless of the timing of the one-off cost, separation of the PPS costs resulted in a 3% to 4% reduction in the ICER across all disease scenarios (Table 3). The marginal cost-effectiveness ratio was reduced by almost 75%, from £12,721 to around £3,200 across all disease scenarios.
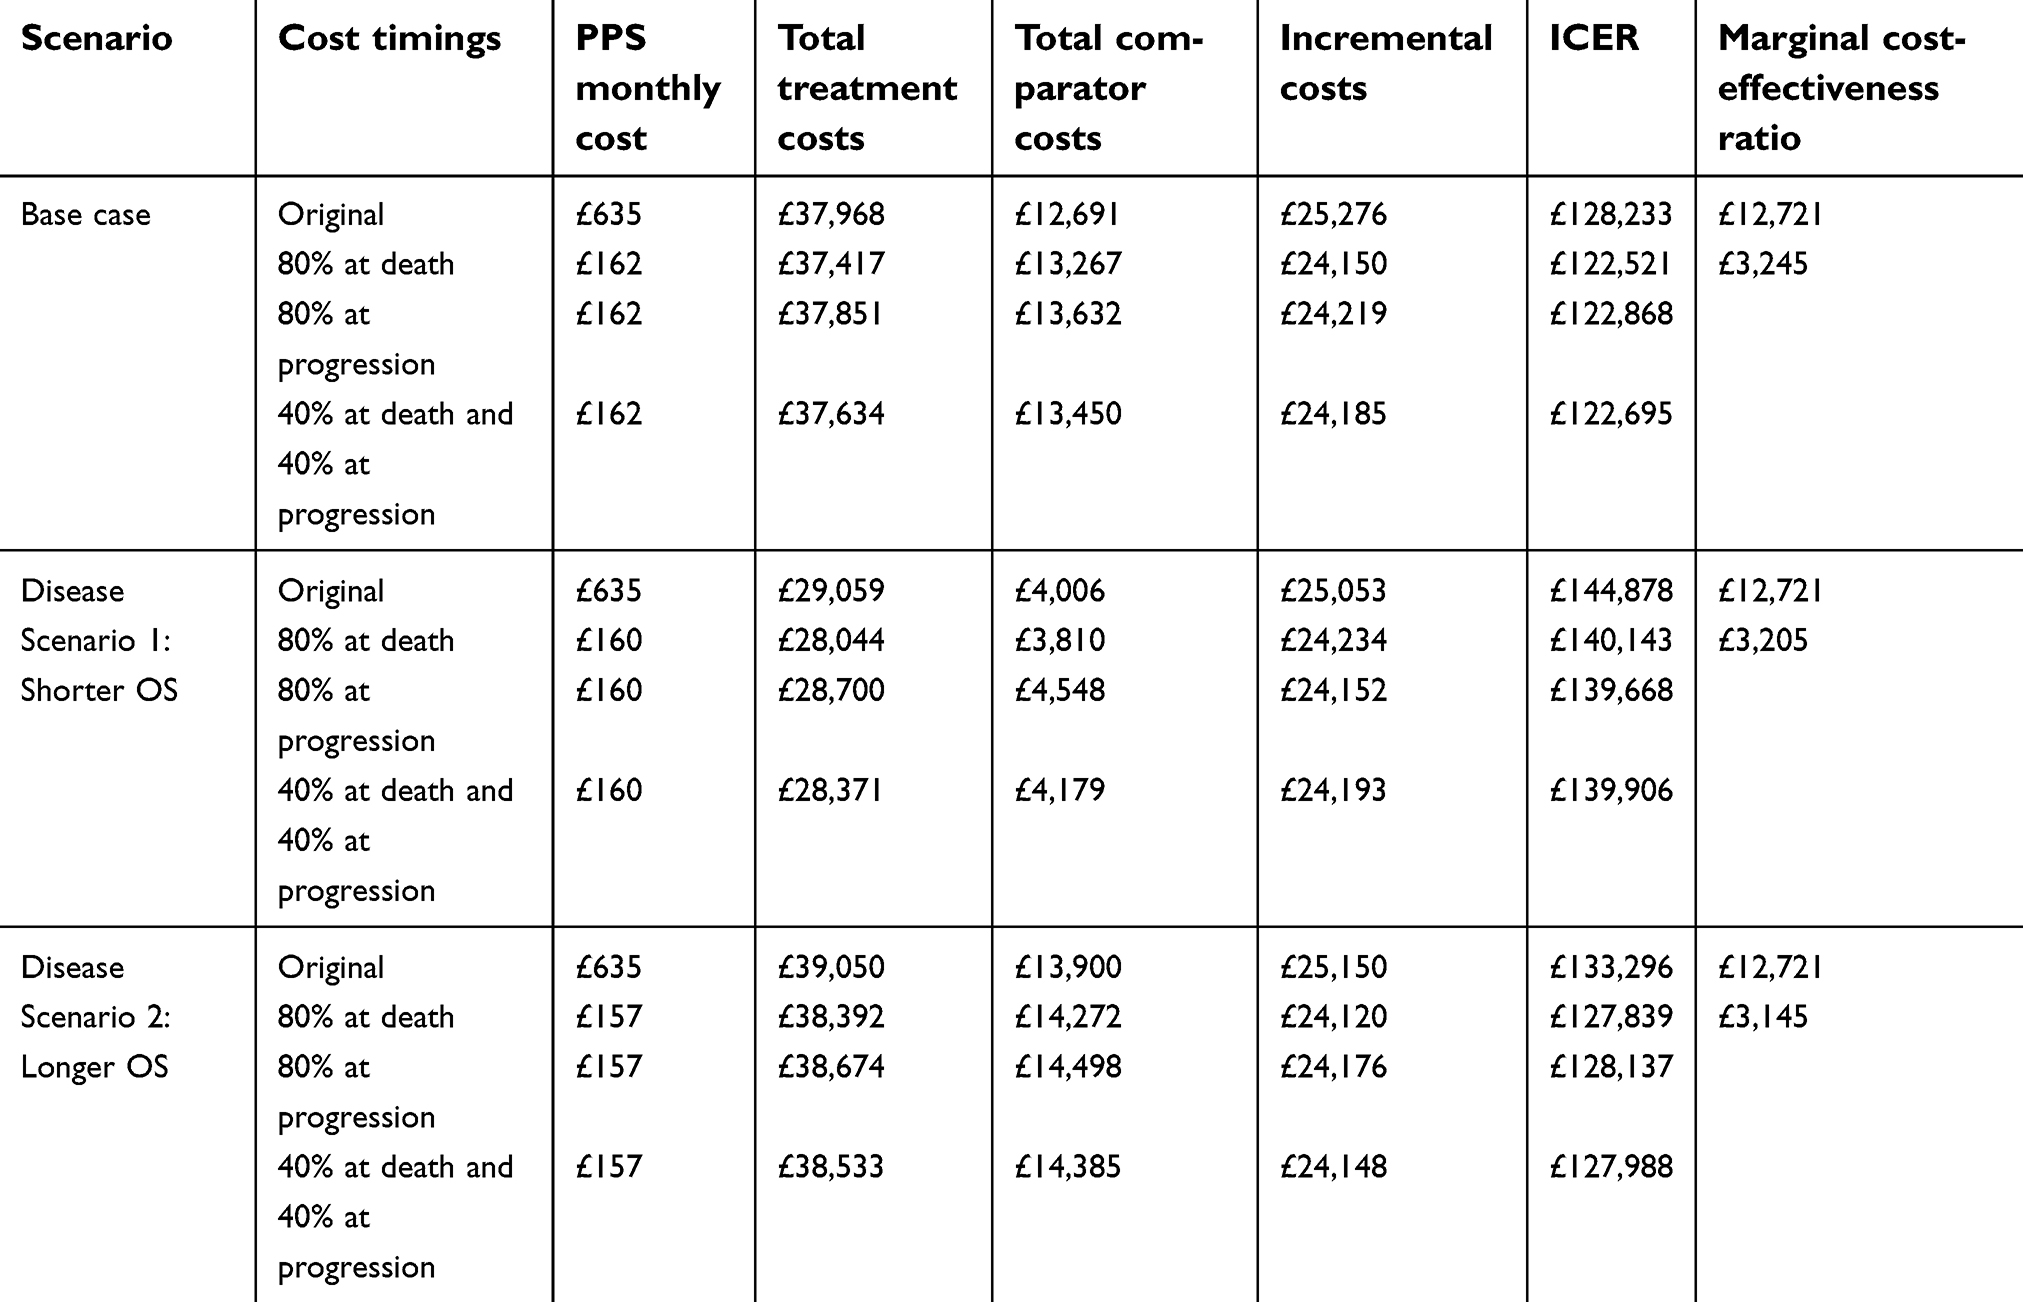 | Table 3 Results of Scenario 1 (separation of post-progression background costs) |
All else being equal (ie, assuming the base case survival inputs), in order for the case study treatment to fall below the NICE cost-effectiveness threshold of £20,000 per QALY, a drug cost discount of around 90% would still be required despite these changes. However, in contrast to applying the PPS background costs evenly across all months, should OS remain at 100% in the treatment arm (ie, reflecting no deaths across the 15-year time horizon), the ICER would be below the threshold, at between £7,000 and £8,000 per QALY (depending on scenario). In fact, by manipulating the hazard ratio between the treatment and comparator OS curves, an HR of 0.4 applied to all disease scenarios would bring the ICER below £20,000. Again, whilst such an HR may be biologically implausible, it is now mathematically possible to achieve a sub-threshold ICER, which was not possible in the base case.
Test scenario 2: adopting “end-of-life” criteria – arbitrary QALY weighting
The maximum QALY weighting recommended according to NICE guidance is 2.5. Even with this weighting, a drug price discount of 70% would be required to produce an ICER below £20,000. In cases where the ICER is closer to the threshold, this adjustment may have a greater bearing on the NICE appraisal outcome.
Although applying QALY weightings had a greater impact on the ICERs than scenario 1, the marginal cost-effectiveness ratio was reduced to a lower degree (Table 4), with a maximum reduction of 60% applying extensive weightings of 2.5. For the biologically implausible scenario where OS remained at 100% in the treatment arm for the whole duration of the model (ie, reflecting no deaths across the 15-year time horizon), the ICER was below £20,000 with even minimal QALY weightings of 1.1.
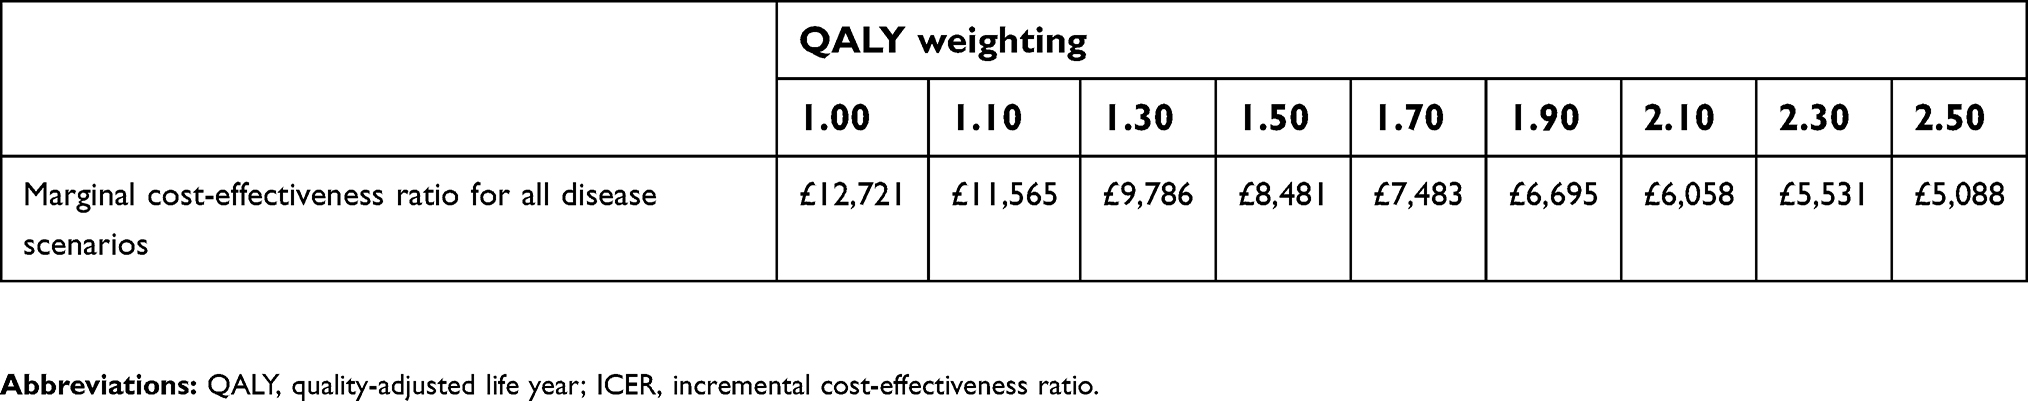 | Table 4 Results of Scenario 2 (adopting end-of-life criteria using arbitrary QALY weightings) |
Test scenario 3: adopting “end-of-life” criteria – population norm QALY weighting
Regardless of the disease scenario, this modeling approach resulted in an ICER reduction of 25–26% (Table 5). This is to be expected since the QALY gains have simply been inflated in a proportional manner. It is important to note, however, that the marginal cost-effectiveness ratio reduced in all scenarios. Specifically, the marginal cost-effectiveness ratio dropped from £12,721 in the base case to £9,525 whenever the population norm utility was applied. In the 100% survival in the treatment arm scenario, this adjustment would bring the base case model ICER below the £20,000 threshold, to £17,328 per QALY, with a hazard ratio of 0.25 required to remain subthreshold.
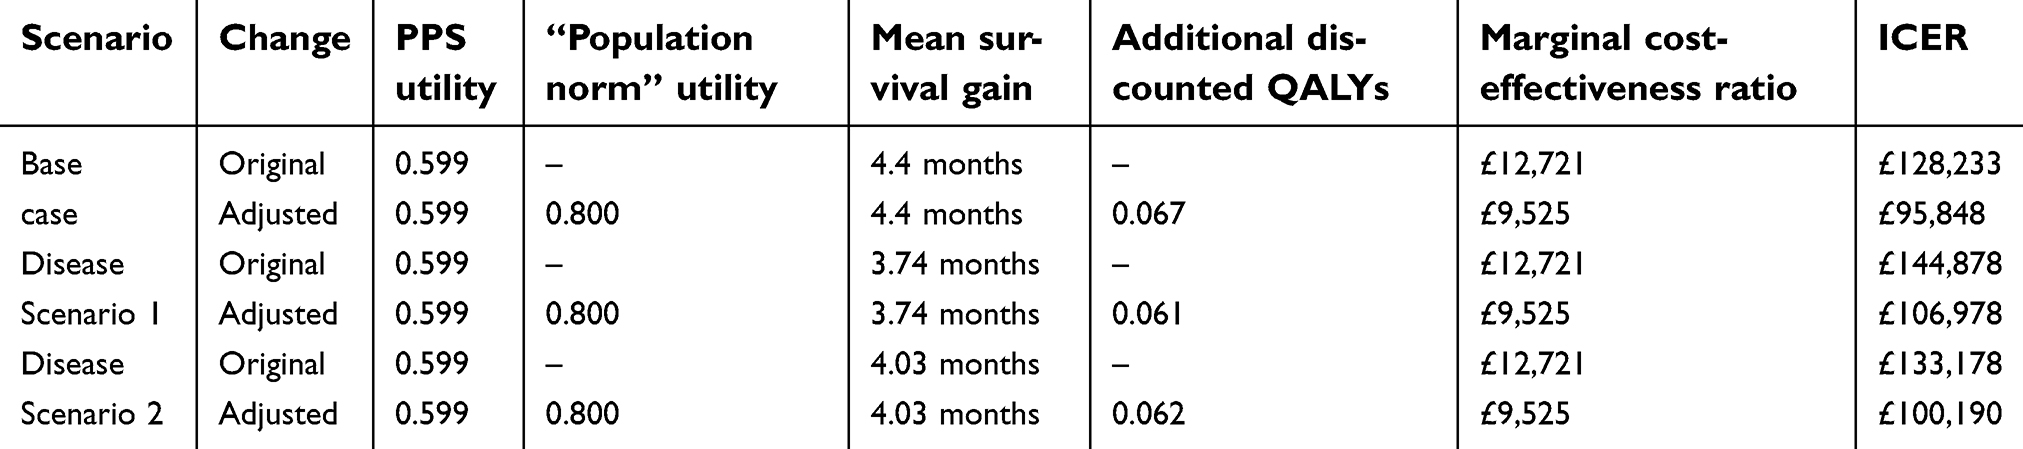 | Table 5 Results of Scenario 3 (adopting end-of-life criteria using population norm QALY weightings) |
Combining modeling approaches
In addition to the scenarios above being tested individually, combinations of test scenarios were also tested. This involved only the changes that made the biggest impact on the ICER and marginal cost-effectiveness ratio (ie, the impact of applying an 80% one-off cost on transition to death in combination with QALY weightings).
The impact on the ICER of combining the two approaches was slightly greater than with adopting the QALY weighting approach alone (Table 6). However, the impact on the marginal cost-effectiveness ratio was the largest observed, with an 88% reduction even with minimal QALY weightings. As with the QALY weighting approach alone, 100% survival in the treatment arm would bring the ICER under £20,000 for all weightings.
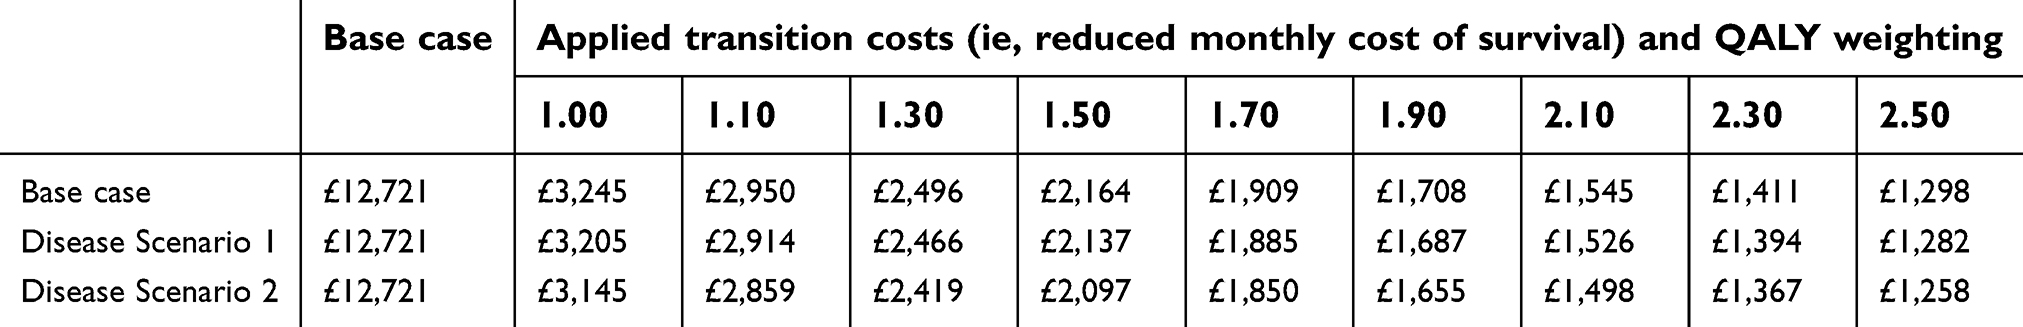 | Table 6 Marginal cost-effectiveness ratios by QALY weighting with applied transition costs |
Discussion
Findings and implications
This study used a case study technology appraisal to explore the impact of a number of different modeling scenarios upon the incremental costs and QALYs associated with increased survival in oncology. Although our case study used a partitioned survival model approach, the issues raised in this paper would apply to any modeling approach where increased survival is likely to accrue substantial additional costs. The analysis suggested that (in the example used) some of the problems highlighted by a previous NICE DSU report could be avoided, or at least reduced, by appropriately measuring the true costs and benefits of incremental survival. Specifically, the test scenarios showed that, when “post-progression” costs are broken down into one-off “transition” and variable incremental components, then increased survival tended to be more favorable in terms of cost-effectiveness. We should be very clear that the application of background costs as one-off events or cyclical events should not be considered a “choice” by the modeler. The modeling of background costs should be undertaken to best represent real-world practice. However, the findings in this paper demonstrate the different approaches can yield different results, and so it is important to undertake the correct approach. Likewise, when the QALYs associated with additional survival were given increased weighting, there was less evidence of the problems outlined in the NICE DSU report.
Therefore, many interesting questions are raised regarding the valuation and quantification of quality of life and costs in the stages around the end of a patient’s life. NICE recommends additional weighting for QALYs that are gained in cases where death is imminent, but there is inconclusive evidence to demonstrate society’s true preferences for such weightings. A recent survey of the UK general population found a preference for QALYs gained at the end of life; however, this study concluded that its findings were not consistent with three other recent studies and that further research is required.10 Similarly, whilst aggregated costs are often presented for periods spanning several months, there is little research linking the costs with the prognosis of the patient, such that accurate costing predictions could be made based on changes in prognosis.
Given marginal costs associated with survival are not at the control of the companies developing new technologies, one could argue that the current approach (including all such related costs) is unfair in situations where they prevent the technology from being considered cost-effective even at zero price. For some submissions, companies may wish to explore the plausibility of options for presenting scenario analyses in which the background related costs associated with the marginal increases in post-progression survival are excluded, in order to better illustrate this issue.
Limitations
Many of the models reported in the TAs reviewed were complex or poorly reported, limiting our ability to calculate the marginal cost-effectiveness ratio in many cases. The scenarios tested in this study were applied to a case study, and as such may be case study specific; other models may find that the same changes have a different impact on the ICER. In particular, this paper focusses on end-stage cancer, and the conclusions would certainly not apply to resectable cancers or those with very low costs of marginal survival. In addition, it was not possible to replicate the case study model exactly. It was deemed, however, that use of the case study model with alternative disease scenarios provided a useful illustrative example of the impact of different scenarios.
A final limitation of the study was that the first scenario tested, in which the total background costs associated with the progressed health state were split into one-off and ongoing costs, was not evidence-based. The proportion of the total background costs applied as a one-off cost in this study was arbitrary, and in our recommendations below, we describe the need for further research to ensure that the costs and benefits associated with late-stage disease are accurately reflected in the model.
Recommendations for future research and decision-making
In order to better model the costs and benefits associated with progressed disease in a way that is representative of real health care pathways, more research is required. One aspect of this would be to investigate the plausibility of the traditional approach of applying all background costs in a cyclical fashion, the impact of which was explored using arbitrary splits in Scenario 1. It may be that in some oncology indications a greater amount of resources are used soon after progression, while in others, the bulk of the cost may be accumulated closer to death. In such cases, it may be more appropriate to include some background costs, such as pain relief, as ongoing cyclical costs, and others, such as CT scans, as “one-offs”. Applying these costs in a way that reflects their true timing may then mean that the impact of the one-off costs affects the treatment and comparator arms equally, with the cost implications of treatment-related survival gain including only those costs that can be truly described as “ongoing”.
There are also considerations on the other side of the ICER equation (ie, the measurement of HRQoL). Often, single separate utility values are applied to the entire period of pre- and post-progression. Disutilities may also be included to measure the impact of adverse events associated with the treatment or comparator. However, in practice, HRQoL is unlikely to remain static throughout the pre- or post-progressed health state, and the timing of utility measurement for each may impact the model. If collected soon after progression, the post-progressed utility value may overestimate true utility if the patients’ condition has not deteriorated fully or underestimate it in situations where HRQoL is still negatively affected by ongoing treatment toxicity or anxiety and depression following the prognosis. Similar problems may affect the measurement of the true treatment benefits associated with pre-progression, particularly in models where adverse event disutilities are applied. If utility is measured in a trial population, the impact of adverse events may already be captured in the utility value, thus resulting in double-counting HRQoL decrements and ultimately undervaluing the benefits of maintaining progression-free survival. Some models submitted to TAs have recognized the issue of changing utility by applying different utilities within a particular health state; they have been applied on a “time-from-death” basis (TA42811) or with different utilities applied to different stages of supportive treatment (TA40612). This is far from common practice, and it would be interesting to know the impact of such approaches on the marginal cost-effectiveness ratio and the ICER. This is, of course, an issue of model validity. Rather than be seen as a “choice” of how to model costs and utilities, modeler designers should use an appropriate method to best represent the real impact of marginal survival.
Conclusion
This study demonstrates that high ICERs can be caused by factors other than the cost of the drug being assessed. Furthermore, some of the issues outlined in the NICE DSU paper can be avoided, or at least reduced, by appropriately measuring the costs and benefits associated with the late stages of a person’s life, better reflecting the true impact of marginal survival. However, in some cases, the cost-effectiveness of treatments may still be prohibited because of excessive “background” costs associated with increased survival. Further research is needed to assess how alternative approaches to the measurement and application of background costs and benefits may provide an accurate assessment of the incremental benefits of life-extending oncology drugs.
Acknowledgment
This project was commissioned and funded by Bristol-Myers Squibb, and conducted by York Health Economics Consortium.
Author contributions
All authors contributed to data analysis, drafting and revising the article, gave final approval of the version to be published, and agree to be accountable for all aspects of the work.
Disclosure
Dr Jenny Retzler, Ms Heather Davies, Ms Michelle Jenks and Dr Matthew Taylor are employed by York Health Economics Consortium and received grants from Bristol Myers-Squibb, during the conduct of the study; Mr Christopher Kiff is an employee of Bristol-Myers Squibb Pharmaceuticals Ltd and received personal fees from his employer during the course of this study. The authors report no other conflicts of interest in this work.
References
1.
2.
3. Woods B, Sideris E, Palmer S, Latimer N, Soares M. NICE DSU Technical Support Document 19: Partitioned Suvival Analysis for Decision Modelling in Health Care: A Critical Review. Sheffield, UK: NICE Decision Support Unit Methods Development; 2017.
4. Drummond MF, Sculpher MJ, Claxton K, Stoddart GL, Torrance GW. Methods for the Economic Evaluation of Health Care Programmes. Oxford: Oxford University Press; 2005.
5.
6. Chastek B, Harley C, Kallich J, Newcomer L, Paoli CJ, Teitelbaum AH. Health care costs for patients with cancer at the end of life. J Oncol Pract. 2012;8(6S):75s–80s. doi:10.1200/JOP.2011.000469
7. Nonzee NJ, Dandade NA, Patel U, et al. Evaluating the supportive care costs of severe radiochemotherapy-induced mucositis and pharyngitis: results from a Northwestern University Costs of Cancer Program pilot study with head and neck and nonsmall cell lung cancer patients who received care at a county hospital, a Veterans Administration hospital, or a comprehensive cancer care center. Cancer. 2008;113(6):1446–1452. doi:10.1002/cncr.23714
8. Davis S. Assessing Technologies that are Not Cost-Effective at a Zero Price. Sheffield, UK: NICE Decision Support Unit Methods Development; 2014.
9.
10. Rowen D, Brazier J, Muluria C, et al. Eliciting societal preferences for weighting QALYs for burden of illness and end of life. Med Decis Making. 2016;36(2):210–222. doi:10.1177/0272989X15619389
11.
12.
Supplementary materials
Supplement A: Review exclusions
Table S1 reports each of the 11 TAs that were screened and subsequently excluded from data extraction, along with the reason for exclusion for each.
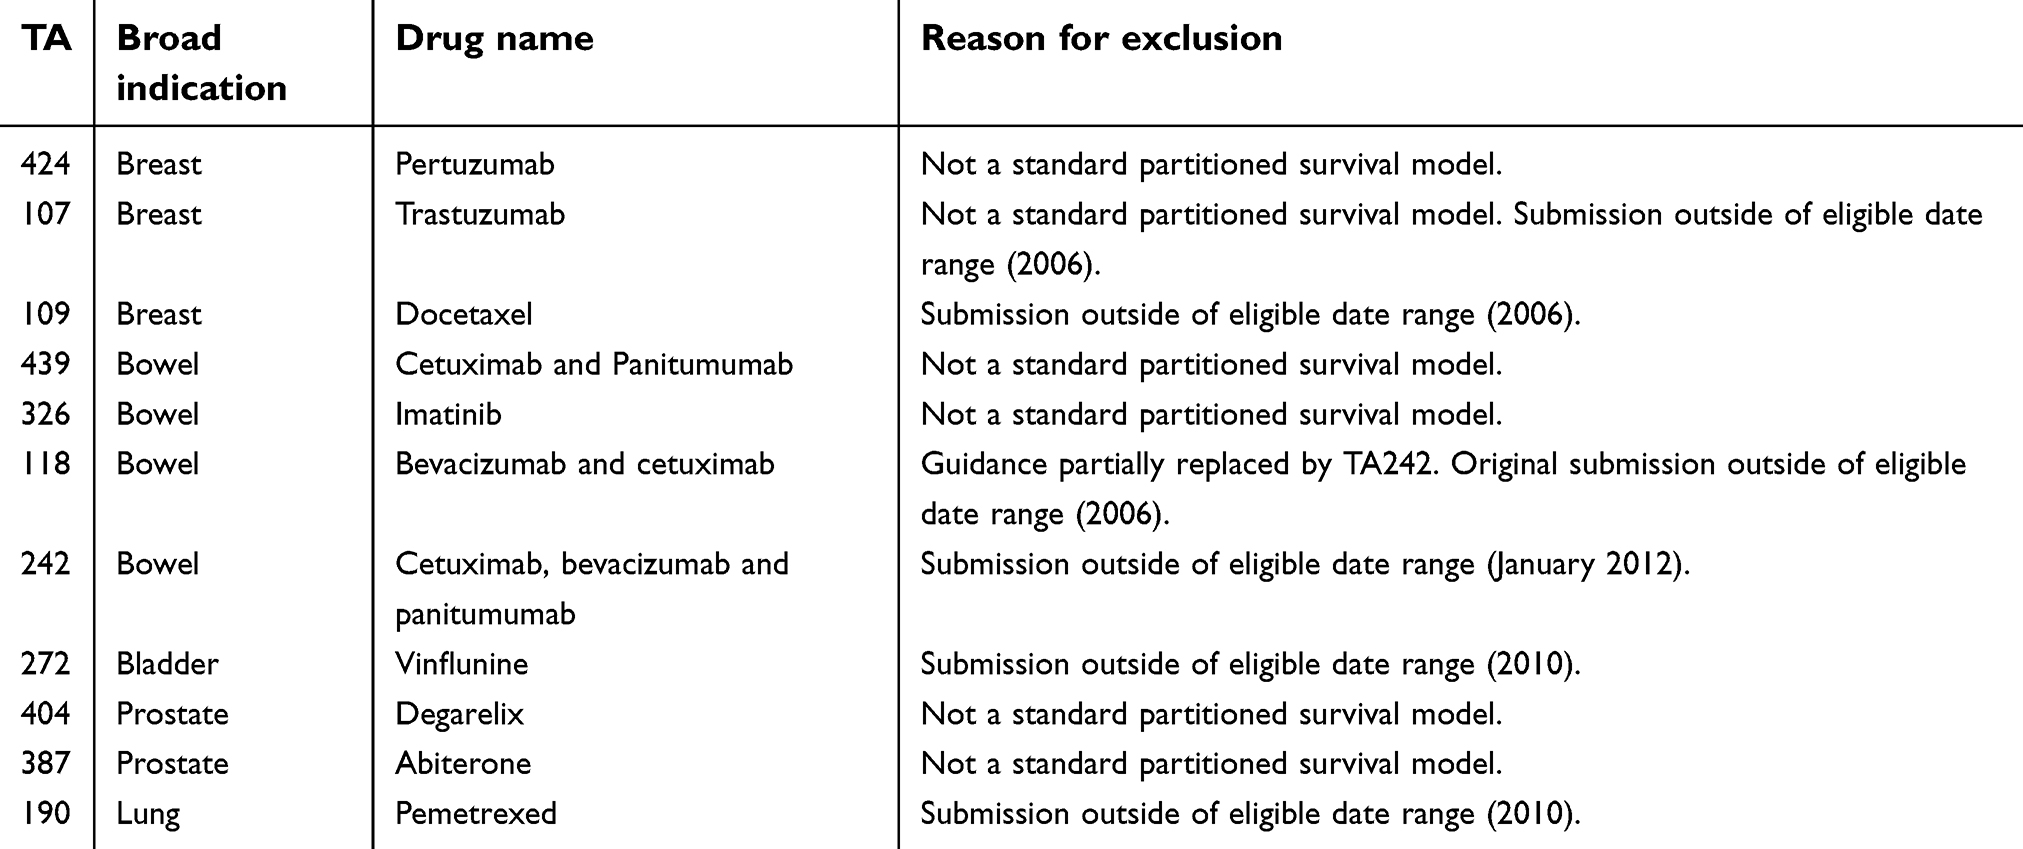 | Table S1 Table of exclusions with reasons from the TA review |
Supplement B: TA403 model replication commentary and results
In order to replicate the model base case model reported in TA403, we matched our model inputs to those reported within the company’s submission as far as possible. Please see Table S2 below for details.
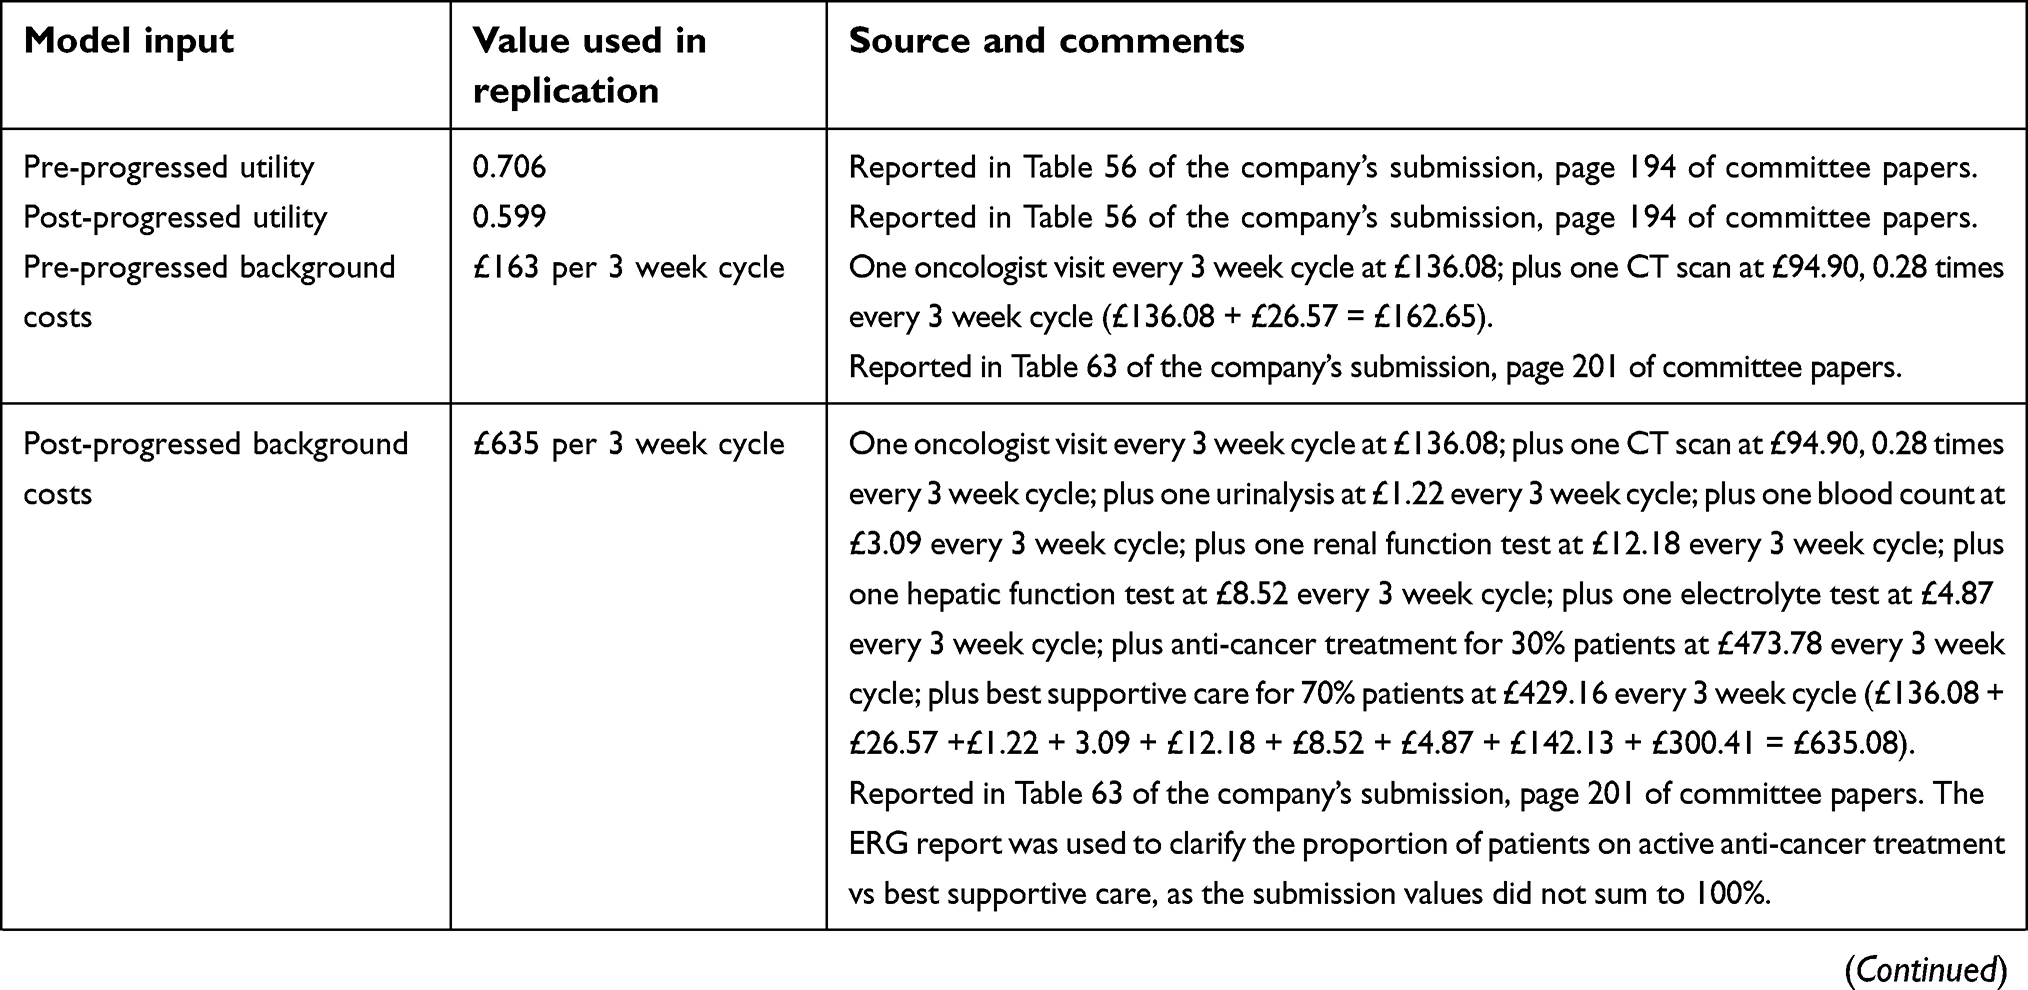 | 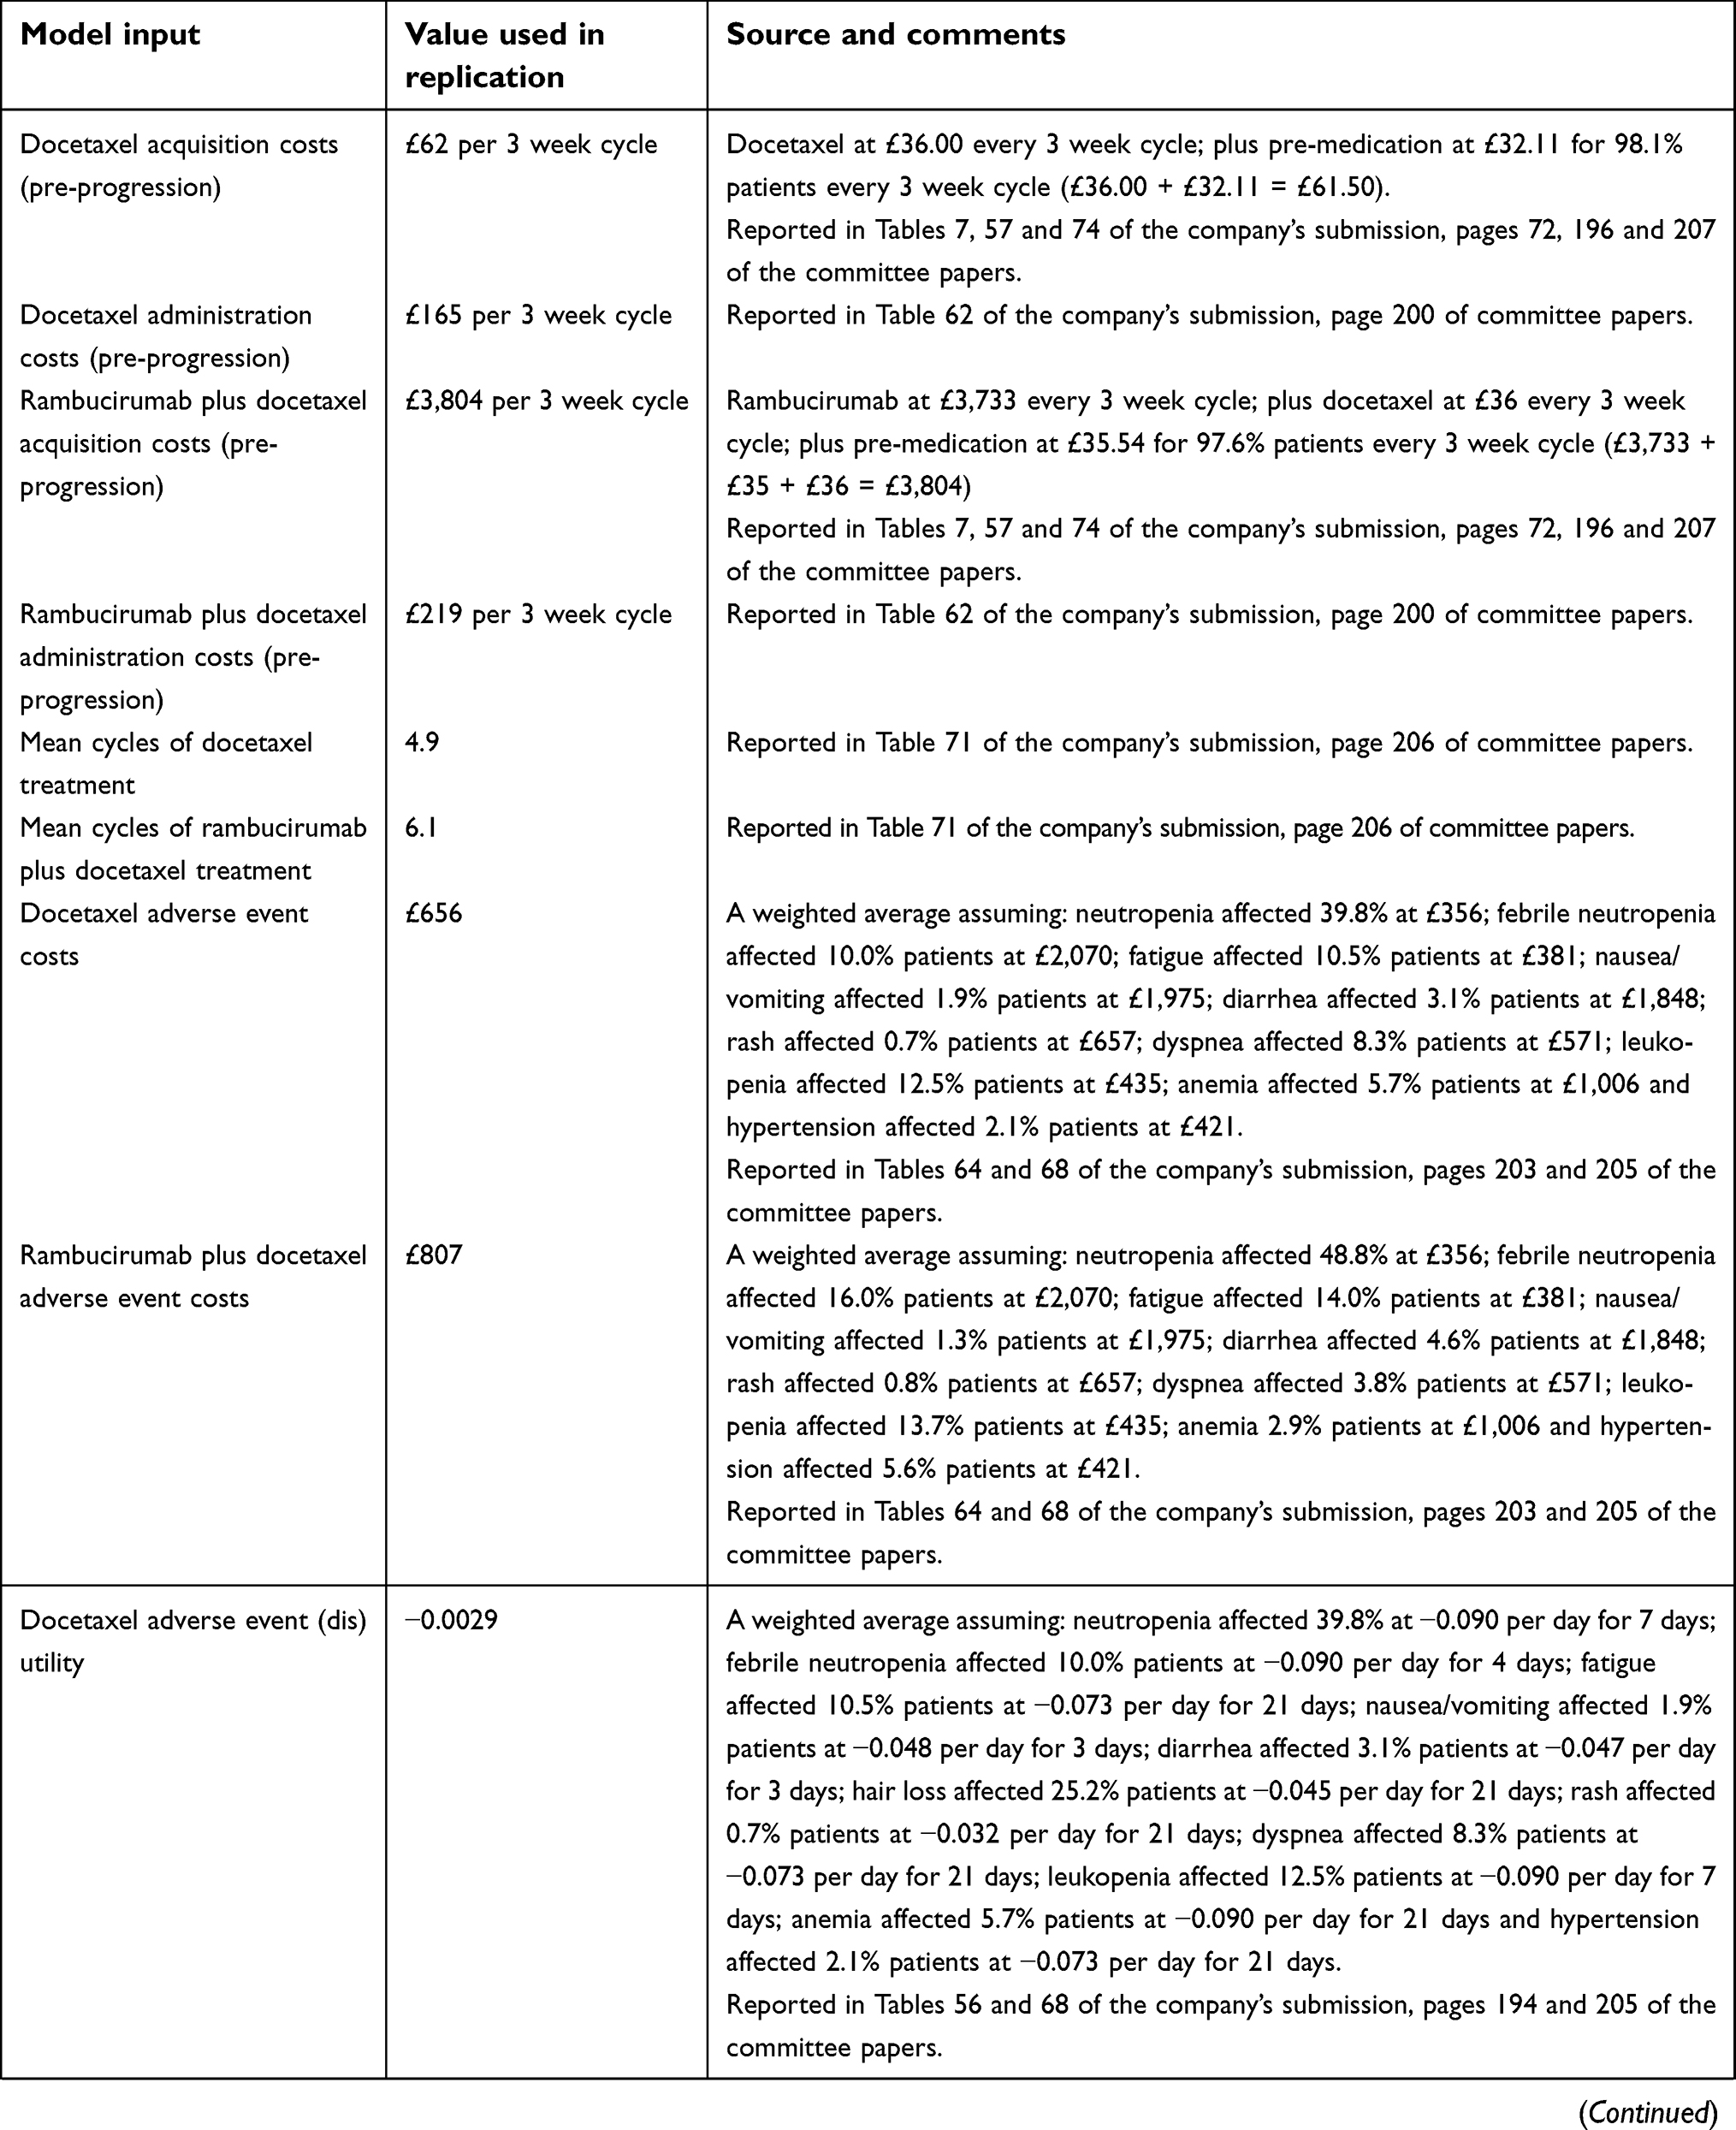 | 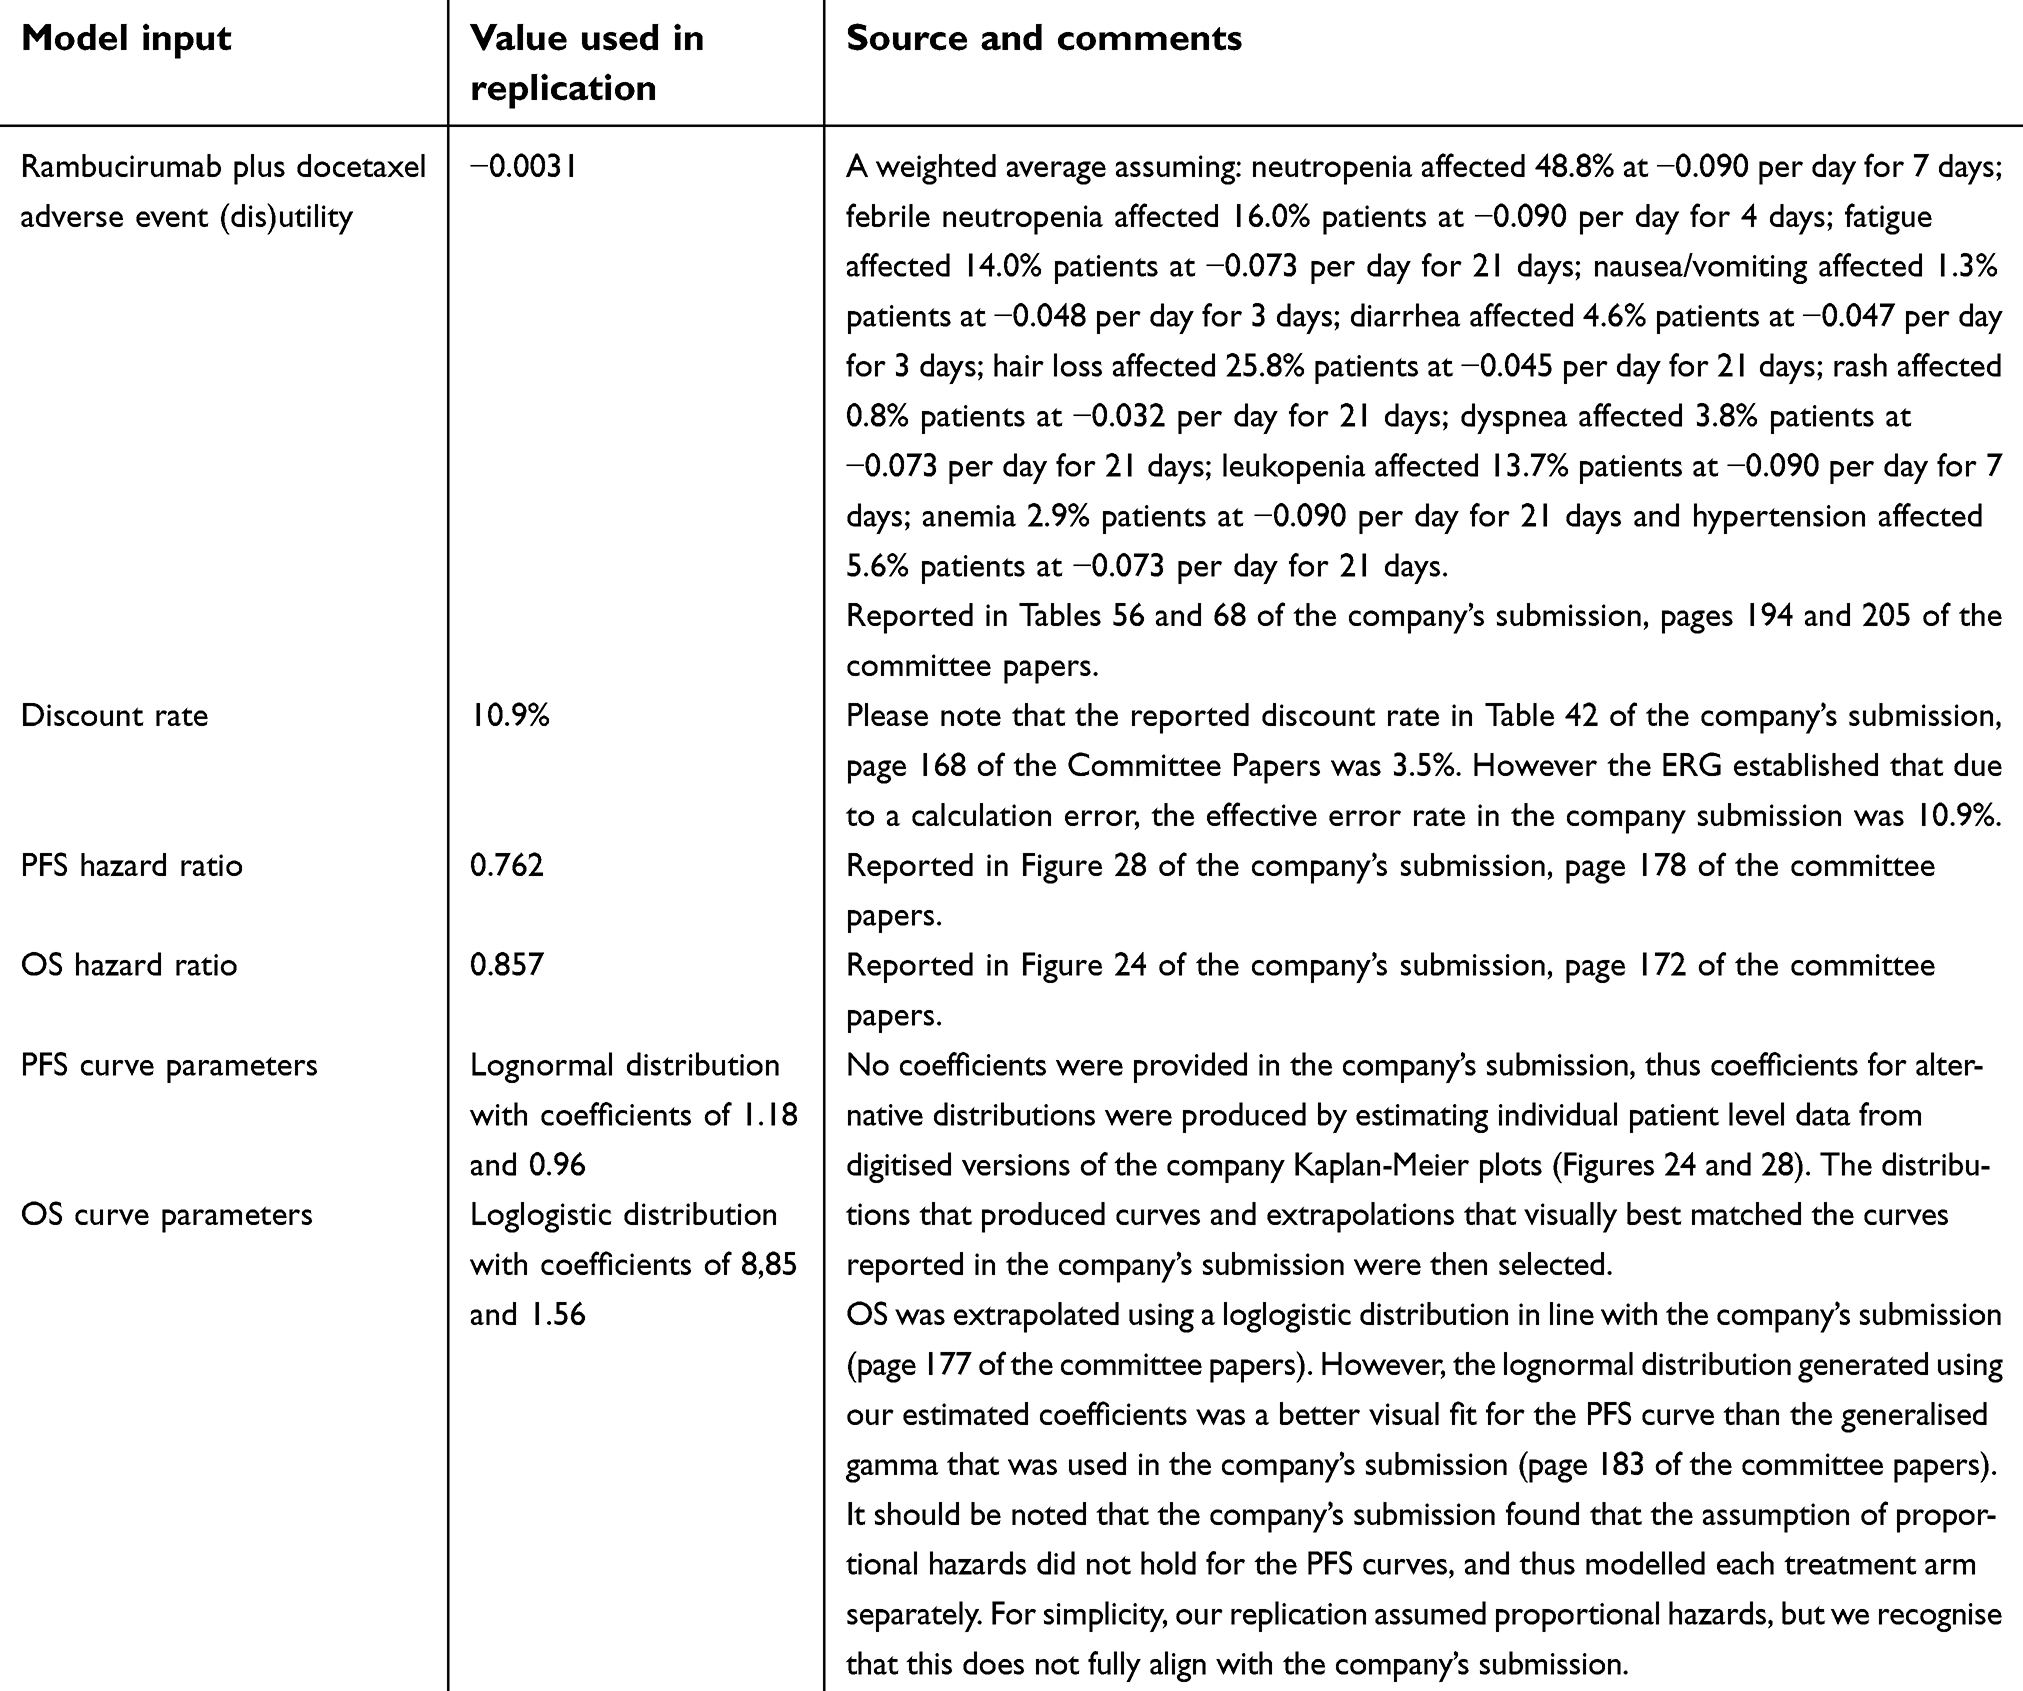 | Table S2 Model inputs used for matched replication |
Table S3 compares the results produced by our model replication with those reported in the company’s submission. It should be noted, that for this comparison, a discount rate of 10.9% was applied, in line with the effective error rate noted by the ERG that produced the model results in the company’s submission. While survival curves and total and incremental costs were closely replicated, total and incremental QALYs were higher in our replication, particularly in the pre-progressed state, reducing the overall ICER. The cause of this discrepancy was not clear.
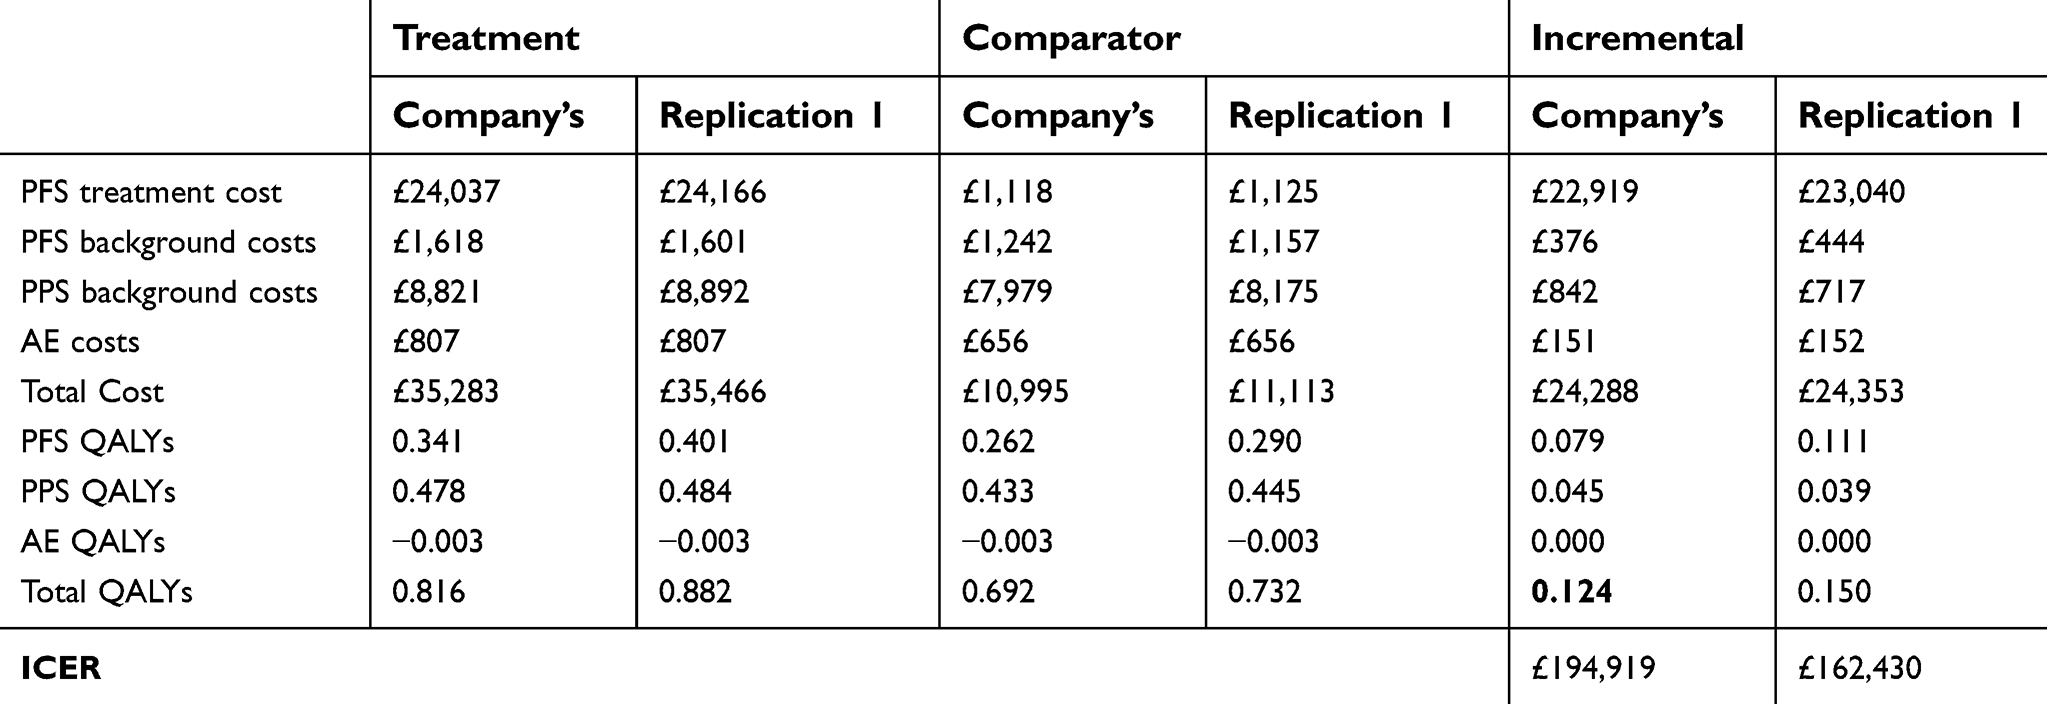 | Table S3 Model results for Replication 1, where inputs matched to the company’s submission |
To match our results more closely to those reported in the company’s submission, utilities were artificially deflated. With the use of the erroneous discount rate of 10.9% (as per the company submission) and the utilities reported in Table S4, the model results produced were a close match (Table S5).
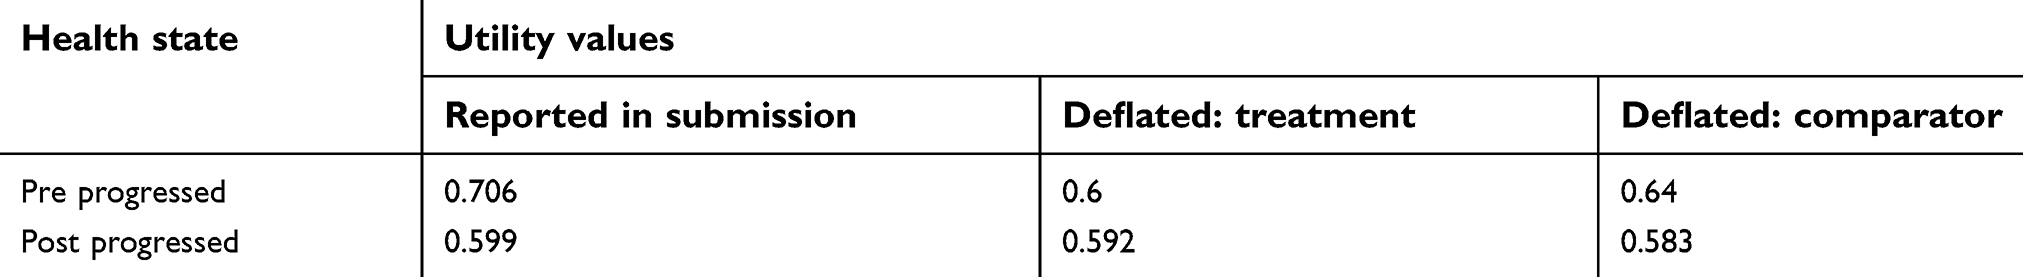 | Table S4 Artificially deflated utilities applied to second replication |
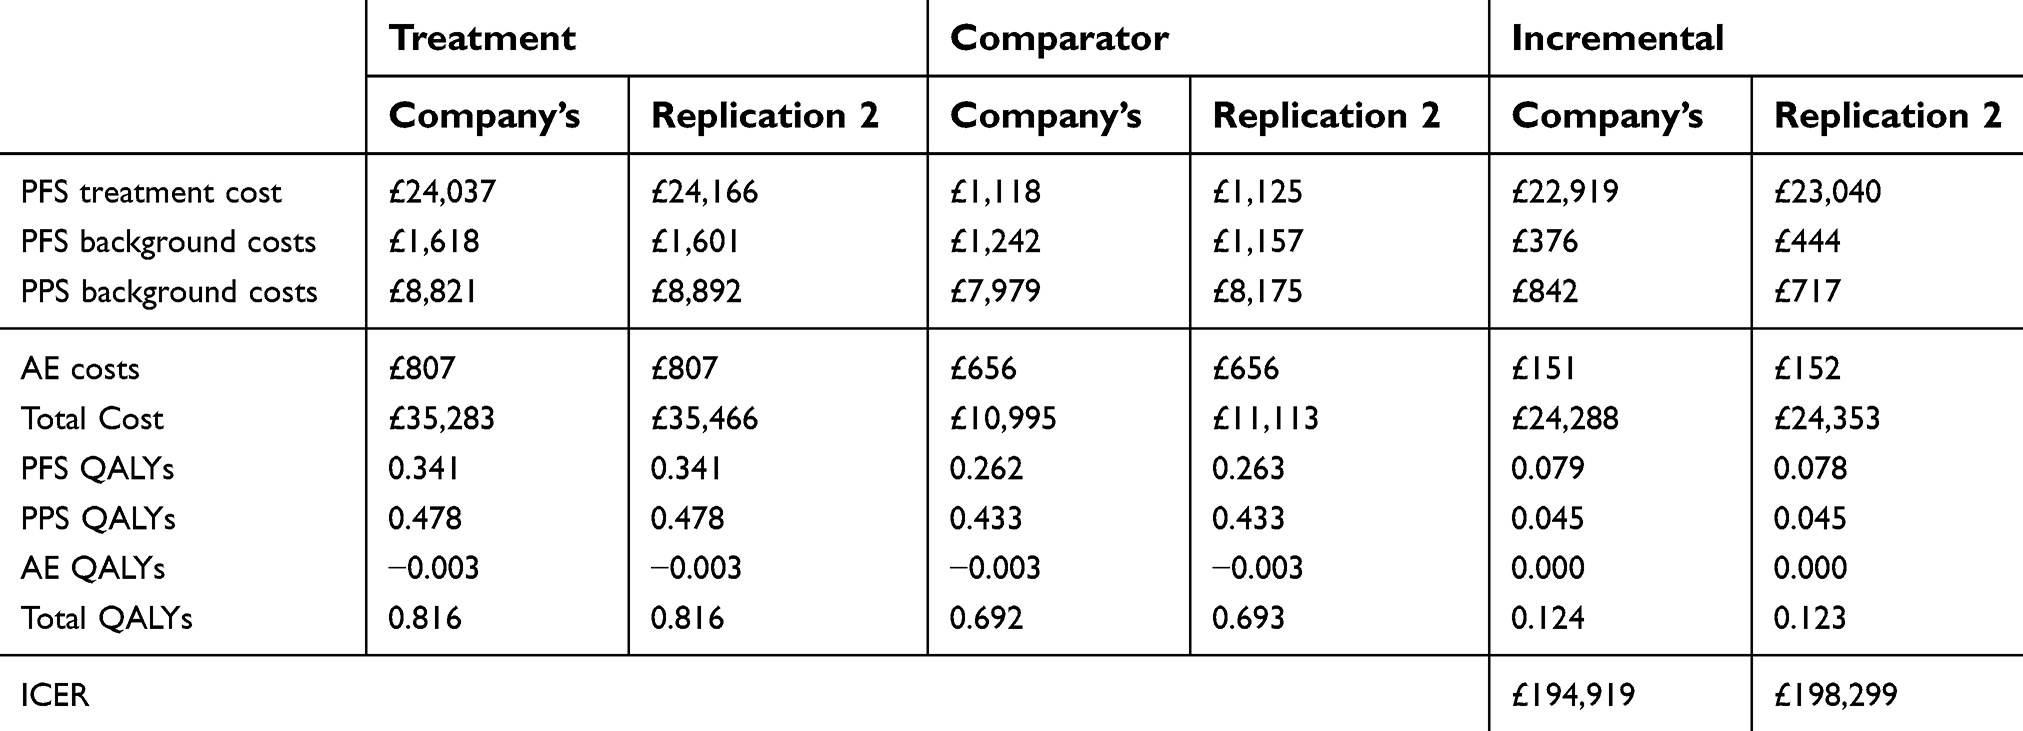 | Table S5 Model results for Replication 2, where utilities were artificially deflated |
All scenarios explored in the main text were also explored using both model replications. Given the similarity in the pattern of results, it was deemed that despite differences in post-progressed QALYs and the ICER, it would be most appropriate to present results for the model replication that matched the inputs to those in the company’s submission (rather than that which applied artificially deflated utilities). One exception was made, in that we thought it appropriate to correct the error in the discount rate identified by the ERG, and to apply the discounting at a rate of 3.5% in line with the NICE reference case. The purpose of the model replication was for the use of a realistic case study to illustrate the impact of the approaches taken in the main paper. As such, we considered our inability to replicate all aspects of the model exactly as immaterial to our objectives.
 © 2019 The Author(s). This work is published and licensed by Dove Medical Press Limited. The full terms of this license are available at https://www.dovepress.com/terms.php and incorporate the Creative Commons Attribution - Non Commercial (unported, v3.0) License.
By accessing the work you hereby accept the Terms. Non-commercial uses of the work are permitted without any further permission from Dove Medical Press Limited, provided the work is properly attributed. For permission for commercial use of this work, please see paragraphs 4.2 and 5 of our Terms.
© 2019 The Author(s). This work is published and licensed by Dove Medical Press Limited. The full terms of this license are available at https://www.dovepress.com/terms.php and incorporate the Creative Commons Attribution - Non Commercial (unported, v3.0) License.
By accessing the work you hereby accept the Terms. Non-commercial uses of the work are permitted without any further permission from Dove Medical Press Limited, provided the work is properly attributed. For permission for commercial use of this work, please see paragraphs 4.2 and 5 of our Terms.