")
Back to Journals » Nature and Science of Sleep » Volume 13
The Impact of Glycolipid Metabolic Disorders on Severity Stage-Specific Variation of Cardiac Autonomic Function in Obstructive Sleep Apnea: A Data-Driven Clinical Study
Authors Zhao X , Xu H, Dong C, Fan J, He G, Zou J, Meng L, Zhu H, Su K , Yang M, Yi H , Wang J, Yin S, Guan J
Received 23 April 2021
Accepted for publication 3 July 2021
Published 28 July 2021 Volume 2021:13 Pages 1347—1362
DOI https://doi.org/10.2147/NSS.S317201
Checked for plagiarism Yes
Review by Single anonymous peer review
Peer reviewer comments 3
Editor who approved publication: Professor Ahmed BaHammam
Xiaolong Zhao,1– 3,* Huajun Xu,1,3,* Chuan Dong,2,* Jiangang Fan,2 Gang He,2 Jianyin Zou,1,3 Lili Meng,1,3 Huaming Zhu,1,3 Kaiming Su,1,3 Mingpo Yang,4 Hongliang Yi,1,3 Jian Wang,5 Shankai Yin,1,3 Jian Guan1,3
1Department of Otolaryngology Head and Neck Surgery & Center of Sleep Medicine, Shanghai Jiao Tong University Affiliated Sixth People’s Hospital, Shanghai, People’s Republic of China; 2Department of Otolaryngology Head and Neck Surgery, Sichuan Provincial People’s Hospital, University of Electronic Science and Technology of China, Chengdu, People’s Republic of China; 3Shanghai Key Laboratory of Sleep Disordered Breathing, Shanghai, People’s Republic of China; 4Institute of Neuroscience, Shanghai Institutes for Biological Sciences, Chinese Academy of Sciences, Shanghai, People’s Republic of China; 5School of Communication Science and Disorders/Physiol & Biophysics, Dalhousie University, Halifax, NS, Canada
*These authors contributed equally to this work
Correspondence: Shankai Yin; Jian Guan Email [email protected]; [email protected]
Background: Cardiac autonomic dysfunction (CAD) is a common pathology in cardiovascular diseases; however, the role of glycolipid metabolic disorders in CAD development in obstructive sleep apnea (OSA) remains poorly understood.
Methods: In total, 4152 patients with suspected OSA were recruited in our sleep center. Metabolic characteristics including anthropometric and glycolipid data were collected. Heart rate variability (HRV) was measured to assess the risk of CAD; its dose–response relationship with OSA severity was evaluated via restricted cubic spline (RCS) analysis. A segmented multivariate linear regression (SMLR) model was used to evaluate the roles of metabolic variables in different stages of OSA.
Results: The RCS showed that CAD risk increased in a nonlinear relationship pattern with OSA severity, from slow fluctuation at earlier stages to rapid change in later stages. After integrating the clinical definition and RCS selected knots, we obtained the new four OSA severity stages. SMLR model showed that the overall value of glycolipid variables for prediction of HRV abnormalities was greater than the value of OSA variables at earlier stages, while OSA variables were more effective predictors in more severe stages. The discordance in respective relationship of HRV with metabolic and OSA variables sheds the light how metabolic disorders promoted the development of CAD in OSA, the later further in turn deteriorates cardiac function.
Conclusion: These results are indicative of stage-specific involvement of glycolipid metabolic factors underlying CAD nonlinear changes in patients with OSA. Early control glycolipid disorders may help the control of CAD development in patients with OSA.
Keywords: obstructive sleep apnea, autonomic nervous system, cardiac autonomic neuropathy, metabolism, heart rate variability
Introduction
Obstructive sleep apnea (OSA) is a breathing disorder characterized by recurrent episodes of upper airway collapse during sleep, leading to chronic intermittent hypoxia and sleep fragmentation.1 Several large cohort studies (eg, the Sleep Heart Health Study and WISCONSIN Study) have shown that OSA is associated with the development of cardiovascular disease (CVD).2–4 Cardiac autonomic dysfunction (CAD) is a common pathology involved in the development of many CVDs, including arrhythmia, hypertension and coronary artery disease.5,6 In the study of CAD, heart rate variability (HRV) is a widely used, noninvasive measure for assessment of cardiac autonomic function; it is also a good indicator of early impairment of heart function in the development of CVD.7,8 Previous studies have demonstrated that, in patients with OSA, HRV is regulated by multiple sleep-related factors (eg, arousal and sleep quality), as well as breathing-related factors (eg, respiratory rhythm and intrathoracic pressure).9,10 In parallel, multiple glycolipid metabolic disorders (eg, diabetes, hyperlipidemia, and obesity) frequently coexist in patients with OSA and appear to play a causative role in the development of many CVDs;11 they have been shown to exert significant adverse effects on autonomic cardiovascular nervous system function.12,13 Given this extensive interplay among OSA, glycolipid disorders, and CAD, a more thorough understanding of these interactions is warranted.14
HRV serves as a key component for evaluation of the interactions among CAD, glycolipid metabolic disorders, and OSA.11,13 However, most of previous studies investigated the one-to-one relationship across the three. This practice somehow resulted in a great limitation in exploring a clear relationship. For example, sleep-related breathing disorders were inversely associated with standard deviation of all normal R-R intervals (SDNN) in a large cohort of participants taken from the general population (n = 1255, 10% with OSA),15 in contrast to two other studies which revealed elevated SDNN scores in patients with OSA.16,17 Furthermore, two additional studies found that SDNN scores were not significantly associated with OSA.18,19 The reason for these previous inconsistent results is unclear and is likely multifaceted, for example, the small sample sizes or inadequate adjustment for confounding covariates. It is presumably partly because of various confounding factors, such as metabolic components. To the best of our knowledge, few studies have attempted to address the interrelationship among metabolism, OSA, and cardiac autonomic function. Of these analyses, only three small-sample studies (n = 46, 60, and 33 patients, respectively) investigated the role of the glucose metabolism on cardiac autonomic function in patients with OSA; no investigations into other metabolic factors (eg, lipid metabolism) have been reported thus far.20–22 While some degree of interaction had been observed among risk factors on cardiac autonomic function, these investigations were not comprehensive in nature. Another important maybe reason was that for many chronic diseases, such as obesity and diabetes, the relationship between a risk factor and its resulting consequence is rarely linear.23,24 In a large-sample study reported recently, we also found that the dose–response relationship between OSA severity and dyslipidemia was complex, such that it consisted of multiple stages with a plateau.25 Thus, the relationship between CAD and OSA may also be nonlinear in nature due to strong impact of glycolipid metabolic disorders on disease outcomes.
The goal of this study was to provide insights into the heterogeneous contributions of various risk factors to CVD variation among stages of OSA. In this study, early CVD development was investigated by evaluation of HRV in CAD. We hypothesized that OSA was associated with CVD development in a nonlinear manner, whereby glucolipid metabolic disorders served as significant confounders of disease outcomes. Rather than using a model-driven strategy, we selected a data-driven strategy to identify potential multi-stage relationships among risk factors (eg, glycolipid metabolism disorders, sleep disorders, and respiratory abnormalities) for CAD in patients with OSA.
Materials and Methods
Patients and Research Design
This cross-sectional observational study involved 4152 adults with symptoms of snoring and excessive daytime sleepiness who visited our sleep center from July 2012 to September 2017. In total, 752 patients were excluded for the following reasons: 1) age younger than 18 years; 2) use of coffee and/or other drugs that may affect heart rate, prior to nocturnal polysomnographic analysis; 3) prior diagnosis of CVD, hyperthyroidism, or respiratory diseases that may affect HRV; 4) previous treatments for OSA, diabetes, obesity or dyslipidemia; 5) other sleep disorder (eg, upper airway resistance syndrome, restless leg syndrome, or narcolepsy); or 6) missing data. Therefore, 3400 patients were included in the analysis. A flowchart outlining patient inclusion criteria is shown in Figure S1. Although none of the procedures involved in this study were experimental, written informed consent was obtained from each participant for inclusion in the study and for the use of personal information. This study was approved by the Internal Review Board of the Institutional Ethics Committee of Shanghai Jiao Tong University Affiliated Sixth Hospital and was conducted in accordance with the tenets of the Declaration of Helsinki.
Sleep Studies
A full nocturnal monitoring of sleep was conducted in each OSA subject using a laboratory-based polysomnography (PSG) device (Alice 4 or 5; Respironics, Pittsburgh, PA, USA) according to the American Academy of Sleep Medicine (AASM) criteria.26 Sleep period time (SPT) was the sum of the duration of stage 1, stage 2, stage 3 (or slow-wave sleep-SWS), wake time after sleep onset (WASO) and the sleep stage of rapid eye movement (REM). Sleep stages were expressed as percentage of SPT. Apnea was defined as the complete cessation of airflow lasted for 10 s or more; hypopnea was defined as either a larger -than-50% reduction in airflow for 10 s or more, or a smaller-than-50% but discernible reduction in airflow that was accompanied by either a more-than-4% decrease in oxyhemoglobin saturation or an arousal. The apnea-hypopnea index (AHI) records the number of apnea-plus-hypopnea events per hour during sleep. OSA was defined as apnea or hypopnea occurring no fewer than five times per hour, lasting for at least 10 seconds. An arousal was identified as an abrupt shift in the electroencephalogram frequency that lasted ≥3 s and was labelled during rapid-eye-movement sleep by a concurrent increase in the electromyogram amplitude. The microarousal index (MAI) was defined as the average number of arousals per hour of sleep. The oxygen desaturation index (ODI) was defined as the total number of episodes of ≥4% oxyhemoglobin desaturation per total sleep time in hours. OSA severity was defined by AHI according to the current standards: non OSA (AHI<5), mild OSA (5≤AHI<15), moderate OSA (15≤AHI<30), severe OSA (AHI≥30).26 Epworth sleepiness scale (ESS) is a self-administered questionnaire that provides a subjective measure of daytime sleepiness in eight items. Respondents use a four-point scale (scored 0 to 3) to respond to each of the eight questions, and the scores are summed to provide an overall score of 0 to 24.27
Heart Rate Variability Analysis and Definition of CAD
HRV was analyzed following the guidelines of Task Force of the European Society of Cardiology and the North American Society of Pacing and Electrophysiology.8 In the polysomnographic test, ECG signal was recorded at 500 Hz an over 5-min awake period before the onset of sleep when the subject was breathing spontaneously and in supine position. The 5-minutes ECG segment taken during wakefulness periods were used to calculated the HRV parameters. The ARTiiFACT 3.0 (Psychonomic Society, Inc.) was used to detect R-peaks and extract inter-beat intervals. The result was manually corrected for missing R-peaks and incorrect artifacts by an experienced doctor. In the frequency-domain analysis, the power was calculated in both low-frequency (LF, 0.04–0.15 Hz), and high-frequency bands (HF, 0.15–0.40 Hz). The LF component was corrected to normalized units (nus) using the equation LF[n.u.]=LF/(LF+HF), and the HF component was corrected to normalized units as HF[n.u.]=HF/(LF+HF). Table S1 summarizes the HRV parameters and CAD percentages in each group according to the diagnosis of OSA severity. The abnormality of those HRV indices were often considered as the indication of CAD.6,12 Two approaches were used to define the cardiac autonomic dysfunction (CAD) in this report. Firstly, the highest or lowest quartile of various HRV indices was considered as the indices for CAD. Secondly, the reference values for HRV was established from the 263 healthy subjects based upon the Clinical and Laboratory Standards Institute (CLSI) C28 protocol.28 If HRV index met normal distribution, the reference range was set as mean ± 2 SD. If a normal distribution was not reached, then the reference range was set from 5th percentile to 95th percentile (Table S2).
Anthropometric and Biochemical Measurements
Body mass index (BMI) was calculated as weight in kilograms divided by height in meters squared (kg/m2). Obesity was defined as BMI ≥ 30 kg/m5. Neck circumference (NC) was measured midway between the mid-cervical spine and mid-anterior neck to the nearest 0.5 cm, just below the laryngeal prominence if palpable. Waist circumference (WC) was measured midway between the lower costal margin and the iliac crest while the subject was standing. Hip circumference (HC) was measured as the maximum girth of the greater trochanters. WHR was the ratio WC and HC. Daytime blood pressure (BP) was measured after at least 5 min of rest in a sitting position using a mercury sphygmomanometer, following the American Society of Hypertension Guidelines, and the mean of three measurements was recorded. The presence of hypertension (defined as SBP ≥ 140 mmHg, DBP ≥ 90 mmHg, or current use of antihypertensive medication). For each participant, a fasting blood sample was collected from the antecubital vein the morning after PSG monitoring. The fasting serum glucose was measured using an H-7600 autoanalyzer (Hitachi, Tokyo, Japan).
An immunoradiological method was used to measure the fasting serum insulin level. Insulin resistance was estimated using the previously described homeostasis model assessment method: fasting serum insulin (μU/mL) × fasting plasma glucose (mmol/L)/22.5. Serum lipid profiles were measured in the hospital laboratory using routine procedures, including total cholesterol (TC), triglycerides (TG), high-density lipoprotein cholesterol (HDL-C), low-density lipoprotein cholesterol (LDL-C), apolipoprotein (apo) A-I, apoB, apoE, and lipoprotein(a) (Lp(a)). Diabetes was defined as a fasting blood glucose level ≥126 mg/dL (or 7.0 mmol/L). Dyslipidemia in terms of TC, TG, HDL-C, and LDL-C was defined as ≥5.17, ≥1.7, <1.03, and ≥3.33 mmol/L, respectively, according to the diagnostic criteria of the US National Cholesterol Education Program Adult Treatment Panel III (NCEPIII).29
Statistical Analysis
Statistical analyses were performed using IBM SPSS Statistics, version 20 (IBM Corp., Armonk, NY, USA). P values < 0.05 were considered to indicate statistical significance. Data that are normally distributed, skewed, or categorical are shown as either the mean (standard deviation) or median (interquartile range), as appropriate. The Kolmogorov–Smirnov test was used to determine whether continuous variables followed a normal distribution. Skewed variables were log-transformed using the natural logarithm method to determine whether a normal distribution could be attained; variables that continued to exhibit a skewed distribution were analyzed by nonparametric methods. Differences in baseline characteristics among groups of patients were assessed using one-way analysis of variance or nonparametric tests for continuous variables and the chi-squared test for categorical variables. The post hoc test was used to compare the subgroup difference.
To reduce the quantity of raw data and simplify the analysis, correlation analyses were conducted across individual HRV parameters (Table S3). Results from this analysis, in combination with common HRV indices used in previous studies,5–10 were used to identify three common indicators of HRV that served as indirect measurements of cardiac autonomic function. Mean heart rate (MEANHR) and low frequency/high frequency ratio (LF/HF) were selected to measure sympathovagal imbalance. SDNN was used to quantify the standard deviation of all heart rates during the test period, which mainly reflected the degree of parasympathetic activity; a reduction typically represented impaired autonomic function. Abnormalities of those HRV indices were regarded as indications of CAD (Table S2). A full description of the guidelines used in these assessments can be found in the Supplementary Materials.
The dose–response association between OSA severity and the log probability of CAD (as tested in HRV indices) was quantitatively assessed using restricted cubic spline (RCS) modeling. A detailed description of the procedures used in these analyses can be found in our previous work.25 The knots were equally spaced between the splines on the quantile scale using the default setting (typically 5). The detail for the RCS selected knots had been provided in the Supplementary Material. Following integration of the clinical definition of OSA severity and the OSA quantitative knots generated in our RCS analysis, patients were regrouped according to AHI scores into a new set of four severity stages. Multiple stepwise linear regressions were then performed using MEANHR, SDNN, and LF/HF as dependent variables, which were then compared against each independent variable including general measurements (eg, age, sex, BMI, hypertension, alcohol status, and smoking status), glycolipid metabolic variables (eg, ratio between waist circumference and hip circumference [WHR], fasting glucose, fasting insulin, and blood serum lipid), and OSA variables (AHI, MAI, Epworth Sleepiness Scale score [ESS], total sleep time, and sleep stage distribution). The R2% was calculated from the multiple linear regression for each individual variable. The relative contribution of metabolic variables and OSA variables in prediction of the HRV index was then calculated as the sum of individual R2% of the variables in each category divided by the total.30
Please see the online Supplementary Materials and Data for details regarding the following items: healthy participant recruitment, the detail for the RCS selected knots, and supplementary results (Figures S1–S3 and Tables S1–S4).
Results
Patient Baseline Characteristics
Patients were divided into four subgroups according to the current standards of OSA severity. Table 1 summarizes the baseline characteristics of all variables in each subgroup. Patients with more severe OSA were more likely to be elderly, male, smokers, and drinkers, consistent with the findings in previous reports. Serum high-density lipoprotein cholesterol, apolipoprotein A, and lipoprotein a (Lp-a) concentrations; lowest oxygen saturation; and the percentages of slow wave sleep, REM, and wake time after sleep onset were all negatively correlated with the AHI. In contrast, BMI, neck circumference, waist circumference, hip circumference, systolic blood pressure, and diastolic blood pressure were all positively correlated with AHI (all p < 0.05), and the serum concentrations of total cholesterol, triglycerides, low-density lipoprotein cholesterol, apolipoprotein B, apolipoprotein E, fasting glucose and insulin, as well as ODI, MAI, ESS score, and the percentages of sleep stages 1 and 2 were all positively correlated with AHI (all p < 0.05).
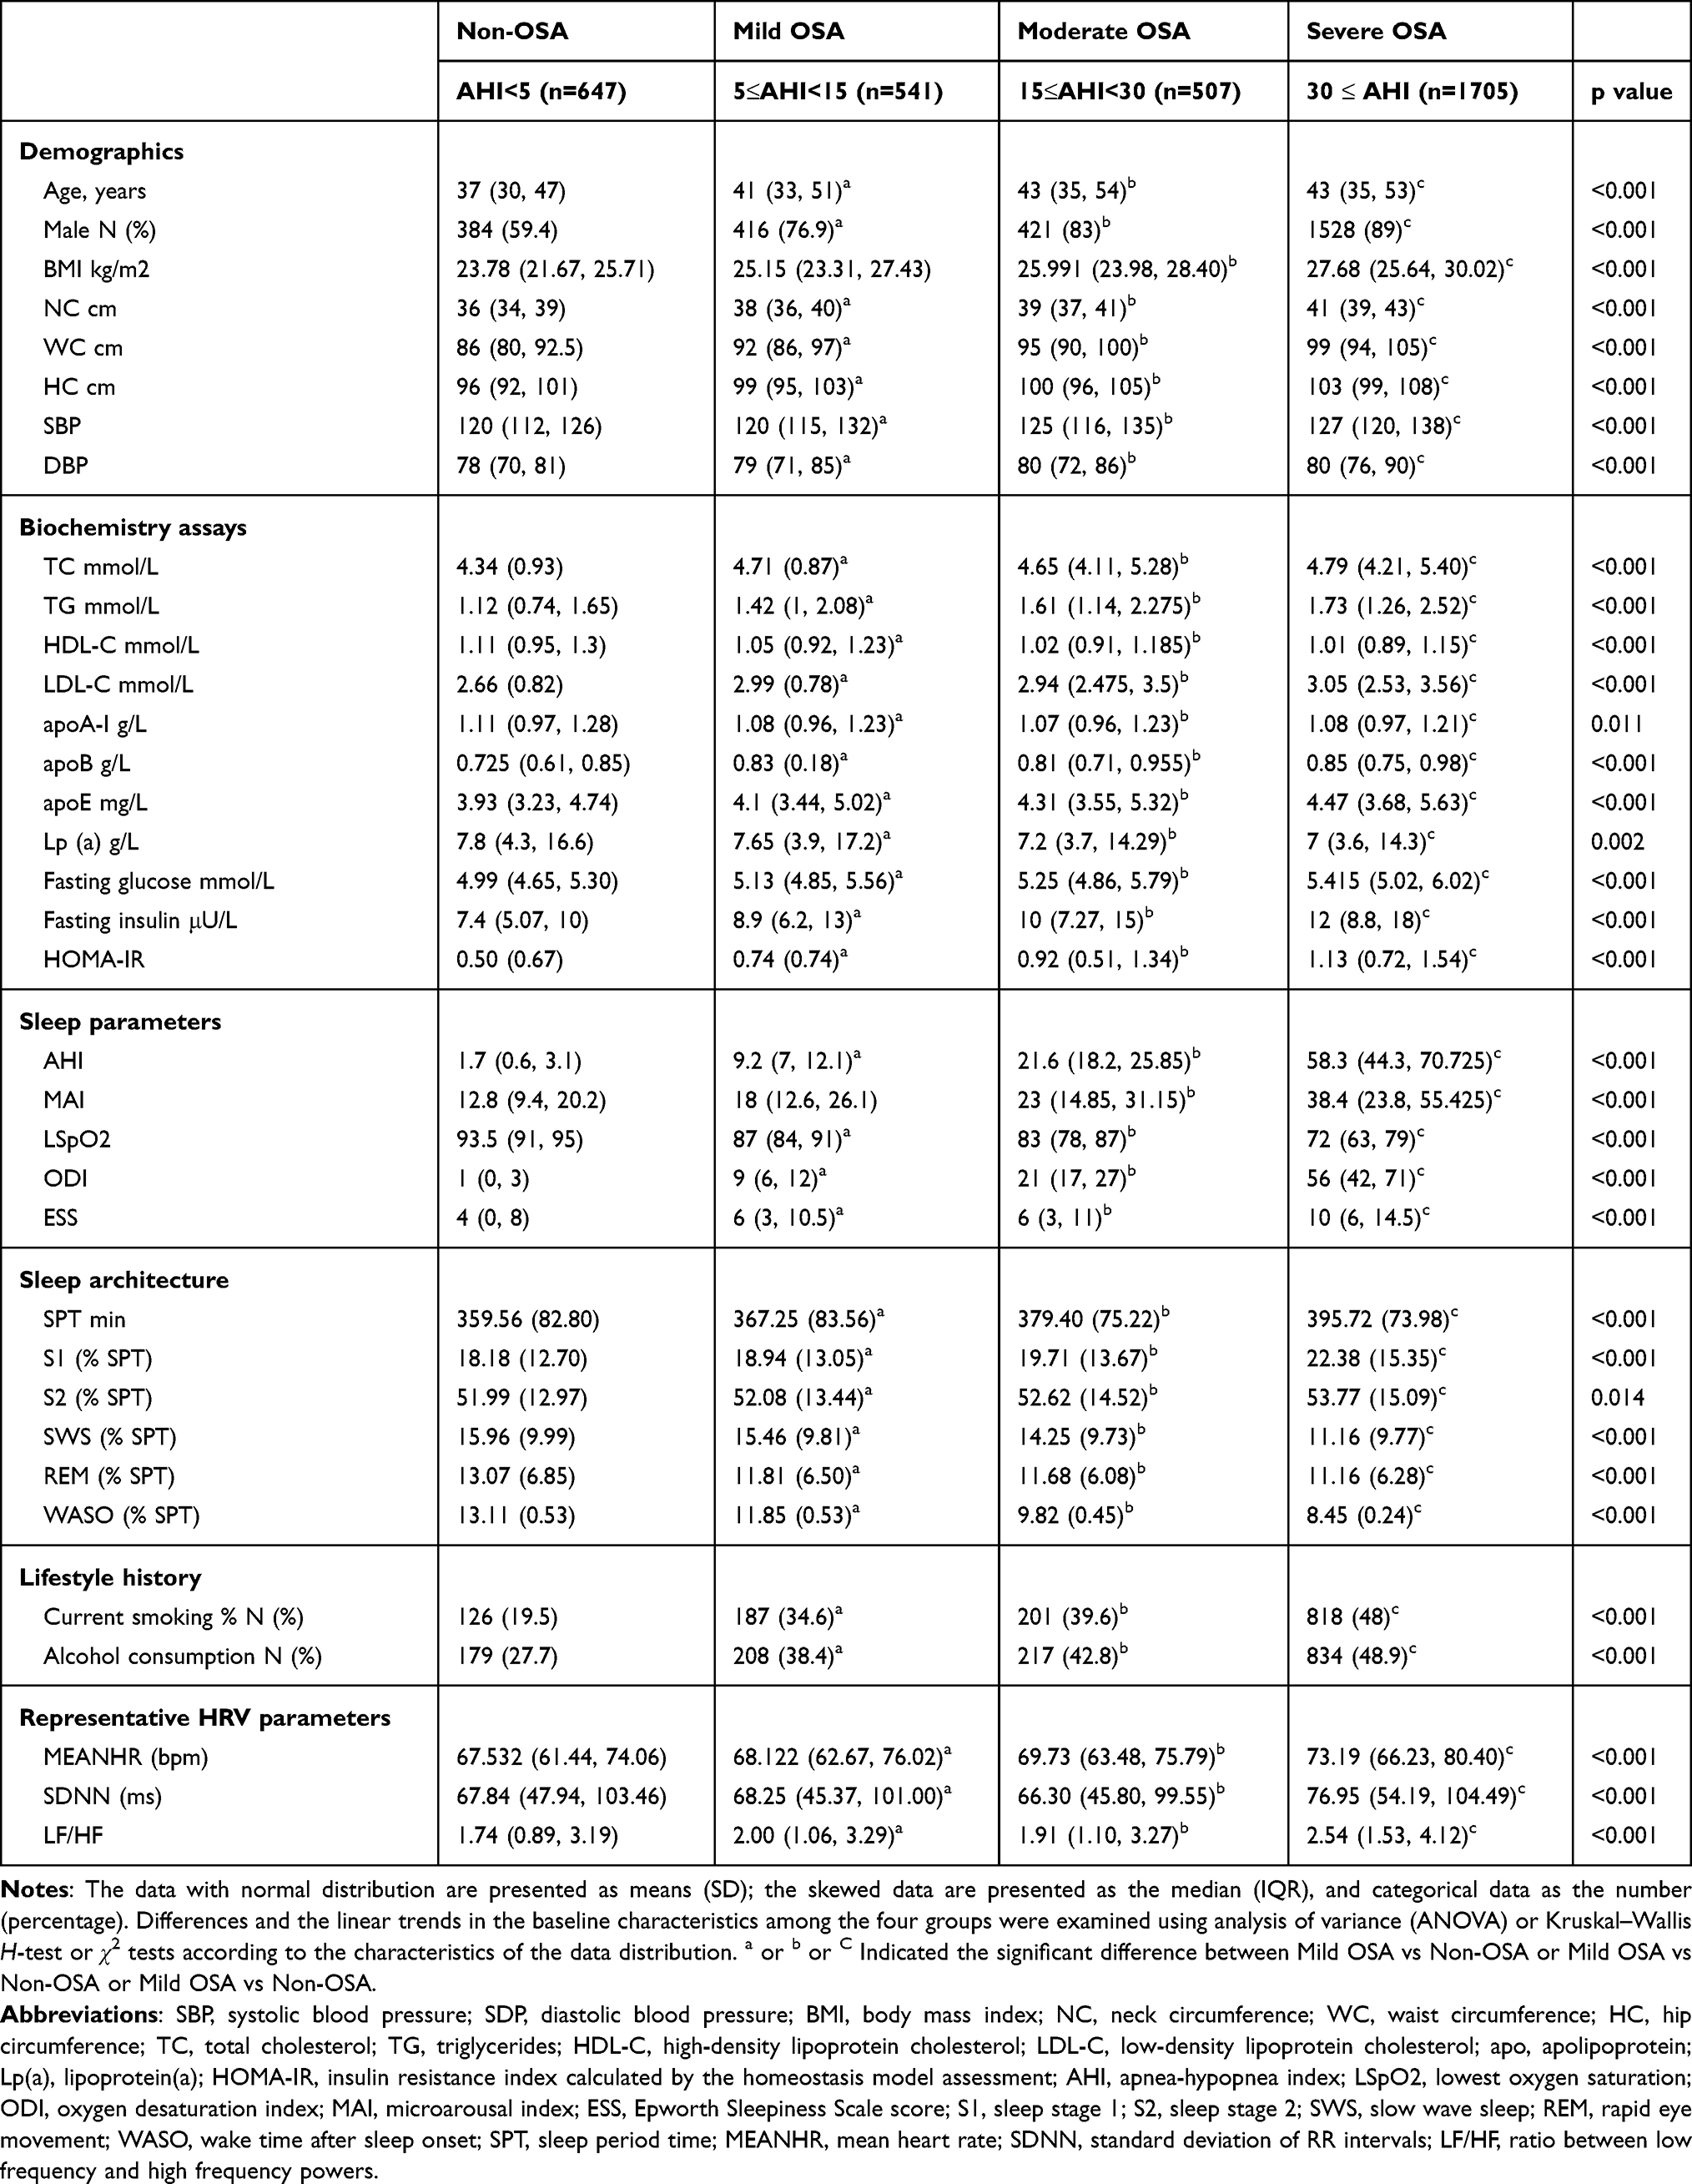 |
Table 1 Comparison of Demographic/Metabolic Characteristics and HRV Across 4 Subgroups Classified by OSA Severity |
Preliminary Assessment of HRV Indices with OSA Severity
As demonstrated in the baseline data (Table 1), the representative HRV indices (MEANHR, SDNN, and LF/HF) varied with different OSA severity subgroups; their values did not follow a uniform pattern in either of the two subgroups. For example, the values of SDNN and LF/HF were higher in the mild OSA subgroups than in the non-OSA subgroups; however, the values were lower in the moderate OSA subgroup than in the mild OSA subgroup. The relationship between OSA and other HRV indices also showed the same pattern (Table S1). Because inadequate stratification of OSA might have concealed the actual correlations, all 3400 patients were further divided into 10 equal portions according to the value of AHI; average HRV values were then recalculated across each of the 10 groups. Figure 1 shows how the three HRV parameters (MEANHR, SDNN, LF/HF) change among individuals with different AHI scores. An overall enhancement was observed in all three indices in conjunction with elevated AHI; however, the relationship was not uniform. MEANHR and LF/HF changed very slowly at AHI levels below 50 and 60, respectively, but increased sharply thereafter. A small asymptotic enhancement was observed in SDNN values in association with elevated AHI, following two fluctuations at AHI levels below 30.
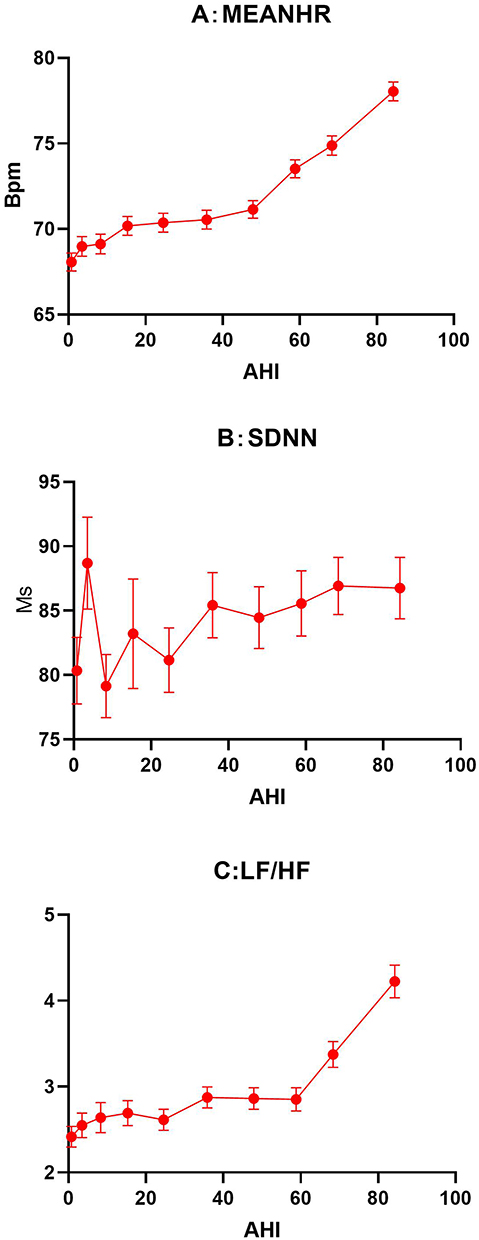 |
Figure 1 The changes of HRV indices as the function of AHI. The HRV parameter value is presented as means (SD). A total of 3400 subjects were divided equally according to decile. (A-C) are the HRV parameter value along with OSA severity . Abbreviations: LF/HF, the ratio between low frequency and high frequency powers; MEANHR, the mean heart rate; OSA, obstructive sleep apnea; SDNN, standard deviation of all normal RR intervals. |
Dose–Response Relationships Between HRV Indices and OSA Severity Indices, Determined by Nonlinear Model Analysis
RCS analysis was used to evaluate the potential dose–response relationships between the three HRV parameters used as indices of CAD and OSA severity indices (AHI, ODI, MAI) (Figure 2). For each of the three HRV indices, log odds were calculated as a function of the three OSA indices (AHI, ODI, and MAI) in 7 distinct conditions: (1) raw data (unadjusted), or data adjusted by (2) age; (3) sex; (4) BMI; (5) age, sex, and BMI; (6) smoking and alcohol statuses; or (7) all above factors in combination. As shown in Figure 2, the 7 log odds-OSA curves in each panel were either parallel or largely overlapping. Notably, the risk of HRV indices did not change linearly with any of the three OSA severity indices. In the high MEANHR and high LF/HF measurements, the log-odds curve exhibited slow changes or other fluctuations in the early stages of OSA (AHI scores between 5 and 15). This early lag phase was followed by a rapid change in association with further enhancements of OSA severity, ultimately reaching a plateau at very high OSA indices. For example, the log odds of high MEANHR exhibited a slow rise with AHI below 15 (Figure 2A), followed by a small decline with AHI scores between 15 and 30. A rapid rise was observed at AHI scores greater than 30, after which no significant changes were observed in association with higher AHI. Similar nonlinear features were evident in the log-odds-OSA curves for the risks of all three HRV indices as functions of the other OSA indices (ie, ODI and MAI) (Figure 2). Similar fluctuations were also obtained when CAD was defined according to the normal reference values from the healthy participant cohort (Figure S3). Notably, in the log-odds curves against AHI and MAI (but not ODI), there is a plateau for patients with very severe OSA (eg, AHI and MAI > 90). While the cause of this plateau is unclear, the limited number of patients in this study above this threshold (72 patients) prevented definitive assessment regarding these patients.
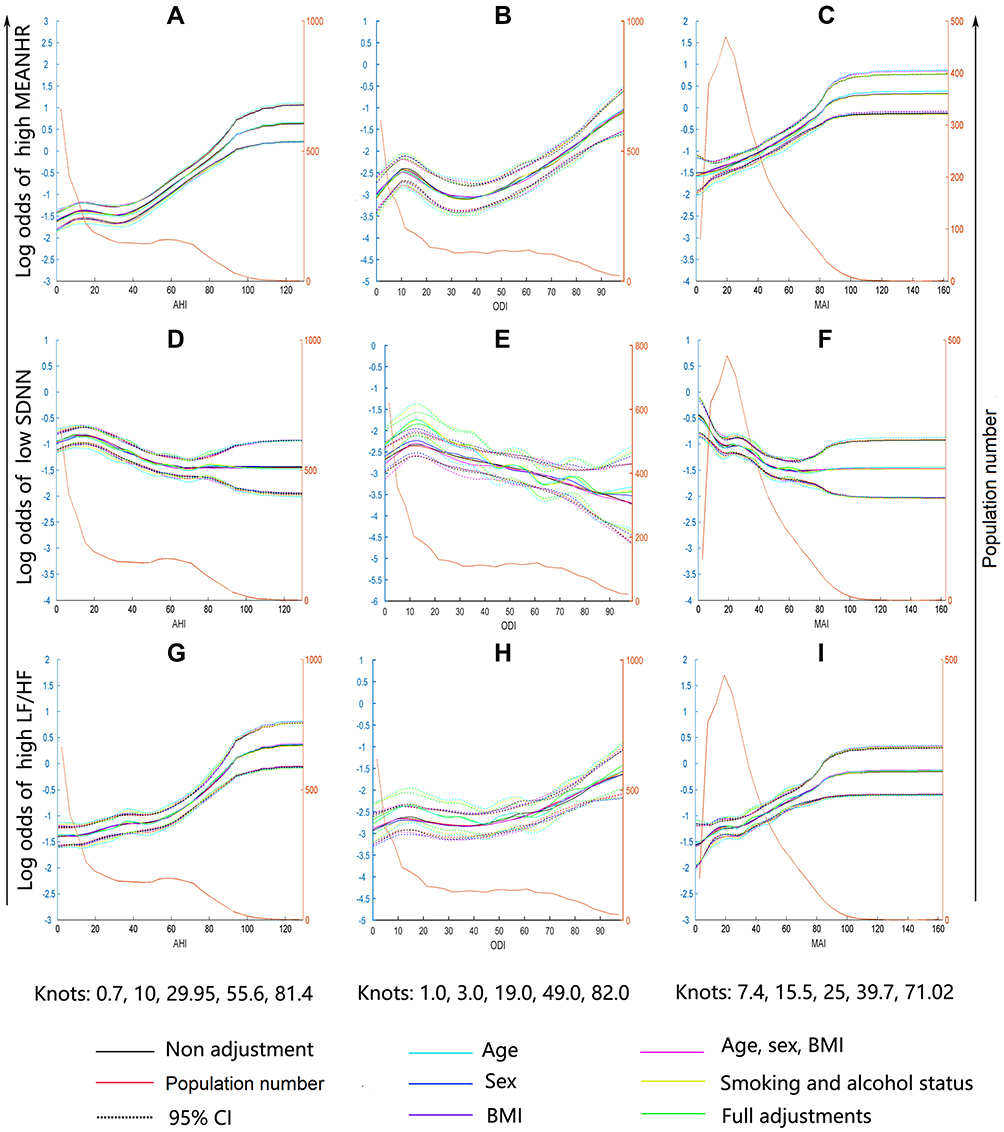 |
Figure 2 Restricted cubic spline regression of the dose response patterns between OSA severity and the risk of CAD represented by HRV indices. The highest or lowest quartile for each HRV index was defined as high or low HRV indices as CAD. The x-axis represents the continuous values of OSA severity (AHI, ODI and MAI). The left y-axis represents the log odds of CAD for each HRV index. The population number for each OSA severity measure unit is indicated by the yellow line in the figure. The right y-axis represents the population number. The dose response patterns for the risk of high MEANHR against the AHI (A), ODI (B), MAI (C); the dose response patterns for the risk of lower SDNN against the AHI (D), ODI (E), MAI (F); the dose response patterns for the risk of high LF/HF against the AHI (G), ODI (H), MAI (I). Abbreviations: AHI, apnea-hypopnea index; OSA, obstructive sleep apnea; CAD, cardiac autonomic dysfunction; LF/HF, ratio between low frequency and high frequency powers; MAI, microarousal index; MEANHR, mean of heart rate; ODI, oxygen desaturation index; SDNN, standard deviation of RR intervals. |
Despite these strong associations, the overall log odds of low SDNN was inversely proportional to OSA severity (Figure 2D–F), a trend that was generally consistent with the overall enhancement of SDNN with OSA (Figure 1). This phenomenon makes SDNN unique. While the risks of high MEANHR and high LF/HF increase with OSA severity (Figure 2A–C, G–I), the risk of low SDNN does not. These findings suggest that the impact of OSA on the development of CAD is likely different from that of other chronic disorders, such as type II diabetes.
Multi-Stage Model for Assessment of Glycolipid Metabolic Disorder Impacts on HRV Indices
Patients with OSA are typically categorized according to AHI clinical definitions (normal, mild, moderate, and severe). Based on these observations, we chose to employ a data-driven strategy as the best option for identifying the true multi-stage in OSA. In the present study, after adjustments for standard covariates such as age and sex etc, AHI thresholds were calculated based on RCS curves (AHI = 0.7, 10, 29.95, 55.6, and 81.4, respectively). We integrated the clinical definition and RCS-selected thresholds, then regrouped the OSA severity stages from I to IV as AHI < 10, 10 ≤ AHI < 30, 30 ≤ AHI < 55, and AHI ≥ 55, respectively. After this regrouping, we repeated the SMLR analysis to identify risk factors and their respective predictive values for HRV abnormalities in each stage.
The results of SMLR are summarized in Tables 2–4 for each of the three HRV indices. These tables also show the SMLR values comparing HRV indices with glycolipid factors, sleeping, and OSA variables, respectively. A complex profile is present in the correlations between individual glycolipid factors and HRV indices. First, there is no consistency between individual metabolic risk factors and HRV indices across different OSA stages. For example, WHR was only correlated with MEANHR in patients with stage II OSA (10 ≤ AHI < 30); no associations were observed in other groups (Table 2). In contrast, fasting insulin was positively correlated with MEANHR across all four stages. Second, individual HRV indices were correlated with different metabolic risk factors, even in a single stage. For example, in patients with stage I, MEANHR was positively correlated with fasting glucose, insulin, and total cholesterol (β = 0.921, p = 0.028; β = 0.153, p = 0.008; and β = 0.804, p = 0.029, respectively; Table 2), while SDNN was negatively correlated with fasting insulin and Lp-a (β = −0.691, p = 0.023; β = −0.175, p = 0.048, respectively). Furthermore, the correlations between OSA variables and HRV indices were much stronger in later OSA stages. For example, significant correlations were observed between AHI and MEANHR, as well as LF/HF, in patients with stage IV OSA (β = 0.125, p < 0.001 and β = 0.049, p < 0.001; Tables 2 and 4). Strong correlations were also observed between MAI and SDNN in these patients, as mentioned above. Such correlations were specific to this group; no correlations were observed in patients with earlier stages of OSA.
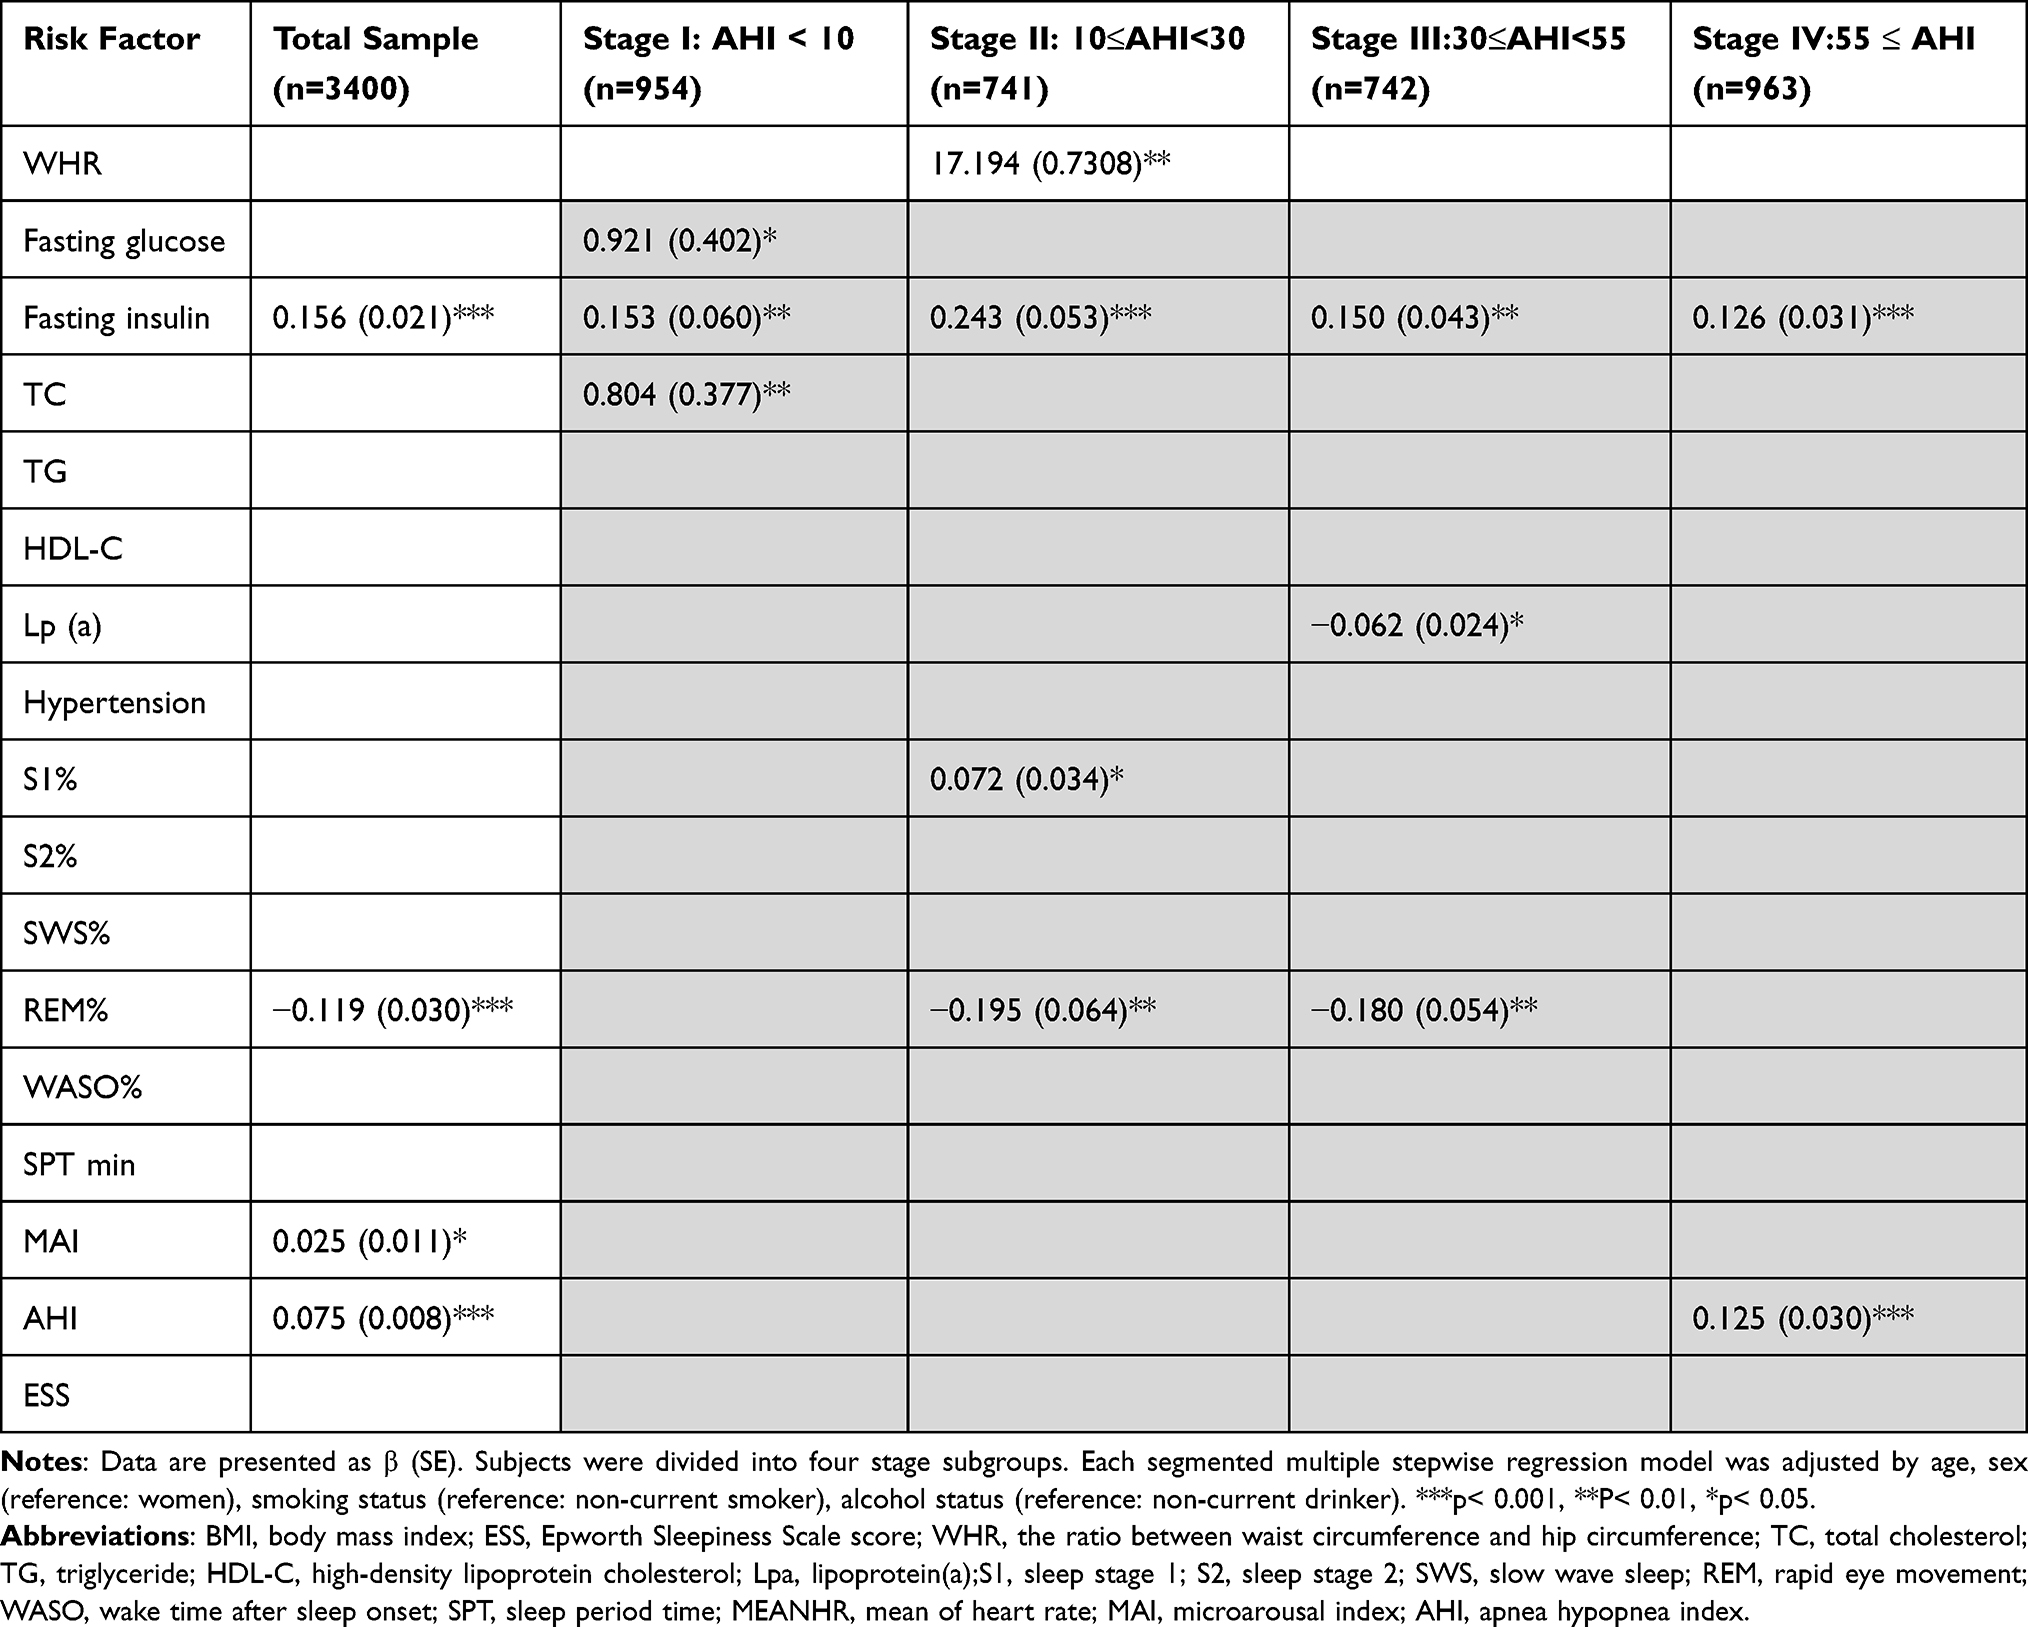 |
Table 2 The Correlations Between Potential Risk Factors and MEANHR Evaluated by Multivariate Linear Regression Analysis in Multiple Stages Model |
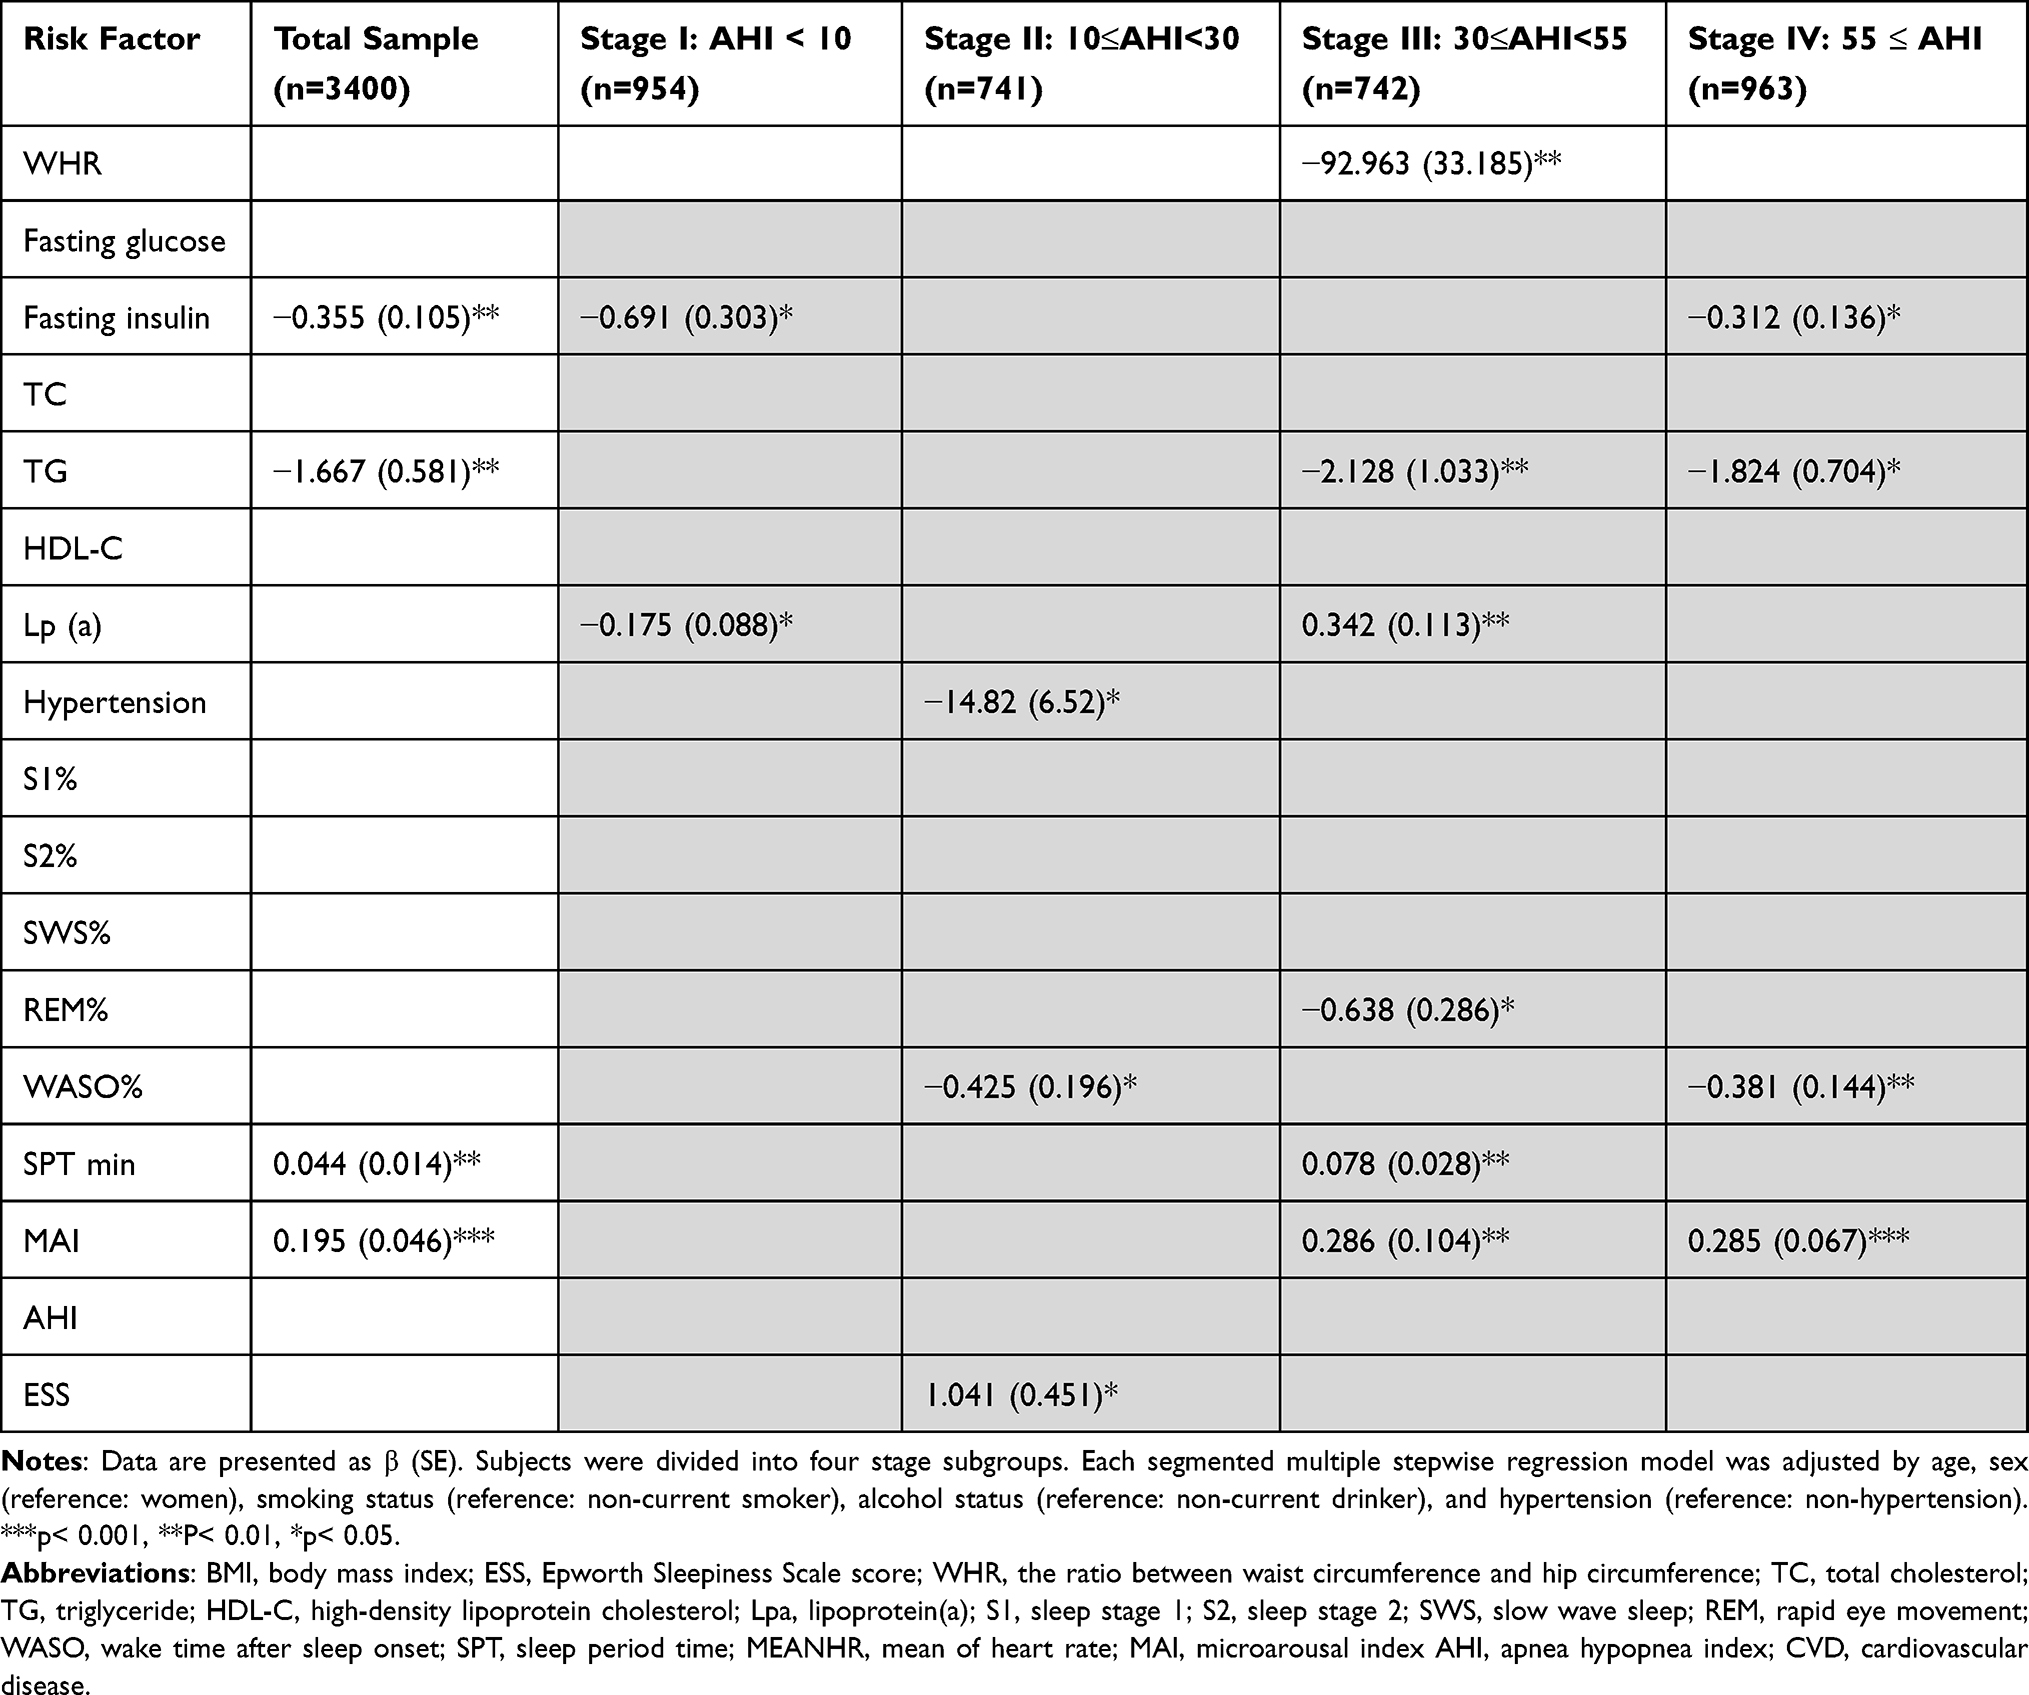 |
Table 3 The Correlations Between Potential Risk Factors and SDNN Evaluated by Multivariate Linear Regression Analysis in Multiple Stages Model |
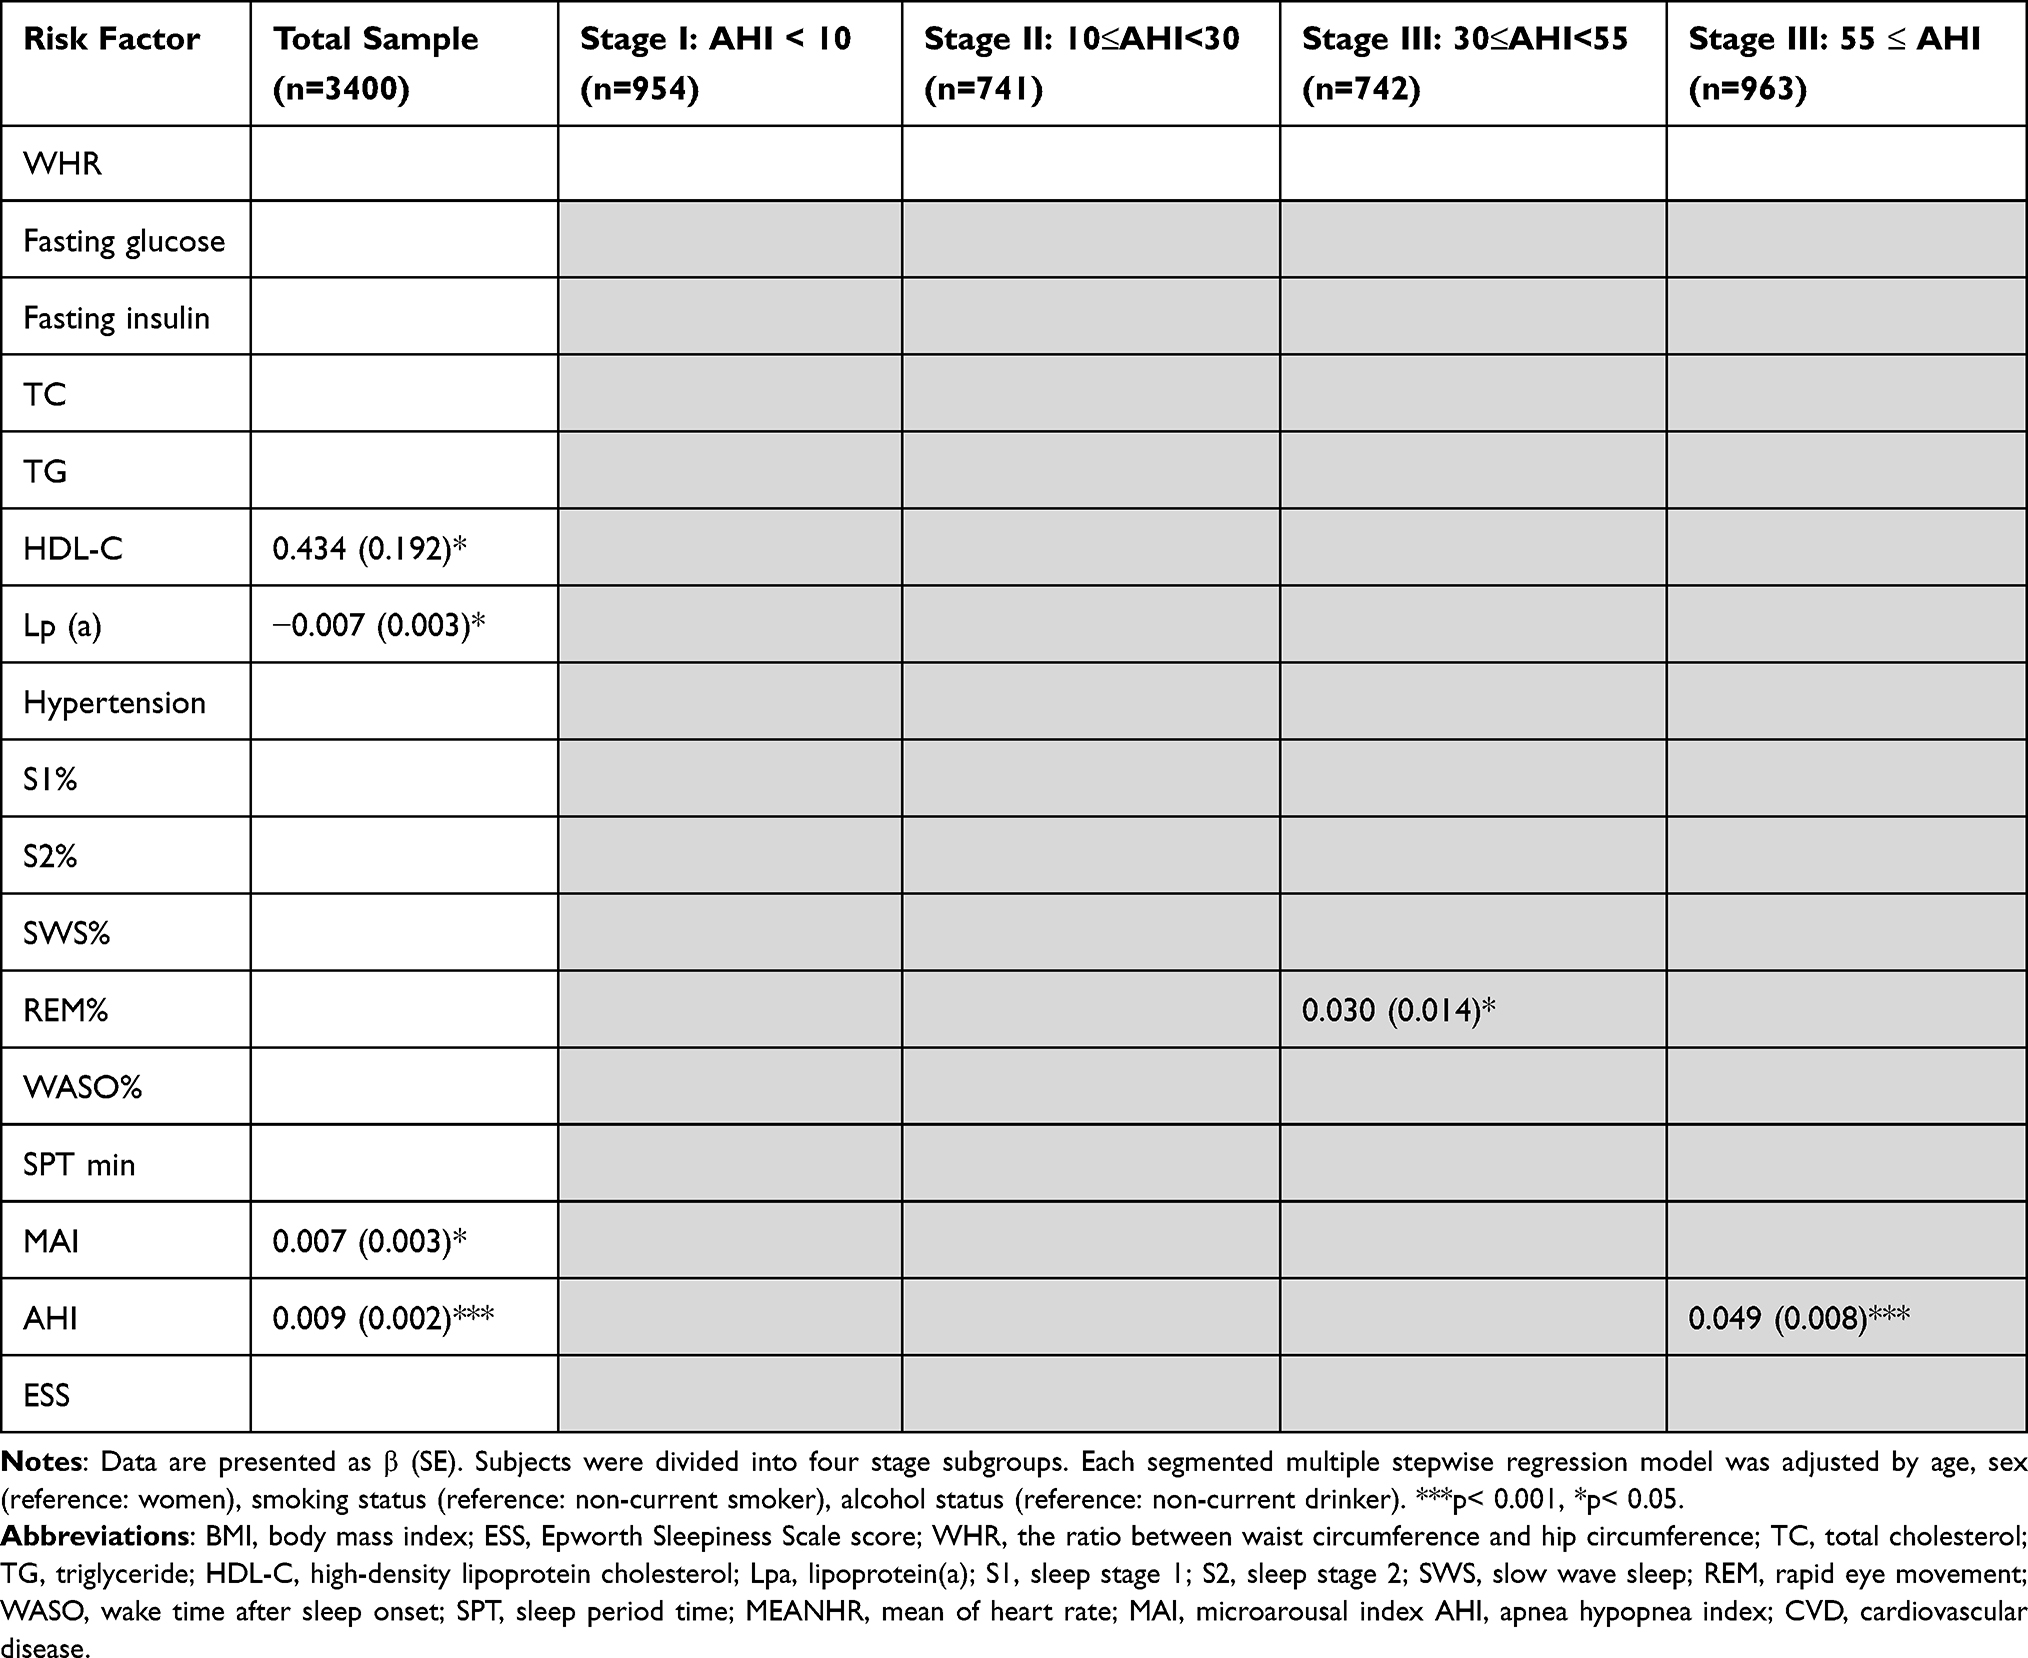 |
Table 4 The Correlations Between Potential Risk Factors and LF/HF Evaluated by Multivariate Linear Regression Analysis in Multiple Stages Model |
The correlations between observed metabolic risk factors and SDNN do not match the relationships between OSA measurements (eg, MAI) and HRV index. SDNN values increased with OSA severity (Figure 1); the log odds ratio of low SDNN values decreased in association with OSA indices (Figure 2D–F). Because the overall frequency of metabolic disorders increases in association with OSA severity, regardless of whether this relationship is linear, SDNN is predicted not to decrease in response to higher rates of metabolic disorders during OSA development. However, based on the based on the standardized coefficients in multivariate linear regression analysis, most metabolic factors observed in this study (WHR, fasting insulin, and triglycerides) were indeed negatively associated with SDNN across all OSA stages; an exception was Lp-a in patients with stage III OSA, which showed a positive correlation (Table 3). Furthermore, the correlations between SDNN and AHI were not significant in patients with any OSA stage, although MAI was positively associated with SDNN in patients with stages IV and V OSA (β = 0.286, p = 0.008; β = 0.285, p < 0.001, Table 3).
The contribution of metabolic disorders and OSA were determined as the sum of individual R2% of the variables in each category divided by the total. This analysis was performed for each of the two factors (metabolic disorders versus OSA) in two SMLR models: model 1 included the metabolic disorder variables WHR, fasting glucose, fasting insulin, and blood serum lipid, along with two OSA variables (AHI and MAI). Model 2 included all variables in model 1, along with additional sleep variables (eg, ESS, total sleep time, and OSA sleep stage distribution). The relative contribution values of the two factors (metabolic disorders and OSA) varied across OSA stages. The mean predictive value of glycolipid metabolic variables was stronger for MEANRR than for OSA variables (AHI and MAI in the SMLR model 1) in the first three stages of OSA (R2 = 2.4%, 3.6% and 2%, respectively, for metabolic variables and 0% for all OSA stages; Figure 3A). Similar results were obtained in model 2, which contained more variables for OSA, including AHI, MAI, ESS, total sleep time, and sleep stage distribution. R2 values of 2.5%, 3.9%, and 2% were observed for metabolic variables and 1.8%, 2%, and 0% were observed for OSA in the first three OSA stages. However, in the last stage, OSA factors exhibited stronger predictive power in all three HRV indices, compared to glycolipid metabolic factors; R2 values of OSA in model 1 were 3.5%, 2.3% and 3.4% for MEANHR (Figure 3A), SDNN (Figure 3B) and LF/HF (Figure 3C), respectively, while the corresponding values of metabolic disorders were 1.4%, 1.5%, and 0%. The outcome of both models showed that metabolic factors were superior to OSA indices in prediction of HRV abnormalities in the first three stages of disease, suggesting a stronger impact of glycolipid metabolism on cardiac autonomic function in the early stages of OSA. In summary, the results demonstrated stage-specific associations and interstage variation between risk factors and HRV parameters.
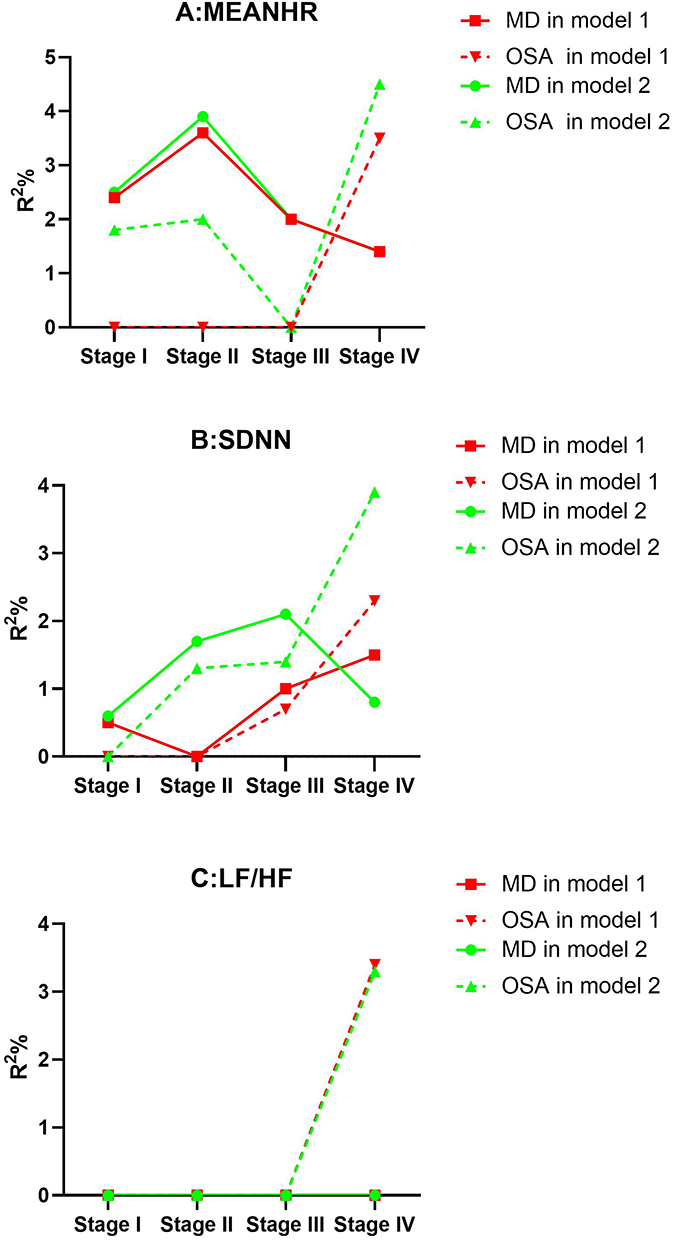 |
Figure 3 The comparison of predictive value of OSA and metabolic disorder (MD) for HRV abnormality. The predictive values of each variable were judged by comparing the proportion of the total variation that each of the variables could explain, that is, the R2% for the entire regression model. The total of R2% for the OSA variables and MD variables respectively was calculated by summing R2% value for each variable according to the classification. Model 1 was adjusted for age, sex, BMI, hypertension, alcohol and smoking status, the MD variables (WHR, fasting glucose, fasting insulin, blood serum lipid), the OSA variables (AHI, MAI). Model 2 was adjusted for all the variables in model 1 plus more sleep variables (ESS, total sleep time and sleep stage distribution). (A-C) are the HRV parameter value along with different OSA severity stages. |
Discussion
The present research was based on a large-scale clinical study analyzed using a combination of nonlinear analysis and segmental linear models. First, data-driven nonlinear models were used to identify nonlinear associations between HRV and OSA severity (indicated by AHI, ODI, and MAI). Next, metabolic factors and OSA variables were correlated with each of the three HRV indices in SMLR, demonstrating that glycolipid metabolic disorder factors may be involved in CAD variation among OSA stages.
Nonlinear Relationship of HRV Abnormality with OSA
In the natural development of OSA, the progression of CAD is affected by a variety of factors, including glycolipid metabolic disorders, which may influence OSA phenotypes in a nonlinear manner.14 However, previous studies largely ignored these complex associations; they used linear regression or log-transformed linear models to explore the effects of OSA on CAD. This practice proved inefficient for capturing the complex underlying features, as evidenced by the extensive discrepancies observed among studies. Here, we employed a data-driven strategy to better understand the dose–response relationship between CAD risk (defined according to HRV abnormality) and OSA severity. The nonlinear features of the relationship were demonstrated in several ways. First, fluctuations or small changes in HRV variables were observed in the early stages of OSA (Figure 1, AHI < 50). Second, the risk of CAD was strongly associated with both high MEANRR and high LF/HF (Figures 1 and 2); sharp elevations of CAD risk were only present in patients with stage IV OSA. Finally, changes in the relationships of the three HRV variables and OSA were split; enhancements of MEANRR and LF/HF in OSA occurred independently of SDNN values.
The mechanisms underlying the nonlinear results above are unclear. We hypothesized that fluctuations in early stages of OSA may be related to compensatory effects exerted by homeostatic mechanisms. When these compensatory mechanisms are ultimately overwhelmed by underlying disease conditions, they are no longer able to maintain normal cardiac autonomic function; this leads to rapid deterioration of HRV measurements.31 The dose–response relationship between OSA and various related-factors may be nonlinear, but exhibits various manifestations. For example, our previous work found a nonlinear relation between the risk of dyslipidemia and OSA severity; notably, a plateau was observed in the middle stage of disease development (AHI between 20 and 40).25 In the present study, we failed to identify any plateaus in the relationship between HRV and OSA in the middle range of AHI; instead, we observed a J-shaped curve with small fluctuations or small changes in the mild range of AHI. Other important factors underlying the nonlinear relationships described here may include the broad effects of intermittent hypoxia, sleep disturbance, and glycolipid metabolic disorders on HRV, as evidenced by the apparent stage-specific relationship; these may result in fluctuations or discordance in respective nonlinear dose–response curves.
SDNN is the primary HRV parameter used to quantify heart rate variations. Low SDNN values are associated with an elevated risk of CAD, as are higher values for both MEANHR and LF/HF.5,6 Our study showed that MAI reduced the risk of CAD in SDNN (Figure 2), suggesting that enhanced arousal may have a protective effect on the body by preventing excessive apnea effects during OSA. Our study suggested that MAI changes in stages III and IV were correlated with SDNN (Table 3), indicating that sleep deprivation significantly enhanced the protective effects of cardiac autonomic nerve function in response to OSA failure. Taken together, these various alterations—including the protective effect of arousal and adverse effect of chronic intermittent hypoxia in the context of OSA—could lead to disturbances and activity change in the autonomic nervous system.13,32 These complex changes may in turn drive the apparent nonlinear associations in CAD, causing further difficulty in tracking the etiology of CVD in patients with OSA.
Stage-Specific Relationship Between Glycolipid Metabolic Disorders and HRV
Previous clinical studies have shown that glycolipid metabolic abnormalities affect cardiac autonomic function.5,6 Chronic hyperglycemia and hyperlipidemia can directly exert deleterious effects on multiple organs including the autonomic system, resulting in progressive neuronal damage and cellular death (glucotoxicity and lipotoxicity).33 In this large-scale study, we analyzed the stage-specific relationship between OSA and HRV through multiple stages models and found that fasting glucose, insulin, lipid, and other glycolipid markers were all significantly associated with distinct CAD indicators at different stages of OSA. Another stage-specific feature was that glycolipid metabolic factors are superior to OSA indices for prediction of cardiac autonomic function according to OSA stage. Overall, these results suggest that the effects of metabolism on cardiac autonomic nerve function occur earlier than the effects of respiratory factors. Further studies are needed to identify the potential mechanism underlying these associations.
Clinical Implications
This study indicated that not only sleep disturbance and intermittent hypoxia but glycolipid metabolism was involved in the cardiac autonomic control in patients with OSA. Continuous positive airway pressure, the first-line treatment for OSA, was ineffective for reducing the occurrence of cardiovascular events; this is presumably because continuous positive airway pressure is only able to attenuate the pathological cascade response to hypoxia, whereas it does not affect changes induced by various glycolipid metabolic disorders.34,35 We found that compared to hypoxia and sleep deprivation, glycolipid metabolic disorders have a greater impact on HRV in early stages of OSA. Our results indicated that early interventions for glycolipid metabolic disorders in patients with OSA may be important for improvement of cardiac autonomic function and help prevent development of CVD. This study showed a nonlinear relationship between cardiac autonomic function and OSA, which helps to elucidate the complexity and stage-heterogeneity of cardiac autonomic function and its associations with different risk factors among disease stages for individualized treatment. AHI was an important indicator of OSA severity; however, OSA severity exhibited obvious heterogeneity among patients with severe OSA (AHI > 30). Notably, there remain no cut-off values that can be used to further classify severity in patients with severe OSA. The data-driven strategy employed in the current study may aid in developing an objective and unbiased multi-stage test for OSA (ie, AHI cut-off point for severe OSA = 55). Additional prospective studies are needed to further confirm this cut-off value and its effects across multiple disease stages.
Strengths and Weaknesses of the Study
Although this was a large-scale study that used data collected by laboratory-based polysomnography, the inclusion of patients with a wide range of AHI values required optimization using innovative analytical approaches; our approaches included multiple models, determination of dose–effect relationships, and adequate control of potential confounders. These approaches were necessary to explore the complex relationship between CAD and OSA and identify stage-specific risk factors for disease outcomes. However, due to the observational nature of this study, we could not obtain causal evidence to support these relationships. Second, despite adjustments for metabolic and sleep structure effects, other factors (eg, exercise habits or other lifestyle factors) were not considered. Third, the use of HRV as an indicator of electrical signals in our study only reflected the chronic effects of the disease on the cardiac autonomic nerve in patients with OSA. Cardiac autonomic function in sleeping patients or during acute respiratory events should be further studied.
Conclusions
The results presented here indicate that glycolipid metabolic disorders play a nonlinear, stage-specific role in CAD development. This heterogeneity in terms of risk factors for CAD among multiple stages suggests that an exploration of variations in glycolipid metabolic disorders among OSA stages could provide a solid foundation for individual treatments of OSA and its associated comorbidities.
Abbreviations
AHI, apnea-hypopnea index; BMI, body mass index; CAD, cardiac autonomic dysfunction; CVD, cardiovascular disease; CPAP, continuous positive airway pressure; DBP, diastolic blood pressure; ESS, excessive daytime sleepiness; FG, fasting glucose; HRV, heart rate variability; HC, hip circumference; HDL-C, high-density lipoprotein cholesterol; HOMA-IR, insulin resistance index calculated by the homeostasis model assessment; LDL-C, low-density lipoprotein cholesterol; Lp-a, lipoproteina; LSpO2, lowest oxygen saturation; LF/HF, ratio between low frequency and high frequency powers; Mets, metabolic syndrome; MAI, microarousal index; MEANHR, mean of heart rate; MLR, multivariate linear regression; ODI, oxygen desaturation index; OSA, obstructive sleep apnea; PSG, polysomnography; RCS, restricted cubic spline; SBP, systolic blood pressure; SDNN, standard deviation of all normal RR intervals; TC, total cholesterol; TG, triglycerides; WC, waist circumference, NC, neck circumference.
Acknowledgments
The authors thank Professor Lu-Yang Wang (Sick Kids Research Institute and Department of Physiology, University of Toronto) for constructive comments on our manuscript.
Author Contributions
Xiaolong Zhao and Jian Guan had full access to all data in the study and took responsibility for the integrity of the data and the accuracy of the data. Study design: Jian Wang, Hongliang Yi, Jian Guan, Shankai Yin; Data collection: Chuan Dong, Huajun Xu, Jiangang Fan, Gang He, Jianyin Zou, Lili Meng, Huaming Zhu, Kaiming Su; Statistical analysis: Xiaolong Zhao, Mingpo Yang, Huajun Xu; Manuscript draft: Jian Guan, Jian Wang and Xiaolong Zhao. All authors made substantial contributions to conception and design, acquisition of data, or analysis and interpretation of data; took part in drafting the article or revising it critically for important intellectual content; agreed to submit to the current journal; gave final approval of the version to be published; and agree to be accountable for all aspects of the work.
Funding
This research was supported by National Natural Science Foundation of China (81700896, 81770987, 81701306, 81770988); Shanghai Municipal Commission of Science and Technology (Grant No.18DZ2260200); Innovation Program of Shanghai Municipal Education Commission (2017-01-07-00-02-E00047); multi-center clinical research project from school of medicine, Shanghai Jiao Tong University (DLY201502); the Open Research Project of Shanghai Key Laboratory of Sleep Disordered Breathing (SHKSDB-KF-20-03); Youth scientific research project of Sichuan provincial medical association (Q19018); Youth Fund of Sichuan Provincial People’s Hospital (2021QN03); Cadre health research project (2021-210).
Disclosure
The authors declare no conflicts of interest in this work.
References
1. Young T, Palta M, Dempsey J, Skatrud J, Weber S, Badr S. The occurrence of sleep-disordered breathing among middle-aged adults. N Engl J Med. 1993;328(17):1230–1235. doi:10.1056/NEJM199304293281704
2. Shahar E, Whitney CW, Redline S, et al. Sleep-disordered breathing and cardiovascular disease: cross-sectional results of the Sleep Heart Health Study. Am J Respir Crit Care Med. 2001;163(1):19–25. doi:10.1164/ajrccm.163.1.2001008
3. Gottlieb DJ, Yenokyan G, Newman AB, et al. Prospective study of obstructive sleep apnea and incident coronary heart disease and heart failure: the sleep heart health study. Circulation. 2010;122(4):352–360. doi:10.1161/CIRCULATIONAHA.109.901801
4. Hla KM, Young T, Hagen EW, et al. Coronary heart disease incidence in sleep disordered breathing: the Wisconsin Sleep Cohort Study. Sleep. 2015;38(5):677–684. doi:10.5665/sleep.4654
5. Pop-Busui R, Evans GW, Gerstein HC, et al. Effects of cardiac autonomic dysfunction on mortality risk in the Action to Control Cardiovascular Risk in Diabetes (ACCORD) trial. Diabetes Care. 2010;33(7):1578–1584. doi:10.2337/dc10-0125
6. Dekker JM, Crow RS, Folsom AR, et al. Low heart rate variability in a 2-minute rhythm strip predicts risk of coronary heart disease and mortality from several causes: the ARIC Study. Atherosclerosis risk in communities. Circulation. 2000;102(11):1239–1244. doi:10.1161/01.CIR.102.11.1239
7. Sassi R, Cerutti S, Lombardi F, et al. Advances in heart rate variability signal analysis: joint position statement by the e-Cardiology ESC Working Group and the European Heart Rhythm Association co-endorsed by the Asia Pacific Heart Rhythm Society. Europace. 2015;17(9):1341–1353. doi:10.1093/europace/euv015
8. Malik M, Bigger JT, Camm AJ. Heart rate variability. Standards of measurement, physiological interpretation, and clinical use. Task Force of the European Society of Cardiology and the North American Society of Pacing and Electrophysiology. Eur Heart J. 1996;17(3):354–381. doi:10.1093/oxfordjournals.eurheartj.a014868
9. Tobaldini E, Nobili L, Strada S, Casali KR, Braghiroli A, Montano N. Heart rate variability in normal and pathological sleep. Front Physiol. 2013;4:294. doi:10.3389/fphys.2013.00294
10. Stein PK, Pu Y. Heart rate variability, sleep and sleep disorders. Sleep Med Rev. 2012;16(1):47–66. doi:10.1016/j.smrv.2011.02.005
11. Jean-Louis G, Zizi F, Clark LT, Brown CD, McFarlane SI. Obstructive sleep apnea and cardiovascular disease: role of the metabolic syndrome and its components. J Clin Sleep Med. 2008;4(3):261–272. doi:10.5664/jcsm.27191
12. Valensi P, Paries J, Attali JR; French Group for R, Study of Diabetic N. Cardiac autonomic neuropathy in diabetic patients: influence of diabetes duration, obesity, and microangiopathic complications--the French multicenter study. Metabolism. 2003;52(7):815–820. doi:10.1016/S0026-0495(03)00095-7
13. Dimitropoulos G, Tahrani AA, Stevens MJ. Cardiac autonomic neuropathy in patients with diabetes mellitus. World J Diabetes. 2014;5(1):17–39. doi:10.4239/wjd.v5.i1.17
14. Gaines J, Vgontzas AN, Fernandez-Mendoza J, Bixler EO. Obstructive sleep apnea and the metabolic syndrome: the road to clinically-meaningful phenotyping, improved prognosis, and personalized treatment. Sleep Med Rev. 2018;42:211–219. doi:10.1016/j.smrv.2018.08.009
15. Aeschbacher S, Bossard M, Schoen T, et al. Heart rate variability and sleep-related breathing disorders in the General Population. Am J Cardiol. 2016;118(6):912–917. doi:10.1016/j.amjcard.2016.06.032
16. Karasulu L, Dalar L, Sokucu S, Altin S. Heart rate variability analysis of single-channel electrocardiogram can help to differentiate high-risk patients with obstructive sleep apnea syndrome - a study on diagnostic accuracy. Anadolu Kardiyol Derg. 2012;12(4):331–338. doi:10.5152/akd.2012.097
17. Kim YS, Kim SY, Park DY, Wu W, Hwang G-S, Kim HJ. Clinical implication of heart rate variability in obstructive sleep apnea syndrome patients. J Craniofac Surg. 2015;26(5):1592–1595. doi:10.1097/SCS.0000000000001782
18. Gong X, Huang L, Liu X, et al. Correlation analysis between polysomnography diagnostic indices and heart rate variability parameters among patients with obstructive sleep apnea hypopnea syndrome. PLoS One. 2016;11(6):e0156628. doi:10.1371/journal.pone.0156628
19. Oh SM, Choi SH, Kim HJ, Park KS, Lee YJ. The association between obstructive sleep apnea during REM sleep and autonomic dysfunction as measured by heart rate variability. Sleep Breathing. 2019;23(3):865–871. doi:10.1007/s11325-018-01779-y
20. Peltier AC, Bagai K, Artibee K, et al. Effect of mild hyperglycemia on autonomic function in obstructive sleep apnea. Clin Auton Res. 2012;22(1):1–8. doi:10.1007/s10286-011-0131-9
21. Amra B, Behjati M, Penzel T, Fietze I, Schoebel C, Sarrafzadegan N. Nocturnal heart rate variation in diabetic and non-diabetic patients with sleep apnea syndrome. Sleep Med. 2017;29(Complete):57. doi:10.1016/j.sleep.2016.11.003
22. Peltier AC, Consens FB, Sheikh K, Wang L, Song Y, Russell JW. Autonomic dysfunction in obstructive sleep apnea is associated with impaired glucose regulation. Sleep Med. 2007;8(2):149–155. doi:10.1016/j.sleep.2006.06.010
23. Aune D, Sen A, Prasad M, et al. BMI and all cause mortality: systematic review and non-linear dose-response meta-analysis of 230 cohort studies with 3.74 million deaths among 30.3 million participants. BMJ. 2016;353:i2156. doi:10.1136/bmj.i2156
24. Yadegari H, Bozorgmanesh M, Hadaegh F, Azizi F. Non-linear contribution of glucose measures to cardiovascular diseases and mortality: reclassifying the Framingham’s risk categories: a decade follow-up from the Tehran lipid and glucose study. Int J Cardiol. 2013;167(4):1486–1494. doi:10.1016/j.ijcard.2012.04.053
25. Guan J, Yi H, Zou J, et al. Distinct severity stages of obstructive sleep apnoea are correlated with unique dyslipidaemia: large-scale observational study. Thorax. 2016;71(4):347–355. doi:10.1136/thoraxjnl-2015-207403
26. Berry RB, Budhiraja R, Gottlieb DJ, et al. Rules for scoring respiratory events in sleep: update of the 2007 AASM Manual for the Scoring of Sleep and Associated Events. Deliberations of the Sleep Apnea Definitions Task Force of the American Academy of Sleep Medicine. J Clin Sleep Med. 2012;8(5):597–619. doi:10.5664/jcsm.2172
27. Johns MW. A new method for measuring daytime sleepiness: the Epworth sleepiness scale. Sleep. 1991;14(6):540. doi:10.1093/sleep/14.6.540
28. Sasse EA. Determination of reference intervals in the clinical laboratory using the proposed guideline National Committee for Clinical Laboratory Standards C28-P. Arch Pathol Lab Med. 1992;116(7):710–713.
29. Expert Panel on Detection, Evaluation, and Treatment of High Blood Cholesterol in Adults. Executive summary of the third report of the National Cholesterol Education Program (NCEP) expert panel on detection, evaluation, and treatment of high blood cholesterol in adults (Adult Treatment Panel III). JAMA. 2001;285:2486–2497. doi:10.1001/jama.285.19.2486
30. Du T, Yuan G, Zhang M, Zhou X, Sun X, Yu X. Clinical usefulness of lipid ratios, visceral adiposity indicators, and the triglycerides and glucose index as risk markers of insulin resistance. Cardiovasc Diabetol. 2014;13:146. doi:10.1186/s12933-014-0146-3
31. Dematteis M, Godin-Ribuot D, Arnaud C, et al. Cardiovascular consequences of sleep-disordered breathing: contribution of animal models to understanding the human disease. ILAR J. 2009;50(3):262–281. doi:10.1093/ilar.50.3.262
32. Amatoury J, Azarbarzin A, Younes M, Jordan AS, Wellman A, Eckert DJ. Arousal intensity is a distinct pathophysiological trait in obstructive sleep apnea. Sleep. 2016;39(12):2091–2100. doi:10.5665/sleep.6304
33. Del Prato S. Role of glucotoxicity and lipotoxicity in the pathophysiology of Type 2 diabetes mellitus and emerging treatment strategies. Diabet Med. 2009;26(12):1185–1192. doi:10.1111/j.1464-5491.2009.02847.x
34. Drager LF, Brunoni AR, Jenner R, Lorenzi-Filho G, Bensenor IM, Lotufo PA. Effects of CPAP on body weight in patients with obstructive sleep apnoea: a meta-analysis of randomised trials. Thorax. 2015;70(3):258–264. doi:10.1136/thoraxjnl-2014-205361
35. Labarca G, Reyes T, Jorquera J, Dreyse J, Drake L. CPAP in patients with obstructive sleep apnea and type 2 diabetes mellitus: systematic review and meta-analysis. Clin Respir J. 2018;12(8):2361–2368. doi:10.1111/crj.12915
 © 2021 The Author(s). This work is published and licensed by Dove Medical Press Limited. The full terms of this license are available at https://www.dovepress.com/terms.php and incorporate the Creative Commons Attribution - Non Commercial (unported, v3.0) License.
By accessing the work you hereby accept the Terms. Non-commercial uses of the work are permitted without any further permission from Dove Medical Press Limited, provided the work is properly attributed. For permission for commercial use of this work, please see paragraphs 4.2 and 5 of our Terms.
© 2021 The Author(s). This work is published and licensed by Dove Medical Press Limited. The full terms of this license are available at https://www.dovepress.com/terms.php and incorporate the Creative Commons Attribution - Non Commercial (unported, v3.0) License.
By accessing the work you hereby accept the Terms. Non-commercial uses of the work are permitted without any further permission from Dove Medical Press Limited, provided the work is properly attributed. For permission for commercial use of this work, please see paragraphs 4.2 and 5 of our Terms.