")
Back to Journals » Journal of Multidisciplinary Healthcare » Volume 15
The Impact of Data Management on the Achievable Dose and Efficiency of Computed Tomography During the COVID-19 Era: A Facility-Based Ambispective Study
Authors Al-Sharydah AM , Hegazi TM, Al-Othman AY, Al-Aftan MS, Al-Shehri SS
Received 28 July 2022
Accepted for publication 6 October 2022
Published 18 October 2022 Volume 2022:15 Pages 2385—2397
DOI https://doi.org/10.2147/JMDH.S383957
Checked for plagiarism Yes
Review by Single anonymous peer review
Peer reviewer comments 5
Editor who approved publication: Dr Scott Fraser
Abdulaziz Mohammad Al-Sharydah, Tarek Mohammed Hegazi, Abdullah Yousef Al-Othman, Mohammad Saad Al-Aftan, Sultan Salman Al-Shehri
Diagnostic and Interventional Radiology Department, Imam Abdulrahman Bin Faisal University, King Fahd Hospital of the University, Al-Khobar City, Eastern Province, Saudi Arabia
Correspondence: Tarek Mohammed Hegazi, Diagnostic and Interventional Radiology Department, Imam Abdulrahman Bin Faisal University, King Fahd Hospital of the University, Al-Khobar City, Eastern Province, Saudi Arabia, Tel +966138966877 (EXT: 2007), Email [email protected]
Purpose: This study primarily aimed to evaluate the effectiveness of computational data management and analytical software for establishing departmental diagnostic reference levels (DRLs) for computed tomography (CT) scanning in clinical settings, and monitor achievable doses (ADs) for CT imaging, particularly during the coronavirus disease 2019 (COVID-19) era. Secondarily, it aimed to correlate these standards with national and international benchmarks.
Patients and Methods: This ambidirectional cohort study enrolled 4668 patients (6419 CT-based examinations) who visited King Fahd Hospital of the University from May 25, 2021, to November 4, 2021. Participants’ demographic data were acquired from their electronic medical charts, in addition to all corresponding CT-dose determinant parameters. The study was divided into two phases (pre- and post-data management) based on the implementation of digital data management software.
Results: In both phases of the study, the size-specific dose estimate (SSDE) was the most significant confounder of dose determination compared to the dose-length product (DLP) and computed tomography dose index (CTDI) (P = 0.003). The head was the most frequently imaged body region (pre-implementation, 1051 examinations [35.1%]; post-implementation, 1071 examinations [31.3%]; P = 0.001), followed by the abdominal region (pre-implementation, 616 examinations [20.6%]; post-implementation, 256 examinations [7.48%]; P = 0.001). Based on the SSDE, DLP, and volume CTDI, the average per-section radiation exposure among organ-based scanning type was highest for the lumbar spine during the pre- and post-implementation periods.
Conclusion: Data management software enabled the establishment of DRLs and reduction of ADs in CT examinations, which consequently improved key performance indicators, despite the ergonomic complexities of COVID-19. Institutions are encouraged to apply DRLs and ADs via automatic systems that monitor patient dose indices to evaluate aggregate results.
Keywords: radiation exposure, protocol streamlining, diagnostic reference levels, cross-sectional imaging, radiation protection
Plain Language Summary
This comparative ambidirectional study aimed to establish the diagnostic reference levels (DRLs) and achievable doses (ADs) for adult and pediatric patients who underwent computed tomography (CT) imaging at the radiology department of King Fahd Hospital of the University. Various CT studies with Siemen’s teamplay data management and analytical software were utilized to develop practical-based DRLs of radiation through measured dose parameters and streamline protocols. These references were correlated with national and international benchmarks, besides dose indicators of imaging attributed to COVID-19 ergonomics. Employing data management software enabled the establishment of DRLs and the reduction of ADs. Embracing the use of DRLs and ADs via automatic systems would facilitate monitoring radiation doses and achieve dose reduction.
Introduction
Radiation dose optimization is a key topic for health-care providers.1 Approaches to radiation dose reduction include improvements in imaging protocols, such as the elimination of nonessential acquisitions, enhancement of hardware performance, and software development.1 Recent innovative reconstruction algorithms, such as iterative reconstruction in computed tomography (CT) imaging, enable a reduction in radiographic noise while enhancing or maintaining image quality with the use of reduced radiation dosage compared to filtered back projection reconstruction.1 Nevertheless, a principal drawback of the application of iterative reconstruction in medical CT imaging is the need for extensive computational resources.1
However, extremely low doses may also be a concern since they cause a significant reduction in image quality.2 Diagnostic reference levels (DRLs) and achievable doses (ADs) are utilized in measuring the radiation dosage delivered to the patient.2 The purpose of DRLs and ADs is to provide benchmarks for comparison, rather than to define maximum or minimum dose limits.2 The implementation of DRLs and ADs is most effective if a facility is equipped with systems to automatically monitor patient dose indices and hence facilitate the evaluation of aggregate results.3
The volume computed tomography dose index (CTDIvol) is a quality assurance measurement for comparison of radiation dosages utilized in different protocols, as well as scanner outputs from various manufacturers.3 Recently, the American Association of Physicists in Medicine (AAPM) devised a novel CT specification, the size-specific dose estimate (SSDE), to more accurately estimate the dosage at the center of the scanned area in each patient with consideration of the patient’s size.3
The recent advent of teamplay™ (Siemens Healthineers, Germany), a performance management web-based portal resource that permits the generation of a range of key performance indicators (KPIs) for use in radiology, has been instrumental in overcoming this limitation. Internal DRLs can be set in the system and compared to national reference levels.4 The system also enables comparisons against a range of global criteria based on information acquired from other teamplay™ users.4,5
Therefore, this study aimed to evaluate the use of computational data management resources and analytical software for the implementation of departmental DRLs for CT imaging in clinical settings. Secondarily, we aimed to describe the ADs and assess efficiency of CT performance based on the number of performed examinations, particularly during the coronavirus disease 2019 (COVID-19) era, and to streamline protocols for developing practical-based DRLs of radiation based on measured dose parameters in order to correlate these reference values with national and international benchmarks.
Materials and Methods
Study Design, Setting, and Patients
- This study was a comparative ambispective (ie, ambidirectional) cohort study of retrospectively retrieved data and prospectively collected data.
- The study was conducted over a period of 165 days (5.5 months) during the COVID-19 pandemic.
- The study was conducted at the radiology department of King Fahd Hospital of the University (KFHU), Khobar city, eastern province, Saudi Arabia. The hospital is affiliated to Imam Abdulrahman Bin Faisal University is one of the largest tertiary academic hospitals in the Eastern Province of Saudi Arabia. The radiology department has been operational since 1981.
- On 14 August 2021, our department implemented multiple rectifying strategies controlled with the aid of Cloud-based software teamplay™ (Siemens Healthineers, Germany) data management software.6 This software receiver, which is a Digital Imaging and Communications in Medicine (DICOM) node, accessed the modalities to retrieve the data. Irrespective of the manufacturer, all the imaging devices at our institution (including magnetic resonance imaging, CT, single-photon emission computed tomography, radiography and mammography, and interventional radiology) were connected to teamplayTM and were monitored remotely for smooth reporting. This setting also provided us with deep insights that were used to generate other quality improvement projects, although our results on this aspect of CT imaging are beyond the scope of the current study.4,6
- The implemented rectifying measures included (i) quality control of obtained exams with their radiation exposure controlled by the installed data management software (ie, teamplay™) based on references from “The Saudi Food and Drug Authority (SFDA) recently established the National Diagnostic Reference Level”7 measured by CTDI and DLP, (ii) streamlining protocols, which were measured by the departmental protocols count, and (iii) establishing benchmarks of radiation dosage for each scanned body region.
- Hence, the patients were divided into two groups to study the impact of rectifying measures on ADs: A) Pre-implementation phase; those imaged on or before August 14, 2021 (May 25 to August 14, 2021 [81 days]) and B) Post-implementation phase; those imaged after August 14, 2021 (August 15 to November 4, 2021 [81 days]).
- Since retrieving data by data management software had been conducted after radiation exposure with CT imaging, comparative ambispective/ambidirectional design with a fixed interval (ie, 81 days before and 81 days after implementation of rectifying measures) possesses a reasonable scientific merit for studying the impact of data management software on achievable dose.8,9
Eligibility Criteria
- We enrolled all the patients who underwent CT examinations at the radiology department of KFHU, which were performed using commercially available CT machines from Siemens™, Germany (SOMATOM Definition AS 64-slice and SOMATOM Definition flash dual source 128-slice) during the study period.
- Patients of all nationalities, sexes, and age groups (children and adults) were included.
- Initially, 4939 patients were included.
- We excluded examinations for which the corresponding demographic data, patient measurements, and/or CT-related dose estimation parameters were missing (n = 271 patients). The sample size was determined by nonprobability simple sampling technique (1 – β= 0.80) using G*Power version 3.1.9.7. software (RRID:SCR_013726, available at: http://www.gpower.hhu.de/) to ensure sufficient statistical power.
- A final total of 4668 patients (6419 CT-based examinations) were enrolled.
Data Collection
Patients’ charts were retrieved from the electronic medical record archival system at KFHU. Thereafter, the radiology department’s database was reviewed using the Picture Archiving and Communication System (PACS) and data retrieved automatically (ie, readily available and computed with the aid of teamplay™ data management software), including demographic characteristics (age, height, body mass index, and sex), CT protocol, body region scanned, modality type, calibration, dose-related events, operator phantom size, dose-length product (DLP; mGy.cm), effective CTDI (mGy), size-specific dose estimates (SSDE; mGy), water-equivalent diameter (WED; %), source-to-image distance (cm), source-to-object distance (cm), contrast/bolus agent, acquisition time (s), acquisition type, exposure voltage, exposure current, exposure time (s), and pitch factor. Thereafter, these data were analyzed to assess the impact on ADs in order to establish our departmental DRLs.
Statistical Analysis
Statistical analysis was performed using R v 3.6.3 Counts and Minitab version 17.0. Categorical variables (ie, sex, type of protocol, body region) are expressed using percentages, while the continuous variables (ie, DLP, CTDIvol, SSDE) are expressed using mean ± standard deviation. Selective outcome reporting was analyzed by reporting mean dichotomous and continuous data, respectively. Additionally, counterfactual comparison used to assess outcomes with previously reported DRLs. Continuous variables were compared using an unpaired t-test, while categorical variables were compared using a Chi-squared test of independence. The unpaired t-test was used to examine data normality when the data is abnormally distributed. Statistical tests were conducted at a significance level of 0.05.
Ethical Consideration
This study was performed in accordance with the Declaration of Helsinki of 1975 (revised in 1983). The Institutional Review Board of Imam Abdulrahman Bin Faisal University granted the ethical approval for this study to be conducted at KFHU (IRB-2022-01-206) after considering the descriptive and ambispective nature of the study. Informed consent was obtained from each patient prior to imaging. Collected data were anonymized, analyzed, and reported solely in aggregate form. No identifiable participant information (such as patients’ images, faces, or names) was disclosed in the study.
Results
A total of 4668 patients underwent 6419 CT-based examinations during the study period (5.5 months). Of these patients, 2207 were recruited during the pre-implementation phase and 2461 during the post-implementation of rectifying measures (Table 1).
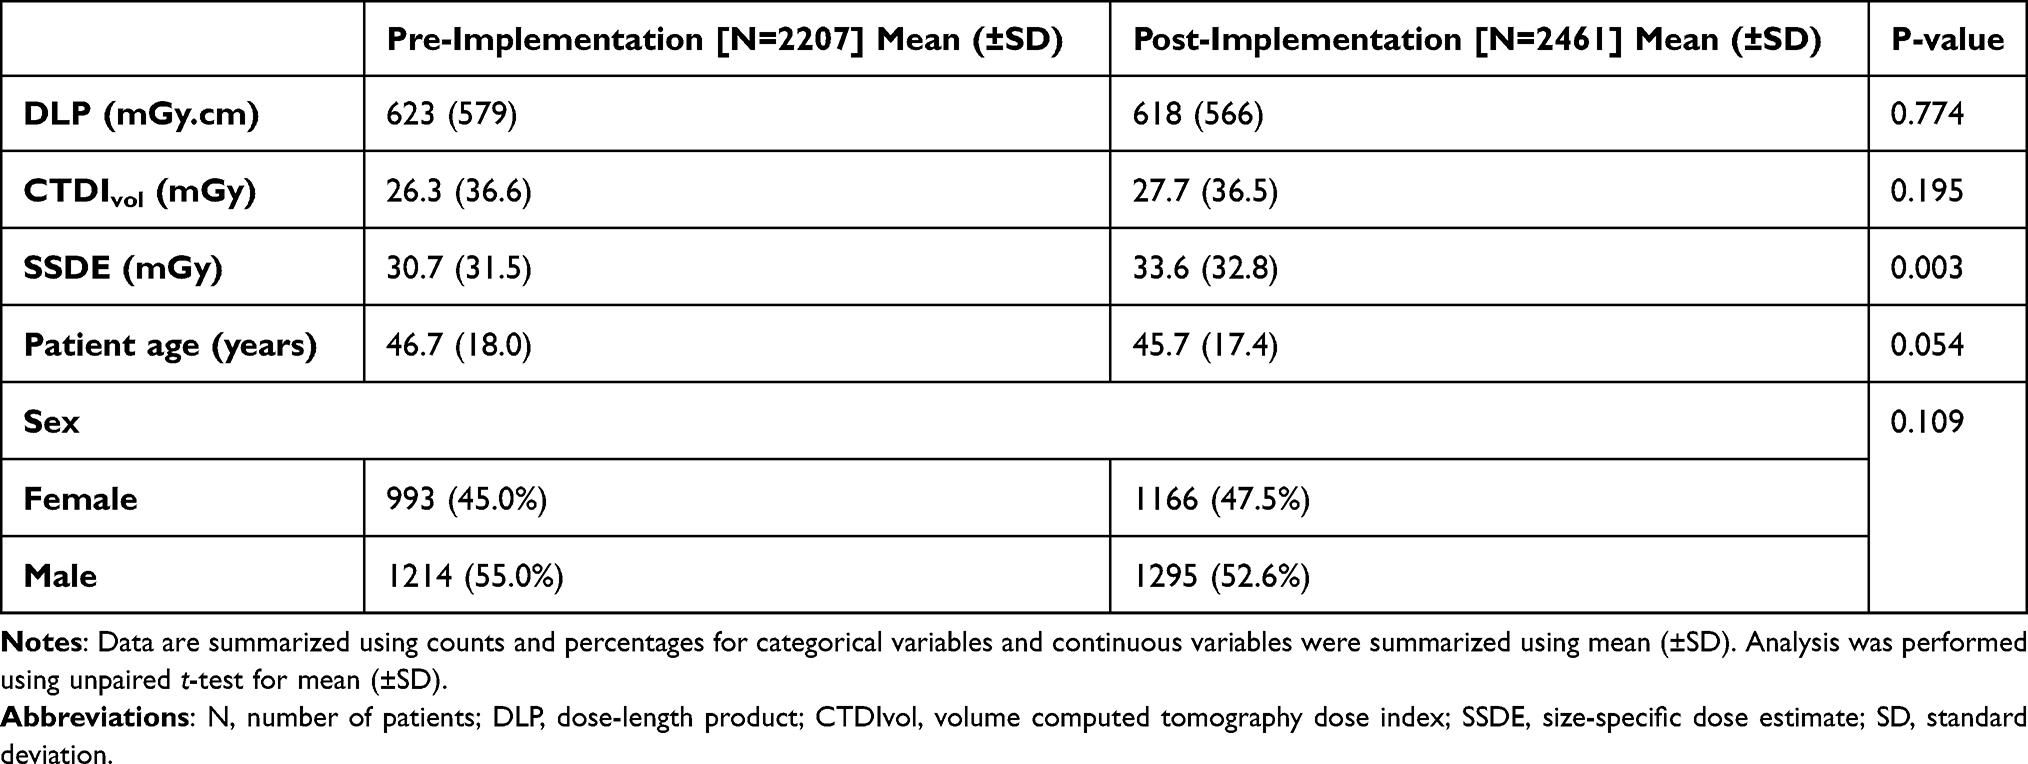 |
Table 1 Descriptive Statistics of the Study Participants |
The SSDE (mGy) was identified as a significant confounder of dose determination (P = 0.003) (Table 1, Figure 1) during both phases. The head was the most frequently imaged body region during the study period (pre-implementation, 1051 examinations [35.1%]; post-implementation, 1071 examinations [31.3%]; P = 0.001), followed by the abdominal region (pre-implementation, 616 examinations [20.6%]; post-implementation, 256 examinations [7.48%]; P < 0.001) (Table 2).
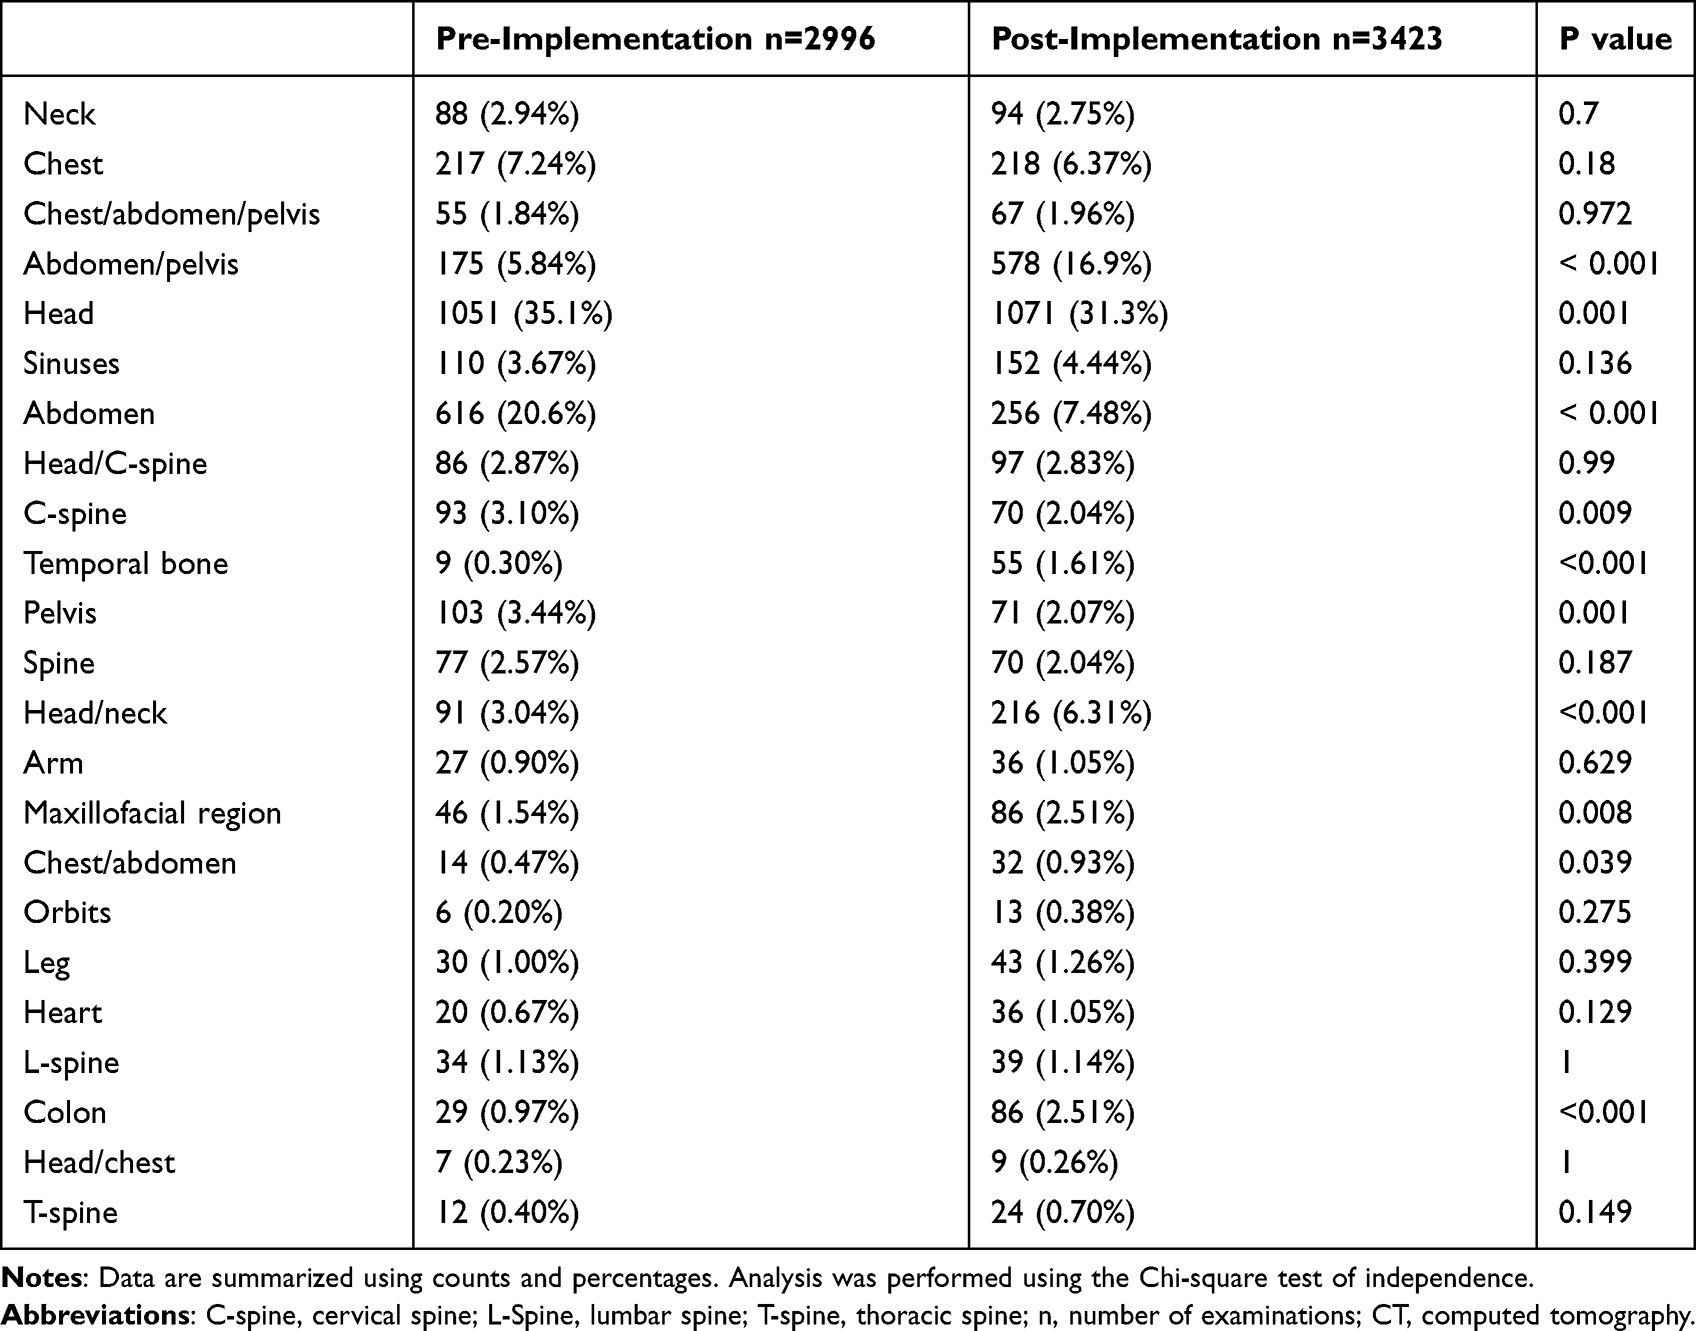 |
Table 2 Number of CT Examinations Before and After Implementing of Data Management Software (Stratified by Body Region) |
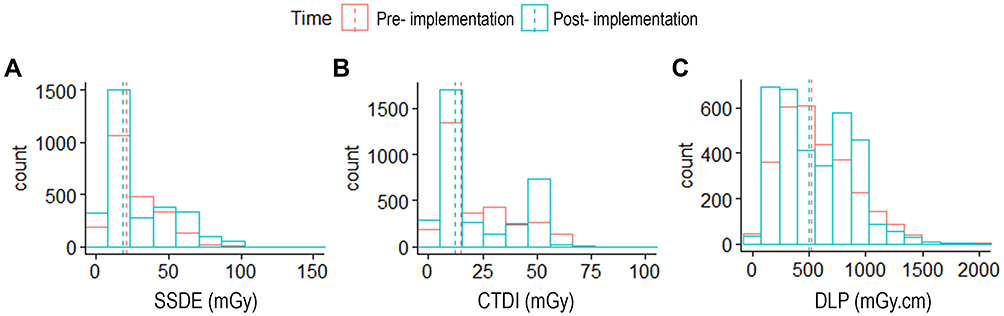 |
Figure 1 Comparison of overall computed tomographic exposure parameters between pre- and post-The introduction of rectifying measures. SSDE (A), CTDI (B), and DLP (C). Lines represent the average. |
Based on the SSDE, DLP, and CTDIvol, the lumbar spine region had the highest average per-section radiation exposure among various scanned organs during the pre- and post-implementation of rectifying measures (Figure 2, Table 3). However, the reduction in these exposure indices (ie, SSDE, DLP, and CTDIvol) in the post-implementation phase was not statistically significant (P > 0.05; for SSDE, DLP, and CTDIvol).
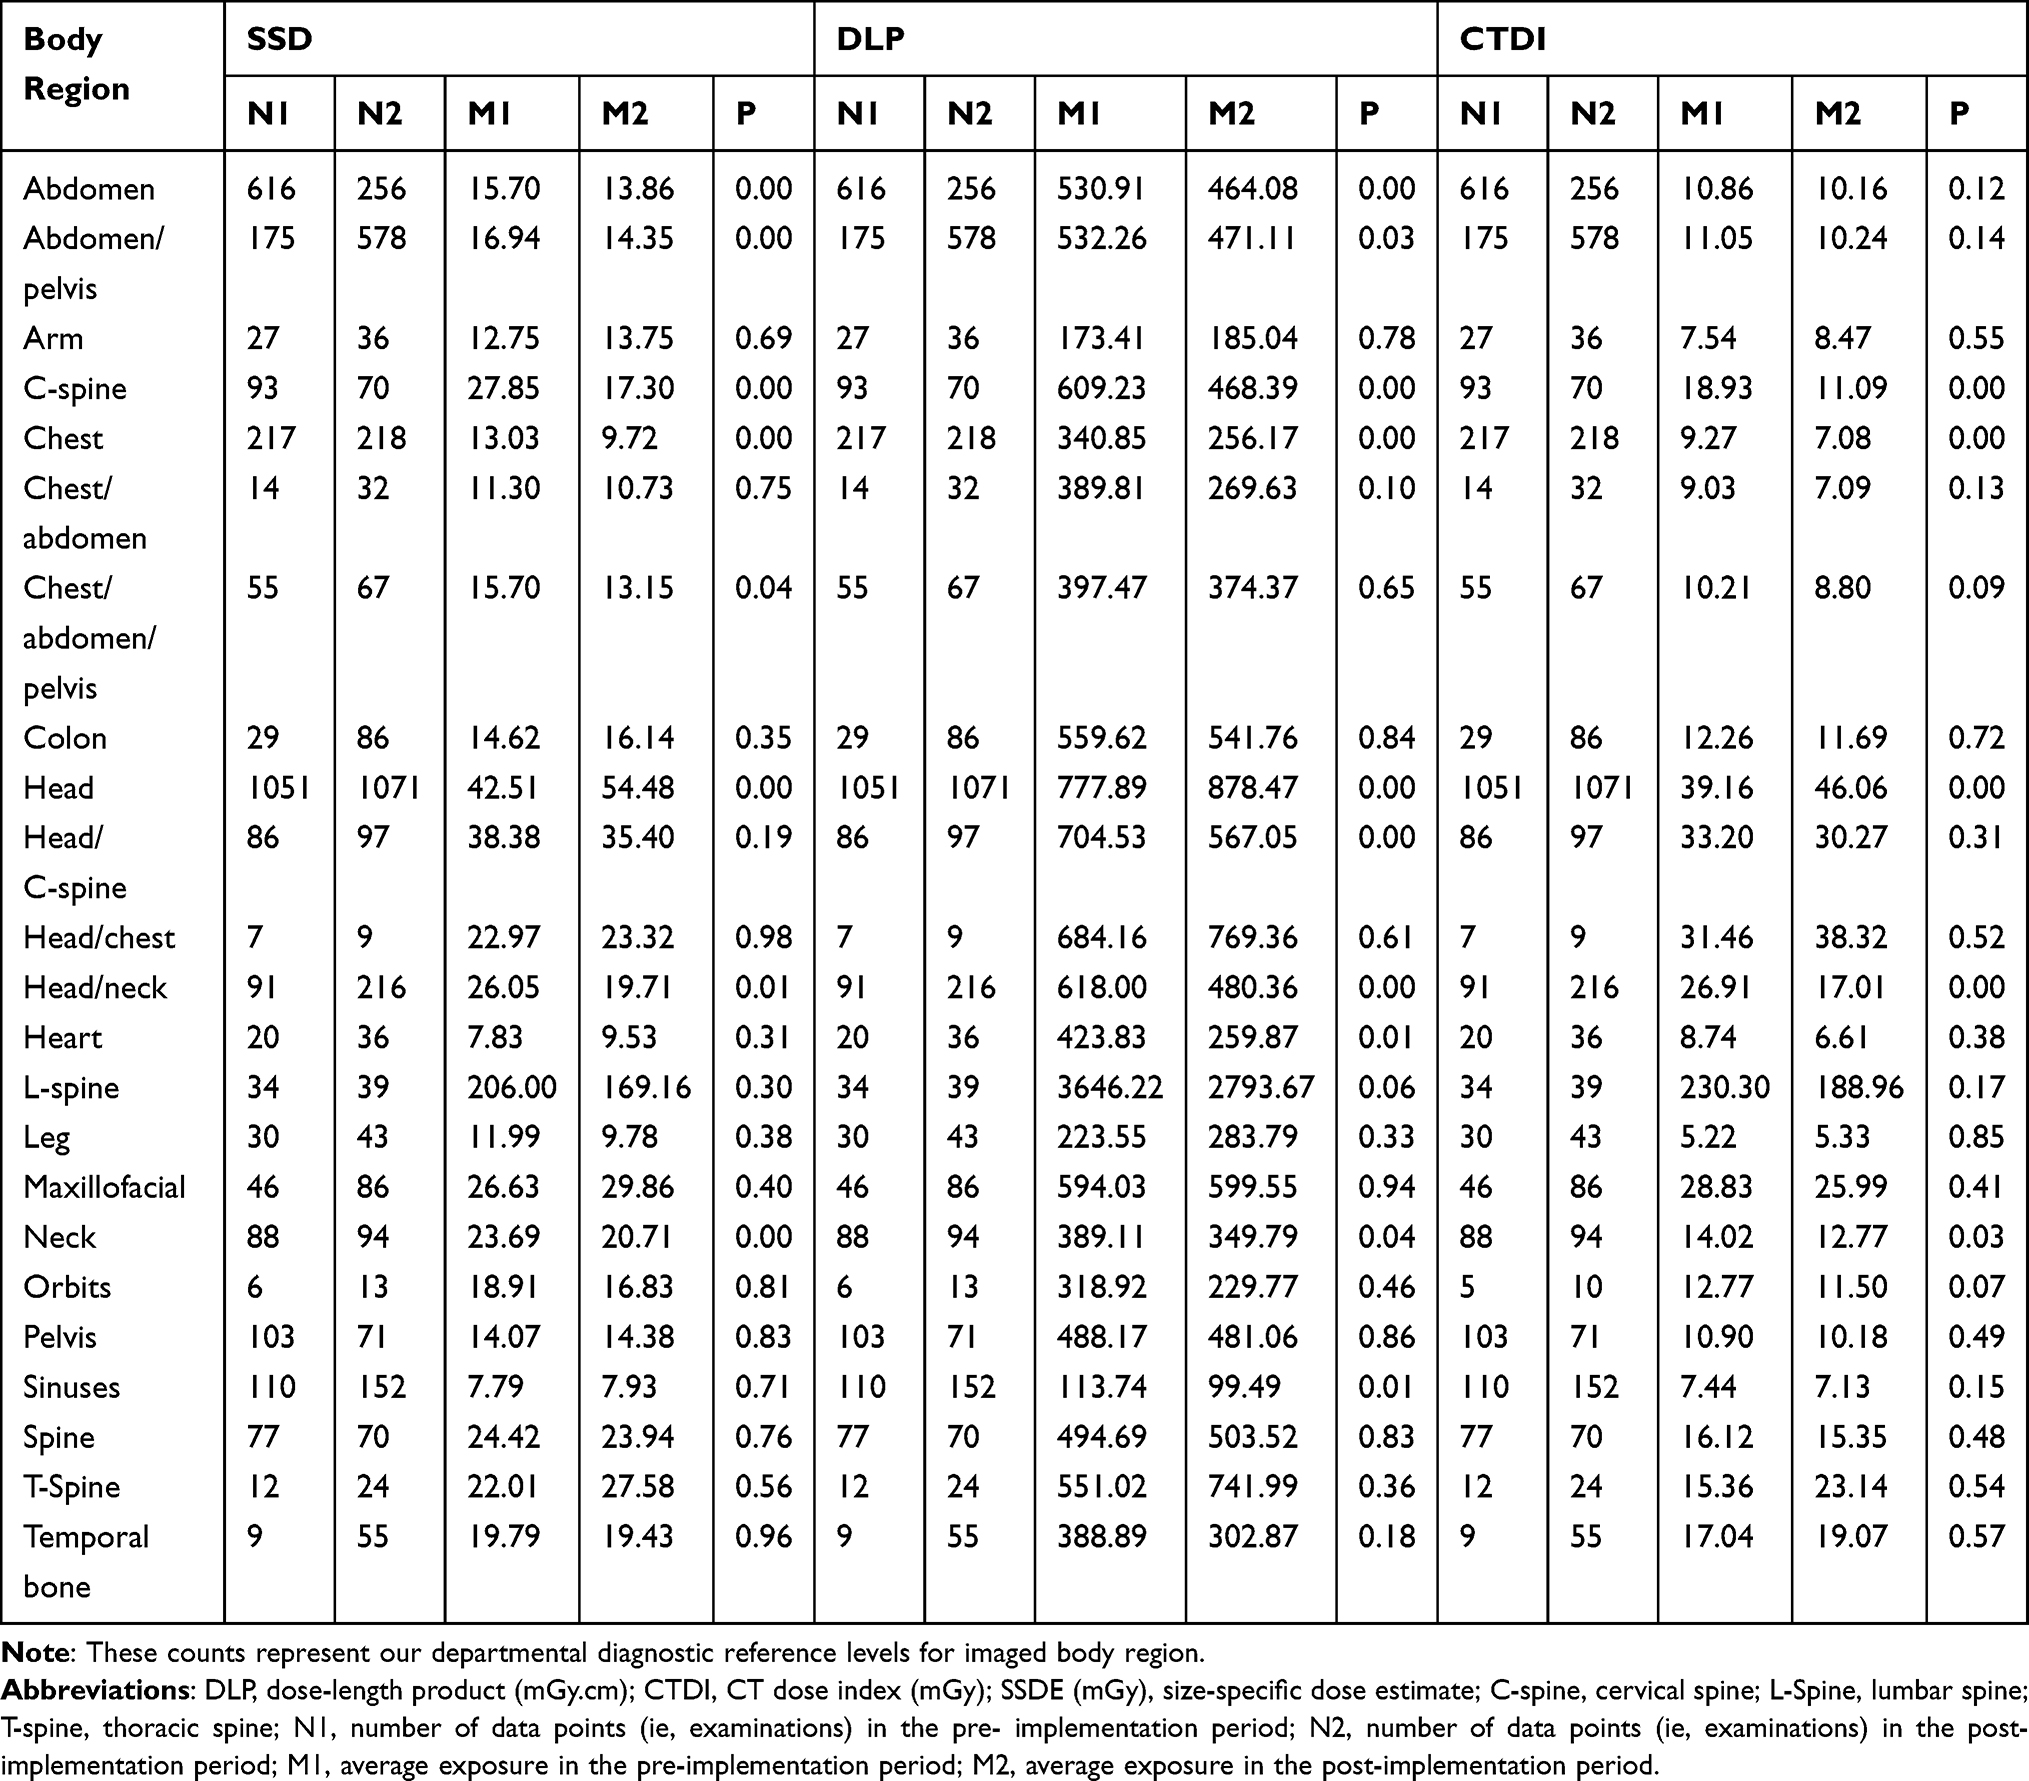 |
Table 3 Radiation Exposure Indices by Imaged Body Region |
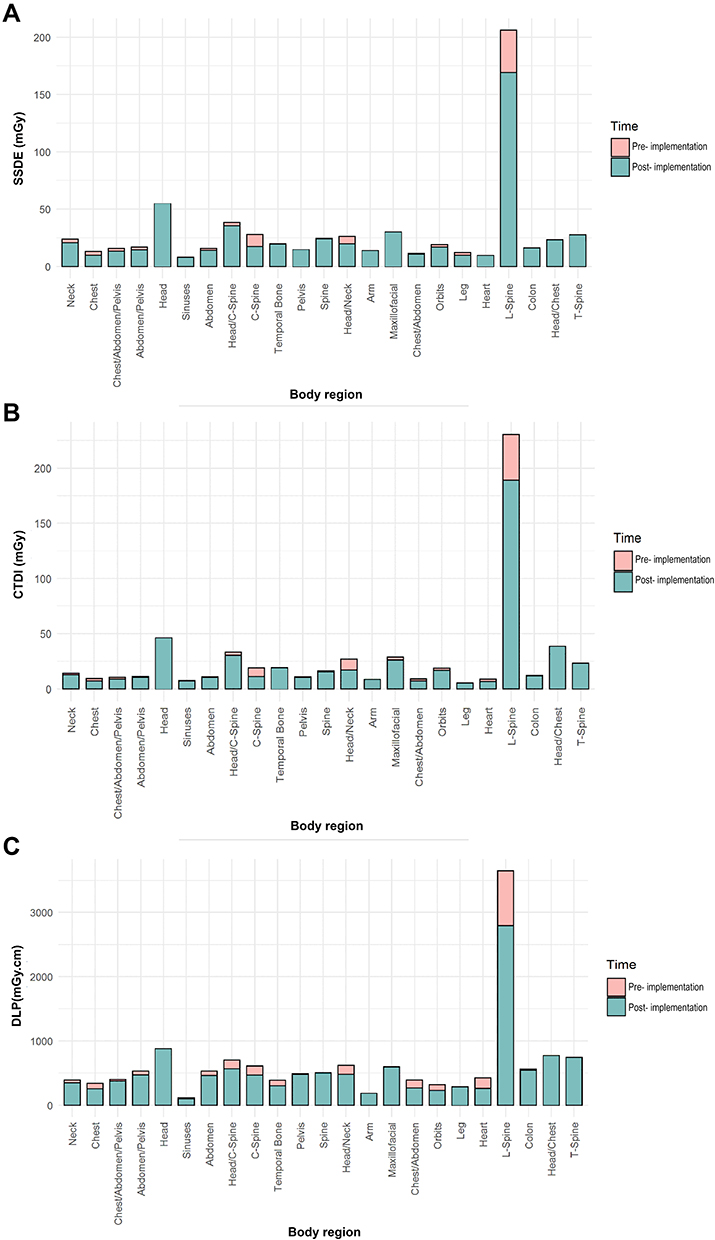 |
Figure 2 CT indices pre- and post-implementation of corrective measures based on imaged body region. SSDE (A), CTDI (B), and DLP (C). Overlapping bars from both time points indicate the difference in exposure between the two time points. Abbreviations: SSDE, size-specific dose estimate; CTDI, computed tomography dose index; DLP, dose-length product; CT, computed tomography. |
In contrast, the head had the second highest average per-section radiation exposure in the pre- and post-implementation for radiation exposure, and a statistically significant reduction in exposure indices (ie, SSDE, DLP, and CTDIvol) was observed in the post-implementation phase (P = 0.001; for SSDE, DLP, and CTDIvol)(Table 3; summary of established departmental DRLs).
In total, 85 CT scan protocols were included in the study, including 49 from the pre-implementation phase, which were streamlined to 36 in the post-implementation phase, denoting a 26.5% reduction in the total number of protocols during the latter phase (Figure 3). The implementation of rectifying measures facilitated comparison of our institutional benchmarks with national (ie, within Saudi Arabia7,10) and international (ie, Ireland,11 UK,12 USA,3 and other European countries3,13) benchmarks to establish the ADs (Figure 4). Our departmental registry of DRLs and ADs to perform CT examination (ie, DLP) ranked the lowest in both phases (pre- and post-implementation) for head, neck, CT pulmonary angiography (CTPA), and chest abdominopelvic (CAP) CT examinations. In contrast to the aforementioned exams, the DLP was the highest for CT of the abdomen and pelvis (Figure 4).
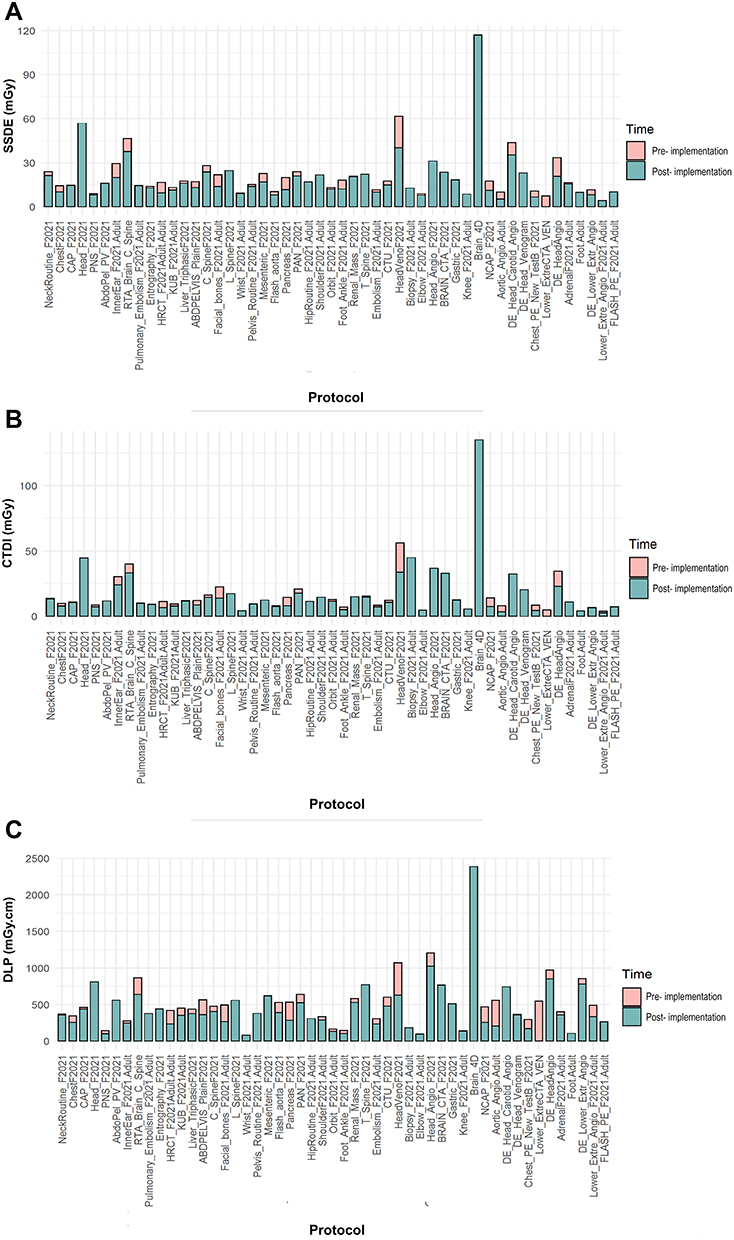 |
Figure 3 CT indices pre- and post-implementation of corrective measures based on imaging protocol. SSDE (A), CTDI (B), and DLP (C) (only protocols that were performed more than 10 times were included). Overlapping bars from both time points indicate the difference in exposure between the two time points. Abbreviations: SSDE, size-specific dose estimate; CTDI, computed tomography dose index; DLP, dose-length product; CT, computed tomography. |
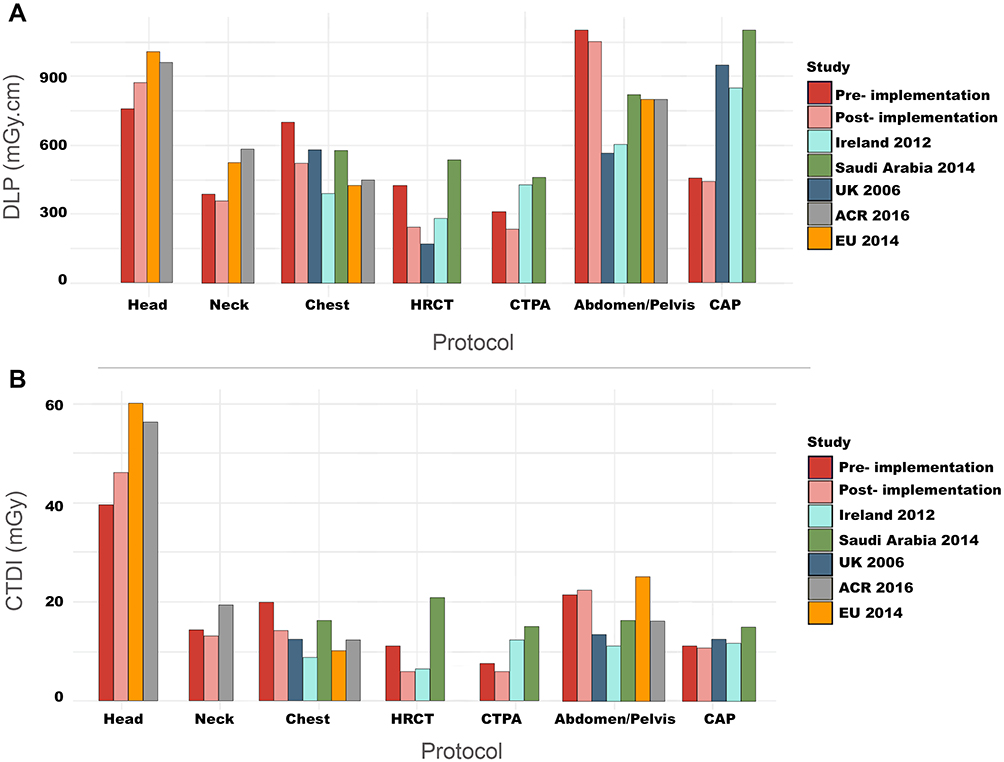 |
Figure 4 Exposure parameters (ie, DLP (A) and CTDI (B)) used in our radiology department compared to national.7,10 and international used parameters; from Ireland,11 United Kingdom,12 United States (American College of Radiology (ACR)),3 and European countries.3,13. |
Our departmental reference levels of CT-based radiation dose output (ie, CTDIvol) were the lowest in reference to national (ie, within Saudi Arabia7,10) and international (ie, Ireland,11 UK,12 USA,3 and other European countries3,13) benchmarks (Figure 4) during both periods (pre- and post-implementation of rectifying measures) for head, neck, CTPA, and CAP CT examinations. CTDIvol was the highest for CT imaging of the chest during the pre-implementation phase at our department, which was monitored during the post-implementation phase. However, there was insufficient data in the literature to compare our reference ADs based on the SSDE.
Discussion
This study identifies the role of data management analytical software in rationalizing exposure to ionizing radiation in CT scan by establishing reference DRLs for maintaining premium diagnostic imaging. The results demonstrated that SSDE was a significant confounder of dose determination in both phases compared to other exposure indices, such as CTDIvol, and DLP (Table 1, Figure 1). Additionally, head and lumbar imaging were found to have the highest radiation exposure among other body parts owing to the characteristic of traveling photons through a bony material. The low-energy photons of the polychromatic x-ray beams are preferentially attenuated, unlike the high-energy photons. This difference increases the mean energy of the x-ray beam.14 Higher tube voltage scanning (ie, an x-ray beam of higher-energy photons) without data management rationalization results in less-pronounced artifacts from beam hardening owing to lower-energy x-ray quanta contribution. However, increasing the tube voltage will cause a higher radiation dose if other scan parameters are not changed.14 The lumbar spine and head imaging ranked high in radiation exposure since the extent of these scans would involve a higher count of CT scan cuts involving a bony material. For example, the lumbar spine imaging would extend to cover parts of the lower rib cage and pelvic brim. As per our results, post-implementation of data management software ameliorated this issue owing to better monitoring and adjustment of other scan parameters (eg, the automatic exposure control algorithm being turned off and the effective mAs setting being fixed).
Our study period coincided with widespread global changes resulting from the COVID-19 pandemic declared by the World Health Organization on March 11, 2020.15 The world has endured substantial changes in all aspects of life due to the ergonomic effects associated with COVID-19, and health-care facilities are among the most significantly impacted organizations. In addition to personal restrictive measures, such as curfews and quarantine established by governments, health-care centers have delayed elective surgeries and procedures, as well as outpatient visits to maximize the resources available for patients with COVID-19. These precautions and restrictions have significantly decreased visits to health-care centers, consequently decreasing radiological imaging flow volume globally.
Sharperson et al16 and Houshyar et al17 reported an overall reduction of 12–35% in the total number of imaging requests placed by emergency departments in the USA during the pandemic compared to the pre-pandemic period. Similarly, Naidich et al18 reported a 12.29% decline in imaging volume across various modalities. Nevertheless, studies addressing the impact of COVID-19 on imaging volume in Saudi Arabia are scarce. An observational study conducted by Alelyani et al19 demonstrated a 21.27% reduction in the overall imaging conducted across chief hospitals in the Aseer region (located in the southern part of Saudi Arabia). Our study depicted the way our facility-based experience and data, which utilized management software for the standardization and optimization of CT protocols, helped to overcome the downward trend in the frequency of imaging reported by other hospitals during the COVID-19 pandemic.
The Saudi Food and Drug Authority (SFDA) recently established the National Diagnostic Reference Level7 and Essential Requirements for Medical Radiation Protection Programs20 to secure efficient radiation sources and minimize radiation risk to patients.7 Furthermore, we anticipate optimal radiation reduction in imaging examinations that does not compromise the diagnostic acceptability for reading radiologists (as confirmed by several clinical studies),21 owing to the abundance of CT scanners with greater dose reduction options such as automatic effective control systems. Radiation dose reduction can be achieved by optimizing scanning specifications (such as tube current, kilovoltage peak, and pitch) and employing strategies to enhance image quality with low CT dosages.22 The AAPM23 recommends the use of other alternatives to bismuth shielding while using automatic direct exposure control systems to avoid undesirable dose levels and ensure acceptable image quality. Additionally, adaptive statistical model reconstruction has been reported to facilitate radiation dose reduction.22 Thus, establishment of both regulatory and technical controls can facilitate radiation dose reduction.
TeamplayTM software facilitates improvements in clinical practice by defining the patient dose for a large population. Moreover, it conducts scripted data analysis within a short time, provides accurate visualization with variable doses, and identifies patients whose doses deviate significantly from reference levels.4,6 From a facility-based perspective, this data management software functions as a powerful tool for the standardization and optimization of CT protocols and serves as a platform for instant and efficient integration of dose-relevant data acquired from other national and international studies24 (Figure 4).
We experienced several advantages of using performance management applications, including improved radiation efficiency, enhanced consistency in image quality across patients of different sizes, decreased starvation artifacts, and reduced load on the tube exposure current, which increased its longevity.21 In addition, increasing the number of performed CT studies within a set time frame and reducing ADs with maintaining diagnostic image quality are indicators of efficiency improvements in KPIs, ie, 427 more CT examinations were performed in the post-implementation phase during COVID-19 ergonomics (Table 2).
Our findings coincide with the AAPM’s recommendation that the SSDE is an accurate parameter for dose estimation at the center of the scanned region of an individual patient based on patient size.3,25 Our study demonstrated that the SSDE was the most significant confounder of exposure dose determination compared to other proposed parameters (ie, CTDI and DLP), which reflected the magnitude of the exposure dose during both study phases (Table 1, Figure 1).
Discussions by medical professionals and manufacturers are currently underway to automatically obtain patient dimensions, apply them to the CTDIvol, and acquire the SSDE for each patient.3 We have already commenced performing this procedure at our facility using teamplay™. CTDIvol is a valuable quality assurance tool that enables comparison of doses from different protocols and scanner outputs from different manufacturers.3,25 Anam et al26 demonstrated that CTDIvol and SSDE can be estimated using the average tube current extracted from the DICOM headers using the tube current modulation technique, and the average tube current can be estimated using the WED.17,26 Studies have reported that certain DRLs can be derived from standard phantom measurements (eg, CTDI100, weighted CTDI, and CTDIvol), which provide estimates of the dose delivered to phantoms of a specific size and material and cannot be used as a substitute for estimating specific doses delivered to the patient. Thus, these metrics depend on the X-ray output of the CT scanner but do not represent the patient dose. In contrast, the SSDE accounts for the variation in patient size but is only an indicator of patient dose.2 Size-based DRLs permit protocol optimization; hence, the resultant dose is proportional to patient size, thereby avoiding unnecessary radiation exposure. The SSDE (for body examinations) adjusts the phantom-based CTDIvol according to patient size and provides a more realistic estimation of patient dose.3
Prior to the implementation of our new rectifying measures, manual methods were utilized for data collection and analysis to establish the DRLs and ADs at our center.4 Data were collected using hardcopy records of each CT scan, which was particularly challenging during the study period, given that the spread of COVID-19 necessitated social distancing, or using information derived from the Radiology Information System and PACS for manual analysis.4 However, we recommend the discontinuation of manual analysis due to its labor-intensive and time-consuming nature.4
The results of our study promote the comprehension of advanced reconstruction options for achieving patient dose reduction while maintaining acceptable diagnostic image quality. This approach may enhance patient care and preclude unnecessary hazardous radiation exposure, particularly for the head imaging, which was the most frequently imaged body region at our facility. Nationally, with regard to DLP and CTDI, our institution ranked lower than the latest published reference levels established by the SFDA6 for high-resolution CT, CTPA, and CAP CT. After implementation of the data management software, the CTDI and DLP for chest scans also declined to levels below the national standards. The international DLP and CTDI of head CT were lower than those during the pre-implementation phase at our institution; however, the average DLP and CTDI of neck, CTPA, and CAP examinations were the lowest during the post-implementation phase (Figure 4).
DRLs should be used as an indication rather than direct proof of excessive radiation dose. Our findings suggest that DRLs can be used as a model of practice quality with respect to diagnostic and technical performance to ensure greater standardization of procedural efficiency.10 Moreover, the DRLs indicated that compared to other institutions, our institution demonstrated better compliance with the “As Low As Reasonably Achievable principle”. The implementation of this standard may assist busy physicians, technicians, and consulting medical physicists in workload management. In this regard, smaller practices and centers lacking on-site medical physicists would have to bear the heavy workload.
Strengths and Limitations
The design adopted for the current study is scientifically apt as it enables appreciable gains in statistical power for vast cohorts, even in the absence of censoring, and serves as a control strategy for potential recall bias in cohort studies.8,9
Nevertheless, the study was limited by the retrospective phase that was dependent on documentation of medical charts, which may have introduced substantial observer bias. Further, the cohort was limited by the fact that the data management software only computed patients body mass index (BMI) and did not account for the patients exact weight (kg), which may occasionally be required as an indicator of patient size. Therefore, adaptation of the tube current to body weight was not implemented. Within this limitation, our departmental DRLs (eg, SSDE) were established based on counts of patients’ BMI.27
Although beyond the scope of the current study, it is noteworthy that teamplayTM lacks the ability to calculate organ dosage, which is a capability of other dose management systems. Caution should be exercised when comparing global data, as the identification of studies and mapping of protocols for certain procedures may be problematic. Moreover, this study was limited to two CT scanners.
Scope for Future Research
Further research is warranted to confirm whether the SSDE is the optimal tube parameter of radiation dose. DRLs should be calculated on a routine basis to assess trends in CT scanners and radiation dose. Future studies should expand the analysis to include high-dose CT examinations and various scanner configurations. Furthermore, evaluating the effects of different noise levels using this management software will provide useful information to reduce variability and increase precision.
Conclusion
Implementing rectifying measures for radiation exposure using data management software applications provide a method for establishing DRLs and reducing ADs for CT in clinical settings. These approaches improve KPIs, despite the ergonomic complexities of COVID-19. Facilities are encouraged to effectively apply DRLs and ADs via automatic systems that monitor patient dose indices to enable evaluation of aggregate results. In accordance with ongoing improvements in dose reduction, novel protocols to lower the dose may be developed if the DRL is exceeded to ensure adequate image quality during diagnostic tasks.
Abbreviations
COVID-19, coronavirus disease 2019; AD, achievable dose; AAPM, American Association of Physicists in Medicine; CT, computed tomography; CAP, chest abdominopelvic; CTPA, CT pulmonary angiography; DRLs, diagnostic reference levels; DICOM, Digital Imaging and Communications in Medicine; PACS, Picture Archiving and Communication System; KPI, key performance indicator; KFHU, King Fahd Hospital of the University; DLP, dose-length product; CTDI, CT dose index; CTDIvol, volume CT dose index; SSDE, size-specific dose estimate; SFDA, Saudi Food and Drug Authority; WED, water-equivalent dose; mGy, milligray.
Data Sharing Statement
All data generated and/or analyzed are included within the manuscript itself.
Ethics Approval and Informed Consent
This study was performed in accordance with the Declaration of Helsinki of 1975 (revised in 1983). The Institutional Review Board of Imam Abdulrahman Bin Faisal University granted approval for this study to be conducted at KFHU (IRB-2022-01-206) after considering the descriptive and retrospective nature of the study. The collected data were anonymized, analyzed, and reported solely in aggregate form. No identifiable participant information (such as patients’ images, faces, or names) was disclosed in the study.
Consent for Publication
Consent for publication of the manuscript and related patient information has been obtained by the Radiology Department, King Fahd Hospital of the University, Imam Abdulrahman Bin Faisal University.
Acknowledgments
The authors gratefully acknowledge Mr. Khoury, Walid (Siemens-Healthineers) for his assistance in implementing the teamplay™ software.
Funding
This study did not receive any specific grant from funding agencies in the public, commercial, or not-for-profit sectors.
Disclosure
The authors declare that they have no conflicts of interest.
References
1. Li G, Liu X, Dodge CT, et al. A noise power spectrum study of a new model-based iterative reconstruction system: veo 3.0. J Appl Clin Med Phys. 2016;17(5):428–439. doi:10.1120/jacmp.v17i5.6225
2. ACR. ACR–AAPM–SPR practice parameter for diagnostic reference levels and achievable doses in medical X-ray imaging. ACR: Hong Kong, China; 2018.
3. Kanal KM, Butler PF, Sengupta D, et al. U.S. diagnostic reference levels and achievable doses for 10 adult CT examinations. Radiology. 2017;284(1):120–133. doi:10.1148/radiol.2017161911
4. Maguire S, Gilligan P, McCoubrey B, et al. The use of siemens teamplay™ in establishing cardiac CT diagnostic reference levels.
5. Hu X, Gou J, Lin W, et al. Size-specific dose estimates of adult, chest computed tomography examinations: comparison of Chinese and updated 2017 American college of radiology diagnostic reference levels based on the water-equivalent diameter. PLoS One. 2021;16(9):e0257294. doi:10.1371/journal.pone.0257294
6. Veen A. Teamplay – streamline clinical operations to unlock productivity gains. Erlangen, Germany: Siemens Healthineers; 2020. Available from: https://www.magnetomworld.siemens-healthineers.com/clinical-corner/case-studies/teamplay-streamline-clinical-operations.html.
7. Saudi Food and Drug Authority: Medical Devices Sector. National Diagnostic Reference Levels (NDRL) Computed Tomography (CT) – adult; 2021. Available from: https://sfda.gov.sa/sites/default/files/2020-08/%28NDRL%29En.pdf.
8. Commenges D, Moreau T. Comparative efficiency of a survival-based case-control design and a random selection cohort design. Stat Med. 1991;10(11):1775–1782. doi:10.1002/sim.4780101114
9. Lazcano G, Papuzinski C, Madrid E, Arancibia M. General concepts in biostatistics and clinical epidemiology: observational studies with cohort design. Medwave. 2019;19(11):e7748. doi:10.5867/medwave.2019.11.7748
10. Qurashi AA, Rainford LA, Foley SJ. Establishment of diagnostic reference levels for CT trunk examinations in the western region of Saudi Arabia. Radiat Prot Dosimetry. 2015;167(4):569–575. doi:10.1093/rpd/ncu343
11. Foley SJ, McEntee MF, Rainford LA. Establishment of CT diagnostic reference levels in Ireland. Br J Radiol. 2012;85(1018):1390–1397. doi:10.1259/bjr/15839549
12. Shrimpon P, Hiller M, Lewis M, et al. National survey of doses from CT in the UK. Br J Radiol. 2006;79:968–980. doi:10.1259/bjr/93277434
13. European Commission. Radiation protection N° 180. diagnostic reference levels in thirty-six European countries. Luxembourg: European Union; 2014. Available from: https://ec.europa.eu/energy/sites/ener/files/documents/RP180%20part2.pdf.
14. Katsura M, Sato J, Akahane M, et al. Current and novel techniques for metal artifact reduction at CT: practical guide for radiologists. Radiographics. 2018;38(2):450–461. doi:10.1148/rg.2018170102
15. World Health Organization. WHO Director-General’s Opening Remarks at the Media Briefing on COVID-19. Geneva: Switzerland; 2020.
16. Sharperson C, Hanna TN, Herr KD, et al. The effect of COVID-19 on emergency department imaging: what can we learn? Emerg Radiol. 2021;28(2):339–347. doi:10.1007/s10140-020-01889-9
17. Houshyar R, Tran-Harding K, Glavis-Bloom J, et al. Effect of shelter-in-place on emergency department radiology volumes during the COVID-19 pandemic. Emerg Radiol. 2020;27(6):781–784. doi:10.1007/s10140-020-01797-y
18. Naidich JJ, Boltyenkov A, Wang JJ, et al. Impact of the coronavirus disease 2019 (COVID-19) pandemic on imaging case volumes. J Am Coll Radiol. 2020;17:865–872. doi:10.1016/j.jacr.2020.05.004
19. Alelyani M, Alghamdi A, Shubayr N, et al. The impact of the COVID-19 pandemic on medical imaging case volumes in Aseer region: a retrospective study. Medicines. 2021;8:70. doi:10.3390/medicines8110070
20. essential requirements for medical radiation protection programs. Available from: https://sfda.gov.sa/sites/default/files/2021-01/Essential%20Requirements%20for%20Medical%20Radiation%20Protection%20Program%20%285%29%20En.pdf.
21. Söderberg M. Overview, practical tips and potential pitfalls of using automatic exposure control in CT: siemens CARE dose 4D. Radiat Prot Dosimetry. 2016;169(1–4):84–91. doi:10.1093/rpd/ncv459
22. Vorona G, Zuccoli G, Sutcavage T, et al. The use of adaptive statistical iterative reconstruction in pediatric head CT: a feasibility study. AJNR Am J Neuroradiol. 2013;34(1):205–211. doi:10.3174/ajnr.A3122
23. American Association of Physicists in Medicine (AAPM). AAPM position statement on the use of bismuth shielding for the purpose of dose reduction in CT scanning. PP 26-A. AAPM; 2012. Available from: https://www.aapm.org/publicgeneral/BismuthShielding.pdf.
24. Christianson O, Li X, Frush D, et al. Automated size-specific CT dose monitoring program: assessing variability in CT dose. Med Phys. 2012;39(11):7131–7139. doi:10.1118/1.4761871
25. Medicine AAoPi. Size-specific dose estimates (SSDE) in pediatric and adult body CT examinations. AAPM Rep. 2011;204:1–30.
26. Anam C, Haryanto F, Widita R, et al. Volume computed tomography dose index (CTDIvol) and size-specific dose estimate (SSDE) for tube current modulation (TCM) in CT scanning. Int J Radiat Res. 2018;16:289–297.
27. Xu J, Wang X, Yang P, et al. Size-specific dose estimates of radiation based on body weight and body mass index for chest and abdomen-pelvic cts. Biomed Res Int. 2020;2020:6046501. doi:10.1155/2020/6046501
 © 2022 The Author(s). This work is published and licensed by Dove Medical Press Limited. The full terms of this license are available at https://www.dovepress.com/terms.php and incorporate the Creative Commons Attribution - Non Commercial (unported, v3.0) License.
By accessing the work you hereby accept the Terms. Non-commercial uses of the work are permitted without any further permission from Dove Medical Press Limited, provided the work is properly attributed. For permission for commercial use of this work, please see paragraphs 4.2 and 5 of our Terms.
© 2022 The Author(s). This work is published and licensed by Dove Medical Press Limited. The full terms of this license are available at https://www.dovepress.com/terms.php and incorporate the Creative Commons Attribution - Non Commercial (unported, v3.0) License.
By accessing the work you hereby accept the Terms. Non-commercial uses of the work are permitted without any further permission from Dove Medical Press Limited, provided the work is properly attributed. For permission for commercial use of this work, please see paragraphs 4.2 and 5 of our Terms.