")
Back to Journals » Diabetes, Metabolic Syndrome and Obesity » Volume 11
The impact of carbohydrate intake and its sources on hemoglobin A1c levels in Japanese patients with type 2 diabetes not taking anti-diabetic medication
Authors Haimoto H , Watanabe S, Komeda M, Wakai K
Received 22 October 2017
Accepted for publication 12 January 2018
Published 9 March 2018 Volume 2018:11 Pages 53—64
DOI https://doi.org/10.2147/DMSO.S154839
Checked for plagiarism Yes
Review by Single anonymous peer review
Peer reviewer comments 2
Editor who approved publication: Professor Ming-Hui Zou
Hajime Haimoto,1 Shiho Watanabe,2 Masashi Komeda,3 Kenji Wakai4
1Department of Internal Medicine, Haimoto Clinic, Kasugai, Aichi, Japan; 2Department of Clinical Nutrition, Haimoto Clinic, Kasugai, Aichi, Japan; 3Department of Cardiovascular Surgery, Jinsenkai Hospital, Morofuku, Osaka, Japan; 4Department of Preventive Medicine, Nagoya University Graduate School of Medicine, Nagoya, Aichi, Japan
Background: Although postprandial glucose levels largely depend on carbohydrate intake, the impact of carbohydrate and its sources on hemoglobin A1c (HbA1c) levels has not been demonstrated in patients with type 2 diabetes (T2DM) probably because, in previous studies, more than 50% of patients were taking anti-diabetic medication, and the researchers used energy percent of carbohydrate as an indicator of carbohydrate intake.
Patients and methods: We recruited 125 Japanese men (mean age 58±12 years) and 104 women (mean age 62±10 years) with T2DM who were not taking anti-diabetic medication and dietary therapy. We used 3-day dietary records to assess total carbohydrate intake and its sources, computed Spearman’s correlation coefficients, and conducted multiple regression analyses for associations of carbohydrate sources with HbA1c by sex.
Results: Mean HbA1c and total carbohydrate intake were 8.2%±1.9% and 272.0±84.6 g/day in men and 7.6%±1.3% and 226.7±61.5 g/day in women, respectively. We observed positive correlation of total carbohydrate intake (g/day) with HbA1c in men (rs=0.384) and women (rs=0.251), but no correlation for % carbohydrate in either sex. Regarding carbohydrate sources, we found positive correlations of carbohydrate from noodles (rs=0.231) and drinks (rs=0.325), but not from rice, with HbA1c in men. In women, carbohydrate from rice had a positive correlation (rs=0.317), but there were no correlations for carbohydrate from noodles and drinks. The association of total carbohydrate intake (g/day) and carbohydrate from soft drinks with HbA1c in men remained significant even after adjustment for total energy by multiple regression analyses.
Conclusion: Our findings warrant interventional studies for moderate low-carbohydrate diets that focus on carbohydrate sources and sex differences in order to efficiently decrease HbA1c in patients with T2DM.
Keywords: carbohydrate intake, type 2 diabetes, carbohydrate sources, rice, soft drinks, low-carbohydrate diet
Introduction
Dietary therapy is essential for the integrated management of type 2 diabetes (T2DM). Meal tolerance tests have proven that blood glucose and serum insulin concentrations are largely dependent on carbohydrate intake1,2 and that postprandial glucose levels have a dose (gram)-dependent relationship with carbohydrate intake.3 In contrast, dietary protein and fat have little effect on the concentrations.4 On the basis of these findings, low-carbohydrate diets have been developed in the past decade.5,6 A large number of short-term interventional studies and meta-analyses of these diets have demonstrated that low-carbohydrate diets have beneficial effects on glycemic control in T2DM, achieve greater reductions in anti-diabetic medication, more weight loss, and greater improvement in serum lipid profiles compared with low-fat diets.7–10 Although some researchers have claimed that there was no significant difference in glycemic control between low-carbohydrate diets and low-fat diets,11,12 their findings came from studies comparing the 2 diets under the condition of a comparatively low energy intake not exceeding 1500 kcal.
We also have shown that moderate low-carbohydrate diets achieved greater improvement in glycemic control, serum lipid profiles, and visceral fat, with reductions in anti-diabetic medication in Japanese patients with T2DM.13–16 Unfortunately, most of the interventional studies with low-carbohydrate diets for patients with T2DM have been conducted in Western countries; such studies have hardly been conducted in East Asian countries. The carbohydrate and fat intakes in East Asian populations are quite different from those in Western populations: higher carbohydrate and lower fat in the former versus lower carbohydrate and higher fat percentages in the latter.17,18 The dominant carbohydrate sources are rice and noodles in East Asian populations, whereas the major source of carbohydrate is bread in Western populations. Therefore, the findings of studies in Western populations may not be applicable to East Asian populations. Therefore, original studies from East Asia are required.
Whatever diet (low-carbohydrate or low-fat) we give to patients with T2DM, it is important to know the impact of total carbohydrate intake and its sources on hemoglobin A1c (HbA1c) at baseline. In this regard, several previous observational studies, including East Asian patients with T2DM failed to demonstrate a positive correlation of carbohydrate intake with HbA1c levels,19–24 which is inconsistent with many interventional studies. This is probably because 50%–100% of the subjects in the observational studies were taking anti-diabetic medication (oral hypoglycemic agents [OHAs] and/or insulin) and the studies used energy percent of carbohydrate (% carbohydrate) as an indicator of carbohydrate intake. In our previous interventional study among Japanese patients with T2DM, carbohydrate intake (absolute value, g/day) positively correlated with HbA1c levels at baseline whereas % carbohydrate did not. This study, however, had the limitations that 30% of the patients were taking anti-diabetic medication and we did not determine whether the correlation differed by sex.
Regarding management of carbohydrate intake in patients with T2DM, little has been reported on what types of carbohydrate sources have an impact on higher HbA1c levels in both observational and interventional studies. It is, therefore, important to clarify associations of carbohydrate sources with HbA1c to efficiently lower HbA1c levels.
Based on this background, we designed an observational study to: 1) elucidate precise associations of carbohydrate intake (g/day) and % carbohydrate with HbA1c in T2DM patients not taking any anti-diabetic medication; 2) clarify if the associations differ by sex; and 3) identify carbohydrate sources associated with higher HbA1c levels.
Patients and methods
Patients
We recruited all new Japanese outpatients with T2DM and HbA1c levels of 6.5% or above at Haimoto Clinic from March 2010 to June 2015. Both newly and previously diagnosed patients were enrolled. All patients met the American Diabetes Association criteria for T2DM.25 We measured fasting plasma glucose and HbA1c in all patients and the 75 g oral glucose tolerance test (OGTT) was conducted within a few weeks whenever possible. Exclusion criteria included: patients taking any type of OHA or insulin within 3 months that impacted their HbA1c levels. We also excluded patients who were following strict carbohydrate restriction based on commercial diet therapies such as the Atkins diet.
Of the 347 eligible patients, we excluded those who were on OHA or insulin (n=105). Seven patients did not agree to take part in this study. Also excluded were patients who reported inaccurate dietary information (n=3) and those who were already following a strict low-carbohydrate diet (n=3). Thus, the final number of outpatients with T2DM who were eligible for the present study was 229.
All participants gave written informed consent and the study protocol was approved by the Ethics Committee of the Nagoya Tokushukai General Hospital.
Dietary records and clinical assessment
Macronutrient intakes were assessed at baseline based on 3-day dietary records. Patients were requested to record dietary intake on 3 non-consecutive days: 2 weekdays and a holiday. The dietary records were obtained within 2 weeks from the first visit to Haimoto Clinic and we measured blood HbA1c during the period. As patients were not instructed to make any dietary changes during that time, we considered that the dietary records sufficiently corresponded to HbA1c levels. Supplementary information was obtained in an interview with a dietitian. Dietary intakes were computed from the dietary records using the Healthy Maker Pro 501 software (Mushroomsoft, Okayama, Japan).
We measured the body mass index of each patient. Venous blood samples were obtained after an overnight (12 hours) fast for the determination of HbA1c, fasting plasma glucose, fasting serum insulin and serum low-density lipoprotein (LDL)-cholesterol, high-density lipoprotein (HDL)-cholesterol, and triglycerides. We also recorded the doses of lipid-lowering or anti-hypertensive drugs taken by the patients.
Excluding 16 patients who did not consent, 203 eligible patients underwent the OGTT for assessment of insulin secretory capacity. We instructed patients to arrive at Haimoto Clinic after fasting for at least 10 hours, drew blood samples from them at 30 minutes, 1 hour, and 2 hours after glucose loading, and measured plasma glucose and serum insulin levels. We used the insulinogenic index, an indicator of early insulin secretion, which is calculated as Δserum insulin level at 30 minutes (μIU/mL)/Δplasma glucose level at 30 minutes (mg/dL).26 Area under the curve (AUC) for total insulin secretory capacity was calculated geometrically using the trapezoidal rule. The homeostasis model assessment of insulin resistance parameter was computed as follows: ([fasting plasma glucose {mg/dL}] × [fasting serum insulin {μIU/mL}])/405.27
Sources of carbohydrate from various foods
Foods rich in carbohydrate content were divided into 2 groups: staple and non-staple foods. Staple foods were determined to be rice (rice and rice cakes), noodles made from wheat or buckwheat (udon, soba, ramen, fried noodles, and pasta), and bread. Non-staple foods were divided into the following groups: fruits, soft drinks, alcoholic beverages, and other non-staple foods. Fruits included mikan (mandarin oranges), oranges, grapefruits, apples, pears, peaches, persimmons, grapes, melons, watermelons, bananas, and pineapples. Soft drinks included beverages containing sugar, glucose, fructose, and milk. Alcoholic beverages included brewed liquors (sake, beer, and wine), but did not include distilled liquors because they contain little carbohydrate. Other non-staple foods included sugar, confectionery, potatoes (sweet potato, taro, and yam), selected vegetables, and other foods made from wheat, rice, and potatoes (okonomiyaki, dim sum, potato chips, etc). Selected vegetables included carrots, Indian lotus, pumpkin, tomatoes, and burdock. The carbohydrate content of each food was also calculated with Healthy Maker Pro 501.
Laboratory methods
The HbA1c levels were measured by high-performance liquid chromatography (Arkley Co., Kyoto, Japan) and presented as National Glycohemoglobin Standardization Program values (%).28 Plasma glucose concentrations were determined using enzymatic methods (Shino-Test Co., Kanagawa, Japan).
Serum insulin levels were measured using the standard double antibody radioimmunoassay method (Fujirebio Inc., Tokyo, Japan). Enzymatic methods were used to measure serum triglyceride concentrations (Daiichi Pure Chemicals Co., Tokyo, Japan). Direct methods were used to assay serum LDL-cholesterol and HDL-cholesterol levels (Daiichi Pure Chemicals Co.).
Statistical analysis
We analyzed men and women separately because the amount of dietary macronutrient intakes were quite different between them.
Increasing or decreasing trends in patients’ baseline characteristics with increasing total carbohydrate intake were tested by linear regression models with a score of 1, 2, and 3 given to tertiles 1–3 (Q1, Q2, and Q3) when stratified by tertile of carbohydrate intake, respectively. We summarized age, body mass index, duration of diabetes, blood chemistry tests (HbA1c, fasting plasma glucose, fasting serum insulin, serum lipid profiles, insulinogenic index, and AUC-insulin from OGTT), nutritional variables (total carbohydrate intake and its sources, total energy intake, and other macronutrient intakes), and proportions of subjects taking lipid-lowering and anti-hypertensive drugs for each of the 3 tertiles of carbohydrate intake.
We used the Mann–Whitney test to statistically test the difference in macronutrient intakes between men and women.
We designated Spearman’s correlation coefficients (rs) as the primary indicators of associations. The coefficients were computed to evaluate associations of total energy intake, total carbohydrate intake (g/day) and its sources, and % carbohydrate and percent energy from other macronutrients with HbA1c. The coefficients for total carbohydrate intake and % carbohydrate, the main indicators in our study, and for carbohydrate from foods that were significantly correlated with HbA1c, were also evaluated by substituting the non-fiber carbohydrate intake for them.
Multiple linear regression analyses were performed to examine associations of total carbohydrate intake and its sources, % carbohydrate, and other macronutrients with HbA1c, with adjustment for total energy intake and age. We also used models substituting energy intake, excluding energy from alcohol for total energy intake. In addition, we repeated the analyses with carbohydrate, excluding fiber for total carbohydrate and % carbohydrate and for carbohydrate from foods that were significantly correlated with HbA1c.
P-values <0.05 were considered statistically significant. Data were shown as means ± SD. All statistical analyses were performed using SPSS, version 15.0 (SPSS, Inc., Chicago, IL, USA).
Results
Baseline clinical and nutritional characteristics in men by tertile of total carbohydrate intake (g/day)
Table 1 shows baseline clinical characteristics of male patients (n=125) and 3 patient groups (Q1, Q2, and Q3) when stratified by tertile of total carbohydrate intake (g/day). The mean HbA1c level was 8.2%±1.9% (range: 6.5%–15.4%). We observed significant increasing trends in body mass index, HbA1c levels, and serum triglycerides, and decreasing trends in age, duration of diabetes, and serum HDL-cholesterol levels with increasing total carbohydrate intake. We found no variation in other clinical measures.
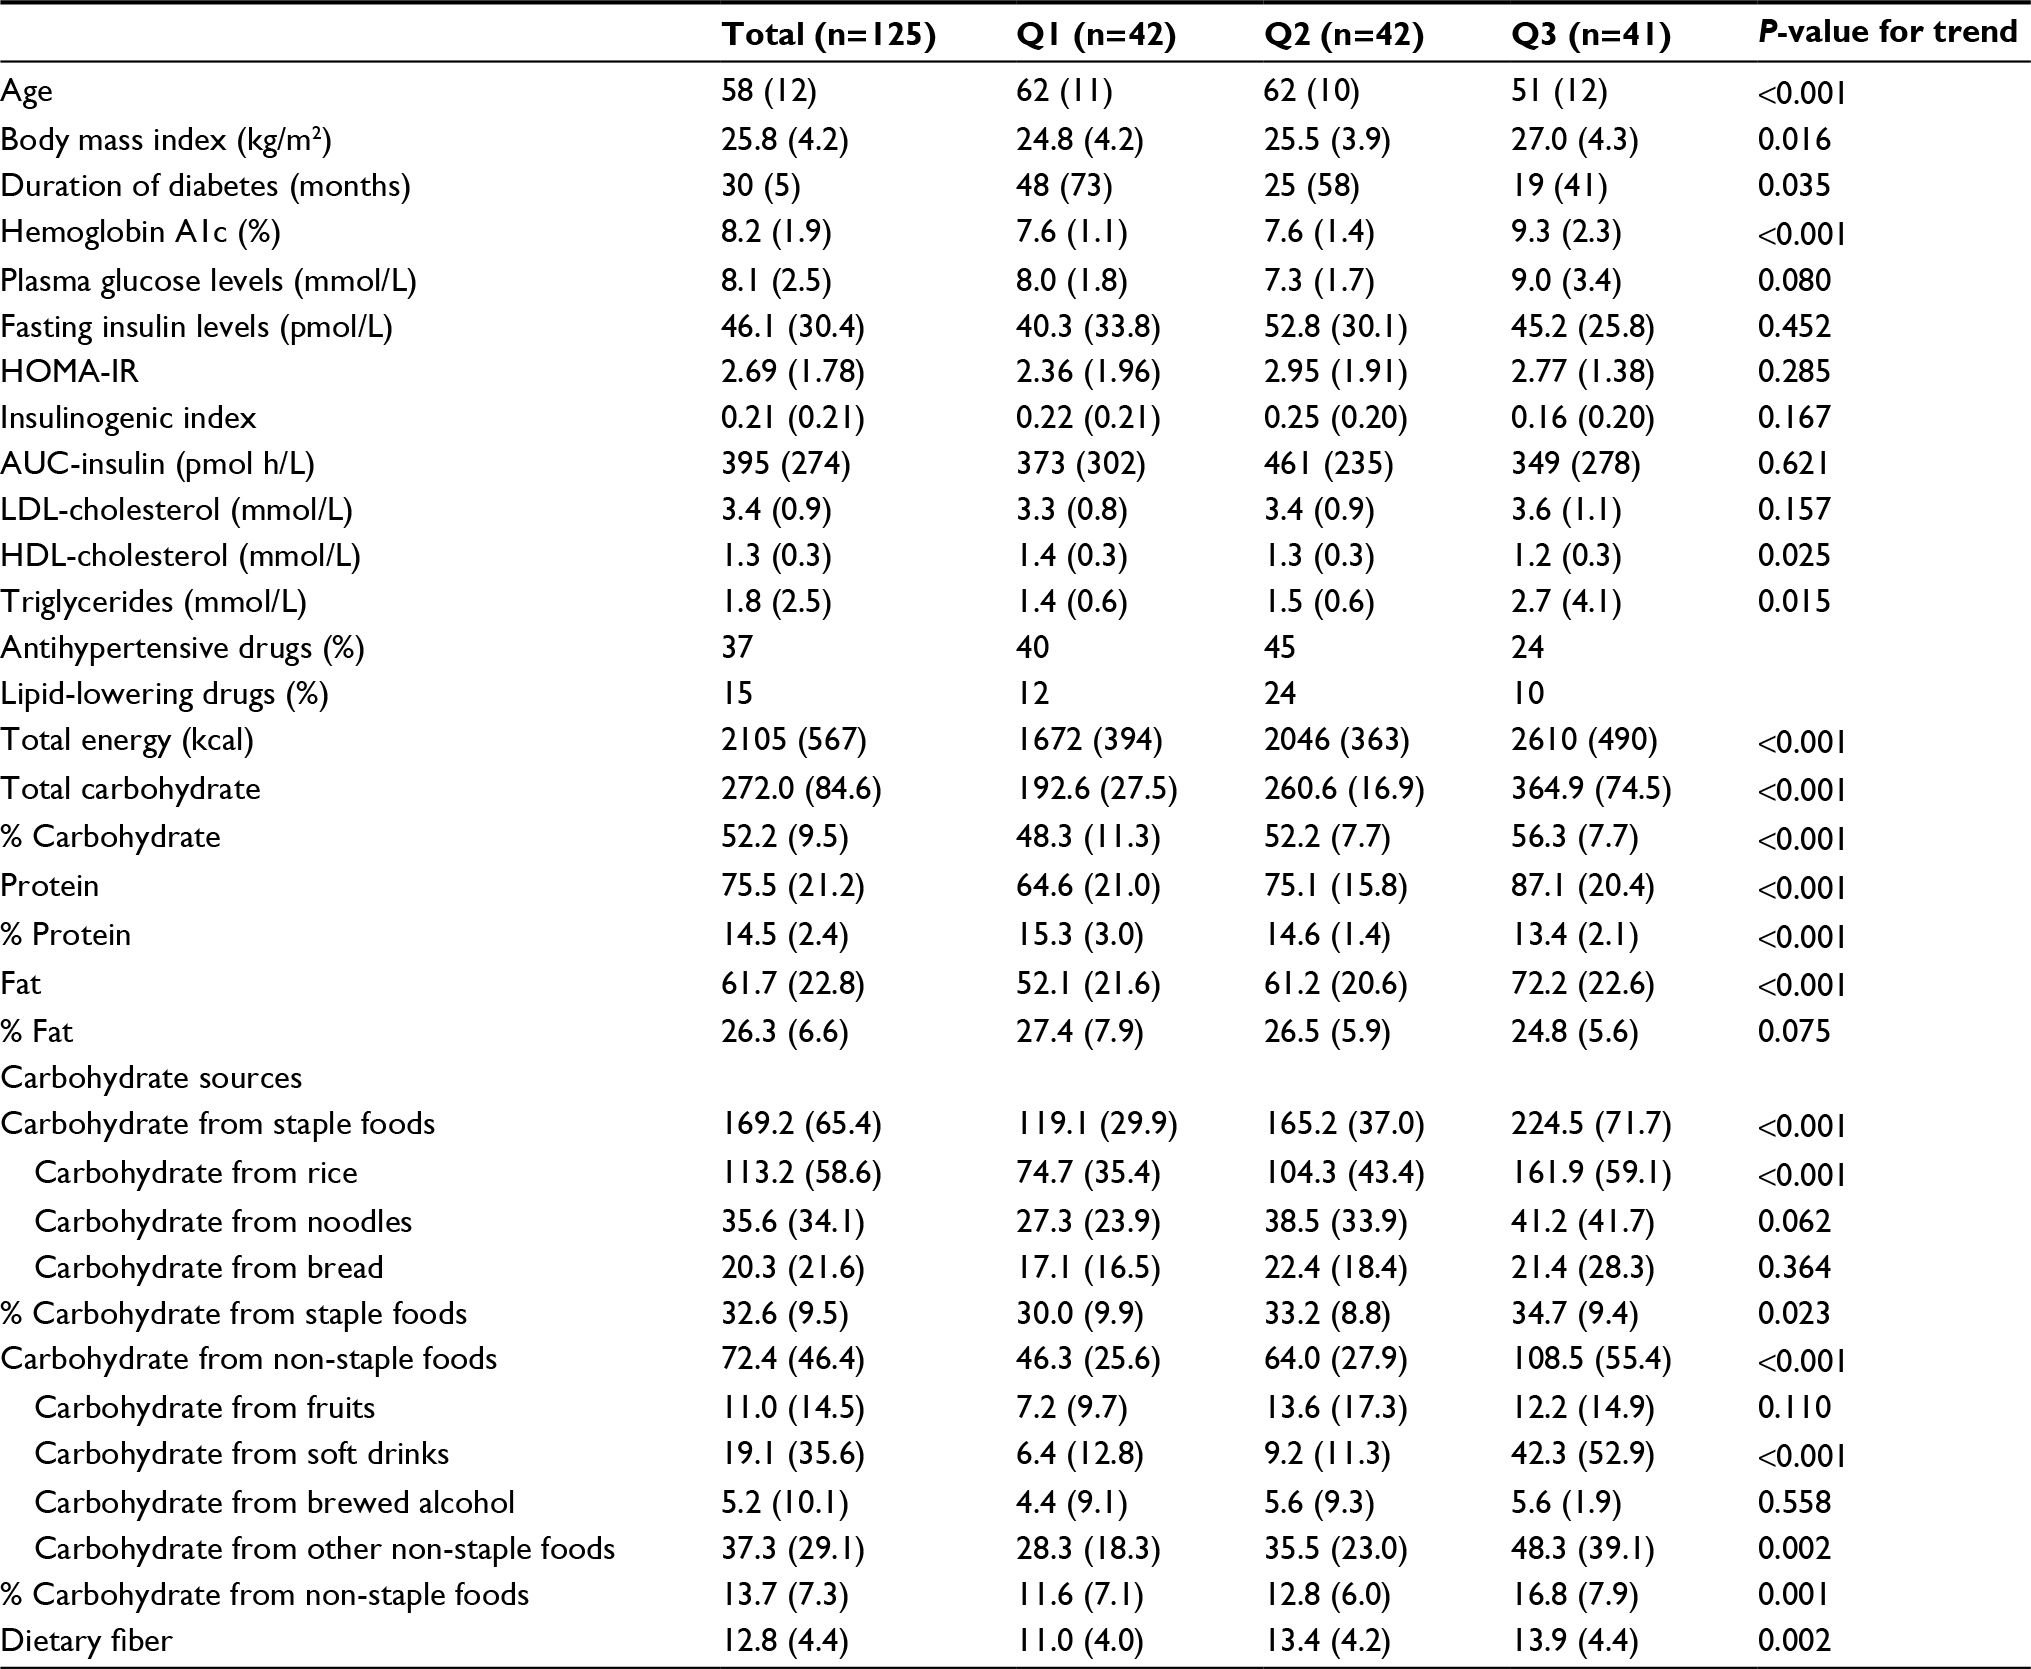 | Table 1 Baseline characteristics of male patients with type 2 diabetes by tertile of daily carbohydrate intake (g/day) Notes: Increasing or decreasing trends in patients’ characteristics with increasing carbohydrate intake were tested using linear regression models with a score of 1, 2, and 3 given to tertiles 1–3 (Q1–Q3) of carbohydrate intake. Data are shown as means with SD in parenthesis. Units of macronutrients and dietary fiber are g/day, except for % macronutrients, of which the units are %. HOMA-IR and insulinogenic index were calculated using conventional units (mg/dL and μIU/mL). Abbreviations: AUC, area under the curve; HDL, high-density lipoprotein; HOMA-IR, homeostasis model of assessment of insulin resistance; LDL, low-density lipoprotein. |
Baseline nutritional characteristics are also presented in Table 1. The mean total energy and total carbohydrate intake were 2.105±567 kcal and 272.0±84.6 g/day (% carbohydrate: 52.2%±9.5%), respectively. The carbohydrate intake ranged from 139.9 to 611.6 g/day. Increasing trend in total energy intake, % carbohydrate, protein intake (g/day), fat intake (g/day), carbohydrate from staple foods, rice, non-staple foods, soft drinks and other non-staple foods, % carbohydrate from staple foods and non-staple foods, and dietary fiber was evident with increase of total carbohydrate intake. A decreasing trend was observed for % protein.
Baseline clinical and nutritional characteristics in women by tertile of daily carbohydrate intake
Table 2 summarizes baseline clinical characteristics of female patients (n=104) and 3 patient groups (Q1, Q2, and Q3) when stratified by tertile of total carbohydrate intake (g/day). The mean HbA1c level was 7.6%±1.3% (range: 6.5%–12.3%). We found no variation in HbA1c or other clinical measures, except that insulinogenic index showed a significant decreasing trend with increase in total carbohydrate intake.
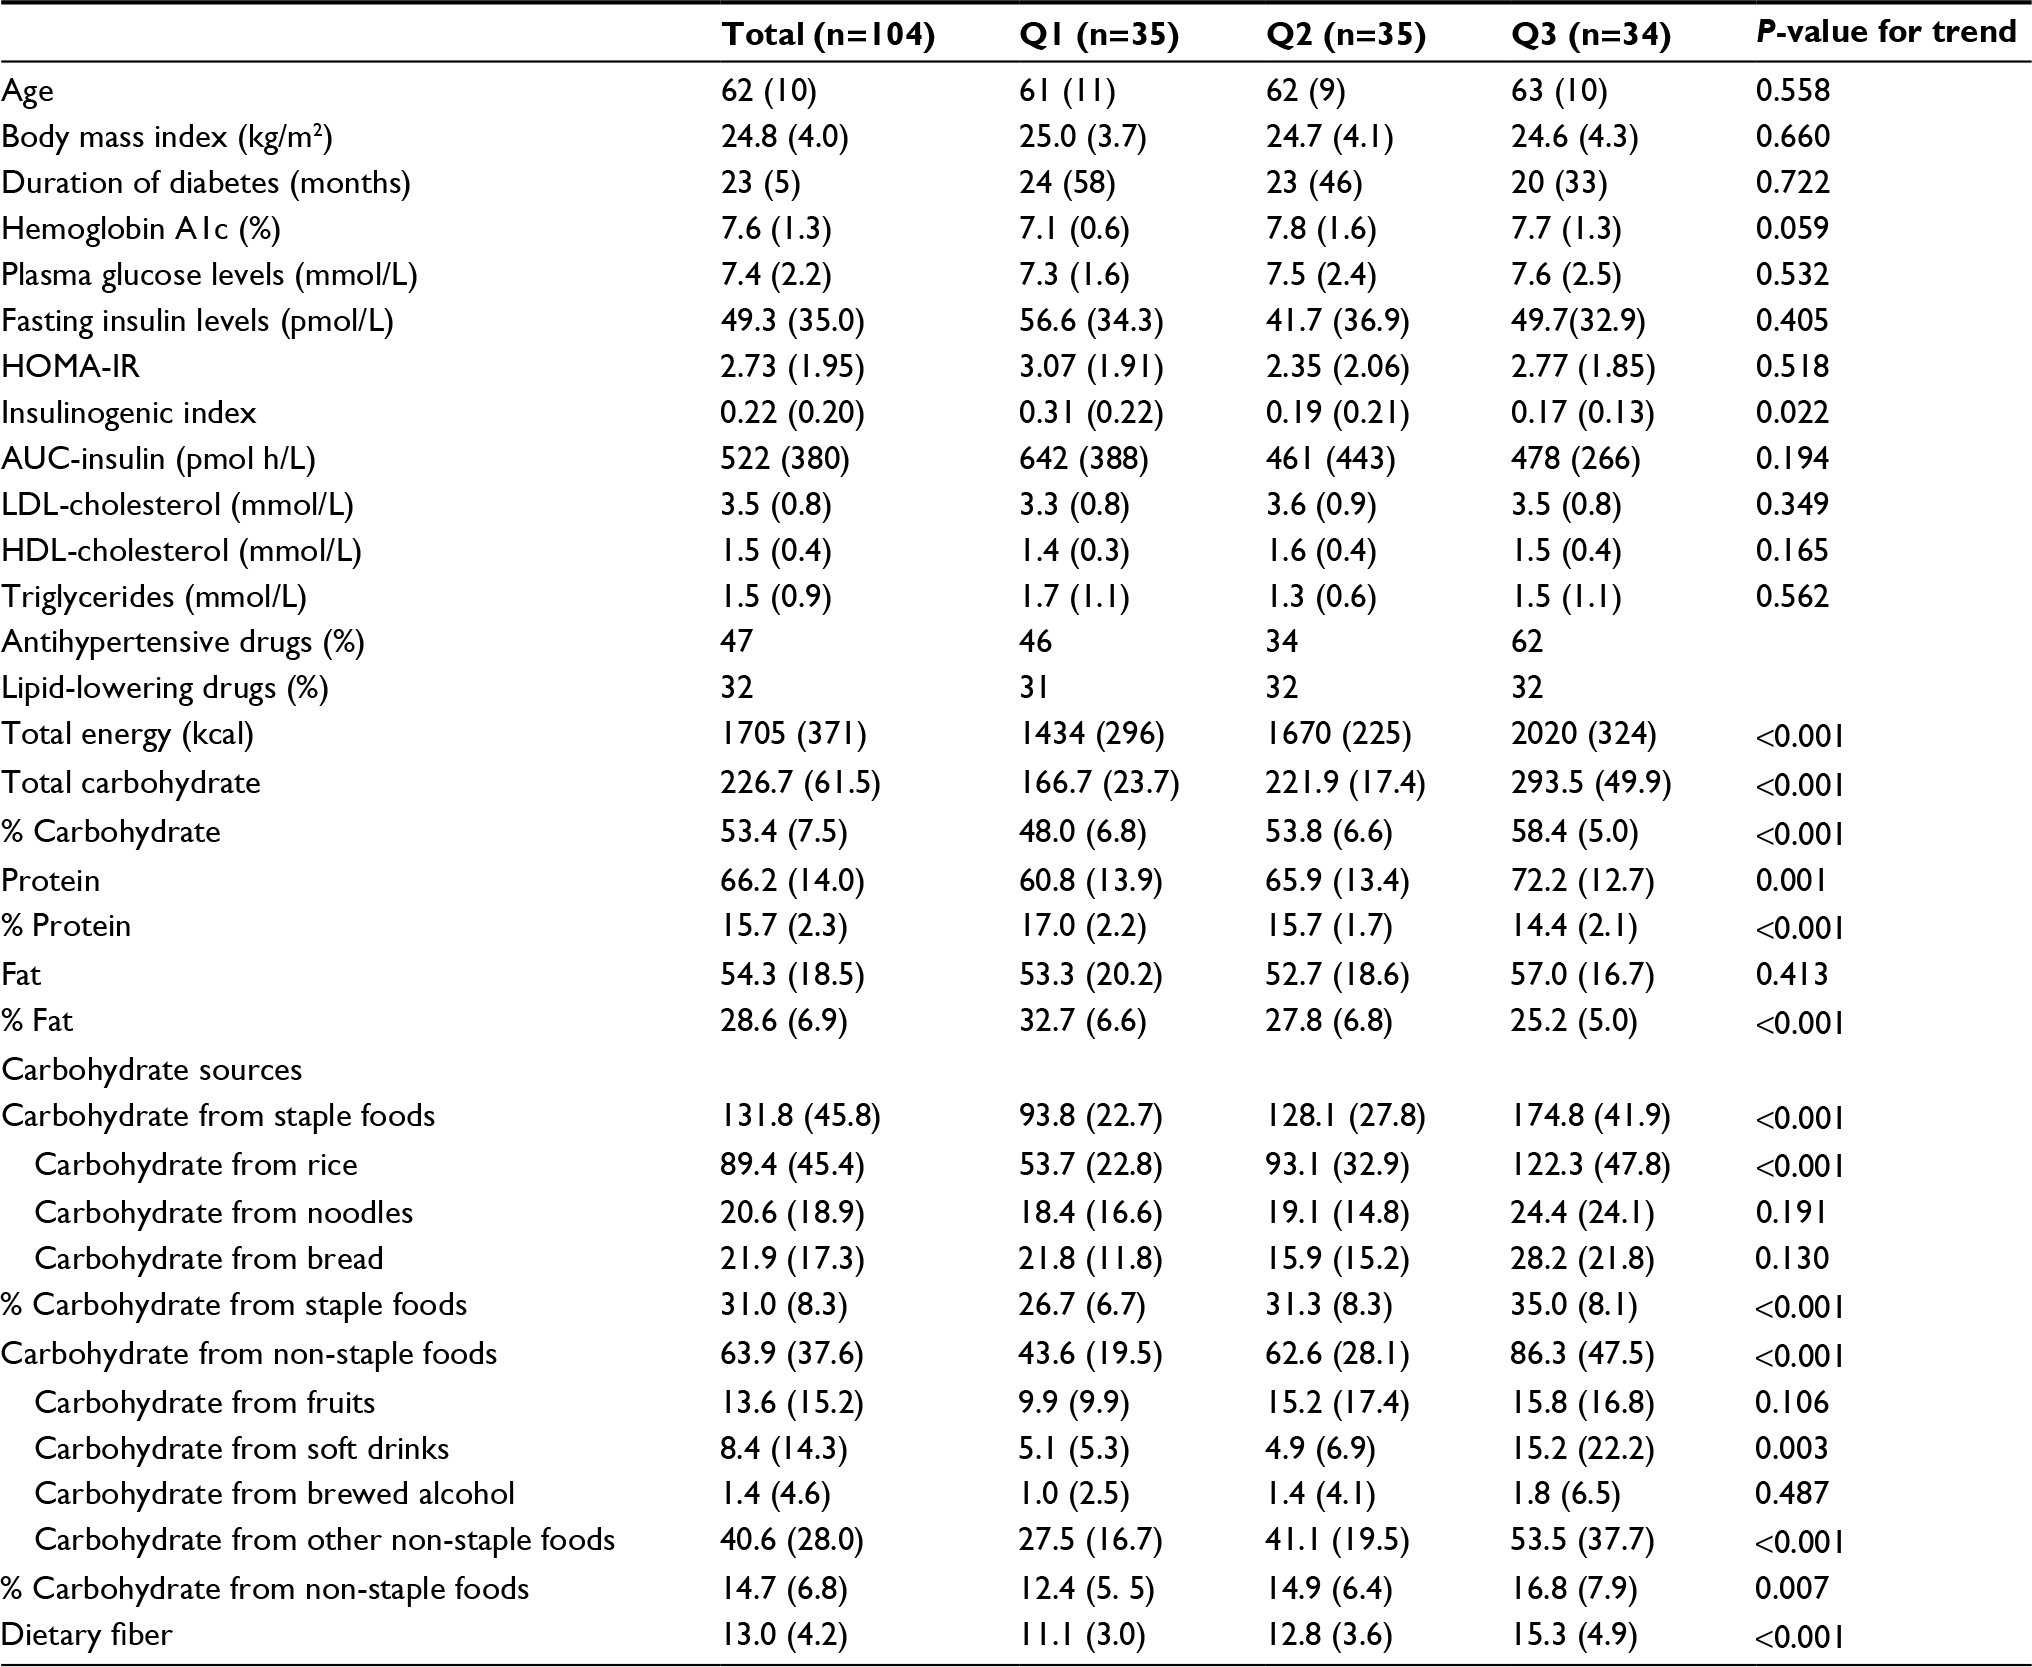 | Table 2 Baseline characteristics of female patients with type 2 diabetes by tertile of daily carbohydrate intake (g/day) Notes: Increasing or decreasing trends in patients’ characteristics with increasing carbohydrate intake were tested using linear regression models with a score of 1, 2, and 3 given to tertiles 1–3 (Q1–Q3) of carbohydrate intake. Data are shown as means with SD in parenthesis. Units of macronutrients and dietary fiber are g/day, except for % macronutrients, of which units are %. HOMA-IR and insulinogenic index were calculated using conventional units (mg/dL and μIU/mL). Abbreviations: AUC, area under the curve; HDL, high-density lipoprotein; HOMA-IR, homeostasis model of assessment of insulin resistance; LDL, low-density lipoprotein. |
Baseline nutritional characteristics are also shown in Table 2. The mean total energy and total carbohydrate intake were 1.705±371 kcal and 226.7±61.5 g/day (% carbohydrate: 53.4%±7.5%), respectively. The carbohydrate intake ranged from 117.1 to 513.1 g/day. We observed a significant increasing trend in total energy intake, % carbohydrate, protein intake, carbohydrate from staple foods, rice, non-staple foods, soft drinks and other non-staple foods, % carbohydrate from staple foods and non-staple foods, and dietary fiber across the 3 groups. A decreasing trend was evident for % protein and % fat.
Difference in macronutrient intakes between men and women
Total energy intake (P<0.001), carbohydrate intake (g/day) (P<0.001), protein intake (g/day) (P=0.001), and fat intake (g/day) (P=0.004) were significantly greater in men than in women, while % protein (P<0.001) and % fat (P=0.016) were lower in men than in women. There was no significant difference between the sexes only for % carbohydrate.
Correlations of total carbohydrate and its sources, and other macronutrients with HbA1c levels in men
Correlations of carbohydrate and other macronutrients with HbA1c levels in men are shown in Table 3. Total carbohydrate intake (rs=0.368) (Figure 1A) and total energy intake (rs=0.384) were positively correlated with HbA1c, whereas % carbohydrate was not (rs=0.063) (Figure 1B). The % fat and % protein were not significantly associated with HbA1c, but absolute protein and fat intakes (g/day) were positively and weakly correlated. Excluding fiber from total carbohydrate hardly changed the results for total carbohydrate (rs=0.362, P<0.001) and % carbohydrate (rs=0.065, P=0.473).
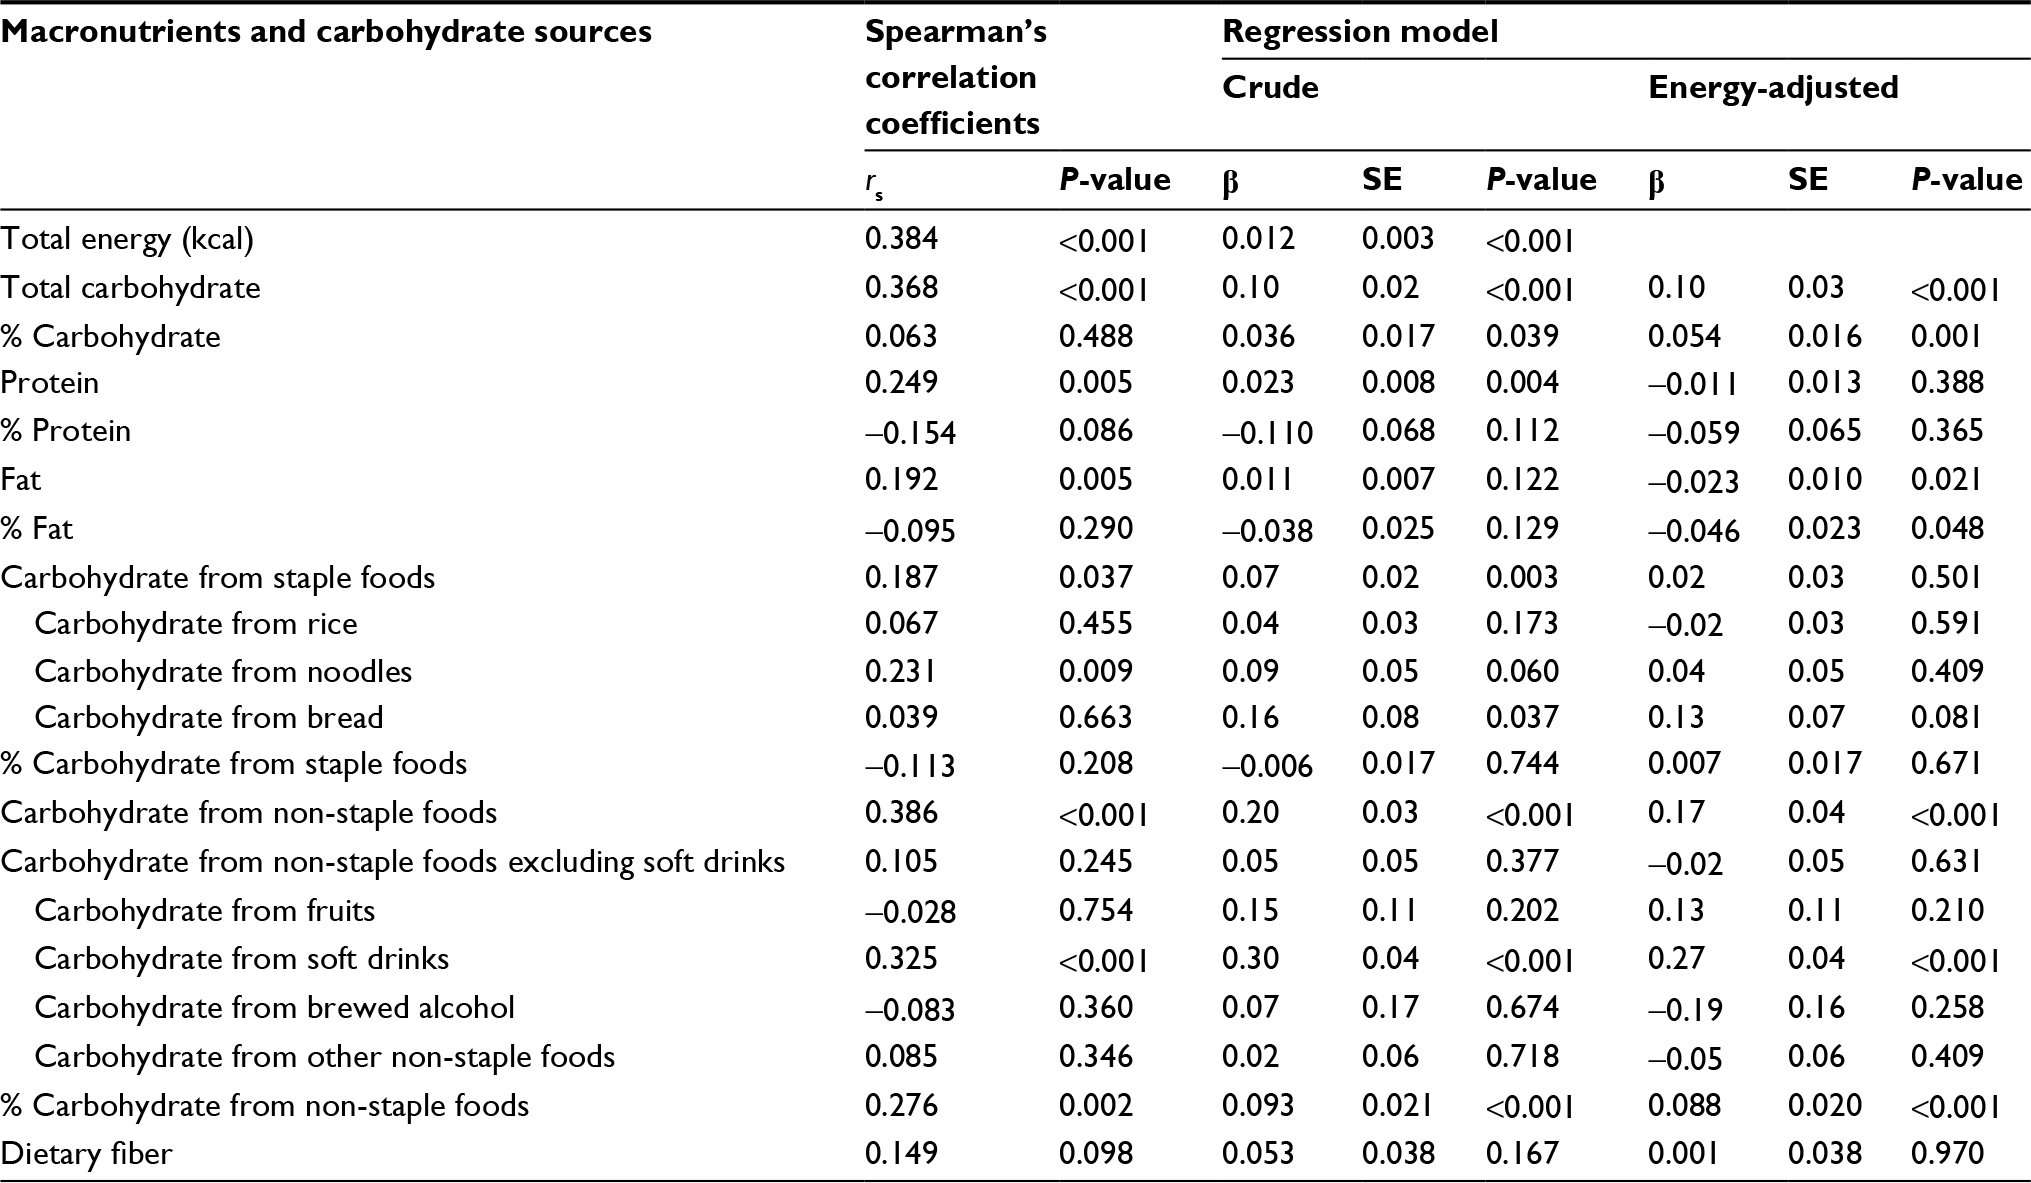 | Table 3 Associations of intakes of carbohydrate and its sources and other macronutrients (g/day) with HbA1c in men: Spearman’s correlation coefficients and regression coefficients (n=125) Notes: Coefficients and their SEs are indicated per 10 g carbohydrate or 10 kcal total energy intake. Units of macronutrients and dietary fiber are g/day except for % macronutrients, of which units are %. Abbreviations: HbA1c, hemoglobin A1c; SE, standard error. |
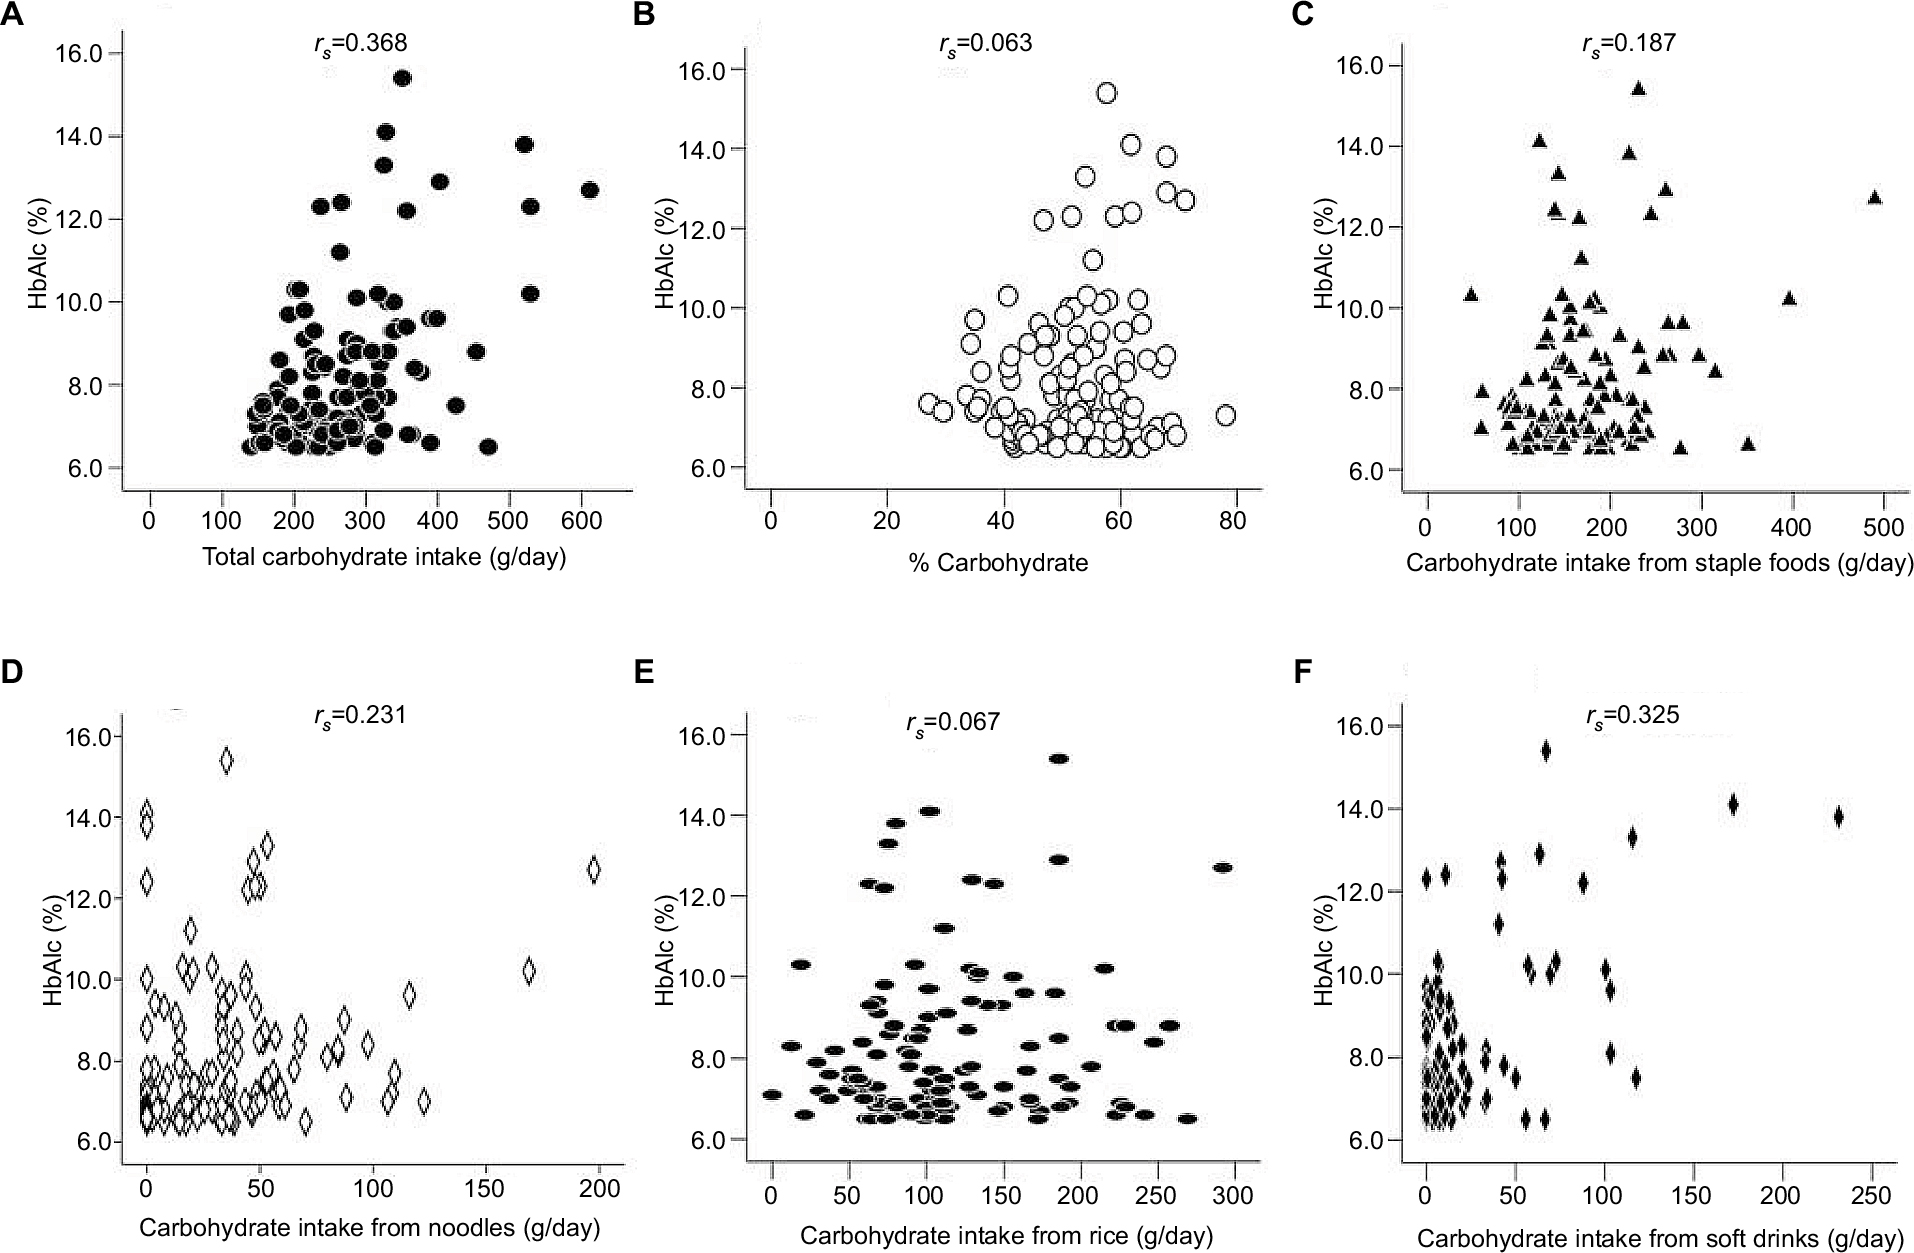 | Figure 1 Correlations of carbohydrate intake and its sources with HbA1c in men. Notes: Closed circles indicate total carbohydrate intake (A) and open circles % carbohydrate (B). Closed triangles indicate carbohydrate from staple foods (C), open diamonds that from noodles (D), closed ovals indicate carbohydrate from rice (E), and closed diamonds that from soft drinks (F). Total carbohydrate intake (A) positively and moderately correlated with HbA1c levels, while there was no correlation for % carbohydrate (B). We also found a positive and moderate association of carbohydrate from soft drinks with HbA1c (F) and positive but weak association of carbohydrate from staple foods (C) and noodles (D), while there was no association of carbohydrate from rice (E). Abbreviation: HbA1c, hemoglobin A1c. |
As for sources of carbohydrate intake, we found a positive, but weak correlation of carbohydrate from staple foods (rs=0.187) (Figure 1C) and noodles (rs=0.231) (Figure 1D) with HbA1c, but no significant correlation of rice (Figure 1E) or bread. Carbohydrate from non-staple foods (rs=0.386), especially soft drinks (rs=0.325) (Figure 1F), was positively and moderately correlated with HbA1c. When we excluded fiber for carbohydrate from noodles and soft drinks, the correlations remained significant (carbohydrate from noodles: rs=0.229, P=0.01; carbohydrate from soft drinks: rs=0.332, P<0.001). When carbohydrate from soft drinks was excluded, the positive correlation of carbohydrate from non-staple foods with HbA1c disappeared (Table 3). No significant correlation was detected for fruits, brewed alcohol, other non-staple foods, or dietary fiber.
In multiple regression analysis with adjustment for total energy, the correlation of total carbohydrate and % carbohydrate with HbA1c remained significant in men (Table 3). The significance remained materially the same for carbohydrate from soft drinks and % carbohydrate from non-staple foods, but the correlations of carbohydrate from staple foods and noodles disappeared after the adjustment. When we excluded fiber from carbohydrate, the results did not materially change: total carbohydrate (crude: β=0.11, P<0.001; energy-adjusted: β=0.10, P<0.001), % carbohydrate (crude: β=0.039, P=0.022; energy-adjusted: β=0.053, P=0.001), carbohydrate from noodles (crude: β=0.09, P=0.061; energy-adjusted: β=0.04, P=0.412), and carbohydrate from soft drinks (crude: β=0.30, P<0.001; energy-adjusted: β=0.27, P<0.001). With adjustment for total energy and age, apart from correlations of carbohydrate from bread (β=0.14, P=0.047) and fruits (β=0.27, P=0.012) with HbA1c, the results were similar (data not shown), although the correlations for these 2 carbohydrate sources were not significant according to Spearman’s correlation coefficients.
Furthermore, the findings did not materially change when total energy intake was replaced by energy intake, excluding energy from alcohol in the multiple regression analysis (data not shown).
Correlations of total carbohydrate and its sources, and other macronutrients with HbA1c in women
In contrast to men, only 4 nutritional variables showed significant positive correlations with HbA1c in women (Table 4; Figure 2). We found positive and weak correlations of total carbohydrate intake (rs=0.251) (Figure 2A) and total energy (rs=0.282), but no correlation of % carbohydrate (Figure 2B). Carbohydrate from staple foods was positively, but weakly correlated (rs=0.266) (Figure 2C) and that from rice was positively and moderately correlated (rs=0.317) (Figure 2D). We did not find any correlations for carbohydrate from soft drinks (Figure 2E) and fruits (Figure 2F), or other nutritional variables. The data of 2 outliers were excluded from the analysis of carbohydrate from fruits. Again, excluding fiber from carbohydrate did not alter the findings for total carbohydrate (rs=0.261, P=0.007), % carbohydrate (rs=0.110, P=0.268), and carbohydrate from rice (rs=0.317, P=0.001).
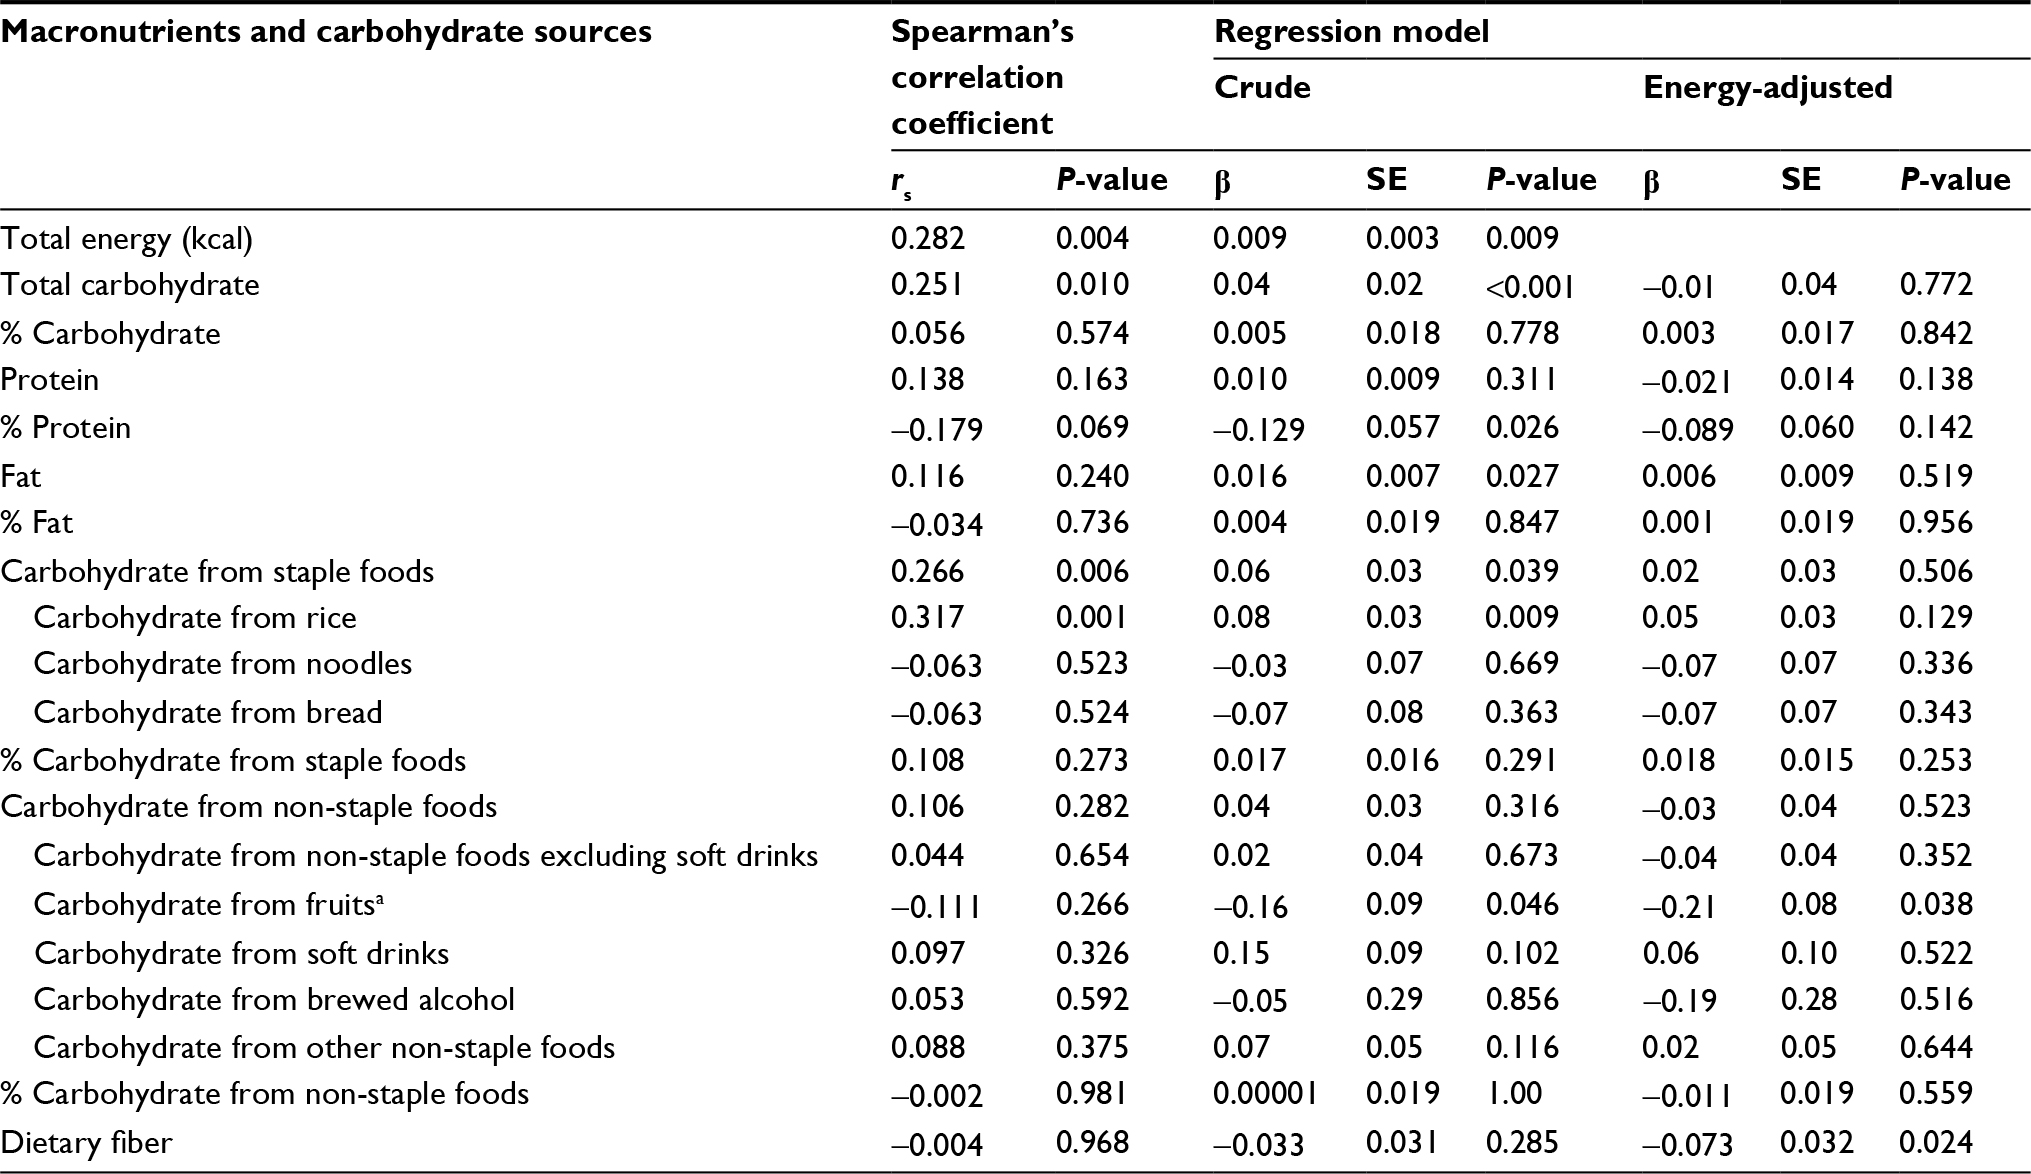 | Table 4 Associations of intakes of carbohydrate and its sources and other macronutrients (g/day) with HbA1c in women: Spearman’s correlation coefficients and regression coefficients (n=104) Notes: Coefficients and their SEs are indicated per 10 g carbohydrate or 10 kcal total energy intake. Units of macronutrients and dietary fiber are g/day except for % macronutrients whose units are %. aData of 2 outliers were excluded from the analysis. Abbreviation: HbA1c, hemoglobin A1c; SE, standard error. |
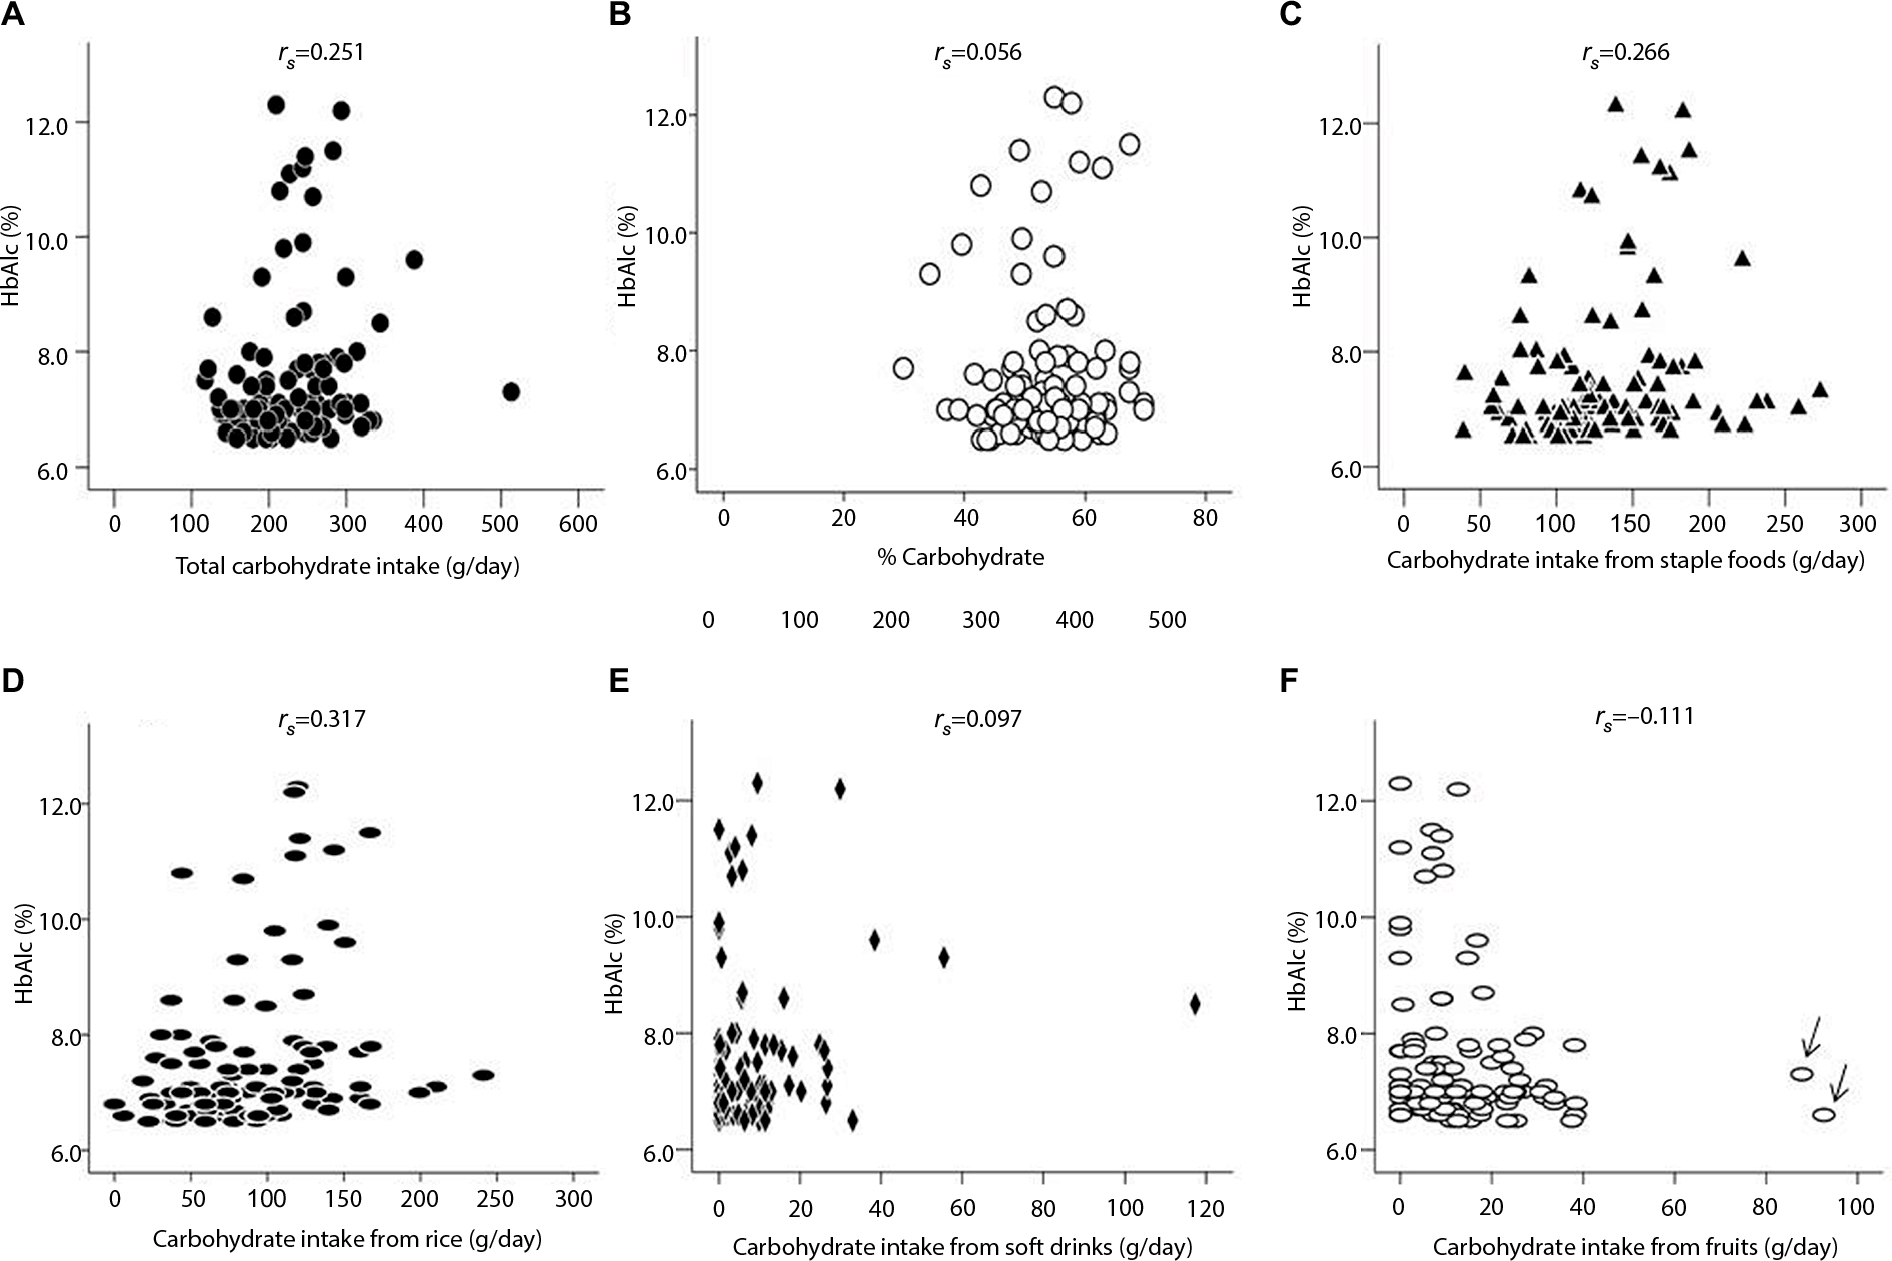 | Figure 2 Correlations of carbohydrate intake and its sources with HbA1c in women. Notes: Closed circles indicate total carbohydrate intake (A) and open circles % carbohydrate (B). Closed triangles indicate carbohydrate from staple foods (C), closed ovals that from rice (D), closed diamonds indicate carbohydrate from soft drinks (E) and open ovals that from fruits (F). Total carbohydrate intake (A) was positively but weakly correlated with HbA1c levels, while there was no correlation for % carbohydrate (B). We also found a positive but weak correlation of carbohydrate from staple foods (C) and a positive and moderate correlation of that from rice (D) with HbA1c, but no correlation for carbohydrates from soft drinks (E) and fruits (F). The data for 2 outliers were excluded from the analysis for carbohydrate from fruits (arrows). Abbreviation: HbA1c, hemoglobin A1c. |
In contrast to men, the statistical significance of the correlations of total carbohydrate intake, and carbohydrate from staple foods and rice disappeared after adjustment for total energy in the multiple regression analysis (Table 4). When we excluded fiber from carbohydrate, the results did not substantially change for total carbohydrate (crude: β=0.05, P=0.034; energy-adjusted: β=−0.01, P=0.969), % carbohydrate (crude: β=0.012, P=0.497; energy-adjusted: β=0.009, P=0.592), and carbohydrate from rice (crude: β=0.08, P=0.009; energy-adjusted: β=0.05, P=0.129). The results were similar with adjustment for total energy and age, or with replacement of total energy with total energy, excluding energy from alcohol in the multiple regression model (data not shown).
Discussion
The current study with 3-day dietary records for assessment of carbohydrate intake among T2DM patients not taking anti-diabetic medication showed that: 1) carbohydrate intake (g/day) was positively correlated with HbA1c, but % carbohydrate was not in both men and women; 2) carbohydrate from noodles and soft drinks, but not from rice, was associated with HbA1c in men, while carbohydrate from rice was associated with HbA1c in women.
The main findings of the current study are consistent with our previous interventional studies2,13–15 as well as many other interventional studies on low-carbohydrate diets.7–10,29 Four previous observational studies from East Asian countries, however, demonstrated no association of carbohydrate intake or % carbohydrate with HbA1c.20–22,24 Another 2 observational studies from the USA and Iran demonstrated inverse correlations of carbohydrate intake or % carbohydrate.23,24 So, why should such a discrepancy exist? In the other studies, 55%–100% of the patients were on OHA and/or insulin compared with 30% of the patients in our previous study14 and none in the current study. Taking anti-diabetic medication leads to underestimation of HbA1c. Another possible explanation is that the food frequency questionnaire (FFQ) or 24-hour recall used in all the previous studies was a less valid means of estimating amounts of carbohydrate intake compared with the dietary records in the current study, although FFQ may be suitable for assessing micronutrients.30,31
It is still being debated whether absolute carbohydrate intake (g/day) or % carbohydrate is a more valid and practical parameter for dietary management in patients with T2DM, particularly for low-carbohydrate diets.5,6 The current study demonstrated that carbohydrate intake was positively correlated with HbA1c, but % carbohydrate was not, in both men and women. Although the association of total carbohydrate with HbA1c may be partly explained by energy intake, the correlation remained significant in men, after adjustment for total energy and age in the multiple regression analysis. In the clinical setting, patients need instructions with specific details like “150 g rice” or “a bowl of rice” (containing about 55 g carbohydrate) and “2 eggs,” rather than 50% energy from carbohydrate (50% carbohydrate) or 20% energy from fat (20% fat), when they follow any type of diet, regardless of whether it is a low-carbohydrate or a low-fat diet. If we use % carbohydrate or % fat in instructions to patients, they need to calculate both total energy and macronutrient intakes, which is complicated and impractical for most patients. For these reasons, we believe that, for making patients understand instructions better, carbohydrate intake (g/day) is more appropriate than % carbohydrate.
Little is known about which of the various carbohydrate-rich foods influence HbA1c levels. Two staple foods, rice and noodles, are the most common sources of carbohydrate in East Asia, including Japan. Large-scale, long-term cohort studies have demonstrated the impact of rice in Japan,32 and that of rice and noodles in China on the incidence of T2DM.33 We have already shown that moderate carbohydrate restriction, mainly of carbohydrate from rice and noodles, led to a remarkable decrease in HbA1c levels in Japanese patients with T2DM.13–15 As rice was still the major source of carbohydrate in the current study, we expected it to have a greater impact on HbA1c; so, it was surprising to see that there was no correlation of rice with HbA1c in men.
Let us consider some possible reasons for this unexpected finding; first is the sex difference. Rice was the leading source of carbohydrate intake in the current study, accounting for ~40% of total carbohydrate intake (men: 42%, women: 39%). We found that, comparing the sexes, men had a higher mean carbohydrate intake (113.2 g/day), but less variation (SD=58.6 g/day) while women had a lower mean carbohydrate intake (89.4 g/day) and greater variation (SD=45.4 g/day). Less variation could possibly have led to the absence of a correlation in men and the reverse in women. Second, short-term interventional studies designed to test a low-carbohydrate versus a low-fat diet have often imposed stricter carbohydrate or energy restrictions on patients, which, as a result, has led to a great discrepancy between interventional and observational studies among free-living patients with T2DM like the current study. Third, almost all interventional studies have not paid attention to sex difference.9,10,12 By focusing on the sex difference in the future, such studies could clarify the precise impact of carbohydrate intake from rice and noodles on HbA1c in East Asian populations.
A lot of observational studies and meta-analyses demonstrated that higher consumption of soft drinks is associated with the development of T2DM.34,35 Also, moderate consumption of soft drinks significantly increased mean 24-hour glucose concentrations in patients with T2DM assessed by continuous glucose monitoring.36 With excess consumption of soft drinks over several months, glycemic control rapidly deteriorates, resulting in the so-called soft drink ketoacidosis.37 To our knowledge, however, there have been few reports of a direct association of carbohydrate intake from soft drinks with HbA1c in free-living patients with T2DM. In the current study, mean carbohydrate intake from soft drinks was very small (19.1 g/day), about one-sixth of the carbohydrate from rice (113.2 g/day) in men, but it had the strongest impact on HbA1c. The association of soft drinks was stronger than that with rice or noodles, and significance remained after adjustment for energy in multiple regression analysis. In contrast, we found no correlation in women. This sex difference can be explained by the greater variation in carbohydrate intake from soft drinks (SD =35.6 g/day) in men. Specifically, in more than three-quarters of the male patients, there was no carbohydrate intake from soft drinks or only a small amount, and they had lower HbA1c levels, but the remaining one-quarter had a greater carbohydrate intake from soft drinks and higher HbA1c levels. In contrast, there was no association found in female patients, probably because of lower mean carbohydrate intake from soft drinks (8.4 g/day) and smaller variation in intake (SD =14.3 g/day).
In the regression analysis with adjustment for total energy, associations of some carbohydrate-rich foods remained significant, but those of others did not. Adjustment by total energy that has been applied in many studies may need to be reconsidered in order to evaluate the precise impact of carbohydrate intake and its sources on glycemic control or HbA1c. The definition of calorie is based on in vitro experiments and, therefore, should not be applied to in vivo situations such as the response from the human body; so, it is more relevant to consider how the human body responds to the digestion and absorption of calorie sources and how they are metabolized.38–40 Regarding glycemic control, it is the intake of carbohydrate itself, not the energy from the carbohydrate, that increases postprandial glucose and stimulates insulin secretion. This is supported by the fact that fat or protein intake hardly increases postprandial blood glucose levels and insulin secretion at all.1,4 Thus, future studies aiming at a more detailed understanding of carbohydrate-rich foods that affect HbA1c level should consider factors such as sex, age, body weight, and social and economic conditions that directly influence daily absolute carbohydrate intake, as well as exercise, insulin secretory capacity, and insulin resistance that directly impact postprandial glucose levels and HbA1c, rather than total energy intake.
Some limitations in this study, however, should be kept in mind when interpreting the findings. First, a 3-day dietary record may be not enough to obtain precise information about carbohydrate intake from non-staple foods because non-staple foods are not consumed as frequently as staple foods. Longer duration dietary records would be necessary. Second, information related to exercise was not available. Third, the average level of % carbohydrate intake in our patients was somewhat lower than that in the general Japanese populations (men: 58%–61%, women: 56%–59%).18 The patients may already have been taking care of carbohydrate intake before their first visit to our clinic and they might have under-reported consumption of carbohydrate-rich foods in the dietary records. However, a previous dietary survey in 1516 Japanese patients with T2DM (mean age: 58 years for men and 59 years for women) using an FFQ reported that the average % carbohydrate was 53% in men and 54% in women,41 which are similar to the percentages in the current study.
Conclusion
We demonstrated positive correlation of carbohydrate intake (g/day), but not % carbohydrate, with HbA1c in patients with T2DM who were not taking OHA or on insulin medication. Furthermore, we determined that carbohydrate sources have an impact on HbA1c: noodles and soft drinks in men and rice in women. Carbohydrate from soft drinks had the greatest impact on HbA1c in men, but not in women. Unexpectedly, carbohydrate from rice had no impact in men. The present findings allow us to reconsider the importance of carbohydrate sources and sex difference in the management of carbohydrate intake in patients with T2DM, and warrant interventional studies on moderate low-carbohydrate diets that focus on sources of carbohydrate in order to efficiently decrease HbA1c levels in patients with T2DM.
Acknowledgments
The authors would like to thank the nurses at Haimoto Clinic for their assistance and excellent patient care. This study was partly supported by a grant from Chukyo Longevity Medical Research and Promotion Foundation (grant number: 20160205-19).
Author contributions
HH designed the study. HH and SW participated in data collection. HH and KW performed the statistical analysis and all authors interpreted the data. HH wrote the draft, and MK and KW critically revised the manuscript. All authors contributed toward data analysis, drafting and revising the paper and agree to be accountable for all aspects of the work.
Disclosure
The authors report no conflicts of interest in this work.
References
Gannon MC, Nuttall FQ. Effect of a high-protein, low-carbohydrate diet on blood glucose control in people with type 2 diabetes. Diabetes. 2004;53(9):2375–2382. | ||
Haimoto H, Sasakabe T, Umegaki H, Wakai K. Acute metabolic responses to a high-carbohydrate meal in outpatients with type 2 diabetes treated with a low-carbohydrate diet: a crossover meal tolerance study. Nutr Metab (Lond). 2009;6:52. | ||
Jenkins DJ, Wolever TM, Wong GS, et al. Glycemic responses to foods: possible differences between insulin-dependent and noninsulin-dependent diabetics. Am J Clin Nutr. 1984;40(5):971–981. | ||
Gannon MC, Nuttall FQ. Control of blood glucose in type 2 diabetes without weight loss by modification of diet composition. Nutr Metab (Lond). 2006;3:16. | ||
Evert AB, Boucher JL, Cypress M, et al. Nutrition therapy recommendations for the management of adults with diabetes. Diabetes Care. 2013;36(11):3821–3842. | ||
Feinman RD. Fad diets in the treatment of diabetes. Curr Diab Rep. 2011;11(2):128–135. | ||
Tay J, Luscombe-Marsh ND, Thompson CH, et al. Comparison of low- and high-carbohydrate diets for type 2 diabetes management: a randomized trial. Am J Clin Nutr. 2015;102(4):780–790. | ||
Westman EC, Yancy WS Jr, Mavropoulos JC, Marquart M, McDuffie JR. The effect of a low-carbohydrate, ketogenic diet versus a low-glycemic index diet on glycemic control in type 2 diabetes mellitus. Nutr Metab (Lond). 2008;5:36. | ||
Hu T, Mills KT, Yao L, et al. Effects of low-carbohydrate diets versus low-fat diets on metabolic risk factors: a meta-analysis of randomized controlled clinical trials. Am J Epidemiol. 2012;176(Suppl 7): S44–S54. | ||
Ajala O, English P, Pinkney J. Systematic review and meta-analysis of different dietary approaches to the management of type 2 diabetes. Am J Clin Nutr. 2013;97(3):505–516. | ||
Dyson P. Low carbohydrate diets and type 2 diabetes: what is the latest evidence? Diabetes Ther. 2015;6(4):411–424. | ||
van Wyk HJ, Davis RE, Davies JS. A critical review of low-carbohydrate diets in people with Type 2 diabetes. Diabet Med. 2016;33(2):148–157. | ||
Haimoto H, Iwata M, Wakai K, Umegaki H. Long-term effects of a diet loosely restricting carbohydrates on HbA1c levels, BMI and tapering of sulfonylureas in type 2 diabetes: a 2-year follow-up study. Diabetes Res Clin Pract. 2008;79(2):350–356. | ||
Haimoto H, Sasakabe T, Kawamura T, Komeda M, Umegaki H, Wakai K. Three-graded stratification of carbohydrate restriction by level of baseline hemoglobin A1c for type 2 diabetes patients with a moderate low-carbohydrate diet. Nutr Metab (Lond). 2014;11:33. | ||
Haimoto H, Sasakabe T, Wakai K, Umegaki H. Effects of a low-carbohydrate diet on glycemic control in outpatients with severe type 2 diabetes. Nutr Metab (Lond). 2009;6:21. | ||
Sasakabe T, Haimoto H, Umegaki H, Wakai K. Association of decrease in carbohydrate intake with reduction in abdominal fat during 3-month moderate low-carbohydrate diet among non-obese Japanese patients with type 2 diabetes. Metabolism. 2015;64(5):618–625. | ||
Oza-Frank R, Cheng YJ, Narayan KM, Gregg EW. Trends in nutrient intake among adults with diabetes in the United States: 1988–2004. J Am Diet Assoc. 2009;109(7):1173–1178. | ||
National Health and Nutrition Survey of Japan 2016. Available from: http://www.mhlw.go.jp/stf/houdou/0000177189.html. Accessed February 22, 2018. | ||
Jiang J, Qiu H, Zhao G, et al. Dietary fiber intake is associated with HbA1c level among prevalent patients with type 2 diabetes in Pudong New Area of Shanghai, China. PLoS One. 2012;7(10):e46552. | ||
Kamada C, Yoshimura H, Okumura R, et al; Japanese Elderly Diabetes Intervention Trial Study Group. Optimal energy distribution of carbohydrate intake for Japanese elderly patients with type 2 diabetes: the Japanese Elderly Intervention Trial. Geriatr Gerontol Int. 2012;12(Suppl 1):41–49. | ||
Kang HM, Kim DJ. Total energy intake may be more associated with glycemic control compared to each proportion of macronutrients in the korean diabetic population. Diabetes Metab J. 2012;36(4):300–306. | ||
Lee H, Kim M, Daly BJ. Nutritional patterns of Korean diabetic patients: an exploratory study. Int Nurs Rev. 2008;55(4):442–446. | ||
Shadman Z, Khoshniat M, Poorsoltan N, et al. Association of high carbohydrate versus high fat diet with glycated hemoglobin in high calorie consuming type 2 diabetics. J Diabetes Metab Disord. 2013; 12:27. | ||
Xu J, Eilat-Adar S, Loria CM, et al. Macronutrient intake and glycemic control in a population-based sample of American Indians with diabetes: the Strong Heart Study. Am J Clin Nutr. 2007;86(2):480–487. | ||
American Diabetes Association. Executive summary: standards of medical care in diabetes-2012. Diabetes Care. 2012;35(Suppl 1): S4–S10. | ||
Japan Diabetes Society. Treatment Guide for Diabetes. Tokyo, Japan: BUNKODO. Co., Ltd; 2007. | ||
Muniyappa R, Lee S, Chen H, Quon MJ. Current approaches for assessing insulin sensitivity and resistance in vivo: advantages, limitations, and appropriate usage. Am J Physiol Endocrinol Metab. 2008;294(1):E15–E26. | ||
Kashiwagi A, Kasuga M, Araki E, et al. International clinical harmonization of glycated hemoglobin in Japan: From Japan Diabetes Society to National Glycohemoglobin Program values. J Diabetes Investig. 2012;3(1):39–40. | ||
Accurso A, Bernstein RK, Dahlqvist A, et al. Dietary carbohydrate restriction in type 2 diabetes mellitus and metabolic syndrome: time for a critical appraisal. Nutr Metab (Lond). 2008;5:9. | ||
Ogawa K, Tsubono Y, Nishino Y, et al. Inter-and intra-individual variation of food and nutrient consumption in a rural Japanese population. Eur J Clin Nutr. 1999;53(10):781–785. | ||
Tokudome S, Imaeda N, Tokudome Y, et al. Relative validity of a semi-quantitative food frequency questionnaire versus 28 day weighed diet records in Japanese female dietitians. Eur J Clin Nutr. 2001;55(9):735–742. | ||
Nanri A, Mizoue T, Noda M, et al. Rice intake and type 2 diabetes in Japanese men and women: the Japan Public Health Center-based Prospective Study. Am J Clin Nutr. 2010;92(6):1468–1477. | ||
Zuniga YL, Rebello SA, Oi PL, et al. Rice and noodle consumption is associated with insulin resistance and hyperglycaemia in an Asian population. Br J Nutr. 2014;111(6):1118–1128. | ||
Greenwood DC, Threapleton DE, Evans CE, et al. Association between sugar-sweetened and artificially sweetened soft drinks and type 2 diabetes: systematic review and dose-response meta-analysis of prospective studies. Br J Nutr. 2014;112(5):725–734. | ||
Imamura F, O’Connor L, Ye Z, et al. Consumption of sugar sweetened beverages, artificially sweetened beverages, and fruit juice and incidence of type 2 diabetes: systematic review, meta-analysis, and estimation of population attributable fraction. BMJ. 2015;351:h3576. | ||
Manders RJ, Pennings B, Beckers CP, Aipassa TI, van Loon LJ. Prevalence of daily hyperglycemia in obese type 2 diabetic men compared with that in lean and obese normoglycemic men: effect of consumption of a sucrose-containing beverage. Am J Clin Nutr. 2009;90(3):511–518. | ||
Tanaka K, Moriya T, Kanamori A, Yajima Y. Analysis and a long-term follow up of ketosis-onset Japanese NIDDM patients. Diabetes Res Clin Pract. 1999;44(2):137–146. | ||
Apovian CM. The low-fat, low-carb debate and the theory of relativity. Am J Clin Nutr. 2015;102(4):719–720. | ||
Gardner CD. Tailoring dietary approaches for weight loss. Int J Obes Suppl. 2012;2(Suppl 1):S11–S15. | ||
Torjesen I. “Corrupt” dietary guidelines must be rewritten to tackle obesity and diabetes, report warns. BMJ. 2016;353:i2898. | ||
Horikawa C, Yoshimura Y, Kamada C, et al. Dietary intake in Japanese patients with type 2 diabetes: Analysis from Japan Diabetes Complications Study. J Diabetes Investig. 2014;5(2):176–187. |
 © 2018 The Author(s). This work is published and licensed by Dove Medical Press Limited. The full terms of this license are available at https://www.dovepress.com/terms.php and incorporate the Creative Commons Attribution - Non Commercial (unported, v3.0) License.
By accessing the work you hereby accept the Terms. Non-commercial uses of the work are permitted without any further permission from Dove Medical Press Limited, provided the work is properly attributed. For permission for commercial use of this work, please see paragraphs 4.2 and 5 of our Terms.
© 2018 The Author(s). This work is published and licensed by Dove Medical Press Limited. The full terms of this license are available at https://www.dovepress.com/terms.php and incorporate the Creative Commons Attribution - Non Commercial (unported, v3.0) License.
By accessing the work you hereby accept the Terms. Non-commercial uses of the work are permitted without any further permission from Dove Medical Press Limited, provided the work is properly attributed. For permission for commercial use of this work, please see paragraphs 4.2 and 5 of our Terms.