")
Back to Journals » Neuropsychiatric Disease and Treatment » Volume 14
The impact of age of onset on amygdala intrinsic connectivity in major depression
Authors Clark DL, Konduru N, Kemp A, Bray S, Brown EC , Goodyear B, Ramasubbu R
Received 28 June 2017
Accepted for publication 11 October 2017
Published 22 January 2018 Volume 2018:14 Pages 343—352
DOI https://doi.org/10.2147/NDT.S145042
Checked for plagiarism Yes
Review by Single anonymous peer review
Peer reviewer comments 2
Editor who approved publication: Dr Roger Pinder
Darren L Clark,1–4 Nithya Konduru,1 Anne Kemp,5 Signe Bray,6–8 Elliot C Brown,1–4 Bradley Goodyear,1,2,4,6 Rajamannar Ramasubbu1–4
1Department of Psychiatry, 2Department of Clinical Neuroscience, 3Mathison Centre for Mental Health Research and Education, 4Hotchkiss Brain Institute, University of Calgary, Calgary, 5School of Medicine, University of Alberta, Edmonton, 6Department of Radiology, 7Department of Pediatrics, University of Calgary, 8Child and Adolescent Imaging Research Program, Alberta Children’s Hospital, Calgary, AB, Canada
Background: Early-onset major depressive disorder (EO-MDD), beginning during childhood and adolescence, is associated with more illness burden and a worse prognosis than adult-onset MDD (AO-MDD), but little is known about the neural features distinguishing these subgroup phenotypes. Functional abnormalities of the amygdala are central to major depressive disorder (MDD) neurobiology; therefore, we examined whether amygdala intrinsic connectivity (IC) can differentiate EO-MDD from AO-MDD in a cohort of adult MDD patients.
Subjects and methods: Twenty-one EO-MDD (age of onset ≤18 years), 31 AO-MDD patients (age of onset ≥19 years), and 19 healthy controls (HCs) underwent resting-state functional magnetic resonance imaging (7 minutes). Amygdala seed-based resting-state functional connectivity was compared between groups.
Results: AO-MDD patients showed loss of inverse left amygdala–left dorsolateral prefrontal cortex IC and increased inverse left amygdala–left inferior parietal IC, compared to both HCs and EO-MDD. EO-MDD showed a switch from inverse to positive IC with right dorsomedial prefrontal cortex, compared to HCs and AO-MDD. This effect was removed when we controlled for illness burden.
Conclusion: Alterations in amygdala IC with the default-mode network were specifically related to EO-MDD, whereas amygdala IC with executive cognitive control regions was preferentially disrupted in AO-MDD. Increased illness burden, an important clinical marker of EO-MDD, accounted for its specific effects on amygdala IC. Brain imaging has the potential for validation of clinical subtypes and can provide markers of prognostic value in MDD patients.
Keywords: major depressive disorder, onset age, resting-state functional connectivity, functional magnetic resonance imaging, biomarker, amygdala
Introduction
Major depressive disorder (MDD) is a heterogeneous condition with variations in etiology, course, and treatment response. Mounting evidence indicates that the onset of MDD during childhood and adolescence (EO-MDD) results in a distinctive phenotype in adulthood. Clinically, EO-MDD is associated with greater familial risk, more illness burden, and a greater risk of suicide and psychiatric comorbidity, compared to adult-onset MDD (AO-MDD).1,2 Considerable efforts have been taken in recent years to develop blood and brain imaging biomarkers to classify MDD subtypes on the basis of age of onset.3–6 Several structural neuroimaging studies have revealed differential volumetric changes in EO-MDD compared to AO-MDD, in support of this subtype classification of MDD. The volume of prefrontal and limbic regions, corpus callosum morphology, and regional cortical thickness patterns were all found to differ in early-onset compared to adult-onset depression.4–7
The study of functional network changes in childhood or adolescent MDD and those described in adults with MDD has revealed similarities as well as some differences. A recent systematic review of 28 functional imaging studies in youth depression indicated elevated activity in medial network regions including anterior cingulate cortex (ACC), ventral medial prefrontal cortex (VMPFC), orbitofrontal cortex, and amygdala, similar to observations in adult MDD.8 Abnormalities in cognitive control regions/networks (dorsolateral prefrontal cortex [DLPFC], ventrolateral prefrontal cortex, dorsal ACC) were less frequently observed in youth MDD, compared to adult MDD, suggesting a difference in the domain of cognitive control.8 Given that childhood and adolescent MDD groups consist of patients predominantly within their first episode, whereas adult MDD patients predominantly have recurrent or chronic depression, prefrontal alterations consistently observed in adult MDD have been partly attributed to cognitive deficits emerging from recurrent episodes (illness burden). Longitudinal studies would be ideal to establish the relative contribution of illness burden and developmental effects on brain abnormalities related to the course of EO-MDD and AO-MDD. In the absence of such data, cross-sectional imaging studies of EO-MDD vs AO-MDD in an adult MDD cohort could also provide differential imaging markers/prognostic markers of these two subtypes.
The amygdala plays a vital role in both bottom-up and top-down emotional regulation9–11 and is central to both youth and adult MDD pathology.11–15 Considering the developmental changes in amygdala functional intrinsic connectivity (IC) from childhood to adulthood,16 amygdala-based networks could potentially distinguish MDD patients on the basis of age of onset. The few studies that have examined amygdala functional IC in childhood and adolescent MDD patients have shown reduced IC within several brain networks including the executive control network (prefrontal/parietal cortex),12,17 limbic network (hippocampus, parahippocampus, brain stem),13 and the saliency network (insula).17,18 In adult MDD patients with adolescent onset, reduced amygdala IC to ventral ACC and VMPFC was related to multiple episodes.19 Reduced overall amygdala IC is consistent with previous findings in adults with MDD.14,20–23 Amygdala functional IC might be expected to differ between youth and adult MDD, based on developmental theories.16 The observed absence of differences could be partly explained by the small number of studies, especially in childhood and adolescent cohorts, small sample size, and the lack of direct comparative studies between the two groups.
In adult MDD, literature regarding amygdala IC with prefrontal regions has been mixed. Studies have reported reduced IC with medial prefrontal cortex (MPFC)21–23 and ventrolateral prefrontal cortex,14,20 reduced inverse IC with DMPFC,24 and no abnormalities in IC with PFC, compared to healthy controls (HCs).25 Variability due to MDD subtypes, perhaps related to age of onset, might obscure the revelation of reliable biomarkers. We sought to determine whether amygdala IC could differentiate early-onset vs adult-onset in adult patients with MDD and validate the subtypes on the basis of age of onset. We also examined the impact of potential confounds such as illness burden (number of episodes, duration of illness), which typically vary with the age of onset of depression. Considering that prefrontal and amygdala regions show distinctive trajectories of development, we predicted differential prefrontal–amygdala IC between early depression onset (onset at ≤18 years of age) and adult onset (onset >18 years of age) in adult patients with MDD.
Subjects and methods
Participants
Fifty-five subjects with unipolar MDD, aged 19–58 years (33 females: 22 males) and 19 HCs aged 20–52 years (11 females: 8 males) were recruited through advertisements on the university campus, mental health clinics, and tertiary care centers. Participants were retrospectively divided into groups based on age of MDD onset. EO-MDD was defined as onset at age 18 or earlier. This division was used to capture childhood and adolescent onset26 and to be congruent with our previous reports defining structural alterations in EO-MDD.4–6 Mean MDD age of onset was 24.96±10.64 years; 21 of the patients had experienced onset at 18 years or earlier (14.3±2.5 years; EO-MDD) and 34 had onset after 18 years of age (31.53±8.1 years; AO-MDD). Age of onset was determined by self-report. Specifically, the interviewing psychiatrist (RR) asked participants at what age they began to experience the constellation of symptoms that would fulfill the criteria for MDD.
All patients met the Diagnostic Statistical Manual (DSM-IV) criteria for MDD, as determined by the Structured Clinical Interview for DSM-IV Axis I Disorders. A score of 18 or higher on the 17-item Hamilton rating scale for depression was necessary for inclusion in our study. Subjects free of psychotropic medications for at least 3–4 weeks before enrollment were included. Presenting with Axis I disorders other than MDD, borderline personality disorder, medical or neurologic disorders, or severe risk for suicide were reasons for exclusion. HCs were screened with the non-patient version of the Structured Clinical Interview for DSM-IV Axis I Disorders to ensure they or their family members did not have an Axis I disorder. Ethics approval was obtained from the Conjoint Health Research Ethics Board at the University of Calgary prior to the study, and all participants provided informed consent.
Magnetic resonance imaging (MRI) data acquisition and preprocessing
Two 3.5-minute sessions of eye open resting-state functional MRI (fMRI) were acquired per subject, as well as a T1-weighted structural MRI. The fMRI data were acquired with a single-shot gradient-recalled, echo planar imaging sequence (115 volumes, echo time/repetition time (TR/TE) =2,000/30 ms, 24×24 cm field of view, flip angle =65°, 30 slices of 4 mm thickness). The T1-weighted image was acquired with the following parameters: TR =9.2 ms, TE = minimum, flip angle =20°, 180 slices of thickness 1 mm, with 1 mm in-plane resolution. Scans were obtained using a 3 T General Electric MR scanner (Signa VHi; General Electric Healthcare, Waukesha, WI, USA) equipped with an eight-channel, phased-array head coil, or using Discovery MR 750, a 3 T General Electric MR scanner, with the same parameters and protocol. Sixty-three subjects were scanned using the first scanner, and the remaining 11 with the latter, due to scanner replacement.
Preprocessing of fMRI sequences (FMRIB Software Library [FSL]) included brain extraction, spatial smoothing, slice timing correction, motion correction, and temporal high-pass filtering. Head movements were corrected with MCFLIRT (intramodal motion correction tool). Spatial smoothing was performed using a Gaussian filter with a full-width at half maximum of 6 mm, while slice timing correction used Hanning-windowed sinc interpolation to shift the time series by a fraction of the TR relative to the midpoint of the TR period. Also, 100 s high-pass temporal filter was applied. Using FMRIB Linear Image Registration Tool, fMRI images were co-registered to subject’s T1 anatomic data and then normalized to the Montreal Neurological Institute template.
The FSL View Structures Toolbox was used to locate the left and right amygdala on a Montreal Neurological Institute standard brain and create region of interest masks, which were then registered to native space. Mean time courses for each region of interest were extracted from the preprocessed resting-state fMRI data.
fMRI analysis and statistics
Resting-state fMRI analysis was performed with FSL FEAT using a general linear model. FMRIB’s improved linear model was used to analyze time series data from an individual session. For each of the left and right amygdala, a regression model was set up with the amygdala time series as a predictor, using six motion parameters and the mean BOLD time series of white matter and cerebral spinal fluid regions as nuisance covariates. Signals that occur across the whole brain simultaneously primarily reflect non-neural interference in the signal due to external factors such as head movement.27,28 Therefore, global regression using a whole brain mask time series as a covariate of non-interest was also performed to reduce spurious positive correlations and increase signal to noise ratio.
Higher-level analysis compared three groups (EO-MDD, AO-MDD, and HC) using one-way analysis of covariance (ANCOVA) with FMRIB’s Local Analysis of Mixed Effects. Clinical characteristics that were determined as variables of non-interest (ie, age, sex) were used as group-level covariates. In order to account for scanner-related variability, scanner was also used as a covariate of non-interest in the model. We were interested to characterize amygdala IC differences in EO-MDD, AO-MDD, and HCs, which included inherent differences in illness burden between the MDD groups; therefore, our main analysis did not control for these variables. Next, we performed correlations between amygdala IC (mean z-statistic values) extracted at the individual level, from significant group clusters, and number of episodes as well as illness duration, in order to explore if any group finding was related to illness burden.
In order to further investigate the impact of illness burden, we performed an exploratory follow-up analysis while controlling for illness burden (illness duration and number of episodes used as covariates of non-interest in the model). Due to inherent lateral differences between the right and left amygdala, the two were analyzed separately from one another.11,29
Our analyses generated z-statistic images with a voxel-wise statistical threshold of z=2.7 (p=0.01), wherein clusters were deemed significant at an false discovery rate corrected p<0.05, as determined by Monte Carlo Simulation. To identify differences between groups, we extracted individual mean amygdala IC (z-statistic values) from each significant group cluster and performed post hoc pairwise contrasts.
Results
Demographics
Clinical characteristics of patients in each group can be found in Table 1. Age, age of MDD onset, and number of episodes significantly differed between groups.
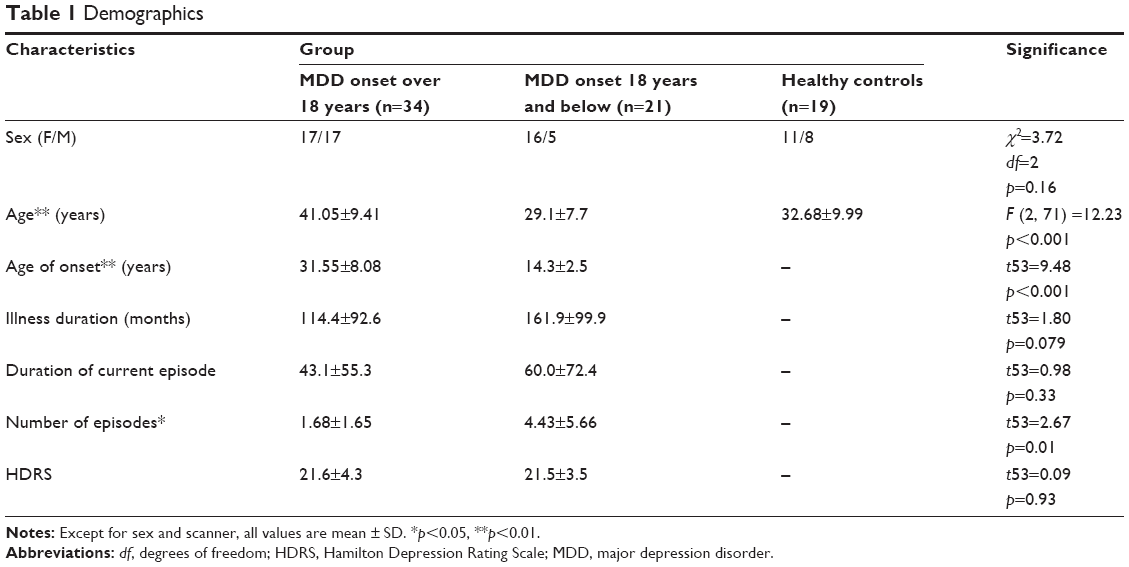 | Table 1 Demographics |
Effect of major depression onset on amygdala connectivity
In our main analysis considering age, sex, and scanner as covariates of non-interest, ANCOVA revealed a significant main effect of group on the left amygdala IC with clusters in the left DLPFC (Table 2; Figure 1A), the inferior parietal (Table 2; Figure 1B), and the right MPFC (Table 2; Figure 1C). The right amygdala showed group differences in IC with left inferior parietal cortex (Table 2). Amygdala–DLPFC IC did not correlate with any indices of illness burden, whereas amygdala–left parietal IC correlated with illness duration (r=0.286, p=0.048), right amygdala–left inferior parietal IC correlated with both illness duration (r=0.269, p=0.047) and number of episodes (r=0.297, p=0.028), and amygdala–right MPFC IC correlated with illness duration (r=0.306, p=0.023) across patients.
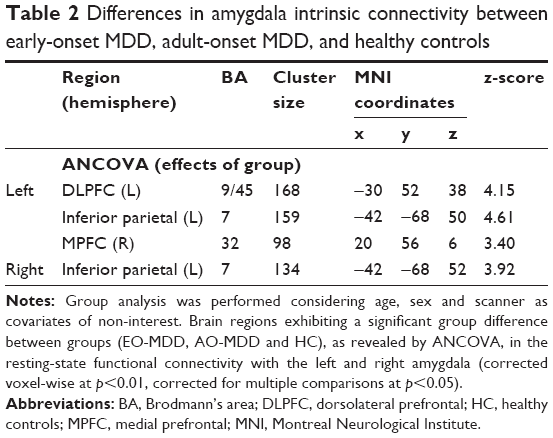 | Table 2 Differences in amygdala intrinsic connectivity between early-onset MDD, adult-onset MDD, and healthy controls |
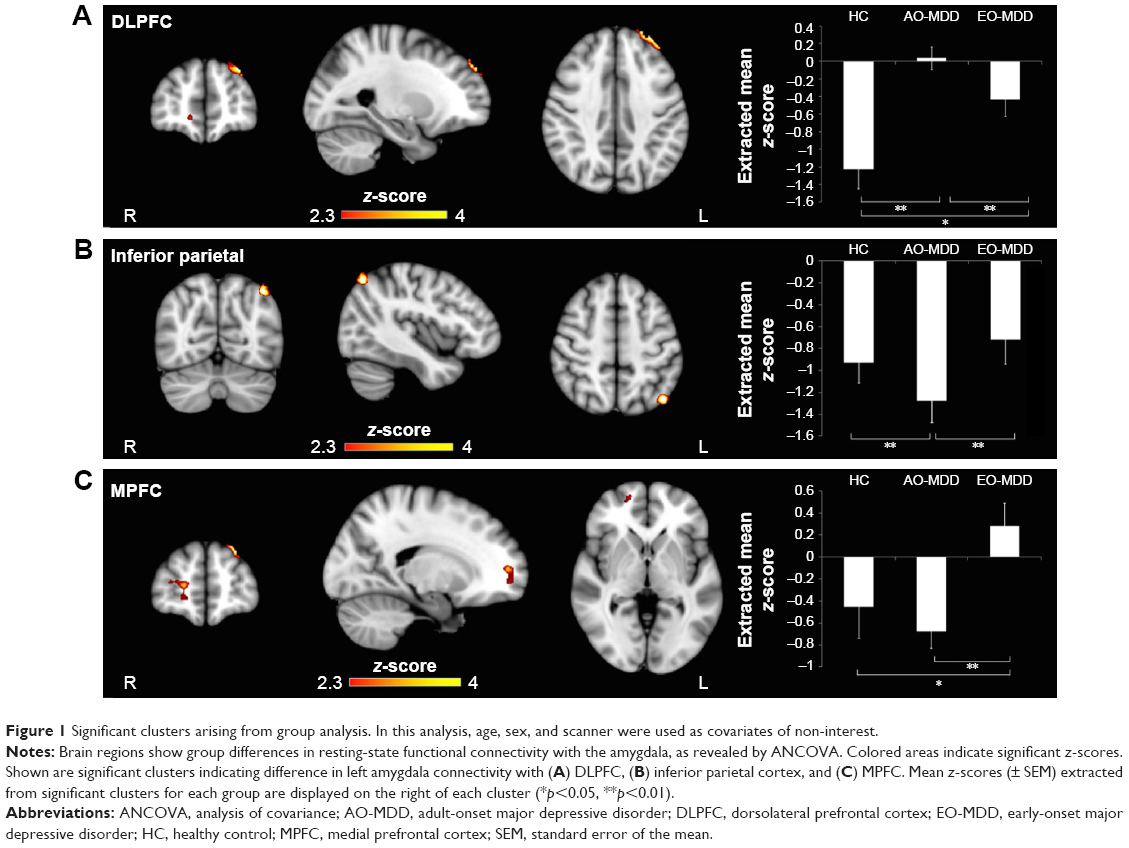 | Figure 1 Significant clusters arising from group analysis. In this analysis, age, sex, and scanner were used as covariates of non-interest. |
When illness duration and number of episodes were accounted for in the model, ANCOVA revealed a slightly altered pattern of amygdala IC (Table 3; Figure 2). Group differences were maintained in left amygdala IC with left DLPFC (Table 3; Figure 2A) and right amygdala–left inferior parietal IC (Table 3; Figure 2B), but not in the amygdala–MPFC system. Interestingly, when we controlled for illness burden, we observed a new effect of group on the left amygdala IC with the right inferior temporal cortex (Table 3; Figure 2C). As this group difference only emerged when we controlled for illness duration and number of episodes, we wondered whether illness burden was masking the effect in the first analysis. Despite this, we did not see any correlation of raw amygdala–inferior temporal IC and indices of illness burden.
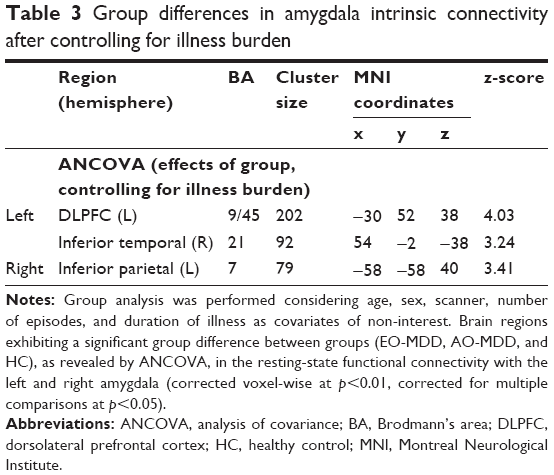 | Table 3 Group differences in amygdala intrinsic connectivity after controlling for illness burden |
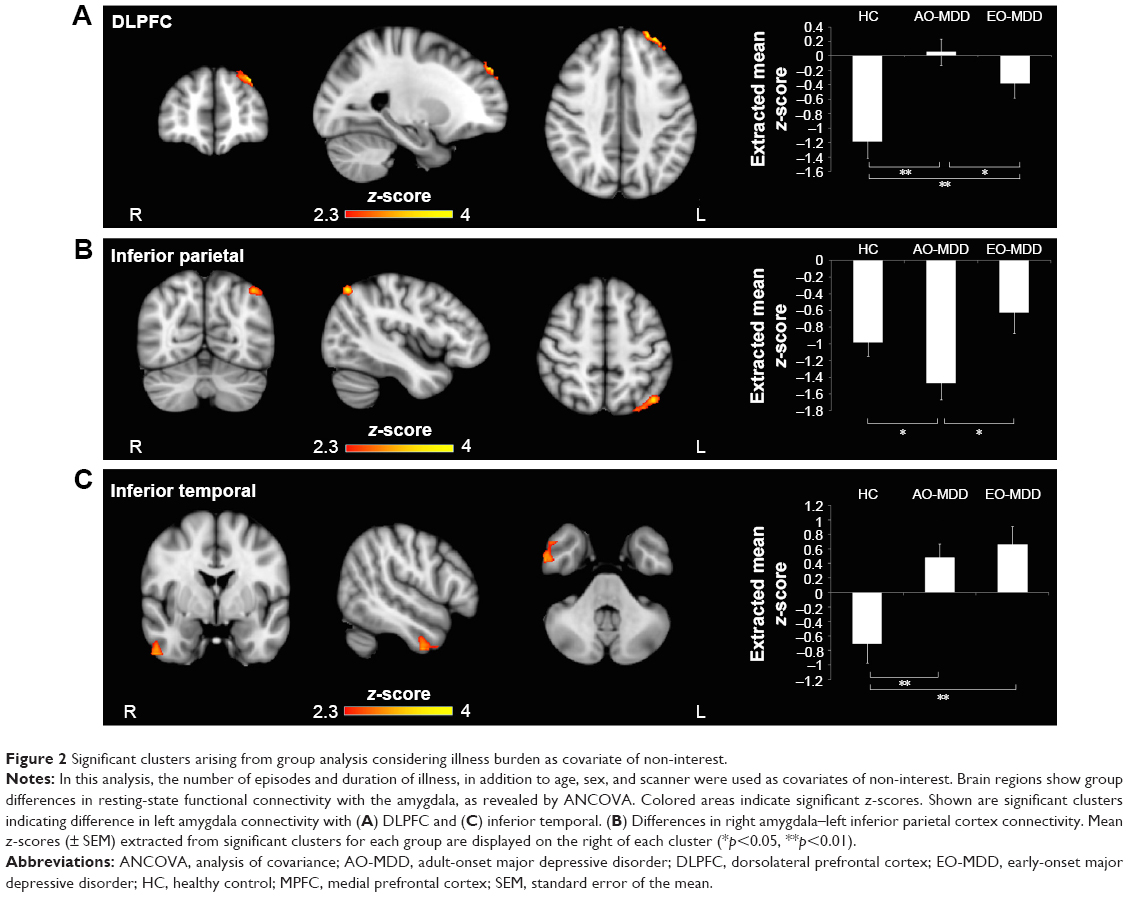 | Figure 2 Significant clusters arising from group analysis considering illness burden as covariate of non-interest. |
Pairwise contrasts
Amygdala–dorsolateral prefrontal connectivity
Post hoc analysis of extracted mean z-statistic values revealed that differences in left amygdala–left DLPFC IC (Figure 1A) were driven by a highly significant loss of inverse IC in AO-MDD compared to HC (mean z-statistic =+0.06 vs −1.20, respectively; p<0.01) and EO-MDD patients (mean z-statistic =+0.06 vs −0.43, respectively; p<0.01). EO-MDD also had significant reduction in amygdala-DLPFC IC, compared to HC (mean z-statistic=−0.43 vs −1.20, respectively; p=0.02).
When we controlled for illness duration and number of episodes, we observed that differences in left amygdala–left DLPFC IC (Figure 2A) were similarly driven by a loss of inverse IC in AO-MDD compared to HC (mean z-statistic =+0.05 vs −1.18, respectively; p<0.01) and EO-MDD patients (mean z-statistic =+0.05 vs −0.38, respectively; p<0.01). EO-MDD also still had significant reduction in amygdala–DLPFC IC, compared to HC (mean z-statistic =−0.38 vs −1.18, respectively; p<0.01).
Amygdala–inferior parietal cortex connectivity
Group differences in the left amygdala–left inferior parietal cortex IC (Figure 1B) were driven by increased inverse IC in AO-MDD patients compared to both HCs (mean z-statistic =−1.28 vs −0.93, respectively; p<0.01) and EO-MDD patients (mean z-statistic =−1.28 vs −0.72, respectively; p<0.01).
Similar to the left amygdala, group differences in the right amygdala–left inferior parietal cortex IC were driven by an increased inverse IC in AO-MDD patients compared to both HCs (mean z-statistic =−1.36 vs −0.96, respectively; p<0.01) and EO-MDD patients (mean z-statistic =−1.36 vs −0.74, respectively; p<0.01). When illness burden was controlled for, group differences in right amygdala IC with the left inferior parietal cortex (Figure 2B) were driven by increased inverse IC in AO-MDD patients compared to both HCs (mean z-statistic =−1.47 vs −0.98, respectively; p<0.02) and EO-MDD patients (mean z-statistic =−1.47 vs −0.63, respectively; p=0.03).
Amygdala–medial prefrontal connectivity
Group differences in left amygdala–right MPFC IC (Figure 1C) were driven by a switch from inverse to positive IC in EO-MDD patients, compared to both AO-MDD patients (mean z-statistic =+0.28 vs −0.67, respectively; p<0.01) and HCs (mean z-statistic =+0.28 vs −0.45, respectively; p<0.02). Left amygdala–MPFC IC were not significantly different from each other in HCs and AO-MDD. Controlling for illness burden completely removed any significant effect of group on amygdala–MPFC IC.
Amygdala–inferior temporal connectivity
The group effect observed when illness burden was accounted for in the model (Figure 2C) was driven by a switch from inverse to positive left amygdala–right temporal cortex IC in both AO-MDD patients, compared to HCs (mean z-statistic =+0.49 vs −0.70; p<0.01) and EO-MDD patients, compared to HCs (mean z-statistic =+0.66 vs −0.70; p<0.01). Left amygdala–temporal IC were not significantly different from each other in EO-MDD and AO-MDD.
Discussion
In this study, we report that functional IC of the amygdala can differentiate between EO-MDD and AO-MDD in a cohort of adult MDD patients vs HCs. As predicted, AO-MDD and EO-MDD showed notable differences in amygdala IC with prefrontal regions. Interestingly, EO-MDD–associated abnormalities in amygdala-DMPFC IC were related to illness burden, whereas AO-MDD–associated amygdala–DLPFC changes were independent of illness burden. This implicates a change in this circuit, related specifically to onset age in AO-MDD. Further, significant abnormalities were observed in amygdala IC with left inferior parietal cortex in AO-MDD. It is possible that the abnormal IC with executive control regions (DLPFC, inferior parietal) may be specific to AO-MDD. These findings suggest that alterations in amygdala IC with the DMPFC may represent impaired automatic emotional regulation abnormalities and underlie the poor prognosis associated with EO-MDD subgroup, whereas amygdala IC with executive cognitive control regions may represent impaired effortful top-down emotional regulation in AO-MDD. Brain imaging markers have the potential for validation of clinical subtypes of MDD relating to age of onset and illness prognosis.
Amygdala IC to lateral prefrontal/parietal regions and depression onset
In healthy people at rest, the amygdala has significant inverse IC with dorsal prefrontal regions,29,30 suggesting the functional significance of inhibitory control of DLPFC over amygdala. Our findings of a loss of negative IC with DLPFC in AO-MDD can be interpreted as a sign of impaired top-down regulation of the amygdala by DLPFC, which is consistent with the current network models of depression.31,32 The inferior parietal cortex is involved in controlling the response to emotional stimuli.33 The observed increase in negative IC of amygdala with inferior parietal cortex may suggest a compensatory mechanism, perhaps attempting to counteract lower inhibition of DLPFC on amygdala or an overactive amygdala. Increased negative amygdala–parietal IC was partly related to illness burden in MDD patients, given the fact that controlling for illness burden only removed this effect on the left side. This finding of a lateralized effect of illness burden on the amygdala–parietal circuit has not been previously reported in MDD and needs further evaluation. Abnormalities in amygdala–lateral PFC/inferior parietal IC were much stronger in AO-MDD than EO-MDD and could not be completely explained by the differences in illness burden; therefore, interaction of amygdala with executive network regions could be a specific imaging marker for AO-MDD.
Amygdala IC to medial prefrontal and depression onset
Increased IC of left amygdala–left MPFC was observed in EO-MDD, compared to AO-MDD and HC. Controlling for illness burden was sufficient to completely remove this disruption in EO-MDD. Previous work showed decreased IC between amygdala and MPFC among MDD adults with multiple episodes, compared with MDD adults with a single episode and HCs, implicating the effect of illness burden on this circuit.19 Interestingly, they found lower IC was correlated with earlier age of onset among MDD patients with multiple episodes, although covariation of the age of first onset did not remove the effect of episode on the amygdala IC with the medial frontal cortex. This suggests that differences may be unrelated to age of onset, per se, in this work. Furthermore, the previous study sample differed from ours in that it was relatively younger, less severe in symptomatology, had a lower average age of onset, and included remitted MDD subjects along with actively depressed patients. Despite differences in the direction of IC changes and precise regional locations within PFC, both studies demonstrated an abnormality in IC between amygdala and the anterior region of default mode network, relating to illness burden and early onset of age, which requires further investigation.
From a functional perspective, the observed increased IC could be considered as a compensatory or pathologic mechanism. The amygdala–VMPFC circuit plays an important role in automatic emotional regulation abnormalities observed during depressive illness.10 If lower IC is inferred as causing disruption to the regulatory role of VMPFC on amygdala, then the increased IC observed in this study could be considered a failed compensatory mechanism of emotional regulation. Indeed, recent work showed that youth with MDD exhibited reduced IC between the amygdala and VMPFC, compared to HC,17 suggesting decreased IC might relate to pathology in adolescent depression. Interestingly, our findings suggest that adults with EO-MDD have increased amygdala IC with the same area, supporting the idea that adults who experienced depression earlier might have developed compensation in this circuit over time. Alternatively, it is possible that such increased IC may represent increased or amplified bottom-up signaling of negative emotional cues outweighing the top-down control, therefore representing a pathologic mechanism. In the absence of task-related fMRI data, inferences of functional abnormality based on alterations in IC remain largely speculative.
Amygdala IC to the inferior temporal and depression
Our results showed increased positive IC between the left amygdala and the right inferior temporal region, which emerged only when illness burden was controlled for, suggesting that this abnormality relates to the removal of illness burden factors. However, we did not find significant negative correlation between illness burden and amygdala–temporal IC. This abnormality was unrelated to the age of MDD onset, as it was found in both AO-MDD and EO-MDD. These findings are in line with previous work showing increased IC between amygdala and temporal regions using magnetoencephalography in MDD.34 The amygdala is extensively connected with the temporal lobe.35 The inferior portion of the temporal lobe is primarily associated with self and familiar face processing and emotional face recognition, and emotional face-related activity in the temporal lobe has been shown to depend on the interaction with amygdala.36,37 In light of these findings and our results, increased amygdala–inferior temporal IC during rest in MDD might relate to increased negative bias in self-processing and social interactions in MDD.
Limitations
The self-report on remote events such as age of onset and the diagnosis of MDD is vulnerable to recall bias. Thus, recall bias leading to misclassification must be considered. The recall bias during depression might have caused overdiagnosis of MDD (false positives), especially in the early-onset group. Hence, it is possible that some proportion of patients with early-onset depression might not have had MDD as the first episode, but in fact might have experienced subclinical or characterological depression or high neuroticism.38 Hence, the EO-MDD patient group might be less homogeneous than the AO-MDD group. To circumvent this problem, the study psychiatrist (RR) asked participants when they began to experience the constellation of symptoms that would fulfill the criteria for MDD. Another issue is that the recollection of the age of onset of MDD may not be accurate, which could have resulted in overestimation or underestimation of the age of onset. However, relying on objective data from the official diagnosis of psychiatrists and hospital charts corresponding to the age of the first episode of depression would also introduce error as to the true age of MDD onset, as there would be significant variability in how long people suffered with symptoms before approaching a doctor, especially before adulthood. The above-mentioned limitations are inherent to studies involving retrospective evaluation of remote events. However, large volume of literature involving self-report of remote events provided wealth of knowledge to our understanding of childhood pathologies or adverse events in relation to adulthood mental disorders. Furthermore, they form the foundation for prospective studies. The second limitation is that our study was cross-sectional in nature. To elucidate the contribution of developmental trajectories and illness burden on brain networks, future studies should independently examine EO-MDD and AO-MDD cohorts longitudinally. In addition, we only investigated amygdala IC with the rest of the brain. It is also possible that other networks are prominently disrupted in EO-MDD and may be related to early age of onset per se, not illness burden. Thirdly, we used global signal regression (GSR) as a preprocessing step. Including the GSR can bias the data toward displaying spurious negative correlations. That said, there is evidence that anticorrelations comparable to those reported here are present without removing the global signal,30 suggesting those relationships are not artifactually introduced by GSR and may have biologic origins. We chose to include the GSR, as omitting it leads to spurious positive correlations due to correspondence of noise in the global signal over time and reduces both signal to noise ratio and specificity of network IC patterns relative to known anatomic relationships.39 Finally, we were able to demonstrate significant differential amygdala IC patterns in EO-MDD and AO-MDD, but the moderate sample size might have reduced our power to detect further differences between groups.
Conclusion
This is the first resting-state fMRI study examining amygdala IC of EO-MDD and AO-MDD in adult MDD patients. This study demonstrates differential IC of amygdala with prefrontal and parietal regions between AO-MDD, EO-MDD, and HCs. Differential abnormalities in the IC of amygdala between EO-MDD and AO-MDD may reflect interplay between the age of onset and illness burden on lateral emotional executive control and medial emotional regulatory systems.
Availability of data and materials
For access to the data presented in this manuscript, please contact the corresponding author.
Acknowledgments
The infrastructure for this study was funded by the Hotchkiss Brain Institute for Neuroimaging Research Unit at Seaman Family MRI Research Center, Foothills Hospital and the Mathison Centre for Mental Health Research and Education, Calgary. We acknowledge the contribution of Gaxiola Ismael, and Filomeno Cortese for imaging data acquisition, storage, and quality assurance. The authors wish to thank all participants who volunteered to participate in this study. This study was supported by an investigator-initiated grant from AstraZeneca to Dr Ramasubbu. Darren Clark and Elliot Brown are supported by Alberta Innovates and Health Solutions (AIHS) post-doctoral fellowship awards. The funding body had no influence over the study or this manuscript.
Author contributions
RR and DLC contributed to the conception, design, interpretation, drafting the article and revising it. RR also recruited samples, conducted clinical assessment and was responsible for the integrity and accuracy of the data. NK, DLC, BG, SB, ECB and AK contributed toward fMRI design, imaging data acquisition, analysis, revising the paper and agreed to be accountable for the work.
Disclosure
RR has received investigator initiated grants from Pfizer and Janssen, and served in the advisory committees for Lundbeck and Janssen. The authors report no other conflicts of interest in this work.
References
Zisook S, Lesser I, Stewart JW, et al. Effect of age at onset on the course of major depressive disorder. Am J Psychiatry. 2007;164(10):1539–1546. | ||
Park SC, Hahn SW, Hwang TY, et al. Does age at onset of first major depressive episode indicate the subtype of major depressive disorder?: the clinical research center for depression study. Yonsei Med J. 2014;55(6):1712–1720. | ||
Pajer K, Andrus BM, Gardner W, et al. Discovery of blood transcriptomic markers for depression in animal models and pilot validation in subjects with early-onset major depression. Transl Psychiatry. 2012;2(4):e101. | ||
Jaworska N, MacMaster FP, Gaxiola I, Cortese F, Goodyear B, Ramasubbu R. A preliminary study of the influence of age of onset and childhood trauma on cortical thickness in major depressive disorder. Biomed Res Int. 2014;2014(3):410472–410479. | ||
Jaworska N, MacMaster FP, Yang XR, et al. Influence of age of onset on limbic and paralimbic structures in depression. Psychiatry Clin Neurosci. 2014;68(12):812–820. | ||
Kemp A, MacMaster FP, Jaworska N, et al. Age of onset and corpus callosal morphology in major depression. J Affect Disord. 2013;150(2):703–706. | ||
Truong W, Minuzzi L, Soares CN, et al. Changes in cortical thickness across the lifespan in major depressive disorder. Psychiatry Res. 2013;214(3):204–211. | ||
Kerestes R, Davey CG, Stephanou K, Whittle S, Harrison BJ. Functional brain imaging studies of youth depression: a systematic review. Neuroimage Clin. 2014;4:209–231. | ||
Phillips ML, Drevets WC, Rauch SL, Lane R. Neurobiology of emotion perception I: The neural basis of normal emotion perception. Biol Psychiatry. 2003;54(5):504–514. | ||
Phillips ML, Ladouceur CD, Drevets WC. A neural model of voluntary and automatic emotion regulation: implications for understanding the pathophysiology and neurodevelopment of bipolar disorder. Mol Psychiatry. 2008;13(9):829–857. | ||
Phillips ML, Medford N, Young AW, et al. Time courses of left and right amygdalar responses to fearful facial expressions. Hum Brain Mapp. 2001;12(4):193–202. | ||
Luking KR, Repovs G, Belden AC, et al. Functional connectivity of the amygdala in early-childhood-onset depression. J Am Acad Child Adolesc Psychiatry. 2011;50(10):1027–1041.e3. | ||
Cullen KR, Westlund MK, Klimes-Dougan B, et al. Abnormal amygdala resting-state functional connectivity in adolescent depression. JAMA Psychiatry. 2014;71(10):1138–1147. | ||
Ramasubbu R, Konduru N, Cortese F, Bray S, Gaxiola-Valdez I, Goodyear B. Reduced intrinsic connectivity of amygdala in adults with major depressive disorder. Front Psychiatry. 2014;5:17. | ||
Phillips ML, Drevets WC, Rauch SL, Lane R. Neurobiology of emotion perception II: Implications for major psychiatric disorders. Biol Psychiatry. 2003;54(5):515–528. | ||
Gabard-Durnam LJ, Flannery J, Goff B, et al. The development of human amygdala functional connectivity at rest from 4 to 23 years: a cross-sectional study. Neuroimage. 2014;95:193–207. | ||
Connolly CG, Ho TC, Blom EH, et al. Resting-state functional connectivity of the amygdala and longitudinal changes in depression severity in adolescent depression. J Affect Disord. 2017;207:86–94. | ||
Bebko G, Bertocci M, Chase H, et al. Decreased amygdala-insula resting state connectivity in behaviorally and emotionally dysregulated youth. Psychiatry Res. 2015;231(1):77–86. | ||
Jacobs RH, Barba A, Gowins JR, et al. Decoupling of the amygdala to other salience network regions in adolescent-onset recurrent major depressive disorder. Psychol Med. 2016;46(5):1055–1067. | ||
Tang Y, Kong L, Wu F, et al. Decreased functional connectivity between the amygdala and the left ventral prefrontal cortex in treatment-naive patients with major depressive disorder: a resting-state functional magnetic resonance imaging study. Psychol Med. 2013;43(9):1921–1927. | ||
Lui S, Wu Q, Qiu L, et al. Resting-state functional connectivity in treatment-resistant depression. Am J Psychiatry. 2011;168(6):642–648. | ||
Pannekoek JN, van der Werff SJA, Meens PHF, et al. Aberrant resting-state functional connectivity in limbic and salience networks in treatment – naïve clinically depressed adolescents. J Child Psychol Psychiatry. 2014;55(12):1317–1327. | ||
Veer IM, Beckmann CF, van Tol MJ, et al. Whole brain resting-state analysis reveals decreased functional connectivity in major depression. Front Syst Neurosci. 2010;4. | ||
Tahmasian M, Knight DC, Manoliu A, et al. Aberrant intrinsic connectivity of hippocampus and amygdala overlap in the fronto-insular and dorsomedial-prefrontal cortex in major depressive disorder. Front Hum Neurosci. 2013;7:639. | ||
Anand A, Li Y, Wang Y, et al. Activity and connectivity of brain mood regulating circuit in depression: a functional magnetic resonance study. Biol Psychiatry. 2005;57(10):1079–1088. | ||
Alpert JE, Fava M, Uebelacker LA, et al. Patterns of axis I comorbidity in early-onset vs late-onset major depressive disorder. Biol Psychiatry. 1999;46(2):202–211. | ||
Power JD, Mitra A, Laumann TO, Snyder AZ, Schlaggar BL, Petersen SE. Methods to detect, characterize, and remove motion artifact in resting state fMRI. Neuroimage. 2014;84:320–341. | ||
Yan CG, Craddock RC, He Y, Milham MP. Addressing head motion dependencies for small-world topologies in functional connectomics. Front Hum Neurosci. 2013;7:910. | ||
Roy AK, Shehzad Z, Margulies DS, et al. Functional connectivity of the human amygdala using resting state fMRI. Neuroimage. 2009;45(2):614–626. | ||
Chai XJ, Castañón AN, Ongür D, Whitfield-Gabrieli S. Anticorrelations in resting state networks without global signal regression. Neuroimage. 2012;59(2):1420–1428. | ||
Drevets WC. Neuroimaging and neuropathological studies of depression: implications for the cognitive-emotional features of mood disorders. Curr Opin Neurobiol. 2001;11(2):240–249. | ||
Mayberg HS. Limbic-cortical dysregulation: a proposed model of depression. J Neuropsychiatry Clin Neurosci. 1997;9(3):471–481. | ||
Seo D, Olman CA, Haut KM, Sinha R, MacDonald AW, Patrick CJ. Neural correlates of preparatory and regulatory control over positive and negative emotion. Soc Cogn Affect Neurosci. 2014;9(4):494–504. | ||
Nugent AC, Robinson SE, Coppola R, Furey ML, Zarate CA. Group differences in MEG-ICA derived resting state networks: application to major depressive disorder. Neuroimage. 2015;118:1–12. | ||
Webster MJ, Ungerleider LG, Bachevalier J. Connections of inferior temporal areas TE and TEO with medial temporal-lobe structures in infant and adult monkeys. J Neurosci. 1991;11(4):1095–1116. | ||
Hadj-Bouziane F, Liu N, Bell AH, et al. Amygdala lesions disrupt modulation of functional MRI activity evoked by facial expression in the monkey inferior temporal cortex. Proc Natl Acad Sci U S A. 2012;109(52):E3640–E3648. | ||
Ishai A, Schmidt CF, Boesiger P. Face perception is mediated by a distributed cortical network. Brain Res Bull. 2005;67(1–2):87–93. | ||
Akiskal HS, Rosenthal TL, Haykal RF, Lemmi H, Rosenthal RH, Scott-Strauss A. Characterological depressions. Clinical and sleep EEG findings separating ‘subaffective dysthymias’ from ‘character spectrum disorders’. Arch Gen Psychiatry. 1980;37(7):777–783. | ||
Murphy K, Fox MD. Towards a consensus regarding global signal regression for resting state functional connectivity MRI. Neuroimage. 2017;154:169–173. |
 © 2018 The Author(s). This work is published and licensed by Dove Medical Press Limited. The full terms of this license are available at https://www.dovepress.com/terms.php and incorporate the Creative Commons Attribution - Non Commercial (unported, v3.0) License.
By accessing the work you hereby accept the Terms. Non-commercial uses of the work are permitted without any further permission from Dove Medical Press Limited, provided the work is properly attributed. For permission for commercial use of this work, please see paragraphs 4.2 and 5 of our Terms.
© 2018 The Author(s). This work is published and licensed by Dove Medical Press Limited. The full terms of this license are available at https://www.dovepress.com/terms.php and incorporate the Creative Commons Attribution - Non Commercial (unported, v3.0) License.
By accessing the work you hereby accept the Terms. Non-commercial uses of the work are permitted without any further permission from Dove Medical Press Limited, provided the work is properly attributed. For permission for commercial use of this work, please see paragraphs 4.2 and 5 of our Terms.