")
Back to Journals » Risk Management and Healthcare Policy » Volume 9
The impact of a regional patient-centered medical home initiative on cost of care among commercially insured population in the US
Authors Maeng D, Sciandra J, Tomcavage J
Received 19 December 2015
Accepted for publication 7 March 2016
Published 26 May 2016 Volume 2016:9 Pages 67—74
DOI https://doi.org/10.2147/RMHP.S102826
Checked for plagiarism Yes
Review by Single anonymous peer review
Peer reviewer comments 4
Editor who approved publication: Professor Frank Papatheofanis
Daniel Dukjae Maeng, Joann P Sciandra, Janet F Tomcavage
Geisinger Health System, Danville, PA, USA
Abstract: The impact of a patient-centered medical home (PCMH) in reducing total cost of care remains a subject of debate, particularly among the non-elderly adult population. This study examines a 6-year experience of a large integrated regional health care delivery system in the US implementing PCMH among its commercially insured population. A regional health plan's claims data from 2008 through 2013 among its commercially insured members were obtained and analyzed. Over the 6-year period, the PCMH implementation beyond the first 6 months of exposure was associated with a lower total cost of care of ~9% (P<0.05). The largest reduction was observed in outpatient costs (12%; P<0.05). This study suggests that PCMH implementation among the non-elderly adult population can potentially lead to cost savings. Future studies are necessary to identify the drivers of the cost savings and examine if similar results can be replicated elsewhere by other health care delivery systems.
Keywords: patient-centered medical home, cost of care, commercially insured, non-elderly adults
Introduction
Can a patient-centered medical home (PCMH) achieve the “Triple Aim” of improved population health, improved care experience, and lower cost of care?1 This is a question that still remains largely unanswered, although recently published studies evaluating PCMH in various contexts demonstrate growing evidence of favorable impact of PCMH in achieving the Triple Aim.2–13 Generally speaking, PCMH can be defined as “provision of comprehensive primary care services that facilitates communication and shared decision making between the patient, his/her primary care providers (PCPs), other providers, and the patient’s family”.14 PCMH is a significant departure from the current standard care delivery model in the US, which relies on a “fragmented” care delivery system that lacks a systematic infrastructure to comprehensively coordinate care across disparate specialty care providers and care settings.15 PCMH seeks to address such shortcomings in the current care delivery model by emphasizing primary care as the focal point in patient care processes.
There is growing evidence that PCMH can positively impact patient outcome and care experiences.10 However, the potential impact of PCMH on cost of care remains unclear and debatable because the goal of PCMH is not explicitly to cut cost. In fact, PCMH may potentially increase total cost of care, at least in short run, because it can lead to greater use of preventive care, for instance. In theory, however, this short-term increase in cost of care is more than offset by much larger decreases in costs associated with acute care, which is often the result of poor access to early care. Put differently, PCMH focuses “upstream” in the care process – for example, primary care office visits, care coordination, and provision of preventive care as well as comprehensive chronic care – to reduce care in the “downstream” – for example, emergency department (ED) visits and acute hospital admissions.
This study describes a 6-year experience of Geisinger Health System, a large integrated health care delivery system located in Central Pennsylvania, in implementing its version of PCMH, referred to as ProvenHealth Navigator® (PHN), among its commercially insured non-elderly patient population. Previously, recognizing that elderly patients typically have higher disease burdens than non-elderly patients,16 the early PHN implementations, which had first started in 2006, focused on the elderly Medicare Advantage population – that is, individuals 65 years of age or older who qualify for the public health insurance program run by the US federal government and have elected to enroll in a health plan offered by one of the participating private health insurers in the region. Several studies have been already published that demonstrate the impact of PHN in achieving the Triple Aim in the elderly Medicare population.3–7
Subsequently, Geisinger has sought to replicate its PHN model in the non-elderly adult population who are insured through their employers. Since 2008 – 2 years after the initial PHN implementation among the Medicare population in 2006 – Geisinger has expanded PHN to include commercially insured patients also. The goal of this study is to describe Geisinger’s experience in implementing PHN among this particular segment of its patient population in terms of cost of care, as reflected in a health insurer’s claims data. However, we note that, for reasons discussed later in this paper, it is inherently difficult to infer a causal relationship between PHN implementation and the cost of care from this analysis. Nevertheless, the statistical associations reported in this study are consistent with the expectation that PHN implementation would be associated with reductions in long-term cost of care and are suggestive of the potential impact of PCMH on cost of care.
Background
Table 1 describes the core elements of PHN. Geisinger Health Plan (GHP), a subsidiary of Geisinger Health System providing health insurance coverage to ~515,000 members as of 2015, has played an integral part in conceptualizing, designing, and implementing PHN, particularly around hiring and training of case managers embedded within every PHN primary care clinic. A “PHN site” is a PCP site that has transformed its workflow and operations in accordance with the five core components of PHN, as summarized in Table 1. For more information about PHN design and implementation, the reader is referred to previously published literature.3–7,17 For more detailed explanation of each element described in Table 1, the reader is referred to the appendix to the article by Gilfillan et al.3
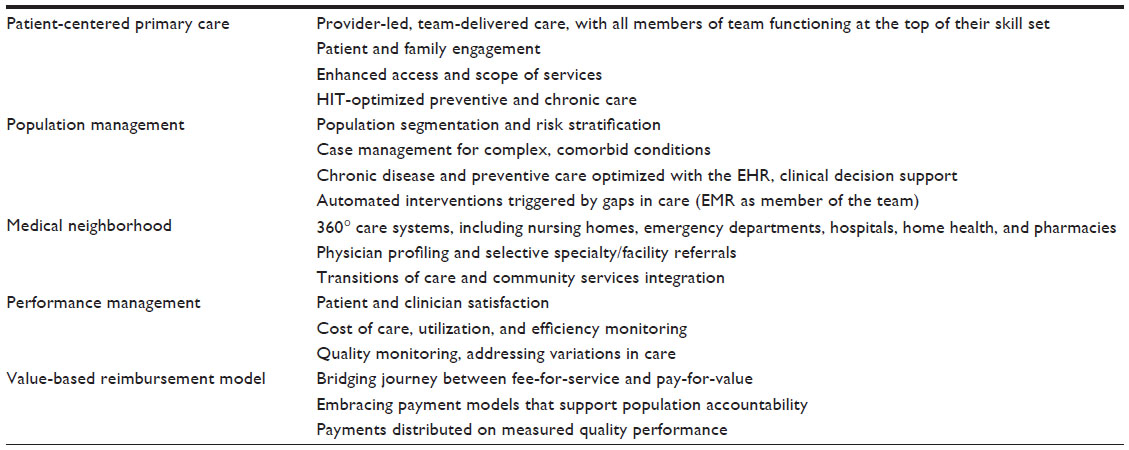 | Table 1 Five core components of PHN |
PHN among the commercially insured population was implemented over several phases. Table 2 illustrates this phased roll-out of PHN implementation: In 2008 – the first year of PHN implementation among the commercial population – there were seven PCP sites that were converted to PHN sites for commercially insured members. In 2009, there were 16 such sites. The majority of the PHN sites (62 out of 95) underwent such PHN conversions in 2012 and 2013, the last 2 years of the study period. The PHN implementation date was determined by the first day on which the embedded nurse case manager began managing commercially insured patients in the sites. This phased roll-out of PHN implementation gives variation in the length of PHN exposure by each PHN site in the sample.
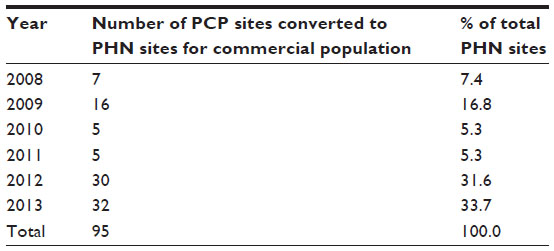 | Table 2 PHN implementation phases among the commercially insured population |
Data
This study was conducted as part of GHPs quality improvement effort, using only the existing administrative claims data that already had been routinely collected for Geisinger’s business purposes. Therefore, the study was not subject to Geisinger’s Institutional Review Board oversight. The data originated from GHP’s claims database covering the period between January 1, 2008 and December 31, 2013. The following inclusion criteria were applied: members must 1) have been insured by GHP’s commercial plans and be between the ages 18 and 64 during the study period; and 2) have the plan types that require each member to select a PCP within GHP’s provider network (to ensure that every member was clearly attributable to one of the 95 PHN sites). In addition, those GHP members who were attributed to PCP sites that were never converted to PHN at any point during the study period were excluded from the sample. The total number of unique GHP members who met all these criteria and were included in the final sample was 75,555. This represented ~37% of all GHP members who met the two inclusion criteria (ie, 75,555 out of 205,717 GHP commercial plan members who were between the ages 18 and 64 and had plan type that required selecting a PCP).
Cost of care was defined as per-member-per-month (PMPM) “allowed” amount – that is, the sum of all payment to providers as well as member out-of-pocket cost in the form of copays, coinsurance, and deductibles. The total allowed amount included all medical and prescription drug (Rx) costs. The total pre-Rx cost (ie, total cost minus Rx cost) was further broken down into three major component parts: inpatient cost, outpatient cost, and professional cost. Rx costs were not separately considered because some GHP members did not have Rx coverage through GHP. Also, for the purposes of this study, only acute inpatient costs were considered. Non-acute inpatient costs, such as skilled nursing facility and inpatient rehab costs, were not considered because PHN was expected to have the most significant impact on the acute inpatient care.7 Also, for a handful of member–month observations in the sample, the allowed amounts had negative dollar values. Negative allowed amounts might be due to reversed claims or other administrative reasons not known to the study team. As such, members who had any negative allowed amounts were excluded from the analysis for the years during which the negative allowed amounts were recorded (<1% of the sample).
The unit of our analysis was each clinic observed in each month of the study period. We aggregated the patient-level PMPM allowed amounts by calculating mean PMPM cost for each site. That is,
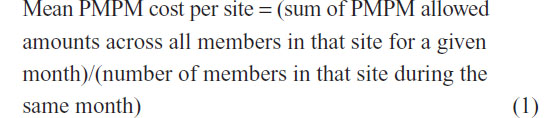
To the extent that PHN is a site-level intervention as opposed to a patient-level intervention, this method is conceptually consistent with how PHN was designed, implemented, and evaluated. One limitation is that, because our data contained claims data of only GHP members, the mean PMPM cost per site represents only the GHP membership within each site. Because GHP membership accounts for only a subset of the patient population treated by each site, our data therefore does not capture the cost experience across all patients treated by each site.
Method
The key assumption used to identify the PHN impact in this study is that the first 6-month period immediately following the initial PCMH implementation for each site represents the counterfactual – that is, the first 6 months of claims represent what would have been observed had PHN not been implemented. Thus, the claims data from the first 6 months post-PHN implementation for each site were used as the benchmark to construct the expected costs. This assumption is likely to be reasonable because it is expected that it takes some time for embedded nurse case managers, for instance, to fully become operational and begin to see results. This assumption also discounts any positive PHN impacts that might have been observed during the first 6 months, yielding more conservative estimates of the PHN impact. Furthermore, ignoring the pre-PHN implementation data and focusing only on the post-PHN implementation data reduces the possibility of selection bias in the estimates.
Moreover, the assumption that the first 6-month period following the initial PCMH implementation for each site represents a reasonable counterfactual was also necessary for the purposes of this analysis because of the context in which PHN was implemented among the commercially insured patients. As noted above, all the PCP sites included in this analysis already had accumulated several years of PHN experience for their Medicare patients by the time they first began focusing on their commercially insured population in 2008. As such, it is difficult to separate out this contamination effect from the pre-PHN intervention data among the commercially insured population. Thus, the estimated effects obtained from this analysis could be interpreted as the PHN effect above and beyond the pre-intervention contamination due to their earlier adoption of PHN for the Medicare population.
The key explanatory variable was the length of PHN exposure for a given site measured in months. The PHN exposure variable was broken into 6-month intervals up to 48 months after the PHN implementation and later, resulting in a set of eight binary indicator variables (1- to 6-month interval serving as the reference category) in the regression models. Other covariates in the model were the following: mean percent of members who were female, mean percent of members who had Rx coverage through GHP (because not every GHP members had Rx coverage through GHP), mean member age, mean number of GHP members in the site in the given month, mean percent of members with each of ten chronic conditions (chronic kidney disease, end-stage renal disease, diabetes, asthma, congestive heart failure, COPD, coronary artery disease, hypertension, cancer, and depression), as well as year and month indicator variables to capture yearly secular trends and seasonality. Standard errors clustered by PCP site were obtained and used to assess statistical significance of the estimated coefficients.
In addition, a set of binary indicator variables for each of the 95 sites in the sample was included to capture the site fixed effects. These site fixed effects captured any time-invariant site-level confounders and thus allowed each site to serve as its own comparison. In total, we estimated five separate generalized linear models with log link and gamma distribution to account for the skewness of the cost data.18 In calculating the observed and expected costs from the regression models, the year and month indicator variables were set to zero to adjust for yearly secular trends (eg, inflation) and seasonality. Table S1 provides the full regression outputs.
Results
Table 3 shows the descriptive statistics of the sample. The mean length of PHN exposure in this sample during the study period was 21 months, reflecting the fact that the majority of the sites in the sample became PHN sites only during the last 2 years of the study period. The PHN sites had slightly more women than men on average, while the most prevalent chronic conditions in this population were hypertension, asthma, diabetes, and depression. The total sample size (ie, the number of site–month combinations) available for the analysis was 2,670.
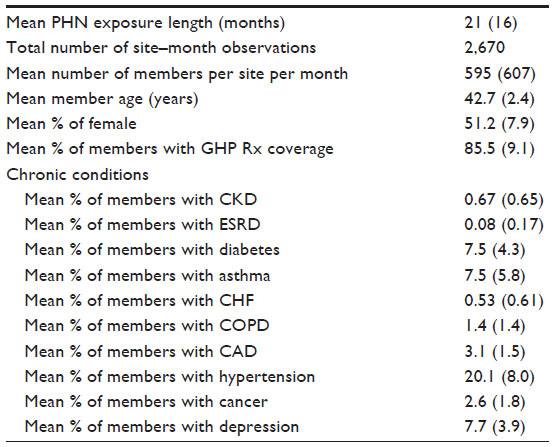 | Table 3 Descriptive statistics |
Table 4 illustrates the total cost savings associated with 6-month incremental exposure to PHN. The top panel shows the total cost of care, including the Rx costs, while the bottom panel shows the total cost of care, excluding Rx (ie, pre-Rx) costs. In both cases, the total cost saving associated with PHN exposure longer than 6 months during the study period was ~9%, which is statistically significant at 5% level. Table 4 also suggests that the magnitude of the cost saving appears to increase with longer PHN exposure.
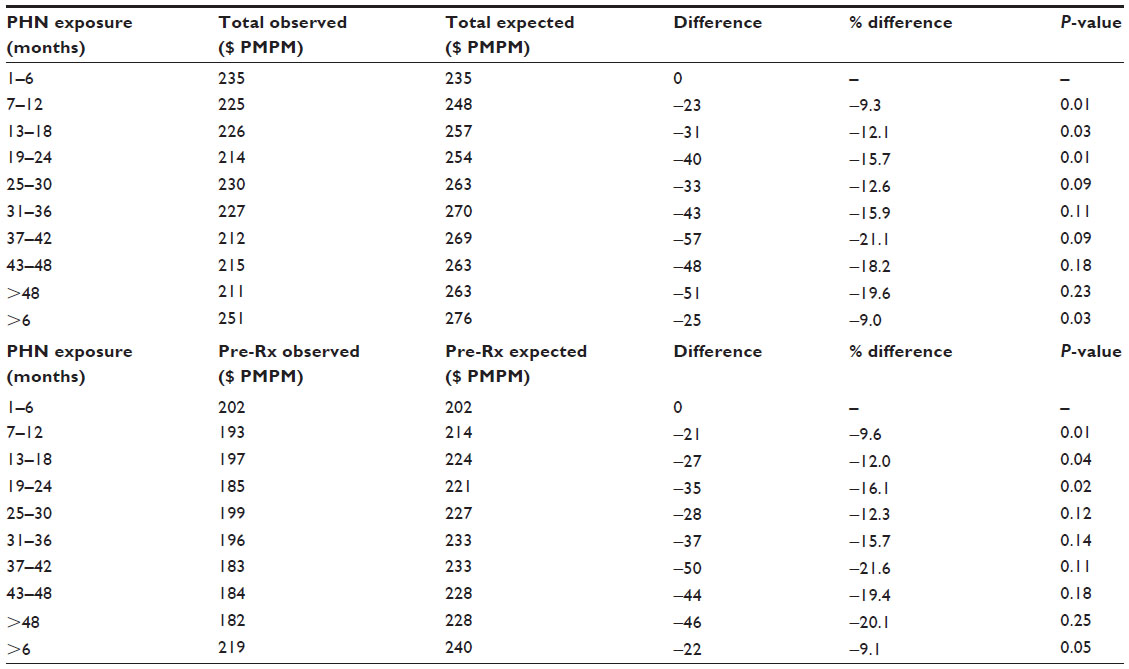 | Table 4 Regression-adjusted total cost of care |
Table 5 shows the PHN impact on each of the three main components of the total cost: acute inpatient, outpatient, and professional costs. While all the point estimates in the table consistently indicate cost savings, only the outpatient costs show a statistically significant overall cost savings at ~12%, or $13 PMPM. This accounts for more than half of the total pre-Rx cost savings of $22 PMPM shown in Table 4.
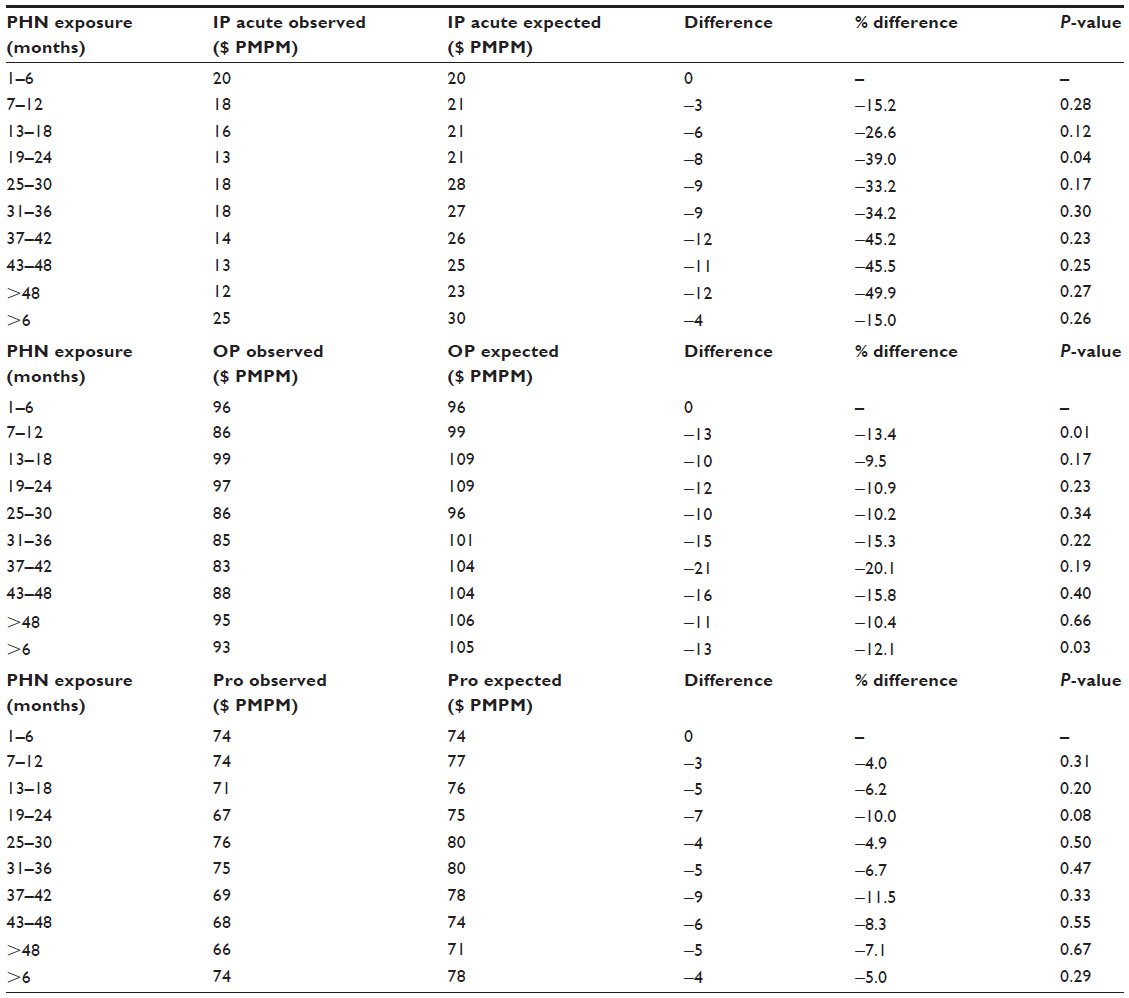 | Table 5 Regression-adjusted cost of care by main components |
Discussion
This study provides another piece of evidence supporting the hypothesis that PCMH can lead to lower cost of care. In the absence of a comprehensive randomized control trial to test the efficacy of PCMH on achieving the Triple Aim, finding empirical evidence from localized studies such as this and many others2–13 provides a strong basis to recognize the beneficial effects of PCMH and implement it in wider contexts. While none of the individual studies can alone provide conclusive proof of the efficacy of PCMH, the growing body of literature is useful in understanding how best to implement PCMH in different contexts and how to evaluate it.
As mentioned earlier, Geisinger’s experience in implementing its version of PCMH referred to as PHN among the Medicare patients has been well documented. This is the first study that has examined the impact of PHN on the commercially insured population. There are reasons to believe why the impact of PHN would be different, or at least be more difficult to detect, among the commercially insured population than among the Medicare population. First, the commercially insured population are relatively healthier than the Medicare population, with lower prevalence of chronic conditions and costs that are often driven by episodic health events that are unpredictable such as acute surgical needs or newly diagnosed oncology. A recent study by David et al11 reports that PCMH was associated with lower ED visits, particularly among those with chronic conditions such as diabetes and hypertension. If the beneficial impact of PCMH is concentrated around those patients who have multiple chronic conditions, then it implies that the effect of PCMH would be diluted and more difficult to detect at a population level with lower prevalence of chronic conditions and lower morbidity in general. Nevertheless, this study shows a consistent pattern, suggesting a robust cost saving across all the cost categories.
Second, unlike Geisinger’s PCMH experience with the Medicare population, in which inpatient care was the largest driver of the cost savings,7 Geisinger’s PCMH experience with the commercially insured population suggests that outpatient care costs appear to be the most significant source of the overall cost reduction. Outpatient costs in this case include the costs associated with ED visits, among other things. It is beyond the scope of this study to identify costs specifically associated with ED visits, particularly those that are discretionary or avoidable in nature. As such, the results presented in this study do not suggest whether or not the lower outpatient costs are due to fewer ED visits associated with the PHN implementation. Nevertheless, this finding illustrates how the impact of PHN on cost of care can potentially differ between the Medicare population and the commercially insured population, and may be representative of differences in disease burden and time to impact.
This study has several limitations. First, this study uses non-experimental observational data relying on an assumption that cannot be tested – that is, that the first 6-month period immediately following the initial PCMH implementation for each site represents the counterfactual. Although an appropriate methodology was chosen to minimize the possibility of potential biases, it is still unknown to what extent a bias might still exist and confound the results. Consequently, it is difficult to establish a causal link between the PCMH implementation and the observed cost savings. Second, because PHN was implemented within a highly localized and unique setting in collaboration with a specific health insurer, the generalizability of the findings is unknown. In particular, because the study sample included only GHP members in each PHN site, the experiences of other non-GHP patients in the same sites are not reflected in this study. In general, the PCP sites that have been converted to PHN are those that have ~30%–40% of its patients covered by GHP. As such, we believe that our sample reflects a reasonable representation of the overall patient population in each site. Third, the underlying mechanism through which the cost savings might have been achieved is not examined. Future studies are necessary to identify the key drivers of the cost savings and to examine if similar results can be replicated elsewhere by other health care delivery systems in different settings.
Disclosure
All authors are employees of Geisinger Health System. This study was conducted as a part of their employment with Geisinger Health System. No other potential conflicts of interest is expected.
References
Berwick DM, Nolan TW, Whittington J. The Triple Aim: care, health, and cost. Health Aff (Millwood). 2008;27(3):759–769. | |
Reid RJ, Coleman K, Johnson EA, et al. The group health medical home at year two: cost savings, higher patient satisfaction, and less burnout for providers. Health Aff (Millwood). 2010;29(5):835–843. | |
Gilfillan RJ, Tomcavage J, Rosenthal MB, et al. Value of the medical home: effects of transformed primary care. Am J Manag Care. 2010; 16(8):607–614. | |
Maeng DD, Graf TR, Davis DE, Tomcavage J, Bloom FJ. Can a patient-centered medical home lead to better patient outcomes? The quality implications of Geisinger’s ProvenHealth Navigator. Am J Med Qual. 2012;27(3):210–216. | |
Maeng DD, Graham J, Graf TR, et al. Reducing long-term cost by transforming primary care: evidence from Geisinger’s medical home model. Am J Manag Care. 2012;18(3):149–155. | |
Maeng DD, Davis DE, Tomcavage J, Graf TR, Procopio KM. Improving patient experience by transforming primary care: evidence from Geisinger’s patient-centered medical homes. Popul Health Manage. 2013;16(3):157–163. | |
Maeng DD, Khan N, Tomcavage J, Graf TR, Davis DE, Steele GD. Reduced acute inpatient care was largest savings component of Geisinger Health System’s patient-centered medical home. Health Aff (Millwood). 2015;34(4):636–644. | |
Paustian, ML, Alexander JA, El Reda DK, Wise CG, Green LA, Fetters MD. Partial and incremental PCMH practice transformation: implications for quality and costs. Health Serv Res. 2014;49(1):52–74. | |
Rosenthal MB, Friedberg MW, Singer SJ, Eastman D, Li Z, Schneider EC. Effect of a multipayer patient-centered medical home on health care utilization and quality: the Rhode Island chronic care sustainability initiative pilot program. JAMA Intern Med. 2013;173(20):1907–1913. | |
Jackson GL, Powers BJ, Chatterjee R, et al. Improving patient care. The patient centered medical home. A systematic review. Ann Intern Med. 2013;158(3):169–178. | |
David G, Gunnarsson C, Saynisch PA, Chawla R, Nigam S. Do patient-centered medical homes reduce emergency department visits? Health Serv Res. 2015;50(2):418–439. | |
Rosenthal MB, Alidina S, Friedberg MW, et al. A difference-in-difference analysis of changes in quality, utilization and cost following the Colorado multi-payer patient-centered medical home pilot. J Gen Intern Med. 2016;31(3):289–296. | |
Van Hasselt M, McCall N, Keyes V, Wensky SG, Smith KW. Total cost of care lower among Medicare fee-for-service beneficiaries receiving care from patient-centered medical homes. Health Serv Res. 2015;50(1):253–272. | |
American Hospital Association. 2010 Committee on Research. AHA research synthesis report: patient-centered medical home (PCMH). Chicago: American Hospital Association; 2010. | |
Stange KC. The problem of fragmentation and the need for integrative solutions. Ann Fam Med. 2009;7(2):100–103. doi:10.1370/afm.971. | |
Wolff JL, Starfield B, Anderson G. Prevalence, expenditures, and complications of multiple chronic conditions in the elderly. Arch Intern Med. 2002;162(20):2269–2276. | |
Paulus RA, Davis K, Steele GD. Continuous innovation in health care: implications of the Geisinger experience. Health Aff (Millwood). 2008;27(5):1235–1245. | |
Buntin MB, Zaslavsky AM. Too much ado about two-part models and transformation? Comparing methods of modeling Medicare expenditures. J Health Econ. 2004;23(3):525–524. |
Supplementary material
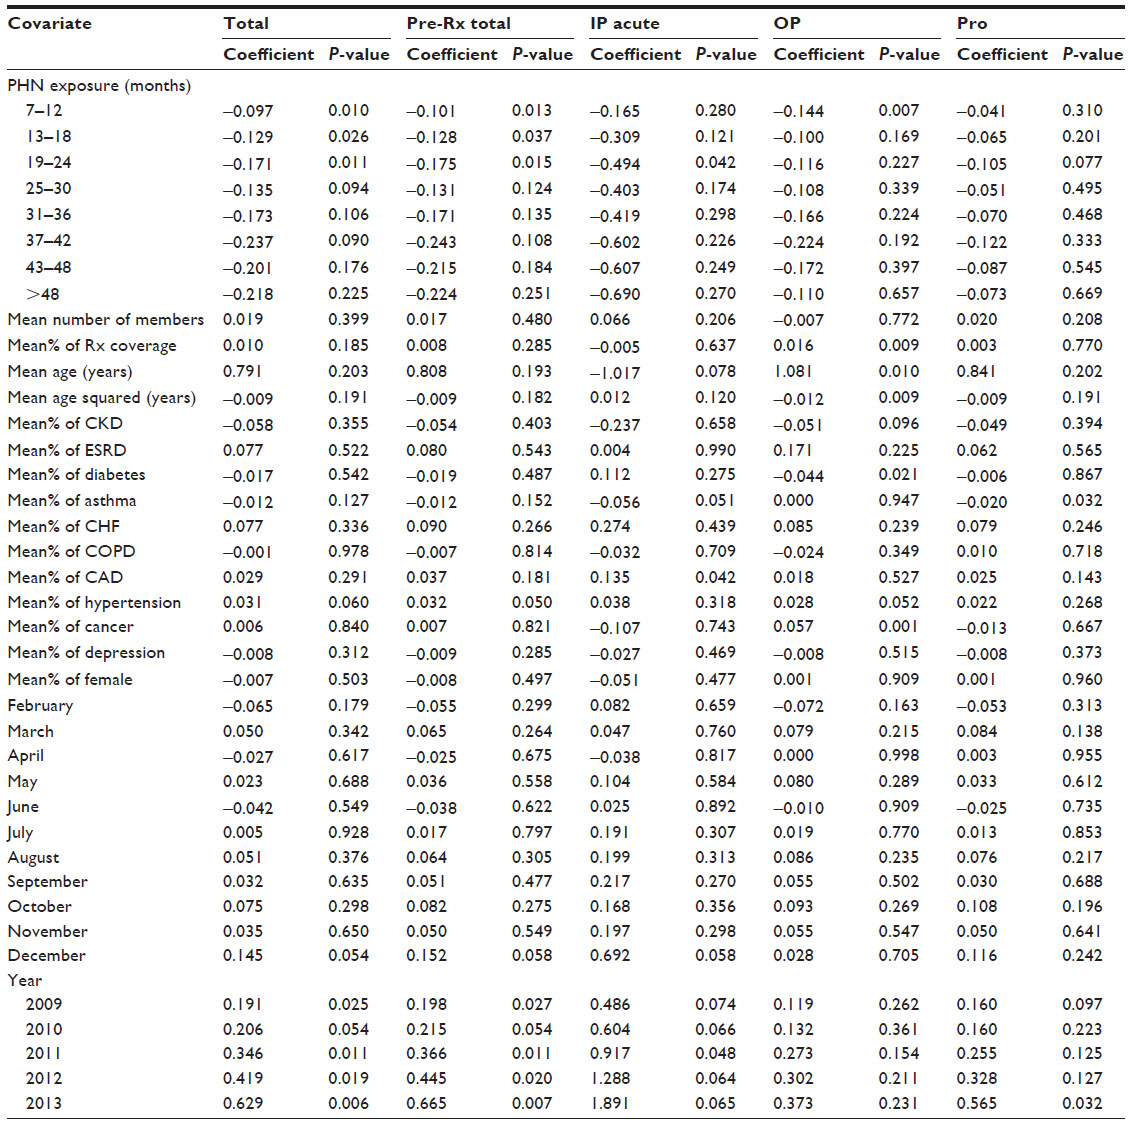 | Table S1 Full generalized linear model regression outputs |
 © 2016 The Author(s). This work is published and licensed by Dove Medical Press Limited. The full terms of this license are available at https://www.dovepress.com/terms.php and incorporate the Creative Commons Attribution - Non Commercial (unported, v3.0) License.
By accessing the work you hereby accept the Terms. Non-commercial uses of the work are permitted without any further permission from Dove Medical Press Limited, provided the work is properly attributed. For permission for commercial use of this work, please see paragraphs 4.2 and 5 of our Terms.
© 2016 The Author(s). This work is published and licensed by Dove Medical Press Limited. The full terms of this license are available at https://www.dovepress.com/terms.php and incorporate the Creative Commons Attribution - Non Commercial (unported, v3.0) License.
By accessing the work you hereby accept the Terms. Non-commercial uses of the work are permitted without any further permission from Dove Medical Press Limited, provided the work is properly attributed. For permission for commercial use of this work, please see paragraphs 4.2 and 5 of our Terms.