")
Back to Journals » Diabetes, Metabolic Syndrome and Obesity » Volume 15
The High Prevalence of Short-Term Elevation of Tumor Markers Due to Hyperglycemia in Diabetic Patients
Authors Liu X
Received 8 December 2021
Accepted for publication 31 March 2022
Published 11 April 2022 Volume 2022:15 Pages 1113—1122
DOI https://doi.org/10.2147/DMSO.S350599
Checked for plagiarism Yes
Review by Single anonymous peer review
Peer reviewer comments 3
Editor who approved publication: Prof. Dr. Antonio Brunetti
Xi-yu Liu
Department of Endocrinology, Dongyang People’s Hospital, Dongyang, Zhejiang, People’s Republic of China
Correspondence: Xi-yu Liu, Email [email protected]
Introduction: The relationship between diabetes and cancer is uncertain. However, tumor markers in diabetic patients are significantly elevated. The prevalence of diabetic inpatients with elevation of tumor markers and its relationship to blood glucose is needed to be studied.
Methods: A total of 102 diabetic inpatients were included in this study. We collected information from diabetic inpatients and tested tumor markers. Patients with elevation of tumor markers were rechecked.
Results: We found that up to 73.3% of diabetic inpatients had one or more tumor markers elevated. The proportion of diabetic inpatients with higher than normal cytokeratin 19 fragment (CYFRA 21– 1) was 54.5%. Most of them did not return to normal after controlling the blood glucose. A short-term elevation of carcinoembryonic antigen (CEA) was present in 15.8% of diabetic inpatients, and 19.8% of diabetic inpatients had a short-term elevation of carbohydrate antigen. CEA and carbohydrate antigen including CA19-9, CA72-4, CA125 and CA15-3 returned to normal or became significantly reduced within 2 weeks after good control of blood glucose.
Conclusion: Our study showed that the elevation of tumor markers was common in diabetic inpatients, especially those with poor blood glucose control. It indicated that re-checking the tumor markers after controlling blood glucose might be better than conducting large-scale test for cancer.
Keywords: diabetes patients, tumor markers, carcinoembryonic antigen, carbohydrate antigen
Introduction
Diabetes is a complex group of metabolic disorders characterized by hyperglycemia. The global prevalence of diabetes was estimated to be 9.3% and was increasing year by year.1,2 There might be a potential relationship between diabetes and cancer. It was found that the incidence of tumors was increased in diabetic patients.3,4 A meta-analysis regarding diabetes and risk of developing cancer had shown that only a minority of the studied associations had robust support without hints of bias and there was still uncertainty of the risk of developing cancer for diabetic patients.5 Studies showed that diabetic patients had significantly higher rates of abnormal tumor markers than those without diabetes, including carcinoembryonic antigen (CEA), carbohydrate antigens, neuron-specific enolase (NSE), and cytokeratin 19 fragment (CYFRA 21–1).6–8
The relationship between diabetes and cancer is uncertain. However, tumor markers in diabetic patients are significantly elevated. It is necessary to investigate whether the elevation of tumor markers in diabetic patients represents the presence of cancer or is simply related to high blood glucose. We conducted this study to provide guidance for clinicians.
Materials and Methods
Study Population
Our research was in compliance with the Helsinki Declaration. The ethics approval was issued by the Ethics Committee of Dongyang People’s Hospital and informed consent was obtained from the participants. We randomly collected a total of 102 diabetic inpatients from a comprehensive hospital since 2019.
Inclusion Criteria and Exclusion Criteria
The inclusion criteria were inpatients who had complete medical records and were diagnosed with diabetes according to the WHO standard. A complete set of tumor markers was detected. All patients were observed for more than 1 year. Patients with elevation of tumor markers had a recheck in hospital or in the out-patient department within two weeks. The exclusion criteria were: (1) A history of any type of tumor. (2) Pregnant and lactating women. (3) Chronic kidney diseases with an estimated glomerular filtration rate (eGFR) <60 mL/min/1.73 m2. (4) A history of liver cirrhosis or liver insufficiency with alanine aminotransferase 3 times higher than the upper limit of normal range.
Data Collection
Diabetes duration, age, gender, body mass index (BMI), HbA1c, total cholesterol, triglyceride, blood pressure, past history, personal history, family history, liver function and kidney function were collected. Patients were screened for the following tumor markers: carcinoembryonic antigen (CEA), alpha-fetoprotein (AFP), neuron-specific enolase (NSE), cytokeratin 19 fragment (CYFRA 21–1), sugar chain antigen 19–9 (CA19-9), sugar chain antigen 125 (CA125), carbohydrate antigen 15–3 (CA15-3), sugar chain antigen 72–4 (CA72-4), squamous-cell carcinoma (SCC). All laboratory tests were performed in the laboratory section of the comprehensive hospital using standardized methods.
Detection Method
Blood samples for detection were collected in the morning after an overnight fast. Tumor markers including CEA, AFP, NSE, CYFRA 21–1 and carbohydrate antigens were detected by an electrochemiluminescence immunoassay,9 according to the manufacturer’s instructions of the assay kits (Roche Diagnostics, Sandhofer Strasse 116, 68305 Mannheim, Germany). HbA1c was detected by high-performance liquid chromatography10 (National Glycohemoglobin Standardization Program certificated; Bio-Rad Laboratories, France). Blood glucose, total cholesterol and triglyceride were detected by Colorimetric/Fluorometricassay11,12 (Fujifilm Wako Pure Chemical Corporation, Japan).
Statistical Analysis
All data were analyzed by the statistical software IBM SPSS Statistics 25.0. Normal distribution data were presented as the mean ± SD. Independent sample t–test was used for comparison between the two groups. The rates between two groups were compared by Chi-square test or Fisher’s accurate test. p value less than 0.05 was considered as significant.
Results
Characteristics of Participants
A total of 102 diabetic patients were included in this study. One patient showed progressive increases of tumor markers and was later diagnosed as gastric cancer. So the statistical analysis was performed on other 101 patients. Basic demographic and clinical characteristics of participants are shown in Table 1.
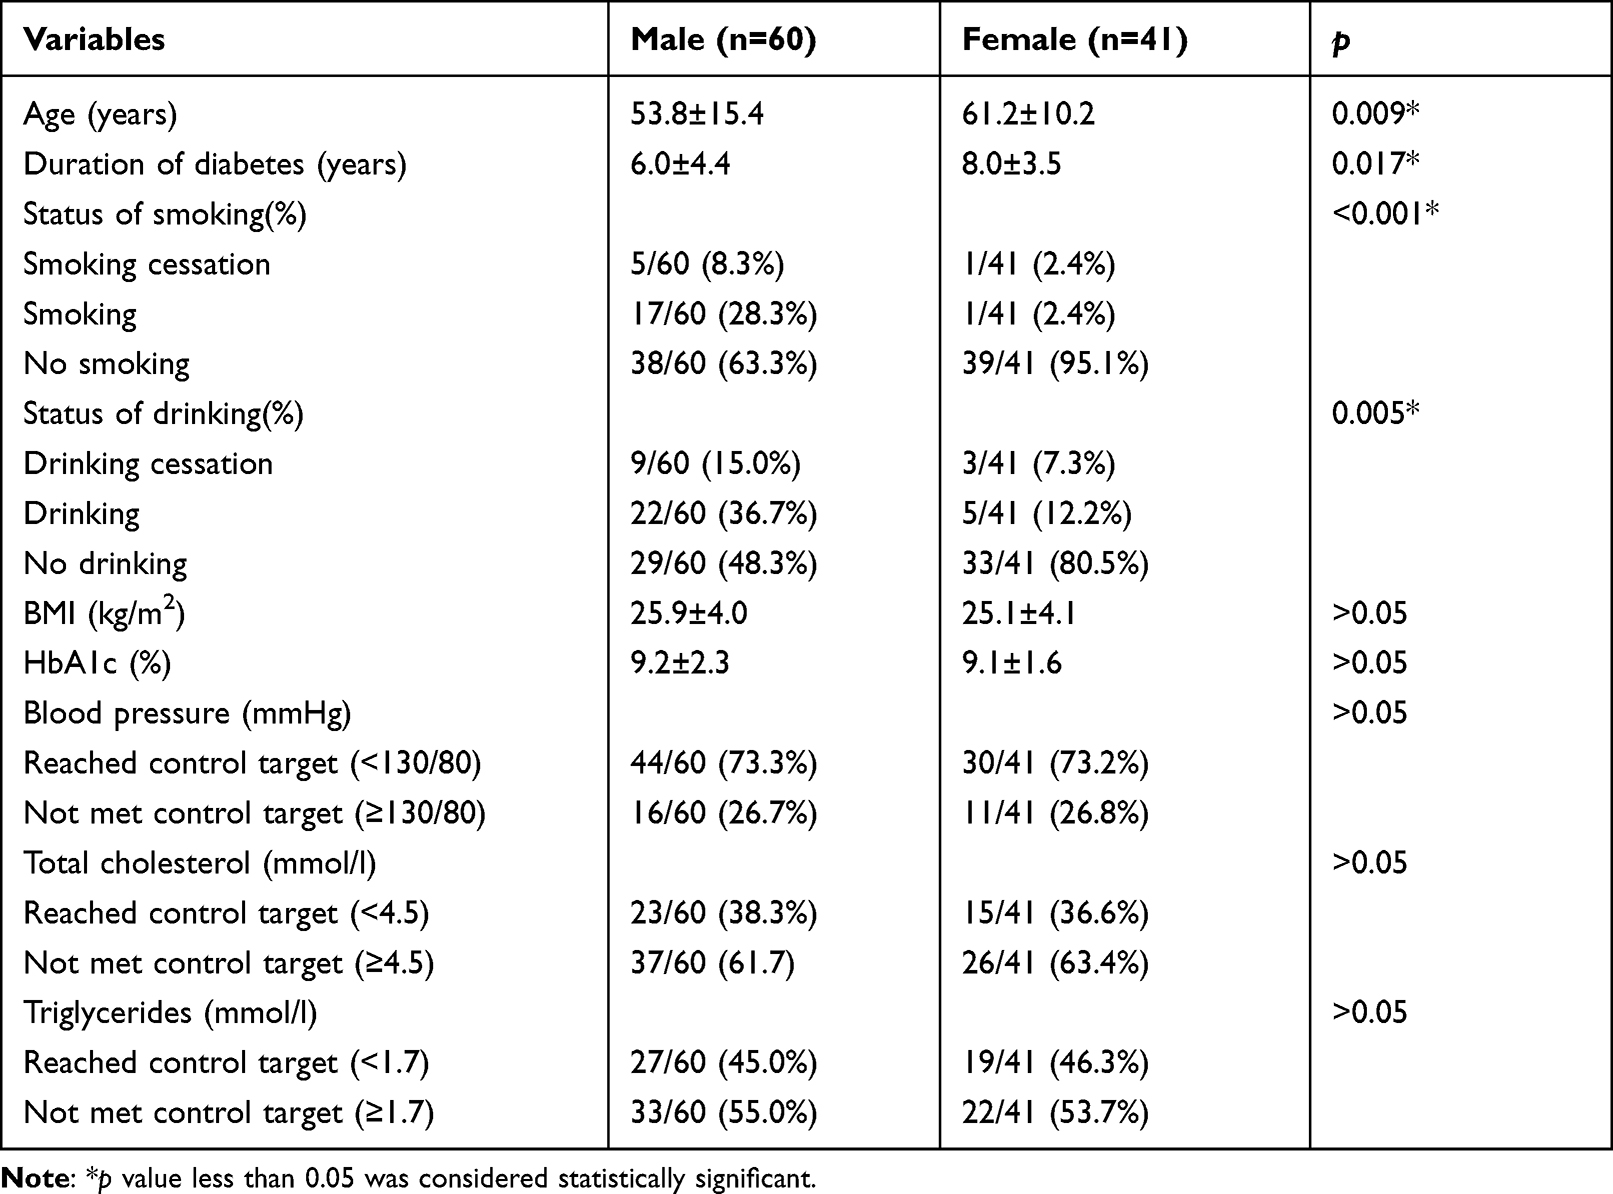 |
Table 1 Basic Demographic and Clinical Characteristics of Participants |
The Prevalence of Diabetic Inpatients with Elevation of Tumor Markers
The prevalence of diabetic inpatients with elevation of tumor markers is shown in Figure 1. The rate of diabetic inpatients with elevation of any one tumor marker including CYFRA 21–1 was up to 73.3% (74/101). The rate of diabetic inpatients with elevation of any one tumor marker except CYFRA 21–1 was 39.6% (40/101). The rate of diabetic inpatients with elevation of carbohydrate antigen (any one of CA19-9, CA72-4, CA125 or CA153) was 19.8% (20/101). The rate of diabetic inpatients with elevation of CYFRA 21–1 was 54.5% (55/101). Through rechecks, we found that most of elevated CYFRA 21–1 did not return to normal after controlling blood glucose, and only 10.91% became normal. NSE and SCC did not return to normal after controlling blood glucose too. However, CEA and carbohydrate antigen including CA19-9, CA72-4, CA125 and CA15-3 returned to normal or became significantly reduced within 2 weeks after good control of blood glucose. It is shown in Figure 2.
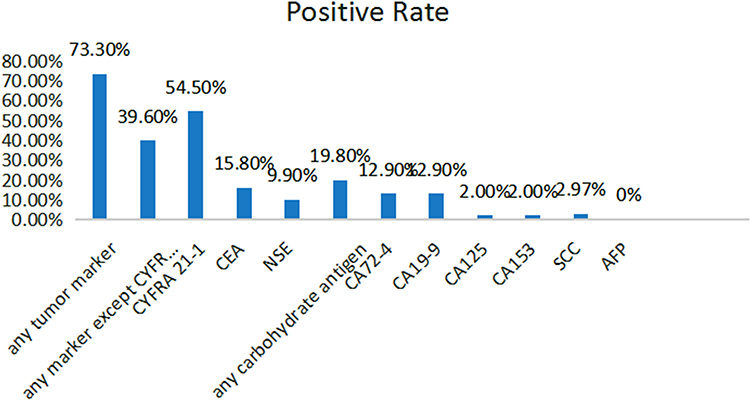 |
Figure 1 The prevalence of diabetic inpatients with elevation of tumor markers. Abbreviations: CEA, carcinoembryonic antigen; AFP, alpha-fetoprotein; NSE, neuron-specific enolase; CYFRA 21–1, cytokeratin 19 fragment; CA19-9, sugar chain antigen 19–9; CA125, sugar chain antigen 125; CA15-3, carbohydrate antigen 15–3; CA72-4, sugar chain antigen 72–4; SCC, squamous-cell carcinoma. |
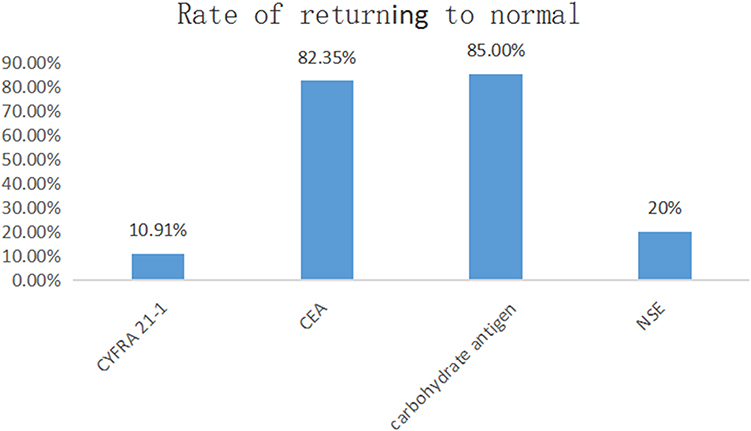 |
Figure 2 The rate of diabetic inpatients with elevation tumor markers that returned to normal after controlling blood glucose. Abbreviations: CEA, carcinoembryonic antigen; NSE, neuron-specific enolase; CYFRA 21–1, cytokeratin 19 fragment. |
Effect of Blood Glucose on the Prevalence of Elevation of CYFRA 21-1
To observe the effect of blood glucose on the prevalence of diabetic patients with elevation of CYFRA 21–1, patients were divided into two groups according to their blood glucose level, the HbA1c ≤8% group and the HbA1c >8% group. The value of CYFRA 21–1 was 2.44 ± 1.58ng/mL in the HbA1c ≤8% group. The value of CYFRA 21–1 was 2.31 ± 1.57ng/mL in the HbA1c >8% group. There was no significant difference in the proportion of diabetic patients with elevation of CYFRA 21–1 between the two groups. The results are shown in Figure 3.
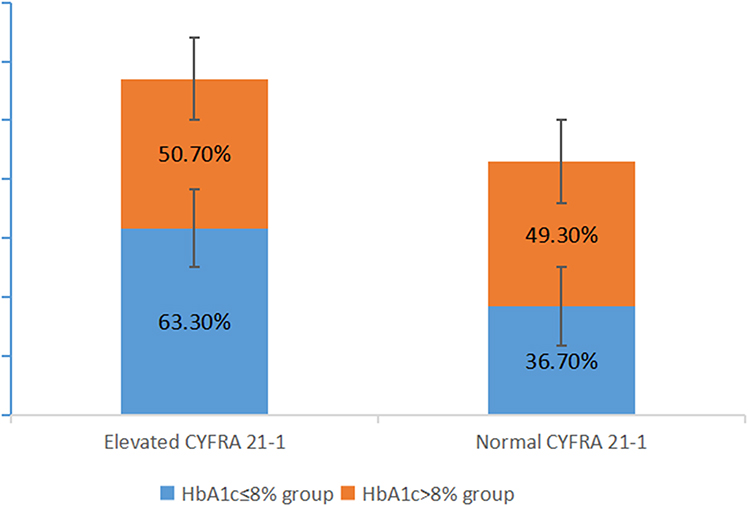 |
Figure 3 The proportion of diabetic patients with elevation of CYFRA 21–1 between the two groups, the HbA1c ≤8% group and the HbA1c >8% group (p = 0.244). Abbreviation: CYFRA 21–1, cytokeratin 19 fragment. |
Comparison Between the Elevated CYFRA 21-1 Group and the Normal CYFRA 21-1 Group
To analyze the relationship of the elevation of CYFRA 21–1 with variables such as blood glucose, patients were divided into two groups, the group with elevation of CYFRA 21–1, and the group with normal CYFRA 21–1. The results are shown in Table 2. It indicated that there was significant difference in age and duration of diabetes between the two groups. There was no significant difference in HbA1c, gender, BMI, blood pressure, total cholesterol, triglycerides, Serum creatinine and ALT (alanine aminotransferase) between the two groups.
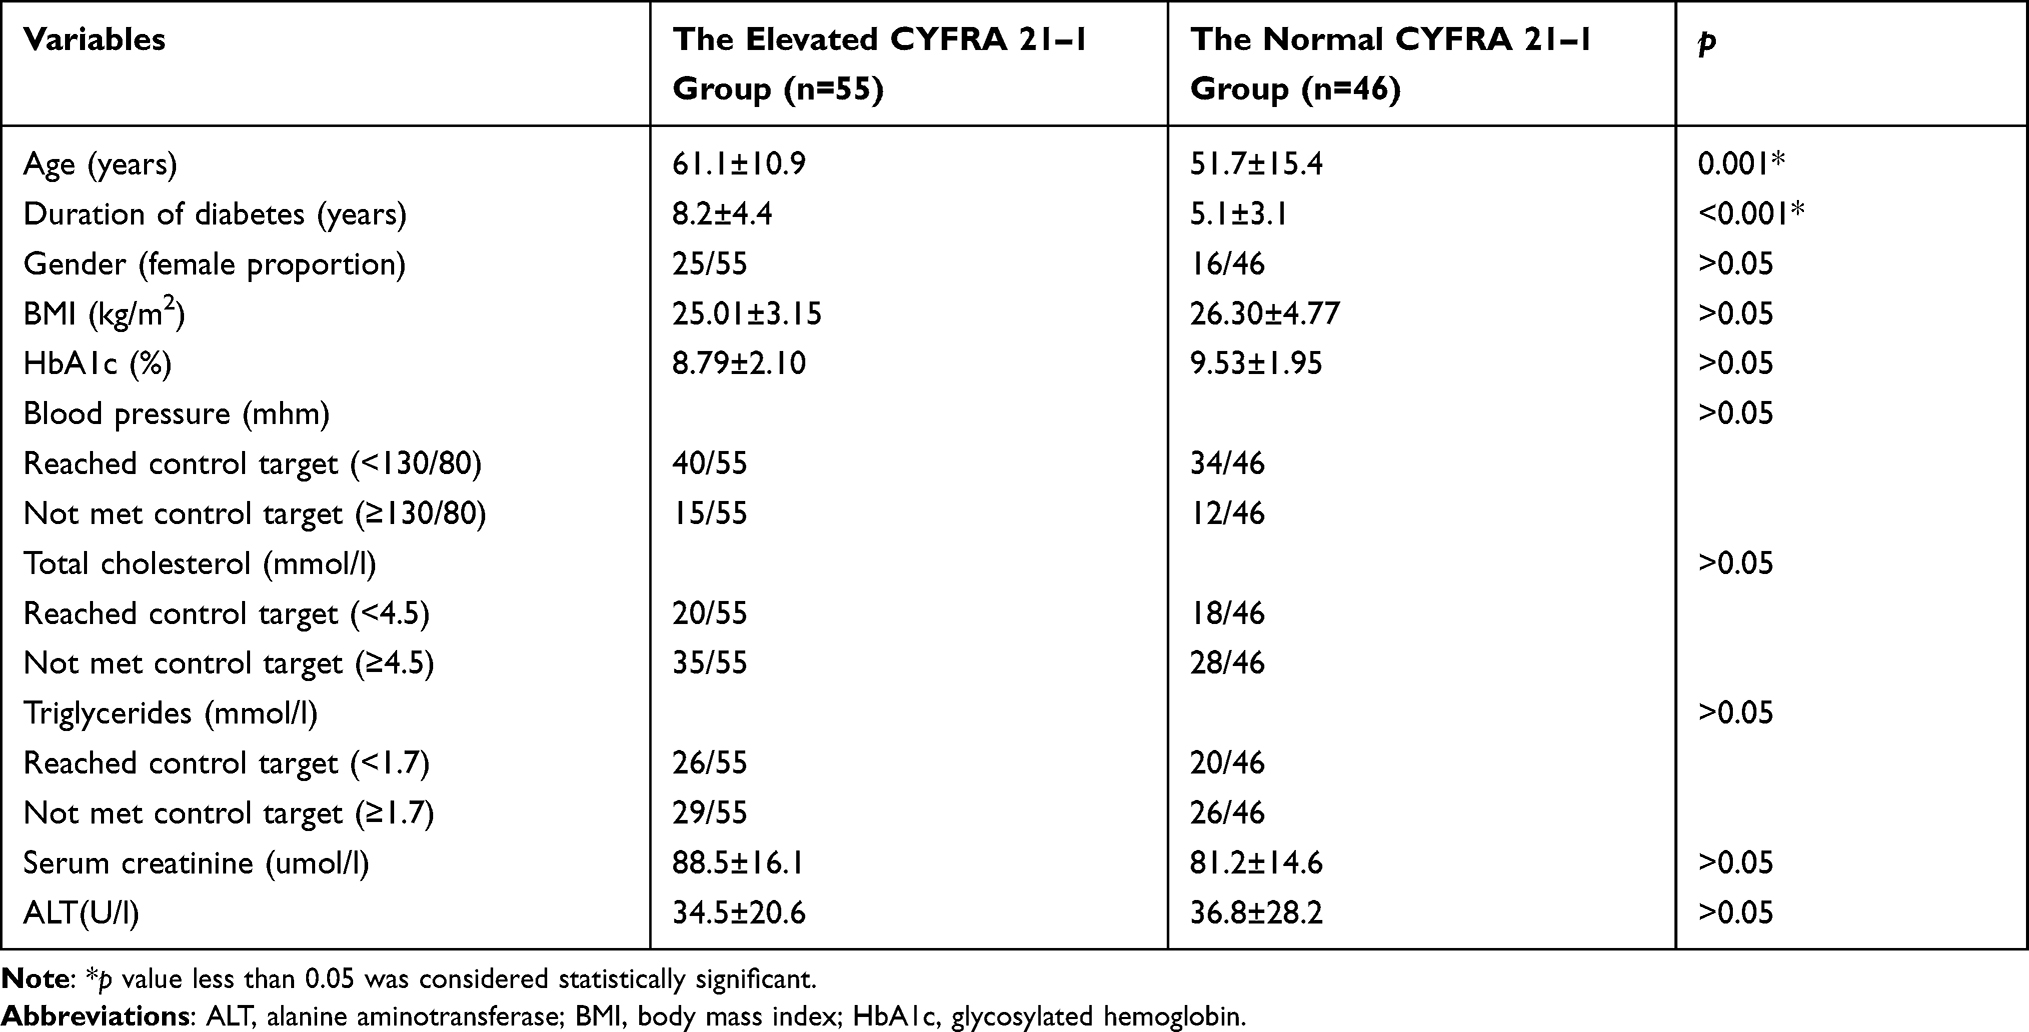 |
Table 2 Comparison Between the Elevated CYFRA 21–1 Group and the Normal CYFRA 21–1 Group |
Comparison Between the Group with Elevation of Tumor Markers Except CYFRA 21-1 and the Group with Normal Tumor Markers
To analyze the relationship of the elevation of tumor markers (except CYFRA 21–1) with variables such as blood glucose levels, patients were divided into two groups, the group with elevation of any one tumor marker and the group with normal tumor markers. In this part, CYFRA 21–1 was excluded from data analysis, because CYFRA 21–1 did not be normal after good blood glucose control. The results are shown in Table 3. There was significant difference in HbA1c between the two groups, p value is less than 0.001. There was no significant difference in other variables between the two groups.
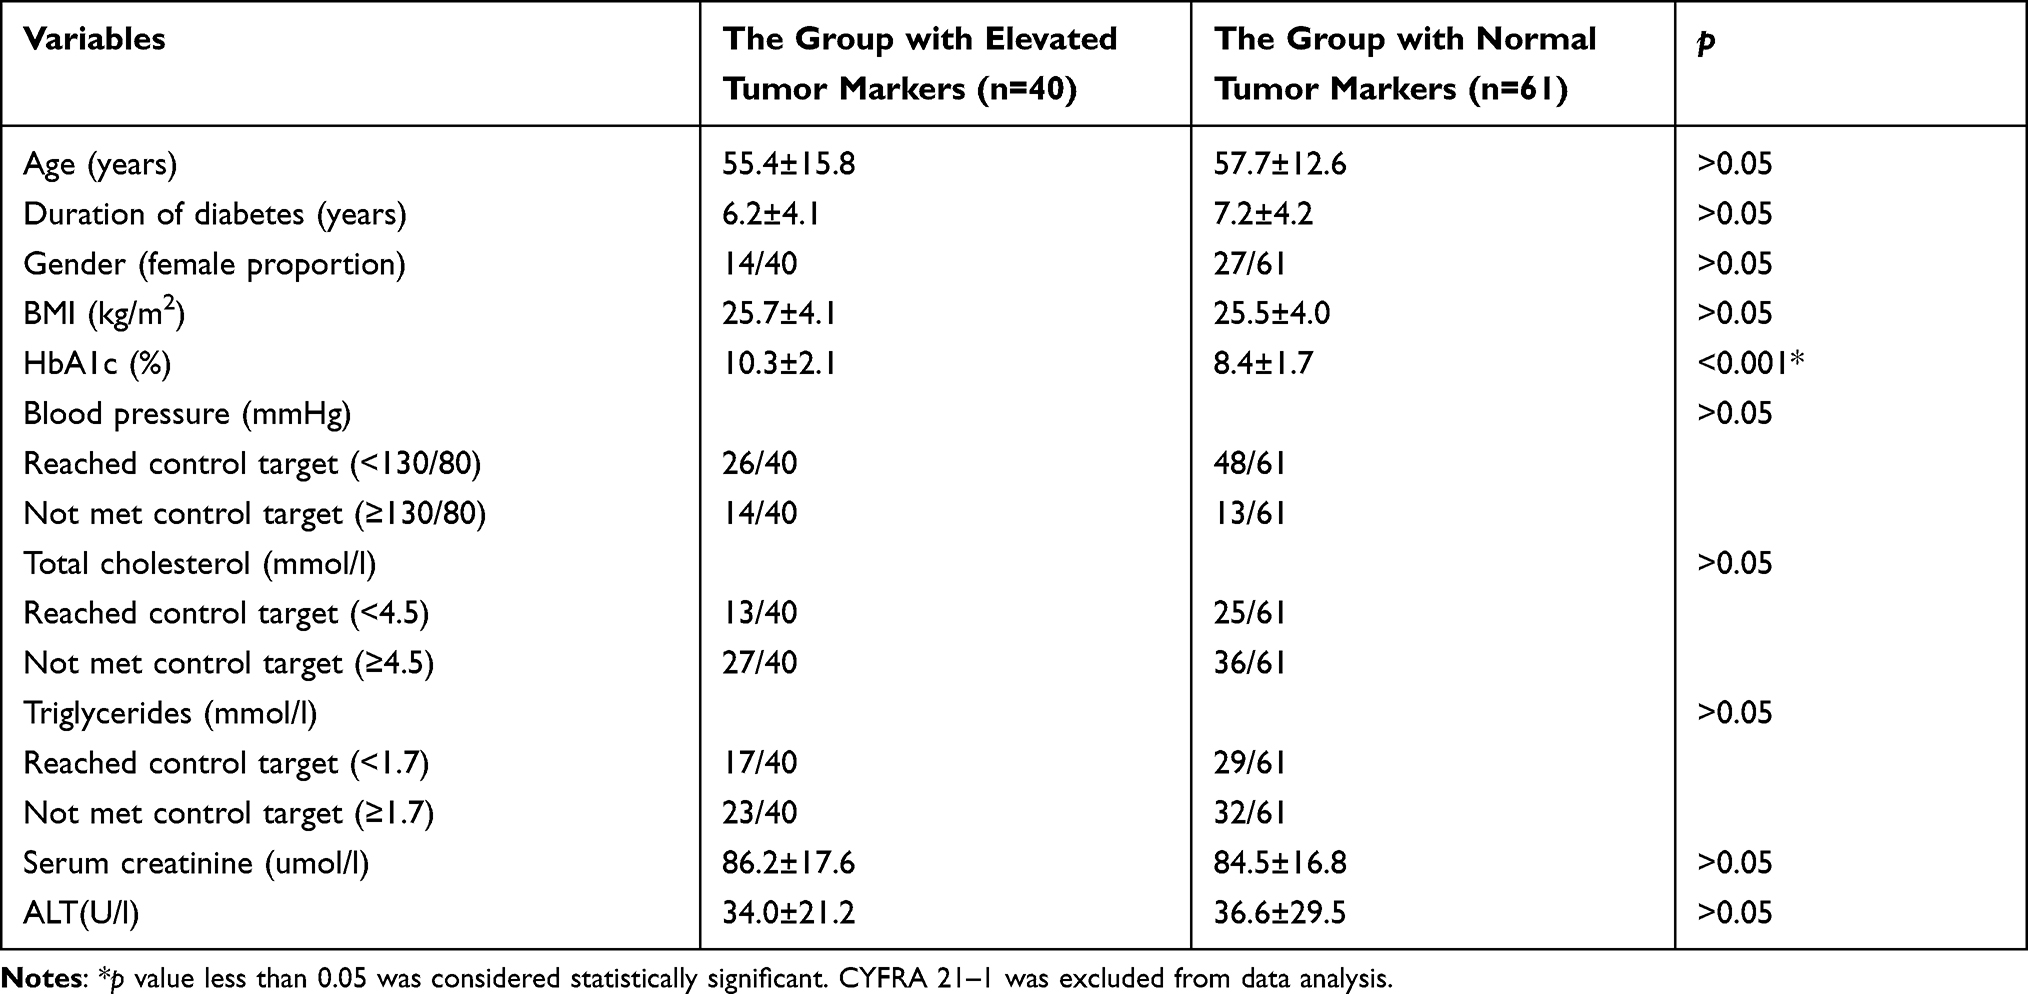 |
Table 3 Comparison Between the Group with Elevated Tumor Markers Except CYFRA 21–1 and the Group with Normal Tumor Markers |
Comparison Between the Group with Elevation of CEA and the Group with Normal CEA
To analyze the relationship of the elevation of CEA with variables such as blood glucose level, patients were divided into two groups, the group with elevation of CEA and the group with normal CEA. The results are shown in Table 4. There was significant difference in HbA1c between the two groups, p value is less than 0.001. There was no significant difference in other variables between the two groups.
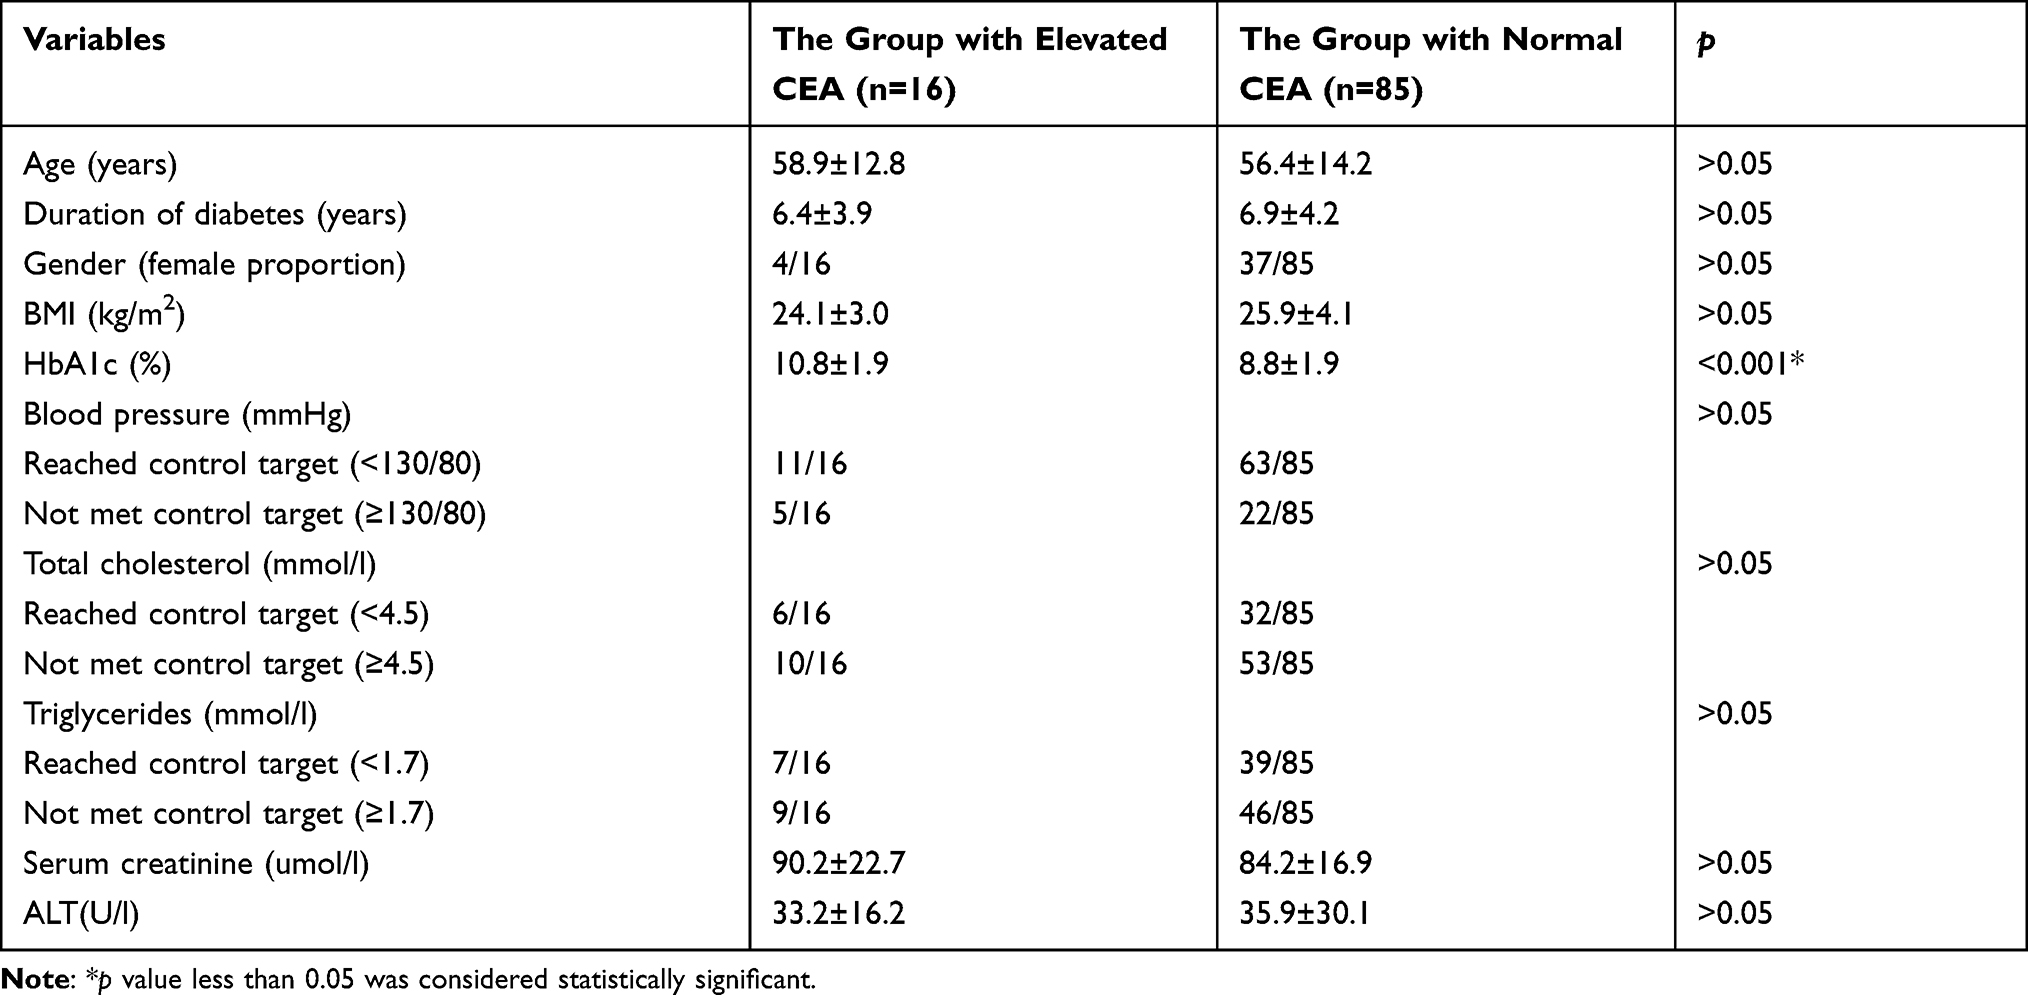 |
Table 4 Comparison Between the Group with Elevation of CEA and the Group with Normal CEA |
Comparison Between the Group with Elevation of Carbohydrate Antigen and the Group with Normal Carbohydrate Antigen
To analyze the relationship of the elevation of carbohydrate antigen with variables such as blood glucose level, patients were divided into two groups, the group with elevation of carbohydrate antigen and the group with normal carbohydrate antigen. Patients with elevation of any one carbohydrate antigen (CA19-9, CA72-4, CA125, or CA15-3) were assigned to the group with elevated carbohydrate antigen. The results are shown in Table 5. There was significant difference in HbA1c between the two groups, p value is less than 0.05. There was no significant difference in other variables between the two groups.
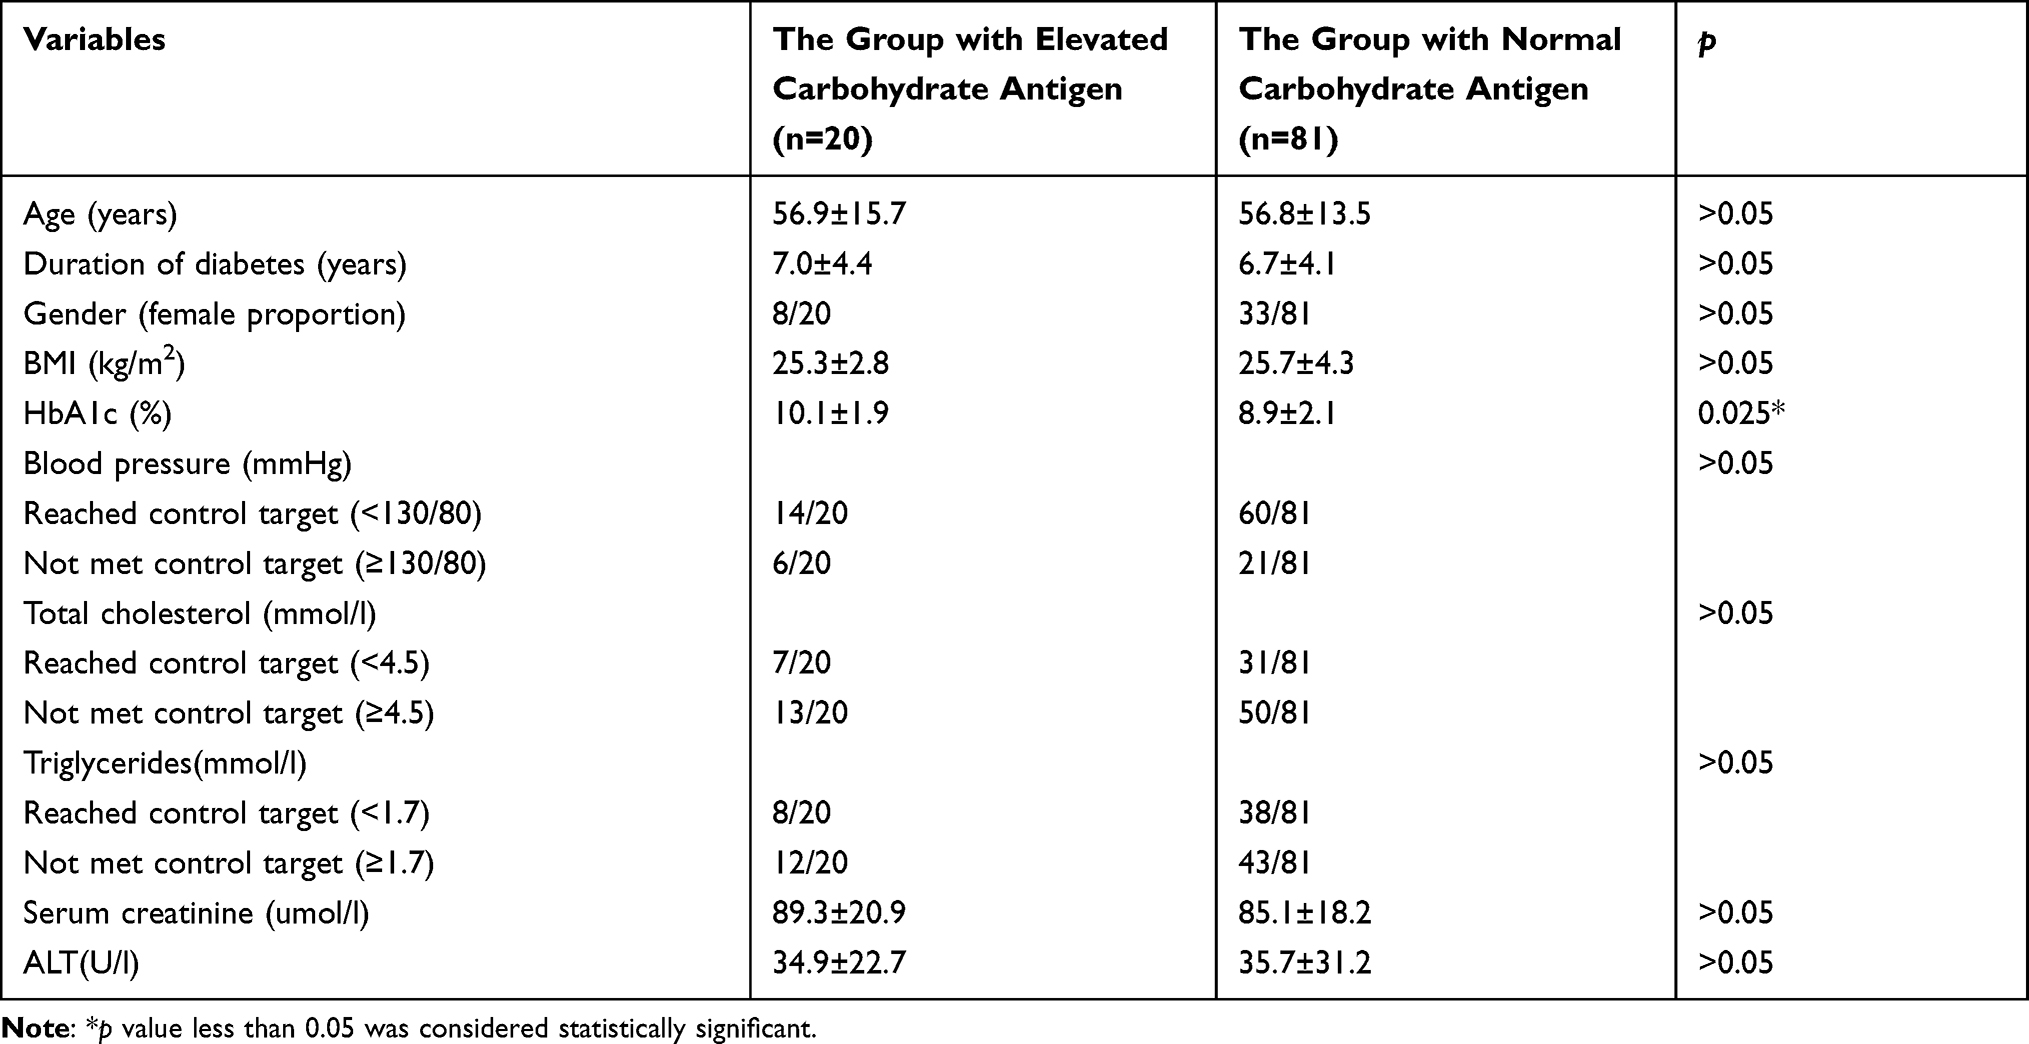 |
Table 5 Comparison Between the Group with Elevation of Carbohydrate Antigen and the Group with Normal Carbohydrate Antigen |
Compare the Proportion of Diabetic Inpatients with Elevation of Tumor Markers Between the High Blood Glucose Group and the Lower Blood Glucose Group
To observe the effect of blood glucose on the prevalence of diabetic inpatients with elevation of tumor markers, patients were divided into two groups according to their blood glucose levels, the HbA1c ≤8% group and the HbA1c >8% group. We compared the prevalence of patients with elevation of any tumor marker (except CYFRA 21–1), CEA and carbohydrate antigen (CA 19–9, CA72-4, CA125 or CA15-3) between the two groups. The value of CEA was 2.30 ± 1.15 ng/mL in the HbA1c ≤8% group. The value of CEA was 3.90 ± 2.35 ng/mL in the HbA1c >8% group. The results are shown in Figure 4. There was significant difference in the prevalence of patients with elevation of any tumor marker (except CYFRA 21–1), p value was less than 0.001. There was significant difference in the prevalence of patients with elevation of CEA, p value was 0.034. There was also a significant difference in the prevalence of patients with elevation of carbohydrate antigen, p value was 0.031.
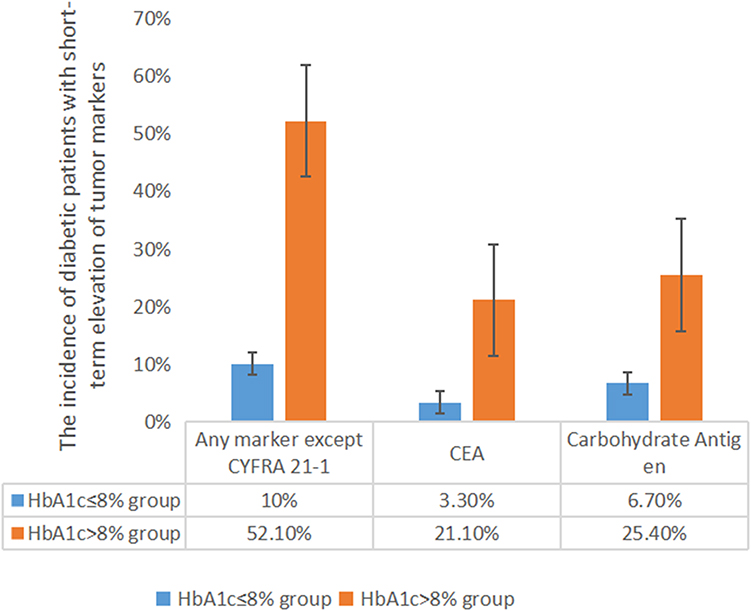 |
Figure 4 Compare the proportion of diabetic inpatients with elevation of tumor markers between the high blood glucose group and the lower blood glucose group. Abbreviations: CYFRA 21–1, cytokeratin 19 fragment; CEA, carcinoembryonic antigen. Notes: 101 diabetic patients were divided into two groups according to HbA1c, HbA1c≤8% group and HbA1c>8% group. All p values were less than 0.05. Carbohydrate antigen including carbohydrate antigen 19–9, 125, 15–3, and carbohydrate antigen 72–4. |
Discussion
There might be an association between diabetes and cancer, including cancer of pancreas, liver, breast, stomach, colorectum, bladder and kidney. It may be caused by hyperinsulinemia, hyperglycemia, chronic inflammation and oxidative stress.3,4,13 The rate of cancer mortality was 29.7 per 10,000 person-years among adults with diabetes in 2010–2015 in the USA, while the rate of cancer mortality was 23.3 per 10,000 person-years among adults without diabetes.14 Therefore, routine screening for cancer was recommended for diabetic patients.15 The main way of cancer screening is to check numerous tumor markers. If the indicators are abnormal, clinicians will carry out further imaging examination of various organs, even invasive biopsy, gastroscopy, enteroscopy, cystoscopy. We found a surprisingly high percentage of diabetic inpatients with elevation of tumor markers through screening for tumor markers, but the actual incidence of cancer was much lower.
The glycosylation markers including CA19-9, CA125, CEA, PSA and AFP are secreted or membrane-shed into the blood and serve as tumor markers.16,17 CEA is one of the most widely used tumor markers worldwide. It is over expressed in cancers of the colon and other organs including the pancreas, lung, prostate, bladder.18,19 However, several non-malignant conditions, including inflammation, hyperglycemia and other inflammatory-related conditions are characterized by increased CEA concentrations.20–22 Our study found that CEA was elevated in 15.8% diabetic patients and there was a significant correlation between elevated CEA and HbA1c. Hospitalized diabetic patients usually had higher blood glucose. As a result, our study found a relatively higher percentage of diabetic patients with elevated CEA. Multiple studies have found that the elevation of CEA occurred more frequently in patients with diabetes than in patients without diabetes, and the elevated CEA in diabetic patients was associated with HbA1c and reversible.6,7,23 These results were consistent with our study results.
CA19-9 expressed by the pancreas might reflect a decline in pancreatic function.24 It was demonstrated that increased serum CA19-9 levels were inversely correlated with pancreatic beta-cell function in diabetic patients.25 Much work has shown that the glucotoxicity generated by hyperglycemia could cause a decline in beta-cell function.26,27 Therefore, the association between elevated CA19-9 and hyperglycemia might be involved in the mechanisms of beta-cell dysfunction. There was also a significant association between CA72-4 levels and hyperglycemia.28 We found the rate of diabetic patients with elevated CA19-9 was 12.9%, and the rate of diabetic patients with elevated CA72-4 was 12.9% too. The rate of diabetic patients with any elevated carbohydrate antigen was 19.8%. We further divided patients into two groups, the group with elevated carbohydrate antigen and the group with normal carbohydrate antigen. The results indicated that there was significant difference in HbA1c between the two groups. We found that elevated carbohydrate antigen in diabetic patients was reversible. For hospitalized patients usually with higher blood glucose than outpatients, we used short-term insulin pump therapy to control blood glucose for those patients with very high blood glucose. After short-term insulin intensive control in hospital, the toxicity of hyperglycemia was relieved, and the islet function would get improved or recovered. These could explain why diabetic patients of our study had such a high rate of patients with elevated carbohydrate antigen and the elevated carbohydrate antigen could return to normal in a short time.
NSE levels were significantly higher in type 2 diabetic patients than in non-diabetic subjects, unexpectedly, 19.4% of diabetic patients had abnormal NSE levels.22 In our study, the rate of diabetic patients with elevated NSE was 9.9%. It was found that elevated NSE levels were closely associated with peripheral neuropathy in the diabetic patients.29 In our study, the rate of diabetic patients with elevated SCC was 2.97%. Due to only 3 cases with elevated SCC in our study, further statistical analysis could not be performed. It was found that elevated SCC levels were not associated with FPG, HbA1c, but were significantly associated with eGFR in diabetic patients.8 The mechanism of the elevation of NSE and SCC in diabetic patients is still unclear and needs further study. However, our study gave a reminder to clinicians that appropriate interpretation of tumor markers NSE and SCC in diabetic patients was necessary to avoid unnecessary further checks and even invasive biopsies.
It was found that CYFRA 21–1 were elevated in the normoalbuminuric diabetic patients with positive rates of 25.0%.8 In our study, CYFRA 21–1 was elevated in 54.5% of hospitalized diabetic patients. It was not correlated with blood glucose and could not return to normal after good blood control. Our results indicated that elevated CYFRA 21–1 was correlated with age and duration of diabetes. N Kubo30 found that there was an increase of CYFRA 21–1 level with aging. Perhaps, this may be one reason of the high prevalence of elevated CYFRA 21–1 among diabetic patients. Because diabetes is an age-related disease.1,31 The cut-off values for CYFRA 21–1 obtained from a normal population may not be applicable to diabetic patients, especially the old. Owing to the limited knowledge in this field, further investigation is needed.
In general, our study indicated that the elevation of tumor markers was common in diabetic inpatients, especially those with poor blood glucose control. CEA and carbohydrate antigen including CA19-9, CA72-4, CA125 and CA15-3 returned to normal or became significantly reduced within 2 weeks after good control of blood glucose. The cut-off values of tumor markers obtained from normal population may not be applicable to diabetic inpatients.
Clinical Perspectives
The global prevalence of diabetes is very high, causing a serious economic burden on society. Diabetic inpatients are routinely screened for tumor markers. Our study revealed that the elevation of tumor markers was common in diabetic inpatients, especially in patients with poor blood glucose control. It was significantly correlated with the blood glucose and reversible. Our study indicated that it was better to re-check and track the tumor markers after blood glucose control, instead of carrying out all kinds of imaging examinations even invasive procedures, such as gastroscopy and colonoscopy to exclude the tumor. Clinicians’ understanding of this situation may avoid the waste of medical resources and unnecessary panic of patients. This work has very important implications for clinicians.
Data Sharing Statement
Data openly available in a public repository that issues datasets with DOIs. The data that support the findings of this study are openly available in Figshare. DOI:10.6084/m9.figshare.15060144.
Disclosure
The author reports no conflicts of interest in this work.
References
1. Saeedi P, Petersohn I, Salpea P, et al. Global and regional diabetes prevalence estimates for 2019 and projections for 2030 and 2045: results from the international diabetes federation diabetes atlas, 9th edition. Diabetes Res Clin Pract. 2019;157:107843. doi:10.1016/j.diabres.2019.107843
2. Ma RCW. Epidemiology of diabetes and diabetic complications in China. Diabetologia. 2018;61(6):1249–1260. doi:10.1007/s00125-018-4557-7
3. Abudawood M. Diabetes and cancer: a comprehensive review. J Res Med Sci. 2019;24:94. doi:10.4103/jrms.JRMS_242_19
4. Srivastava SP, Goodwin JE. cancer biology and prevention in diabetes. Cells. 2020;9(6):1380. doi:10.3390/cells9061380
5. Tsilidis KK, Kasimis JC, Lopez DS, et al. Type 2 diabetes and cancer: umbrella review of meta-analyses of observational studies. BMJ. 2015;350:g7607. doi:10.1136/bmj.g7607
6. Cheng Y-C, Yu-Hsuan L, Hsu C-Y, et al. Synergistic association of carcinoembryonic antigen and carbohydrate antigen 19-9 on the risk of abnormal glucose regulation diabetes. Metab Syndr Obes. 2020;13:1933–1942. doi:10.2147/DMSO.S256223
7. Chung S, Lee Y, Roh EY. HbA1c showed a positive association with carcinoembryonic antigen (CEA) level in only diabetes, not prediabetic or normal individuals. J Clin Lab Anal. 2019;33(6):e22900. doi:10.1002/jcla.22900
8. Chen J, Tao F, Zhang B, et al. Elevated squamous cell carcinoma antigen, cytokeratin 19 fragment, and carcinoembryonic antigen levels in diabetic nephropathy. Int J Endocrinol. 2017;2017:5304391. doi:10.1155/2017/5304391
9. Jeong S, Park MJ, Song W, et al. Current immunoassay methods and their applications to clinically used biomarkers of breast cancer. Clin Biochem. 2020;78:43–57. doi:10.1016/j.clinbiochem.2020.01.009
10. Bergman M, Abdul-Ghani M, DeFronzo RA, et al. Review of methods for detecting glycemic disorders. Diabetes Res Clin Pract. 2020;165:108233. doi:10.1016/j.diabres.2020.108233
11. Burchill MA, Finlon JM, Goldberg AR, et al. Oxidized low-density lipoprotein drives dysfunction of the liver lymphatic system. Cell Mol Gastroenterol Hepatol. 2021;11(2):573–595. doi:10.1016/j.jcmgh.2020.09.007
12. Dai B, Xu L, Jiankun X, et al. Synergistic effects of magnesium ions and simvastatin on attenuation of high-fat diet-induced bone loss. Bioact Mater. 2021;6(8):2511–2522. doi:10.1016/j.bioactmat.2021.01.027
13. Wojciechowska J, Krajewski W, Bolanowski M, et al. Diabetes and cancer: a review of current knowledge. Exp Clin Endocrinol Diabetes. 2016;124(5):263–275. doi:10.1055/s-0042-100910
14. Harding JL, Andes LJ, Gregg EW, et al. Trends in cancer mortality among people with vs. without diabetes in the USA, 1988–2015. Diabetologia. 2020;63:75–84. doi:10.1007/s00125-019-04991-x
15. Suh S, Kim KW. Diabetes and cancer: cancer should be screened in routine diabetes assessment. Diabetes Metab J. 2019;43(6):733–743. doi:10.4093/dmj.2019.0177
16. Martins ÁM, Ramos CC, Freitas D, et al. Glycosylation of cancer extracellular vesicles: capture strategies, functional roles and potential clinical applications. Cells. 2021;10(1):109. doi:10.3390/cells10010109
17. Silsirivanit A. Glycosylation markers in cancer. Adv Clin Chem. 2019;89:189–213.
18. Benchimol S, Fuks A, Jothy S, et al. Carcinoembryonic antigen, a human tumor marker, functions as an intercellular adhesion molecule. Cell. 1989;57(2):327–334. doi:10.1016/0092-8674(89)90970-7
19. Konishi T, Shimada Y, Hsu M, et al. Association of preoperative and postoperative serum carcinoembryonic antigen and colon cancer outcome. JAMA Oncol. 2018;4(3):309–315. doi:10.1001/jamaoncol.2017.4420
20. Lee JY, Lee HK, Lee DC, et al. Serum carcinoembryonic antigen is associated with abdominal visceral fat accumulation in female Korean nonsmokers. PLoS One. 2012;7(8):e43518. doi:10.1371/journal.pone.0043518
21. Bae U, Shim JY, Lee HR, et al. Serum carcinoembryonic antigen level is associated with arterial stiffness in healthy Korean adult. Clin Chim Acta. 2013;415:286–289. doi:10.1016/j.cca.2012.10.052
22. Kelleher M, Singh R, O’Driscoll CM, et al. Carcinoembryonic antigen (CEACAM) family members and inflammatory bowel disease. Cytokine Growth Factor Rev. 2019;47:21–31. doi:10.1016/j.cytogfr.2019.05.008
23. Chen PC, Lin HD. Reversible high blood CEA and CA19-9 concentrations in a diabetic patient. Libyan J Med. 2012;7:19572.
24. Williams JA, Goldfine ID. The insulin-pancreatic acinar axis. Diabetes. 1985;34(10):980–986. doi:10.2337/diab.34.10.980
25. Yu H, Li R, Zhang L, et al. CA19-9 level associated with metabolic control and pancreatic beta cell function in diabetic patients. Exp Diabetes Res. 2012;2012:745189. doi:10.1155/2012/745189
26. Weir GC. Glucolipotoxicity, β-Cells, and diabetes: the emperor has no clothes. Diabetes. 2020;69(3):273–278. doi:10.2337/db19-0138
27. Lytrivi M, Castell A-L, Poitout V, et al. Recent insights into mechanisms of β-Cell Lipo- and glucolipotoxicity in type 2 diabetes. J Mol Biol. 2020;432(5):1514–1534.22. doi:10.1016/j.jmb.2019.09.016
28. Shang X, Song C, Xiaoming D, et al. The serum levels of tumor marker CA19-9, CEA, CA72-4, and NSE in type 2 diabetes without malignancy and the relations to the metabolic control. Saudi Med J. 2017;38(2):204–208.
29. Li J, Zhang H, Xie M, et al. NSE, a potential biomarker, is closely connected to diabetic peripheral neuropathy. Diabetes Care. 2013;36(11):3405–3410. doi:10.2337/dc13-0590
30. Kubo N, Gang Y, Okuno M, et al. Clinical evaluation of a lung cancer-associated protein antigen, cytokeratin 19 fragment: II. Radioimmunoassay and effect of aging and smoking over serum level of normal individuals. Rinsho Byori. 1993;41(11):1260–1264.
31. LeRoith D, Biessels GJ, Braithwaite SS, et al. Treatment of Diabetes in Older Adults: an Endocrine Society* Clinical Practice Guideline. J Clin Endocrinol Metab. 2019;104(5):1520–1574.
 © 2022 The Author(s). This work is published and licensed by Dove Medical Press Limited. The full terms of this license are available at https://www.dovepress.com/terms.php and incorporate the Creative Commons Attribution - Non Commercial (unported, v3.0) License.
By accessing the work you hereby accept the Terms. Non-commercial uses of the work are permitted without any further permission from Dove Medical Press Limited, provided the work is properly attributed. For permission for commercial use of this work, please see paragraphs 4.2 and 5 of our Terms.
© 2022 The Author(s). This work is published and licensed by Dove Medical Press Limited. The full terms of this license are available at https://www.dovepress.com/terms.php and incorporate the Creative Commons Attribution - Non Commercial (unported, v3.0) License.
By accessing the work you hereby accept the Terms. Non-commercial uses of the work are permitted without any further permission from Dove Medical Press Limited, provided the work is properly attributed. For permission for commercial use of this work, please see paragraphs 4.2 and 5 of our Terms.