")
Back to Journals » Cancer Management and Research » Volume 10
The fluctuating incidence, improved survival of patients with breast cancer, and disparities by age, race, and socioeconomic status by decade, 1981–2010
Authors Lu G, Li J, Wang S, Pu J, Sun H, Wei Z, Ma Y, Wang J, Ma H
Received 9 May 2018
Accepted for publication 20 August 2018
Published 30 October 2018 Volume 2018:10 Pages 4899—4914
DOI https://doi.org/10.2147/CMAR.S173099
Checked for plagiarism Yes
Review by Single anonymous peer review
Peer reviewer comments 4
Editor who approved publication: Professor Lu-Zhe Sun
Guanming Lu,1,* Jie Li,2,* Shuncong Wang,3,* Jian Pu,1 Huanhuan Sun,3 Zhongheng Wei,4 Yanfei Ma,1 Jun Wang,5 Haiqing Ma3
1Department of Breast and Thyroid Surgery, Affiliated Hospital of Youjiang Medical University for Nationalities, Baise, Guangxi 533000, China; 2Department of Breast and Thyroid Surgery, The First Affiliated Hospital of Sun Yat-sen University, Guangzhou, Guangdong 510080, China; 3Department of Oncology, The Fifth Affiliated Hospital of Sun Yat-sen University, Zhuhai, Guangdong 519000, China; 4Department of Oncology, Affiliated Hospital of Youjiang Medical University for Nationalities, Baise, Guangxi 533000, China; 5Department of Oncology, General Hospital, Jinan Command of People’s Liberation Army, Jinan, Shandong 250000, China
*These authors contributed equally to this work
Purpose: Breast cancer is the most commonly diagnosed cancer and the leading cause of cancer-related deaths among women worldwide. However, the data on breast cancer incidence and survival over a long period, especially the dynamic changes in the role of race and socioeconomic status (SES), are scant.
Materials and methods: To evaluate treatment outcomes of patients with breast cancer over the past 3 decades, the data from the Surveillance, Epidemiology, and End Results (SEER) registries were used to assess the survival of patients with breast cancer. Period analysis was used to analyze the incidence and survival trend; survival was evaluated by the relative survival rates (RSRs) and Kaplan–Meier analyses. The HRs for age, race, stage, and SES were assessed by Cox regression.
Results: A total of 433,366 patients diagnosed with breast cancer between 1981 and 2010 were identified from the original nine SEER registries. The incidences of breast cancer in each decade were 107.1 per 100,000, 117.5 per 100,000, and 109.8 per 100,000. The 10-year RSRs improved each decade, from 70.8% to 81.5% to 85.6% (P<0.0001). The lower survival in black race and high-poverty group is confirmed by Kaplan–Meier analyses and RSRs. Furthermore, Cox regression analyses demonstrated that age, race, SES, and stage are independent risk factors for patients with breast cancer in each decade.
Conclusion: The current data demonstrated a fluctuating incidence trend with improving survival rates of patients with breast cancer over the past 3 decades. In addition, the survival disparity exists among different races, ages, SESs, and stages.
Keywords: breast cancer, incidence, relative survival rates, race and socioeconomic status
Introduction
Breast cancer is the most common malignancy, accounting for up to 23% of cancer cases; it accounts for 14% of cancer-related deaths.1 In the United States, breast cancer accounts for about 30% of cancer cases; it is the second leading cause of cancer-related death among women.1
Despite the increasing understanding of breast cancer, its incidence remains extremely high.1 An estimated 252,710 cases were diagnosed in 2017, with an estimated 71,280 deaths in the United States.1 Under such conditions, many basic and clinical studies have been performed, which promoted the development of novel agents and clinical management; therefore, the survival rates of breast cancer patients are expected to increase over time.2 In addition, it is also very important not only to study breast cancer biologically but also to demonstrate epidemiological trends that can not only help boost clinical management but also help politicians balance incidence and survival disparities among different races and socioeconomic statuses (SESs) groups.
Previous studies concerning patients’ survival rates tended to analyze patients who resided in specific areas or patients who received surgical resection or other treatments or had various marital statuses by static analysis on survival.3–5 However, the data on breast cancer incidence and survival over a long period, especially the dynamic changes in the roles of races and SES, are scant.
We aimed to demonstrate the incidence and survival trends during a long period and to clarify the role of race and SES on patient outcomes for breast cancer based on a large sample size. The current study, based on the period analysis, evaluated trends in the 10-year relative survival rates (RSRs) of breast cancer cases and clarified the role of age, race, and SES on RSRs through an analysis of the Surveillance, Epidemiology, and End Results (SEER) data.
Materials and methods
All data in the current study were extracted from the SEER database, which was developed and maintained by the National Cancer Institute (www.seer.cancer.gov). The SEER database is freely available to scientists and researchers. The ethnic approval is not required as this is a retrospective study and does not involve any intervention on the included cases. In the current study, only cases from the original nine registry sites were included, accounting for approximately 10% of the US population. Specifically, the nine sites are Connecticut, Iowa, New Mexico, Utah, and Hawaii and the metropolitan areas of Atlanta, Detroit, San Francisco – Oakland, and Seattle – Puget Sound. It distinguishes itself by being the only comprehensive source of US population-based information.6
Female patients with breast cancer (ICD for Oncology, third edition site codes: C50.0–C50.9) were identified in the SEER registries.7 We assessed the incidences of breast cancer and RSR for patients with breast cancer, after dividing patients into three groups according to their year of diagnosis (1981–1990, 1991–2000, and 2001–2010). Cases were divided into groups by demographic characteristics, including SES, race, and age at diagnosis (0–19, 20–39, 40–54, 55–69, and 70+ years). The SES was defined as previously reported.8–10 SES of the area was determined by the county poverty rate, which was defined as the percentage of people in the county living below the national poverty threshold in the 2000 US Census.8 The county poverty rates were classified into three levels, using the same thresholds used in the National Cancer Institute monograph: <10% (low-poverty areas), 10%–19.99% (medium-poverty areas), and ≥20% (high-poverty areas). While analyzing racial survival trends, we included only whites and blacks. As whites and blacks account for the majority of US population, there is heterogeneity in the others category, which account for approximately 11% of the general population in the United States. The RSR was calculated via SEER*stat software, and briefly, it is the number of cancer survivors at a specific time point divided by the number of patients in the cohort at the beginning, adjusted by age. The overall survival (OS) was defined as the interval from the time of diagnosis to the time of death. The current study utilized the period analyses methods that demonstrated the survival trend, and therefore, we selected two classic time points in oncologic study, 12 and 60 months. In addition, as breast cancer patients’ survival is relatively long, 120-month RSR is also calculated. The incidence and survival rates of patients were calculated by race information provided in the SEER database, including White, Black, Others (American Indian/Alaska Native, Asian/Pacific Islander), and Unknown. This race classification system is the most commonly used in SEER-based publication, in line with North American Association of Central Cancer Registries (NAACCR) Race and Ethnicity Identifier Assessment Project, and the Hispanic are categorized as whites. The stage data were defined according to the adjusted American Joint Committee on Cancer (AJCC), sixth edition; stage 0–1 and stage 2–4 were defined as the early and mid-late stages, respectively. The percentages of early- and mid-late-stage breast cancer patients by age, race, SES, and year of diagnosis were calculated. Patients without known race (1,664 cases), county-level poverty rate (180 cases), or stage (132,556 cases) were excluded from the stratification analysis. Autopsy cases or cases reported by a death certificate (2,717 cases) were not included.
The current study was designed to clarify the incidence and survival trend over time. Incidence rates, age-adjusted incidence, and survival time were calculated as previously reported in SEER*Stat 8.3.4 software (available at seer.cancer.gov/seerstat) based on the Ederer II method.11–14 The estimated OS difference was evaluated by Kaplan–Meier analyses and tested by a two-tailed log-rank test, with a two-tailed P value <0.01 being considered statistically significant. Cox regression analyses were performed by the Stata 14.0 software (StataCorp LP, College Station, TX, USA).
Results
Trends in breast cancer incidence over 3 decades
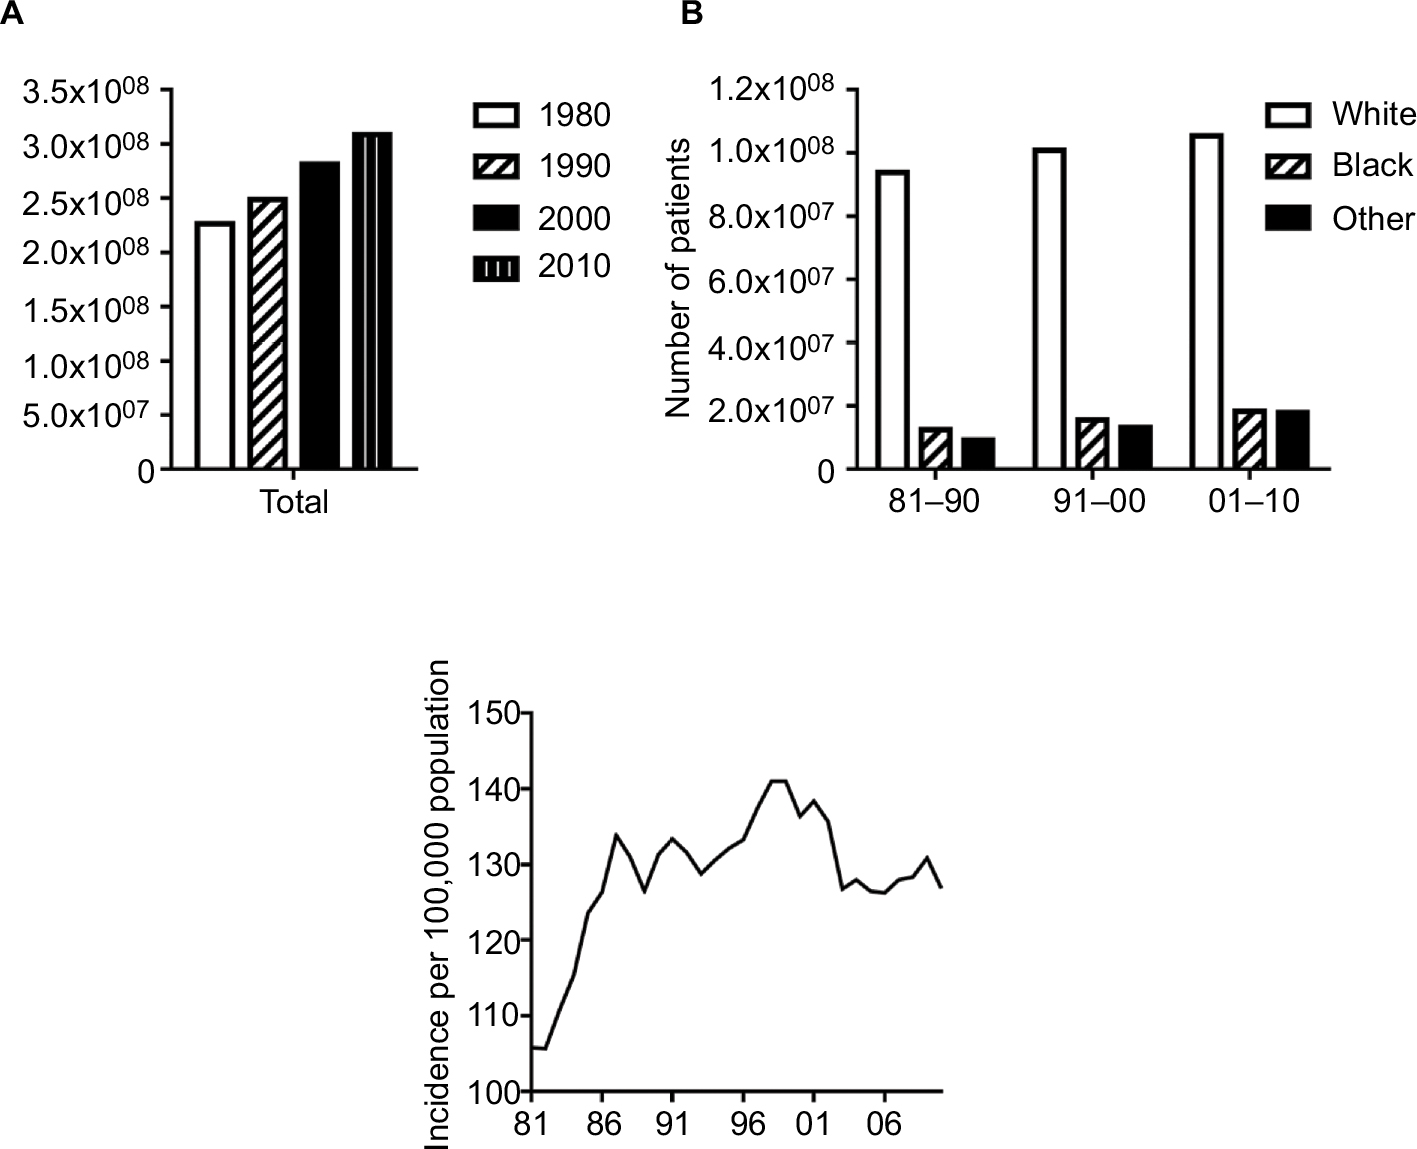
In this study, a total of 433,366 breast cancer patients were identified between 1981 and 2010 in the nine regions. The total incidence of breast cancer was 107.1 per 100,000 during the 1981–1990 period (Figure 1A and Table S1). It increased to 117.5 per 100,000 during the 1991–2000 period and then decreased to 109.8 per 100,000 in the third decade. This trend can be seen in most age groups except for those aged 20–39 years (Figure 1A). The number of breast cancer cases continually increased over time (from 116,103 to 150,831 to 166,432, respectively) as a result of the increased general population (Figure 1B, Table S1, and Figure S1A and B). According to the data from the US Census Bureau, the histological populations in 1980, 1990, 2000, and 2010 were 226,545,805, 248,709,873, 281,421,906, and 308,745,538, respectively, with growth rates of 9.8%, 13.2%, and 9.7%, respectively. This increase was especially evident in patients aged 40–54 years (from 28,762 to 44,689 to 52,682) and 55–69 years (from 41,990 to 48,110 to 58,206). This small fluctuation in incidence for each year is shown in Figure S1C.
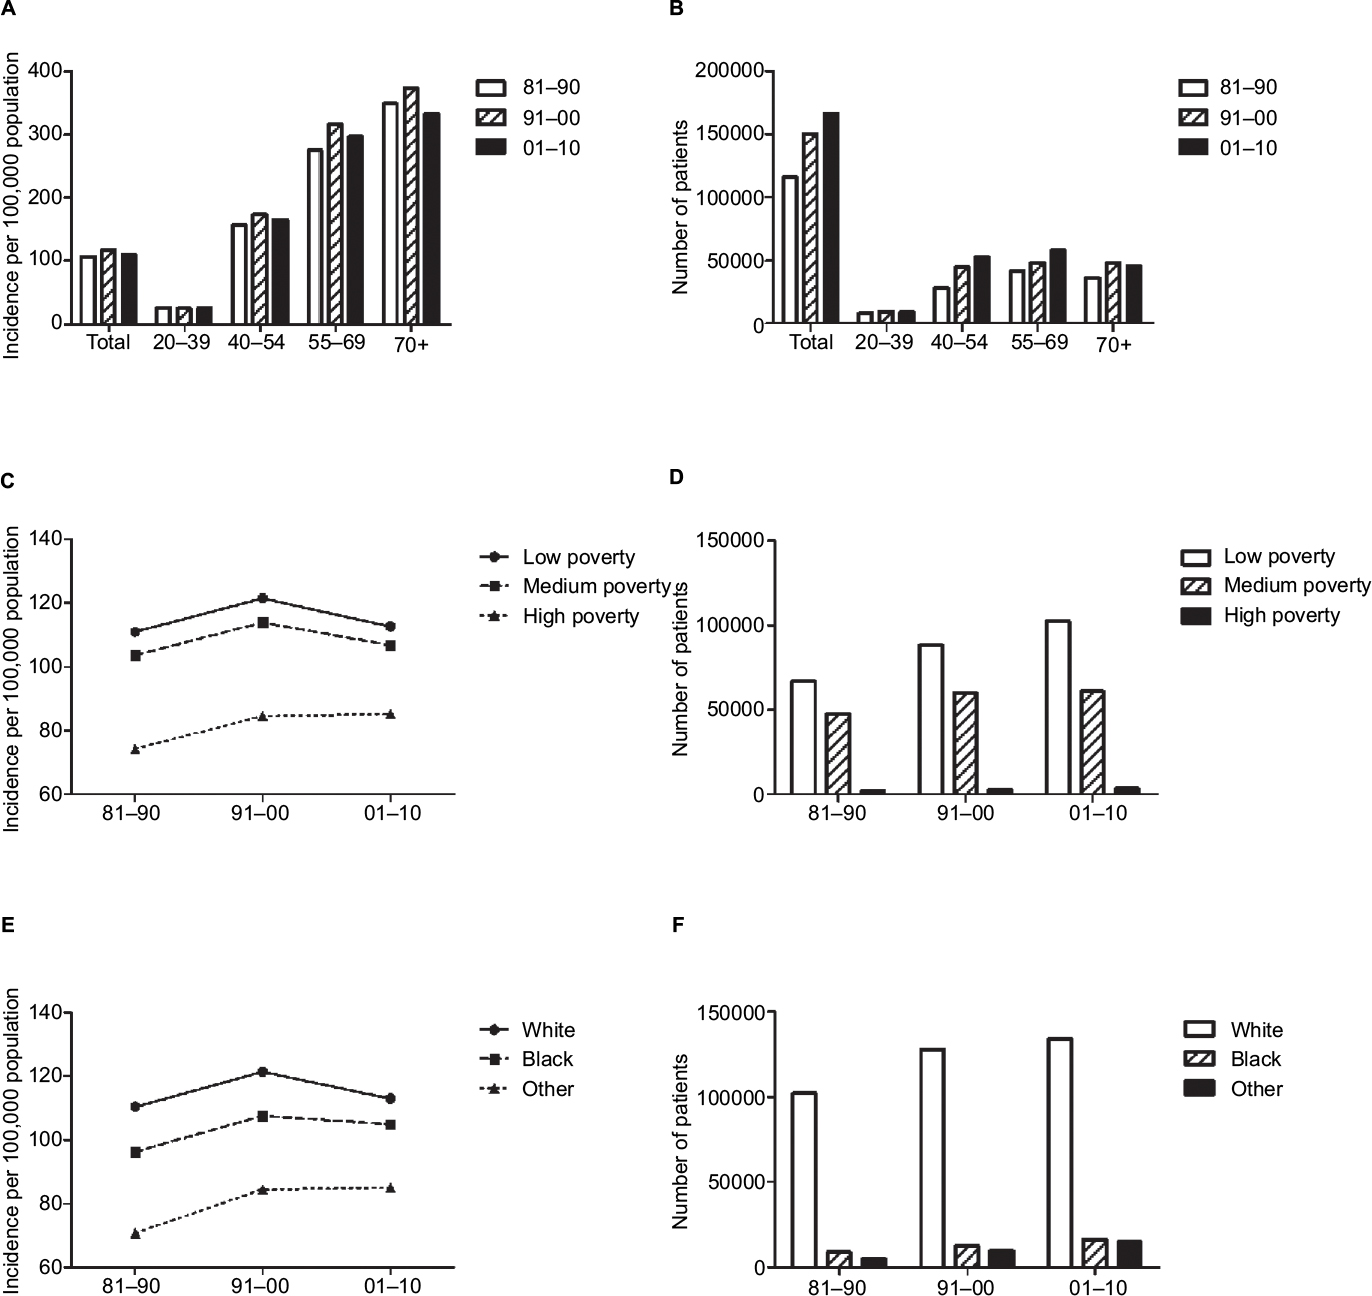 | Figure 1 Summary of incidences of patients diagnosed with breast cancer between 1981 and 2010 at the original nine SEER sites. Note: Incidence (A, C, and E) and number (B, D, and F) of breast cancer cases are shown by age (total and ages 0–49, 50–64, 65–79, and 80+ years), SES (low, medium, and high poverty) and race (white, black, and others) groups, and calendar period. Abbreviations: SEER, Surveillance, Epidemiology, and End Results; SES, socioeconomic status. |
Breast cancer incidence by SES and race
The low-poverty group had the highest incidence of breast cancer over the 3 decades, whereas the high-poverty group had the lowest incidence (Figure 1C and Table S1). The incidence gap between the medium- and high-poverty groups was significantly larger than the gap between the low- and medium-poverty groups. In all SES subgroups, breast cancer incidences increased over the first 2 decades (from 111.0 to 121.5, from 103.6 to 113.9, and from 74.2 to 84.5 per 100,000 in the low-, medium- and high-poverty groups, respectively). In the last decade, the incidences of both the low- and medium-poverty groups decreased markedly (from 121.5 to 112.7 and from 113.9 to 106.7 per 100,000, respectively), unlike the stable incidence in the high-poverty group, or even went through a slight increase (from 84.5 to 85.1 per 100,000). In addition, the number of patients increased in all groups over time (from 66,755 to 88,162 to 102,444 in the low-poverty group, from 47,544 to 59,994 to 60,542 in the medium-poverty group, and from 1,776 to 2,635 to 3,364 in the high-poverty group; Figure 1D and Table S1). When the sample was divided by race, whites always showed the highest incidences over the past 3 decades (Figure 1E and Table S1). The breast cancer incidences per 100,000 for both blacks and whites increased during the first 2 decades and then decreased during the third decade (from 110.4 to 121.4 to 113.0 for whites and from 96.3 to 107.5 to 104.9 for blacks, respectively). Whites showed 14.6% and 12.9% higher incidences than blacks during the first and second decades, respectively; this difference in incidence was significantly reduced to 7.7% in the last decade. The number of cases in both whites and blacks increased over the courses of 3 decades (from 102,192 to 127,904 to 134,264 for whites and from 8,635 to 12,702 to 16,444 for blacks), and whites always had a significantly larger number of cases than blacks (Figure 1F and Table S1). However, the respective incidence changed from 96.3 to 107.5 to 104.9 due to the growing Black population size, from 12,460,444 to 15,523,049 to 18,370,402, over the 3 decades (Figure S1B).
Trends in relative survival estimates over 3 decades
The RSRs of breast cancer patients significantly improved over the 3 decades, and the 10-year RSR showed the most significant increase (from 70.8% to 81.5% to 85.6%; Table 1 and Figure 2A, C, E, G, and I). The 5-year survival rate in the second decade increased by 8.68% compared with that in the first decade, and it then slightly increased by 3.31% in the third decade. A similar tendency was found in 10-year RSR. Moreover, this increase in the survival rate in the second decade was more evident in some age groups, especially in the old group. For instance, the 10-year survival rate of patients aged 20–39 years increased by 11.5% (64.3% vs 71.7%, P<0.0001) and by 7.9% (71.7% vs 77.4%, P<0.0001) in the second and third decades, respectively, while the corresponding numbers were 12.2% (72.4% vs 81.2%, P<0.0001) and 5.8% (81.2% vs 85.9%, P<0.0001) for patients aged 40–54 years, 16.2% (71.4% vs 83.0%, P<0.0001) and 4.8% (83.0% vs 87.0%, P<0.0001) for patients aged 55–69 years, and 17.5% (70.4% vs 82.7%, P<0.0001) and 3.3% (82.7% vs 85.4%, P<0.0001) for patients older than 70 years. Survival increased over time in all age groups; and the increase in the first 2 decades was more significant than that in the last 2 decades (Figure 2B, D, F, H, and J).
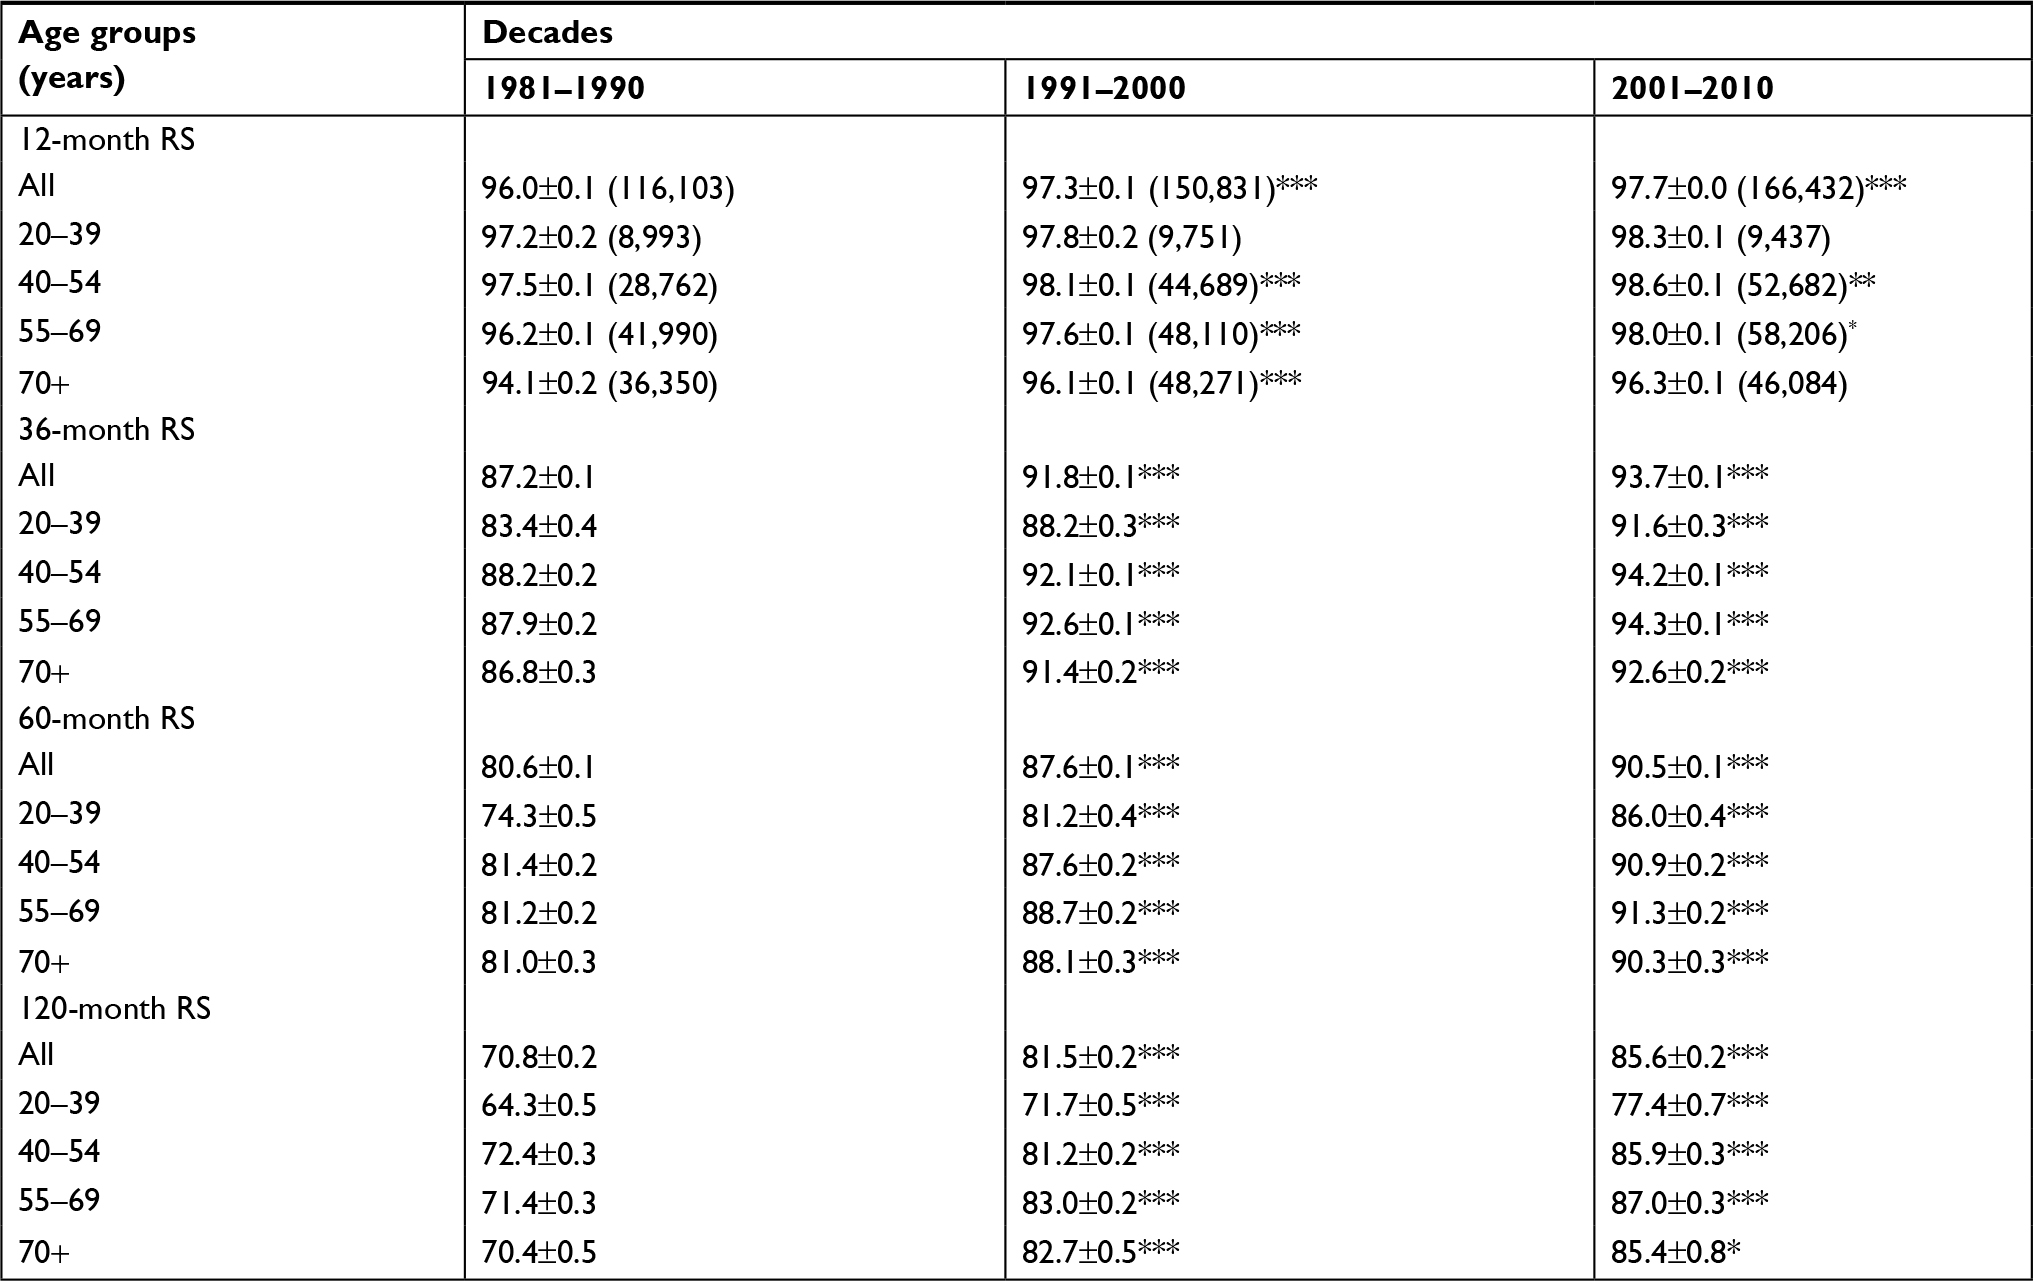 | Table 1 RS rates of breast cancer patients during the periods of 1981–1990, 1991–2000, and 2001–2010 at nine SEER sites Notes: Data are represented as mean±SEM, with number of patients in parentheses. *P<0.01, **P<0.001, and ***P<0.0001 for comparisons with the preceding decade. Abbreviations: RS, relative survival; SEM, standard error of the mean; SEER, Surveillance, Epidemiology, and End Results. |
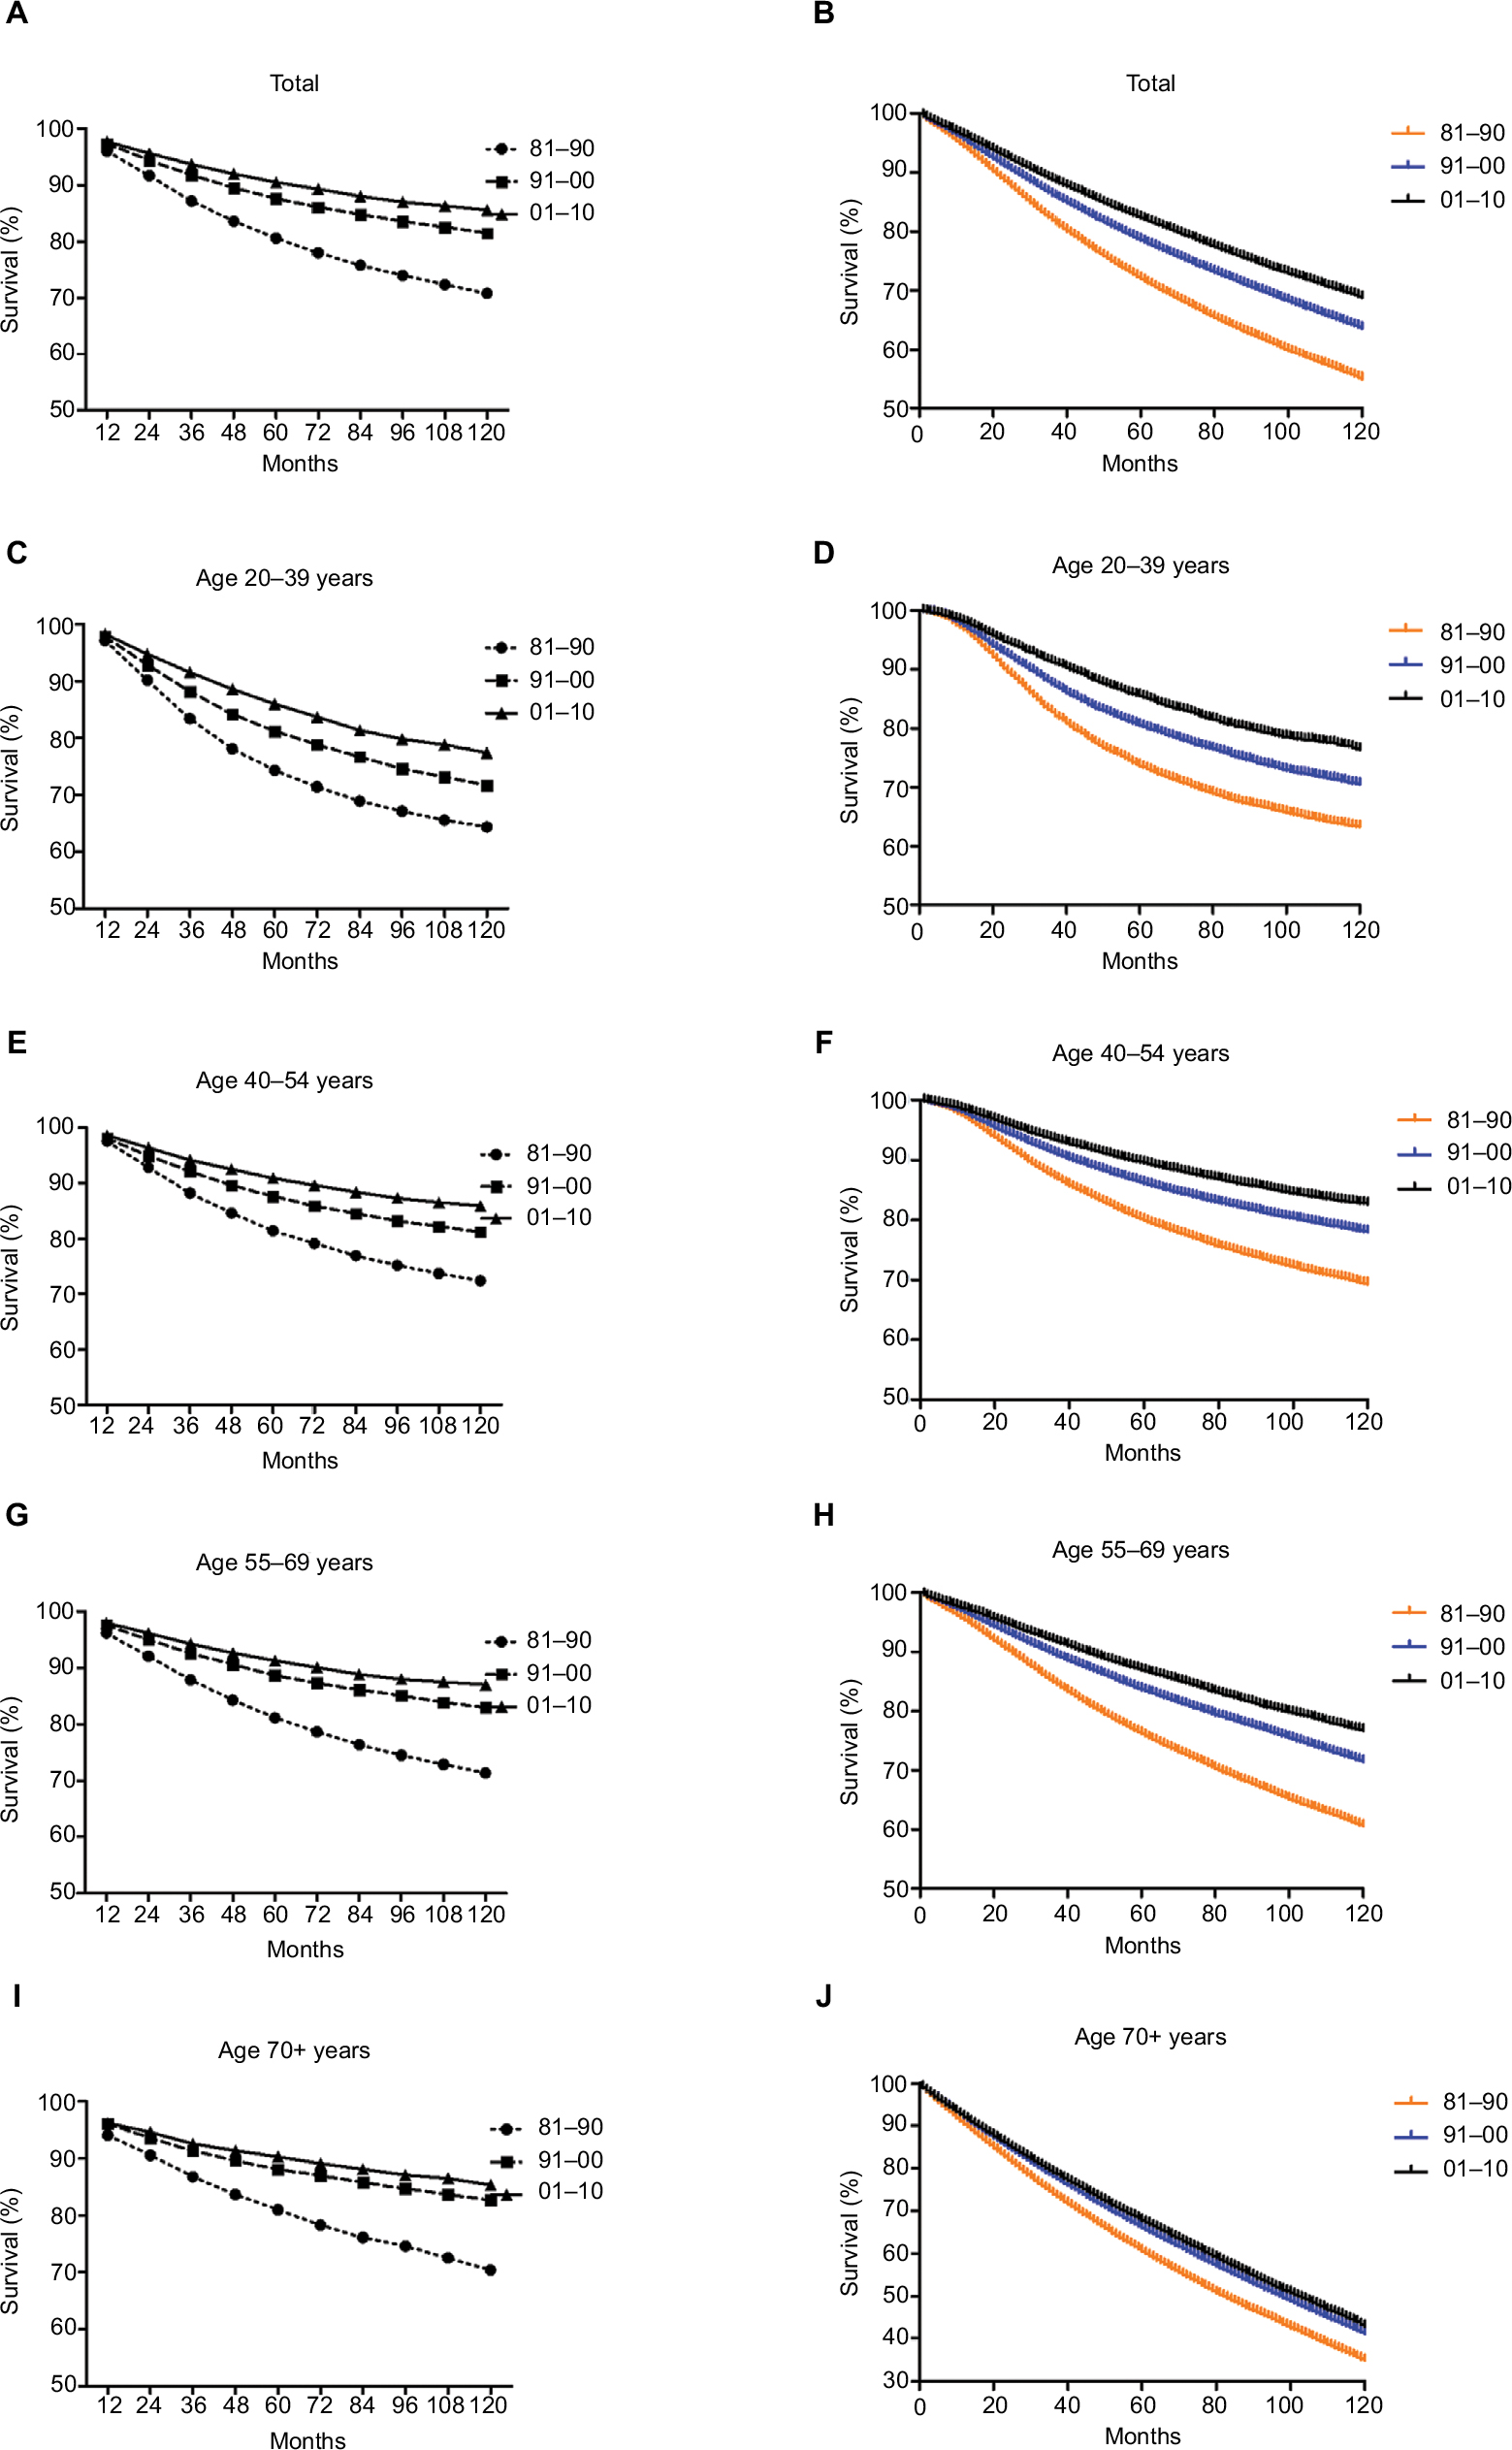 | Figure 2 Trends in 10-year relative survival rates (A, C, E, G, and I) and Kaplan–Meier survival analyses (B, D, F, H, and J) in patients with breast cancer at nine SEER sites between 1981 and 2010 according to the age group (total and ages 0–49, 50–64, 65–79, and 80+ years) and calendar period. Note: Number of patients at risk, number of events, and median survival in each decade are as follows: (B) 81–90: 115,896, 86,793, 143; 91–00: 150,334, 74,759, 187; 01–10: 165,415, 32,671, unreached; (D) 81–90: 8,958, 4,454, 305; 91–00, 9,691, 3,426, unreached; 01–10, 9,365, 1,438, unreached; (F) 81–90: 28,693, 14,575, 293; 91–00: 44,472, 12,777, unreached; 01–10: 52,340, 5,888, unreached; (H) 81–90: 41,939, 32,448, 170; 91–00: 47,987, 20,472, 220; 01–10: 57,853, 8,342, unreached; (J) 81–90: 36,298, 35,314, 82; 91–00: 48,174, 38,082, 98; 01–10: 45,835, 16,999, 102. Abbreviation: SEER, Surveillance, Epidemiology, and End Results. |
Breast cancer survival by race and SES
Both whites and blacks showed increased rates over time, with survival superiority in whites (Table 2 and Figure 3A and C). The 5-year survival rate of whites in 1981–1990 was 21.1% higher than that of blacks (81.6% vs 67.4%, P<0.0001), and this difference decreased to 17.6% in 1991–2000 (88.8% vs 75.5%, P<0.0001) and 15.6% in 2001–2010 (91.9% vs 79.5%, P<0.0001). Similarly, narrowing trends were also found for 10-year survival rates that were 25.7% higher for whites than for blacks in the first decade (71.9% vs 57.2%, P<0.0001) and then decreased to 24.5% (82.9% vs 66.6%, P<0.0001) and 22.6% (87.3% vs 71.2%, P<0.0001) in the second and third decades, respectively. The survival increase in both sexes and the narrowing survival gap were demonstrated by Kaplan–Meier analyses (Figure 3E, G, and I).
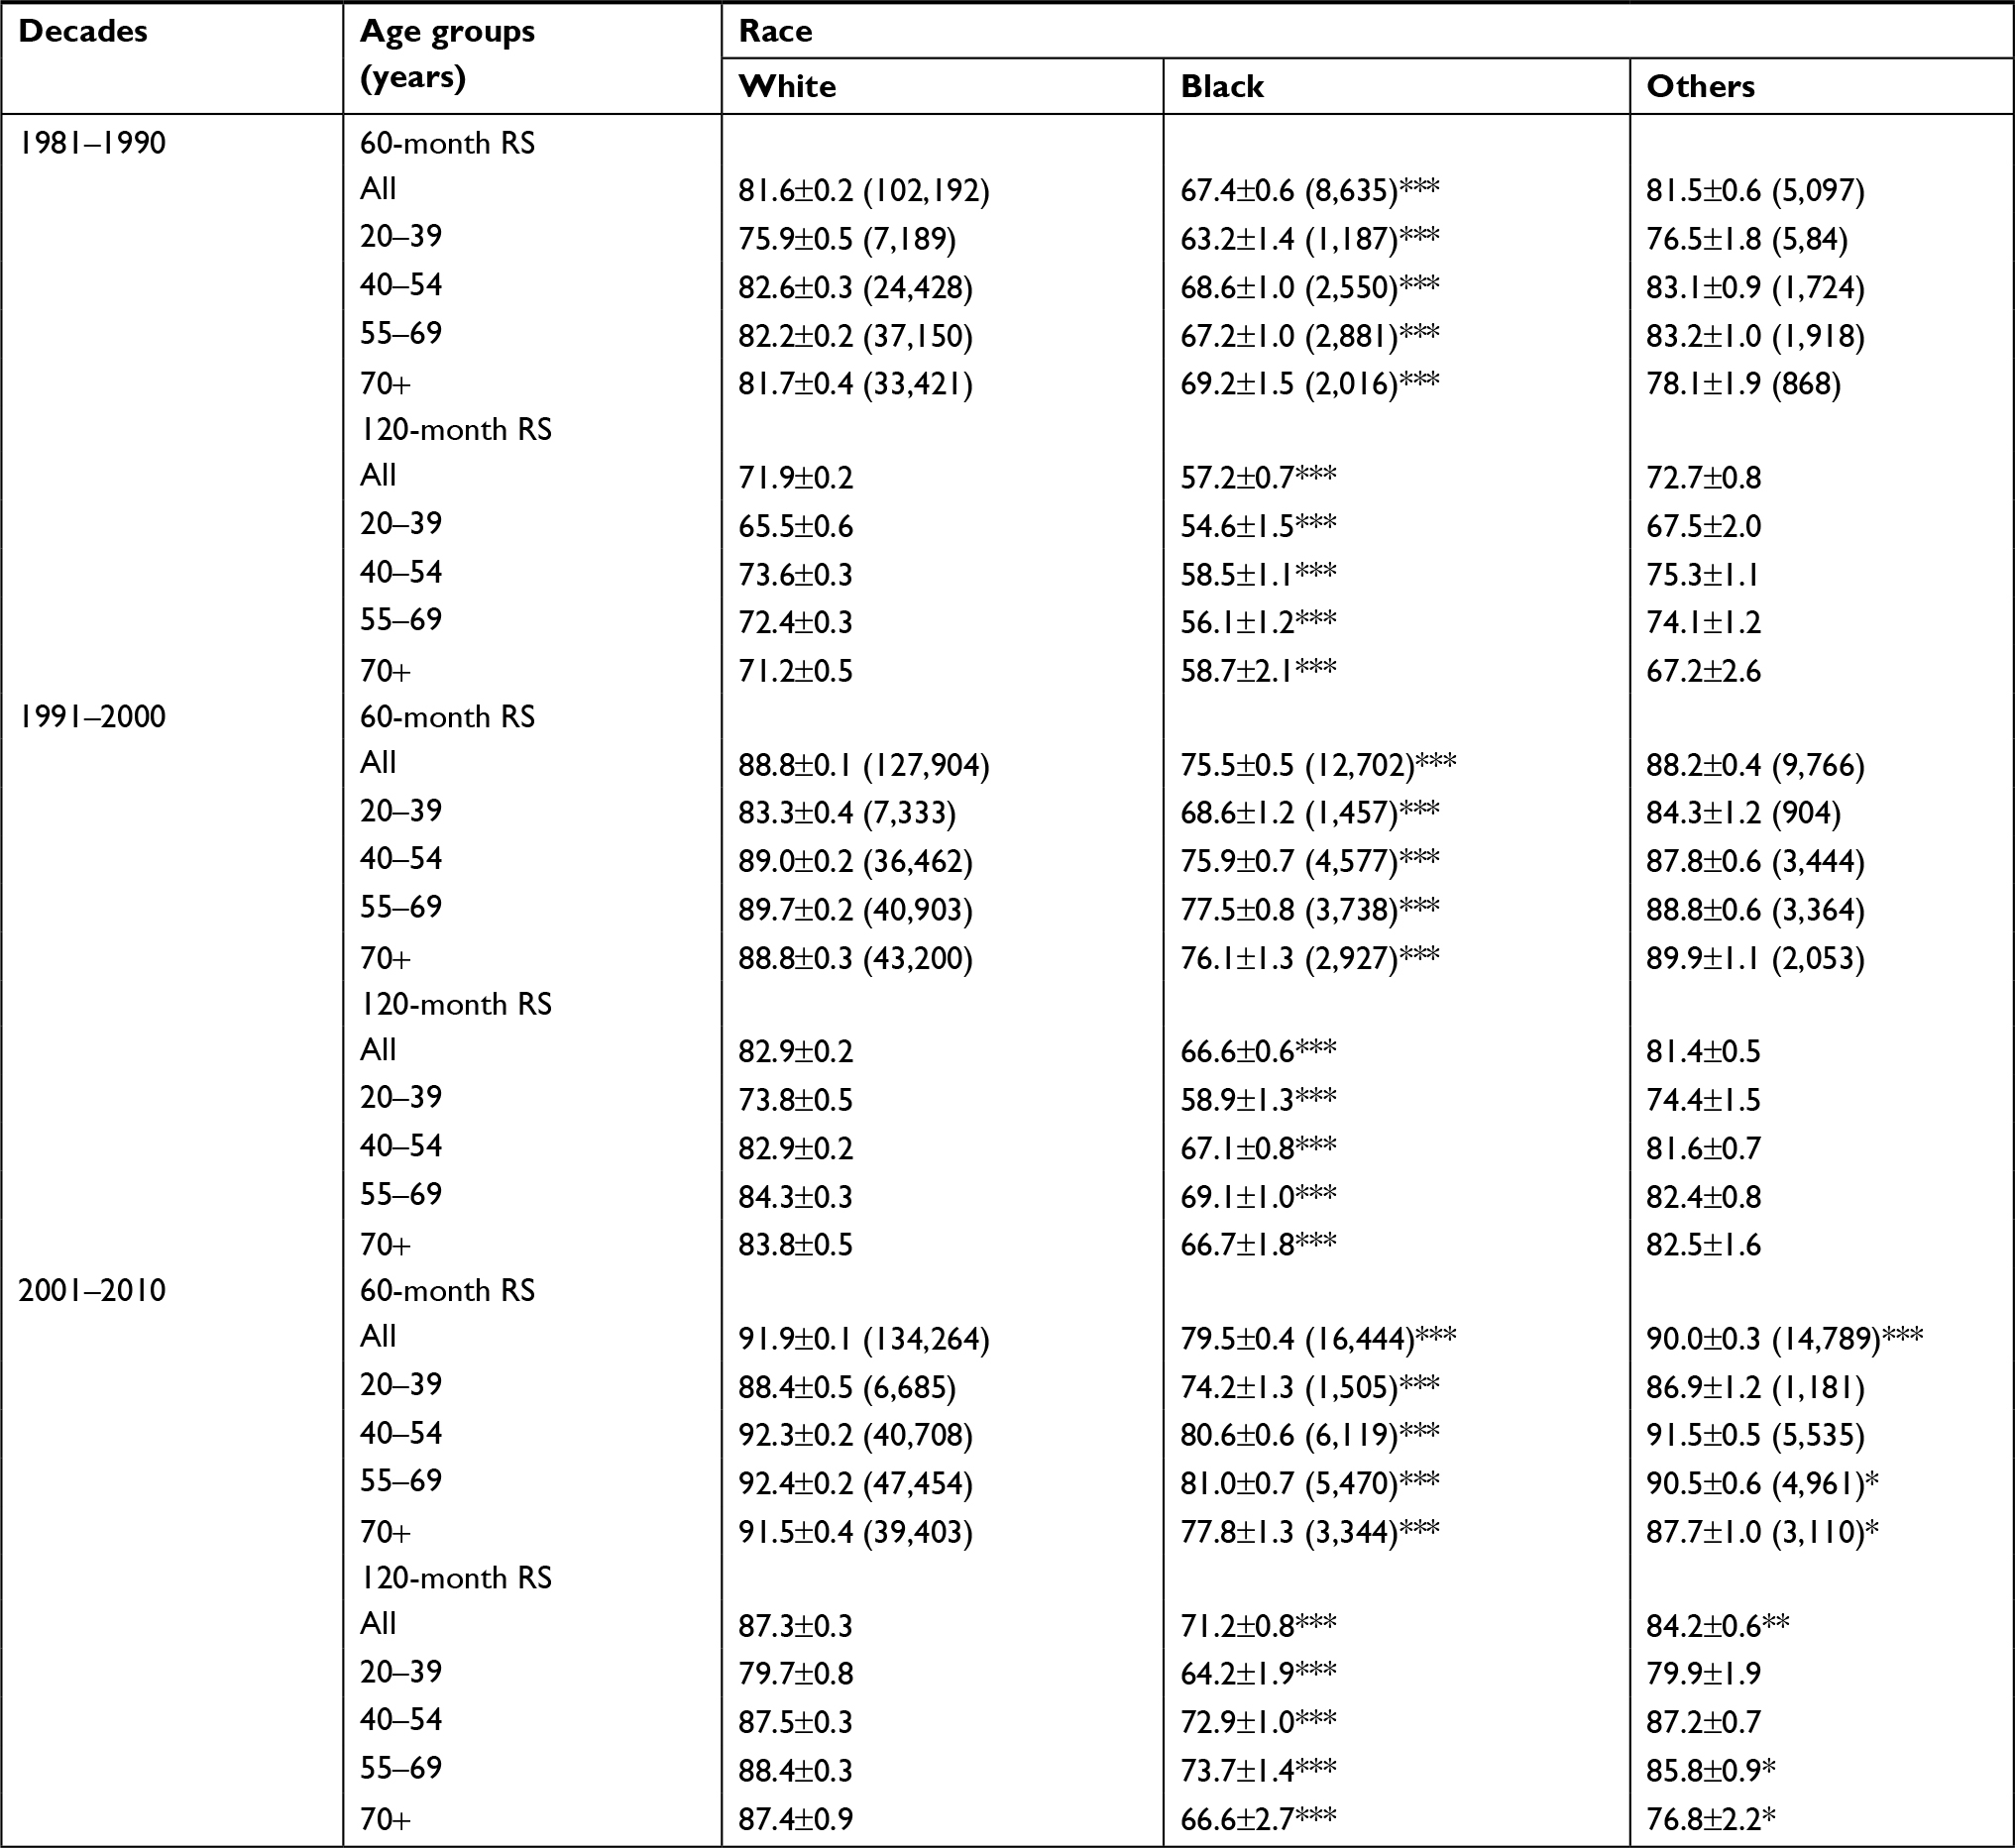 | Table 2 12-, 60-, and 120-month RS rates of breast cancer patients according to race, age group, and calendar period from 1981 to 2010 at nine SEER sites Notes: Data are represented as mean±SEM, with number of patients in parentheses. *P<0.01, **P<0.001, and ***P<0.0001 for comparisons with the white group. Abbreviations: RS, relative survival; SEM, standard error of the mean; SEER, Surveillance, Epidemiology, and End Results. |
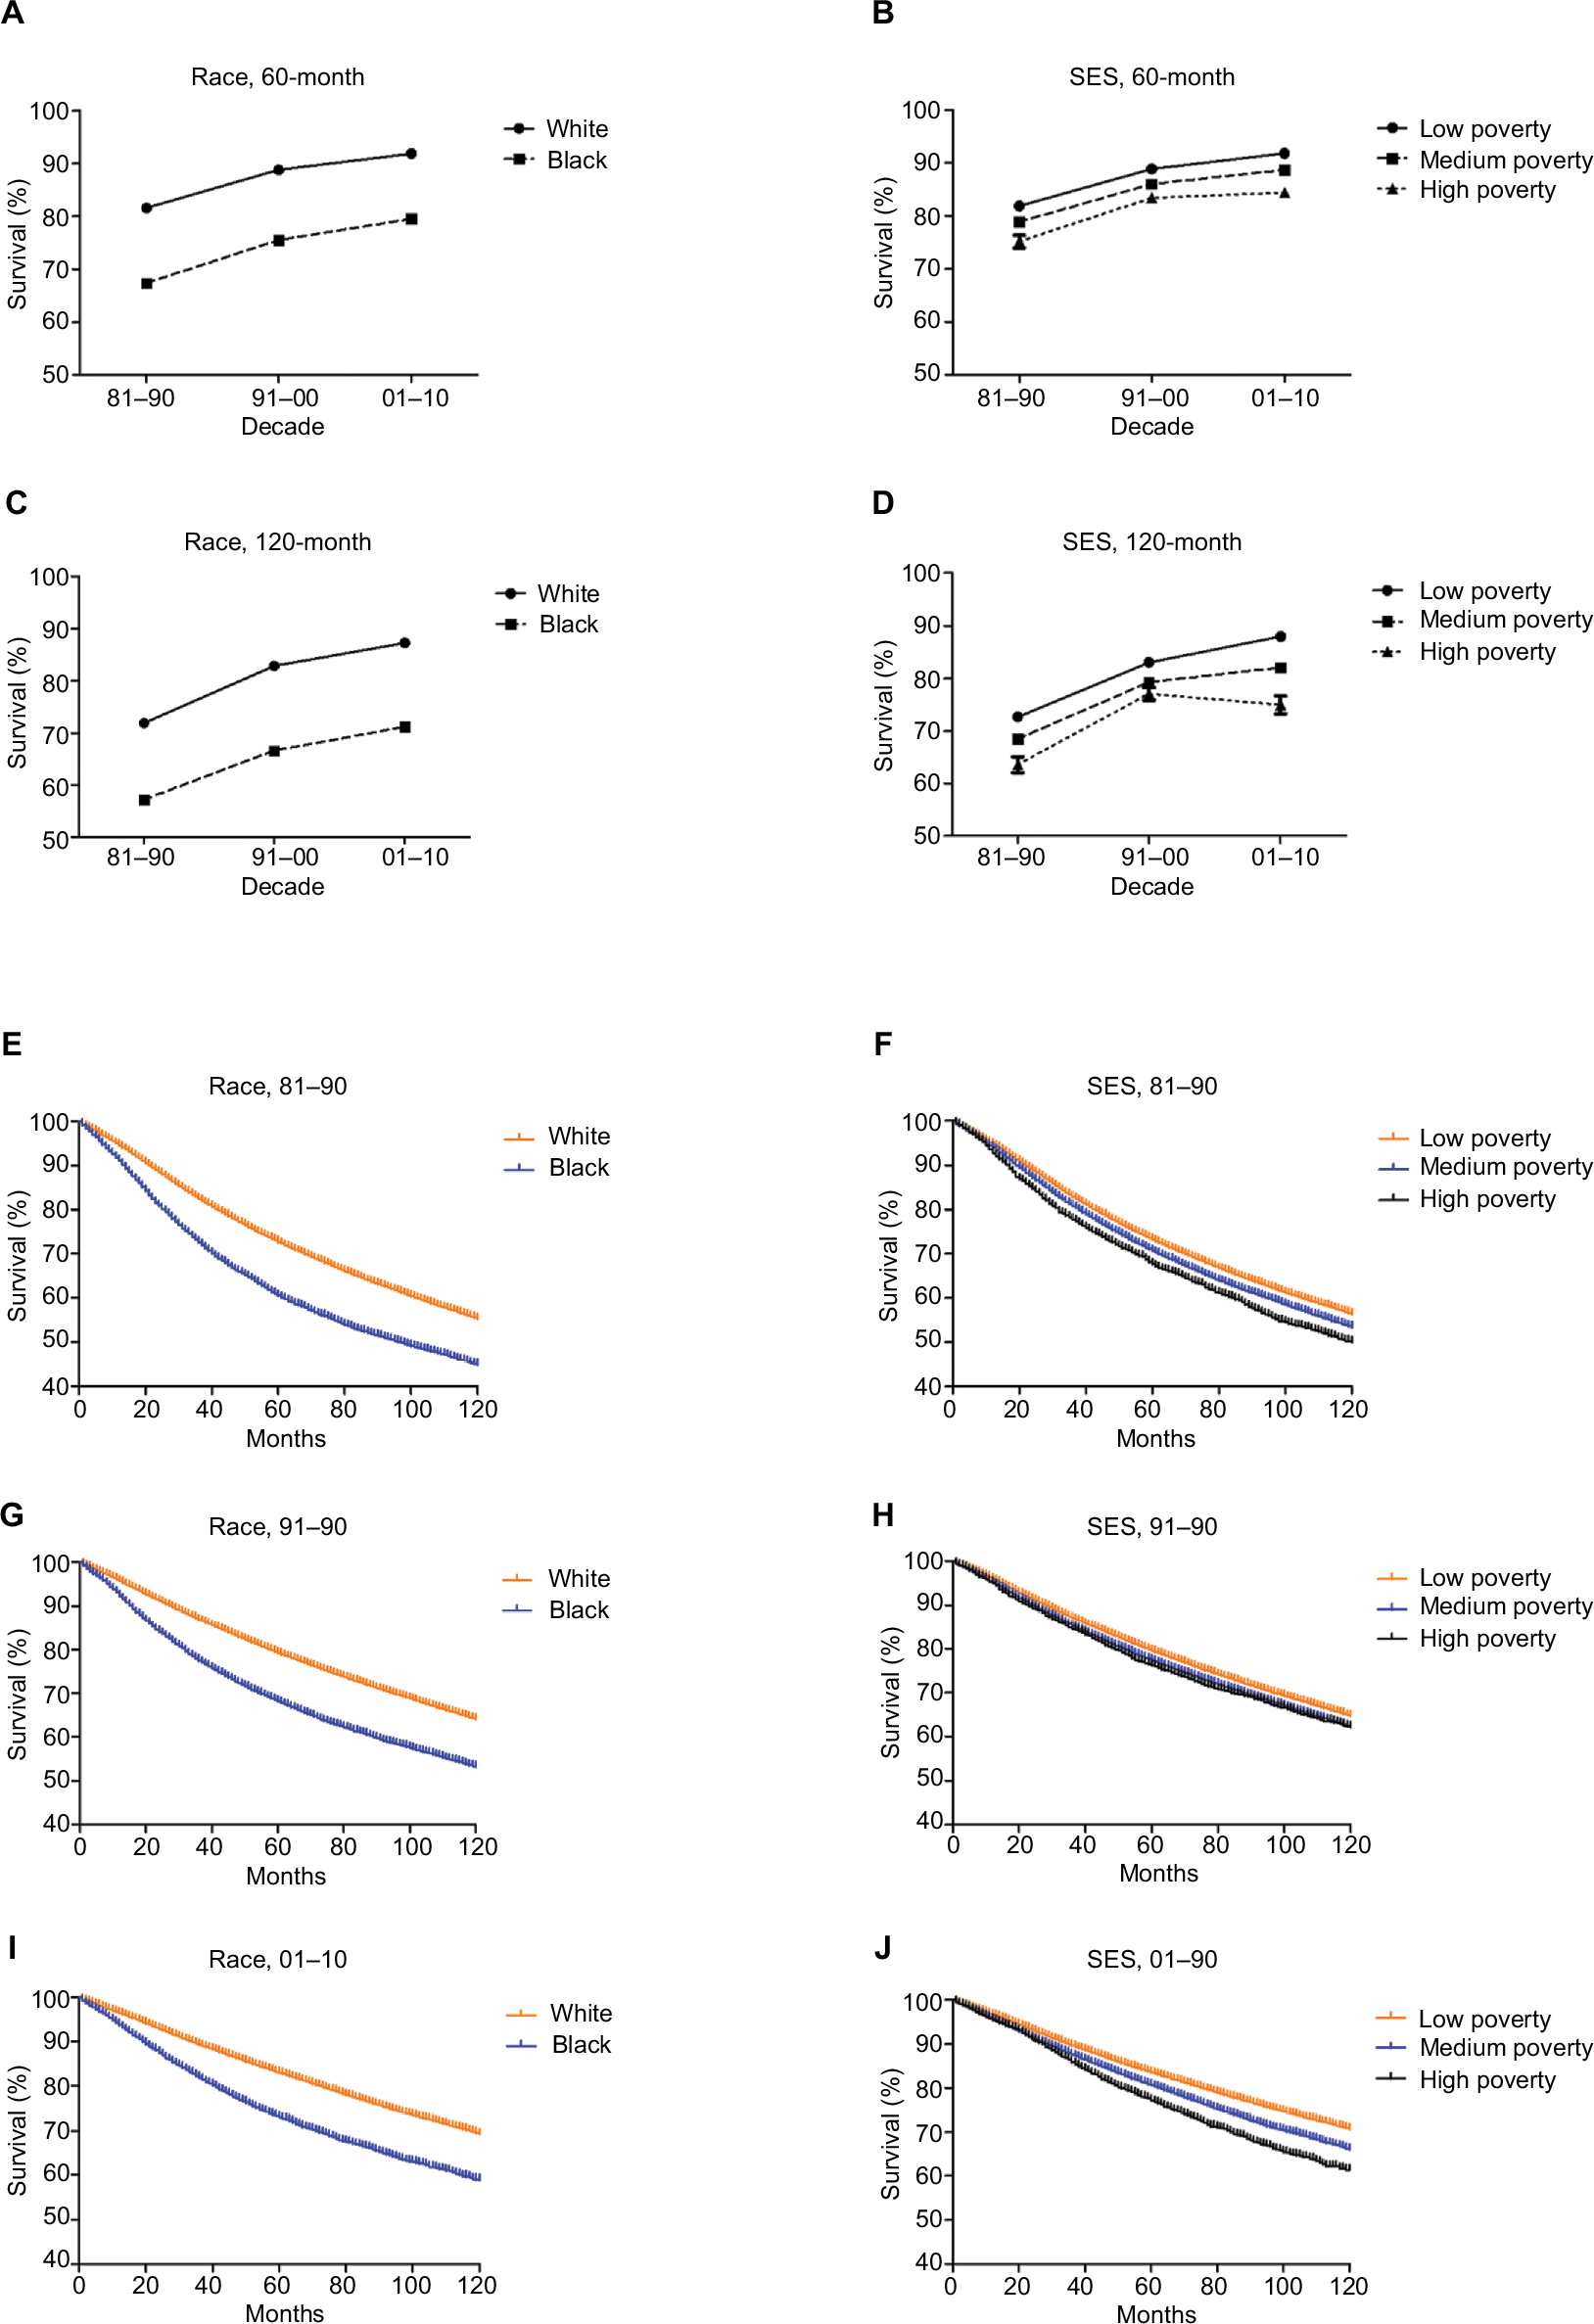 | Figure 3 Sixty-month (A and B) and 120-month (C and D) relative survival rates and Kaplan–Meier survival analyses in patients with breast cancer at nine SEER sites from 1981 to 2010 by race (white and black; E, G, and I) and SES (low, medium, and high poverty; F, H, and J) groups. Note: Number of patients at risk, number of events, and median survival in each decade are as follows: (E) white: 102,164, 76,865, 144; black: 8,635, 6,819, 97; (G) white: 127,866, 63,678, 187; black: 12,702, 7,339, 137; (I) white: 134,184, 25,991, unreached; black: 16,444, 4,536, unreached; (F) low poverty: 66,647, 49,365, 149; medium poverty: 47,474, 36,039, 135; high poverty: 1,775, 1,389, 121; (H) low poverty: 87,897, 42,666, 192; medium poverty: 59,802, 30,723, 180; high poverty: 2,635, 1,370, 173; (J) low poverty: 101,846, 18,801, unreached; medium poverty: 60,225,13,059, unreached; high poverty: 3,344, 81, unreached. Abbreviations: SEER, Surveillance, Epidemiology, and End Results; SES, socioeconomic status. |
When the patients were stratified by SES, the highest and lowest survival rates were observed in the low-poverty and high-poverty groups, respectively (Table 3 and Figure 3B and D). The survival rates of both the low- and medium-poverty groups increased over the 3 decades, as shown by the 5-year survival rates (from 81.9% to 88.9% to 91.8% and from 78.9% to 86.0% to 88.7%, respectively), whereas the increase in the first 2 decades was lower than that in the last 2 decades (3.3% vs 8.5% in the low-poverty group and 3.1% vs 9.0% in the medium-poverty group). An increase in 5-year RSR was observed in the high-poverty group (from 75.2% to 83.4%); however, the increment in the last decade was not significant (84.4%). Similar trends were also found for 10-year survival rates. Note that the 10-year survival rate in the third decade of the high-poverty group not only stopped increasing but decreased by 2.7% (from 77.1% to 75%). As a result, the greatest difference in the 10-year survival rates of the different SES groups was found in the last decade. The continuously increasing survival rates of all SES groups over time and the survival advantage in the low-poverty group were further confirmed by the Kaplan–Meier survival analyses (Figure 3F, H, and J). It is also notable that black and white patients showed different SES distributions. A larger proportion of whites was classified as low poverty than Blacks (64% vs 28%), and a larger proportion of Blacks was classified as medium-poverty individuals (72.3% vs 34.1%; Figure 4 and Table S2). The correlation coefficient between race and SES were 0.2158, 0.2209, and 0.2115 in the first, second, and third decades (P<0.001), respectively. The survival analyses by race and SES can be seen in Figure S2, with similar trend demonstrated before.
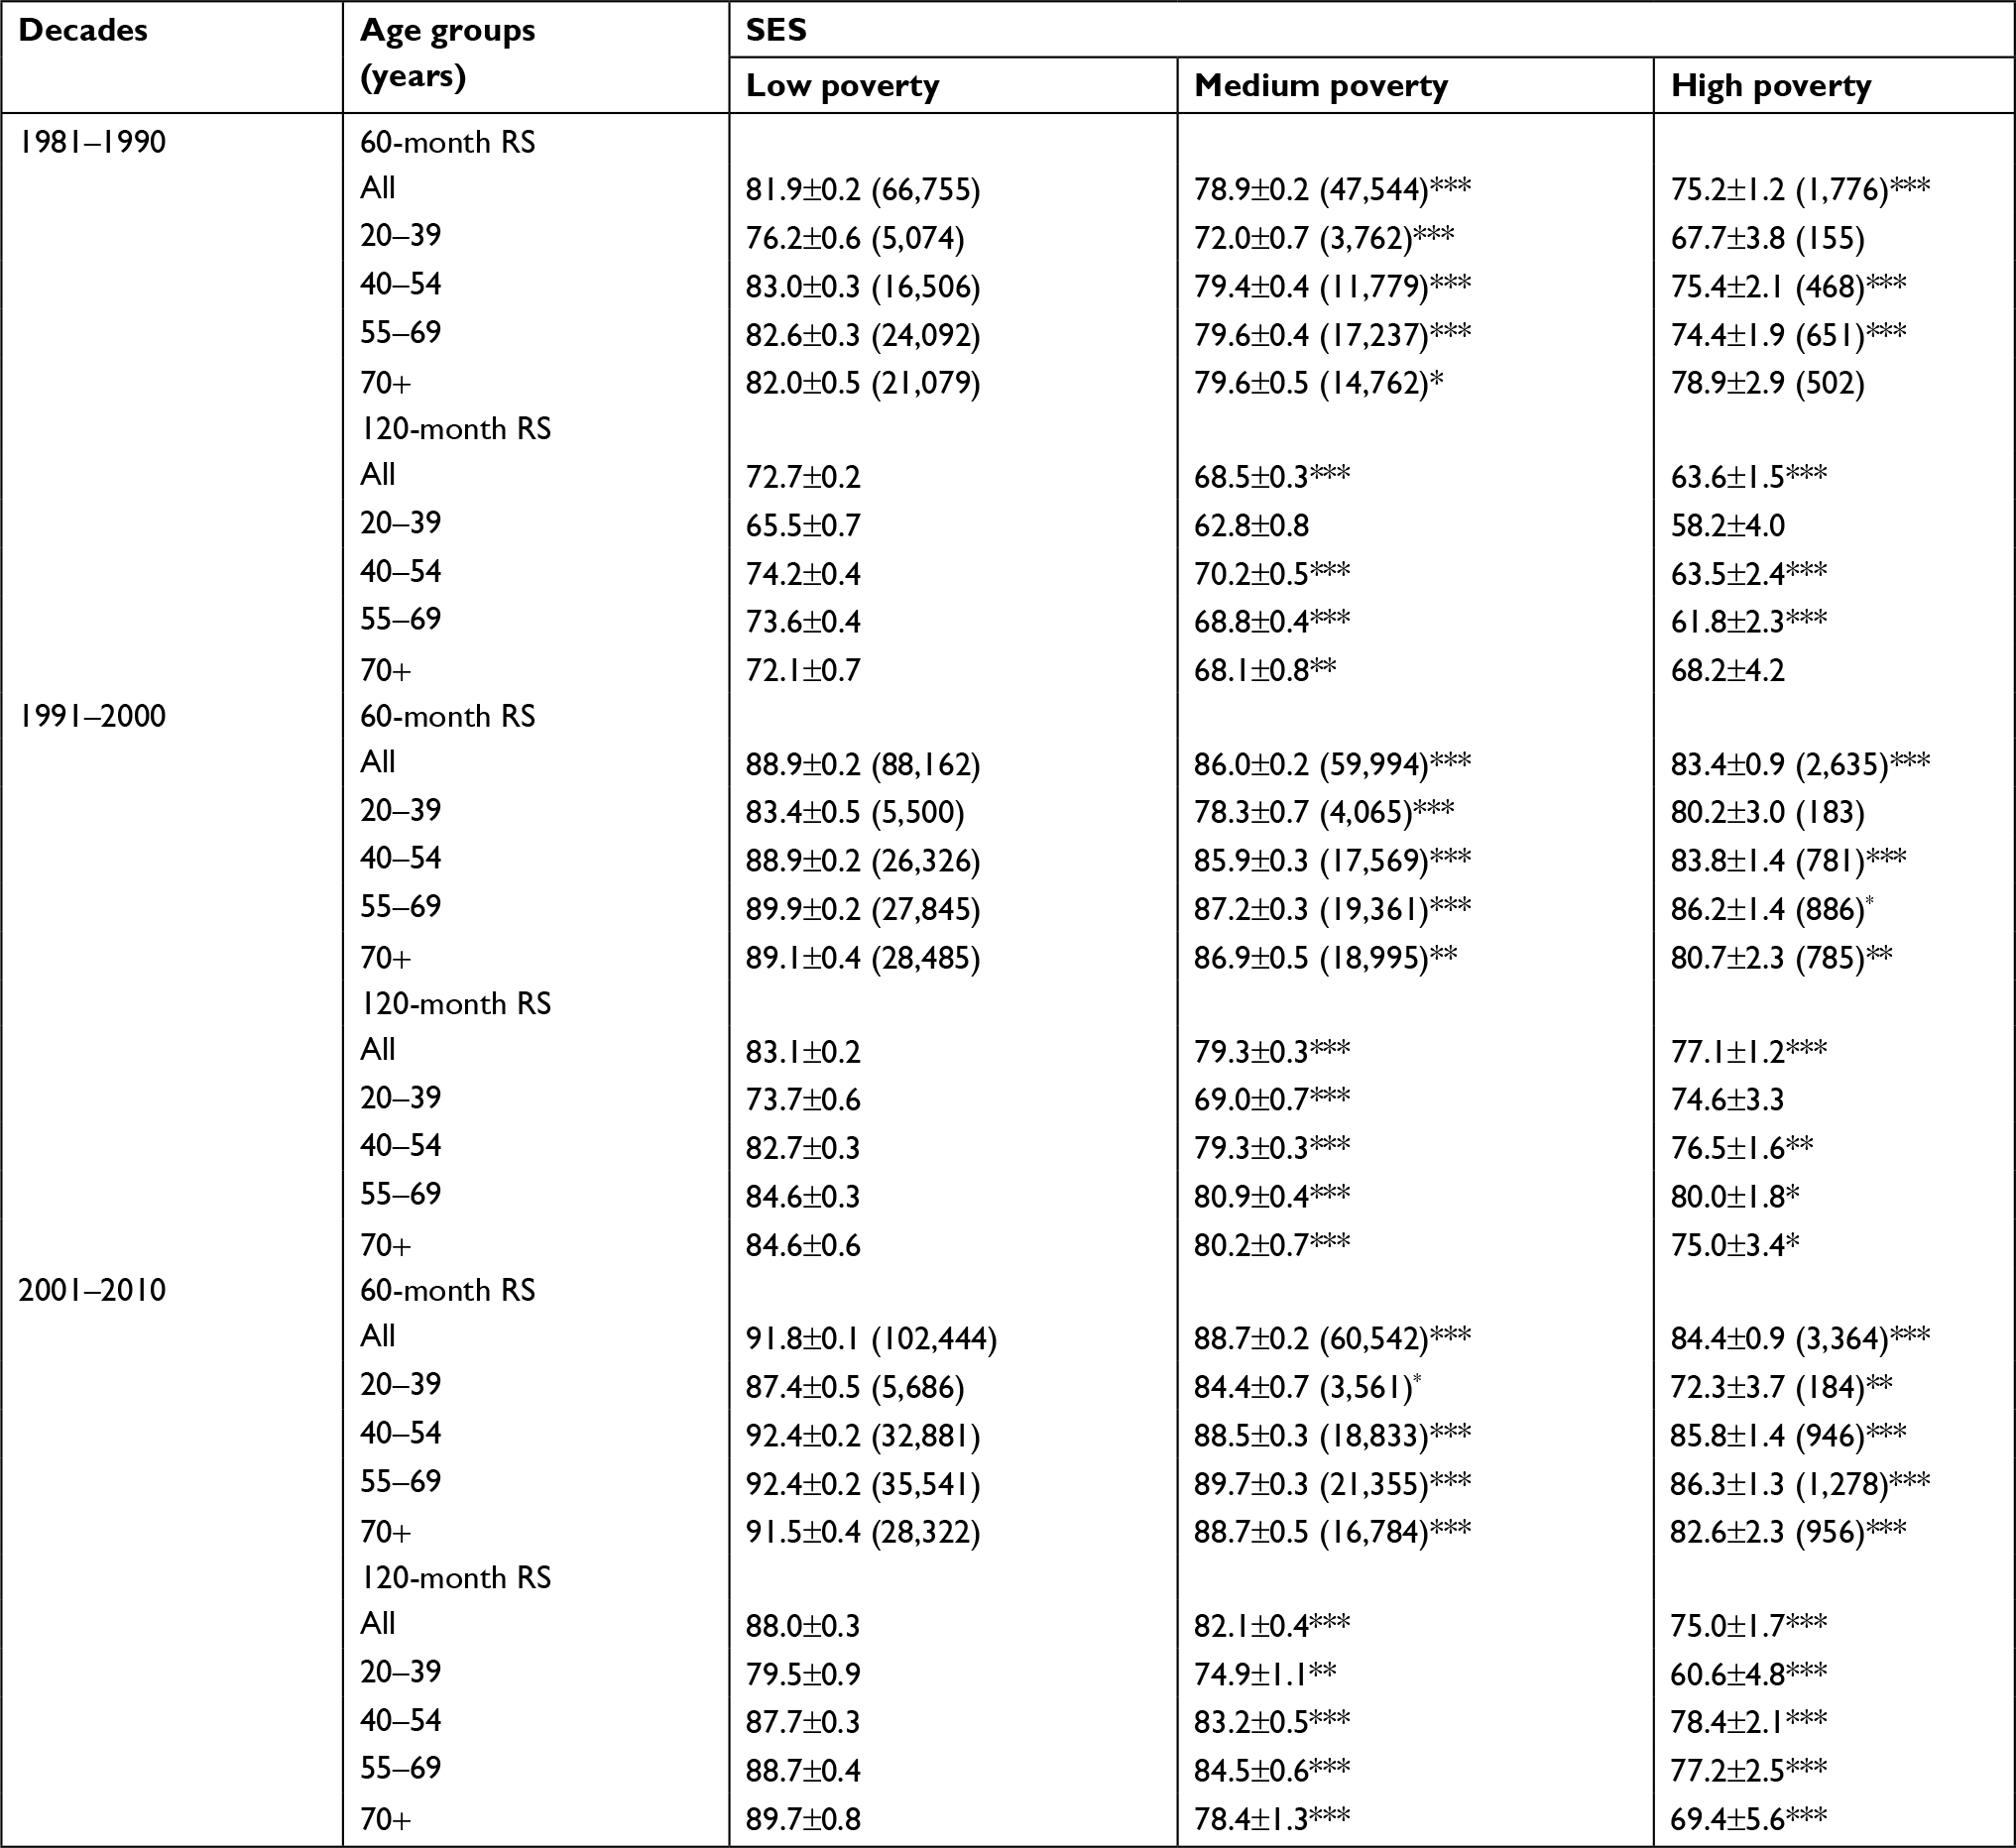 | Table 3 12-, 60-, and 120-month RS rates of breast cancer patients according to SES, age group, and calendar period from 1981 to 2010 at nine SEER sites Notes: Data are represented as mean±SEM, with number of patients in parentheses. *P<0.01, **P<0.001, and ***P<0.0001 for comparisons with the low-poverty group. Abbreviations: RS, relative survival; SEM, standard error of the mean; SEER, Surveillance, Epidemiology, and End Results; SES, socioeconomic status. |
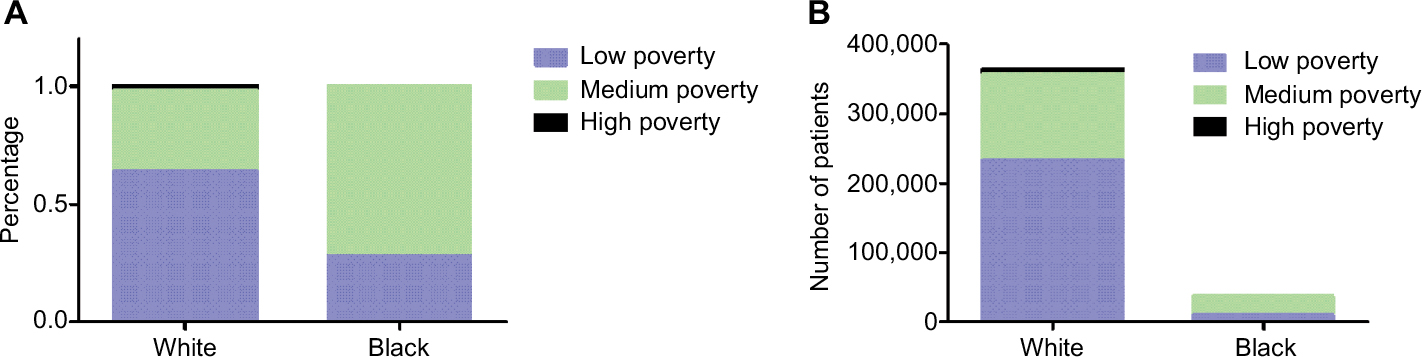 | Figure 4 Distribution of SES by race for patients with breast cancer at nine SEER sites from 1981 to 2010. Note: Percentage (A) and number (B) of patients with breast cancer in low-poverty, medium-poverty, and high-poverty groups. Abbreviations: SEER, Surveillance, Epidemiology, and End Results; SES, socioeconomic status. |
Tumor stage at the time of diagnosis
Improved survival may be associated with an early-stage breast cancer at the time of diagnosis. Our analysis showed that an early-stage tumor was detected in older, white, and high SES groups (Table 4). It is notable that the proportion of early-stage tumors at diagnosis in all groups increased over time although the percentage of early-stage tumors in some groups in the third decade was relatively stable compared to that in the second decade. For example, the percentages of early-stage tumors in patients younger than 54 years and 55 years or older were 38.2% and 46.6% in 1981–1990, respectively; these numbers significantly increased to 42.4% and 52.6% in 1991–2000, respectively, but remained stable in 2001–2010 (42.0% and 52.7%, respectively). For the race groups, the percentage of early-stage tumors for whites increased from 45.0% in 1981–1990 to 50.1% in 1991–2000 but remained at 50.2% in 2001–2010, while the percentage for blacks continuously increased from 30.2% to 34.5% to 36.4% over the past 3 decades. When the sample was divided by SES, high-poverty patients showed increases in early-stage tumors over time (from 37.6% to 43.6% to 45.1%); the percentage of early-stage tumors in low-poverty patients increased from 44.7% to 50% in the second decade and then remained exactly the same in the third decade. Similarly, medium-poverty patients showed a relatively stable proportion of early-stage tumors in the third decade (46.4% vs 47.3%) after an increase in the second decade (47.3% vs 42.6%).
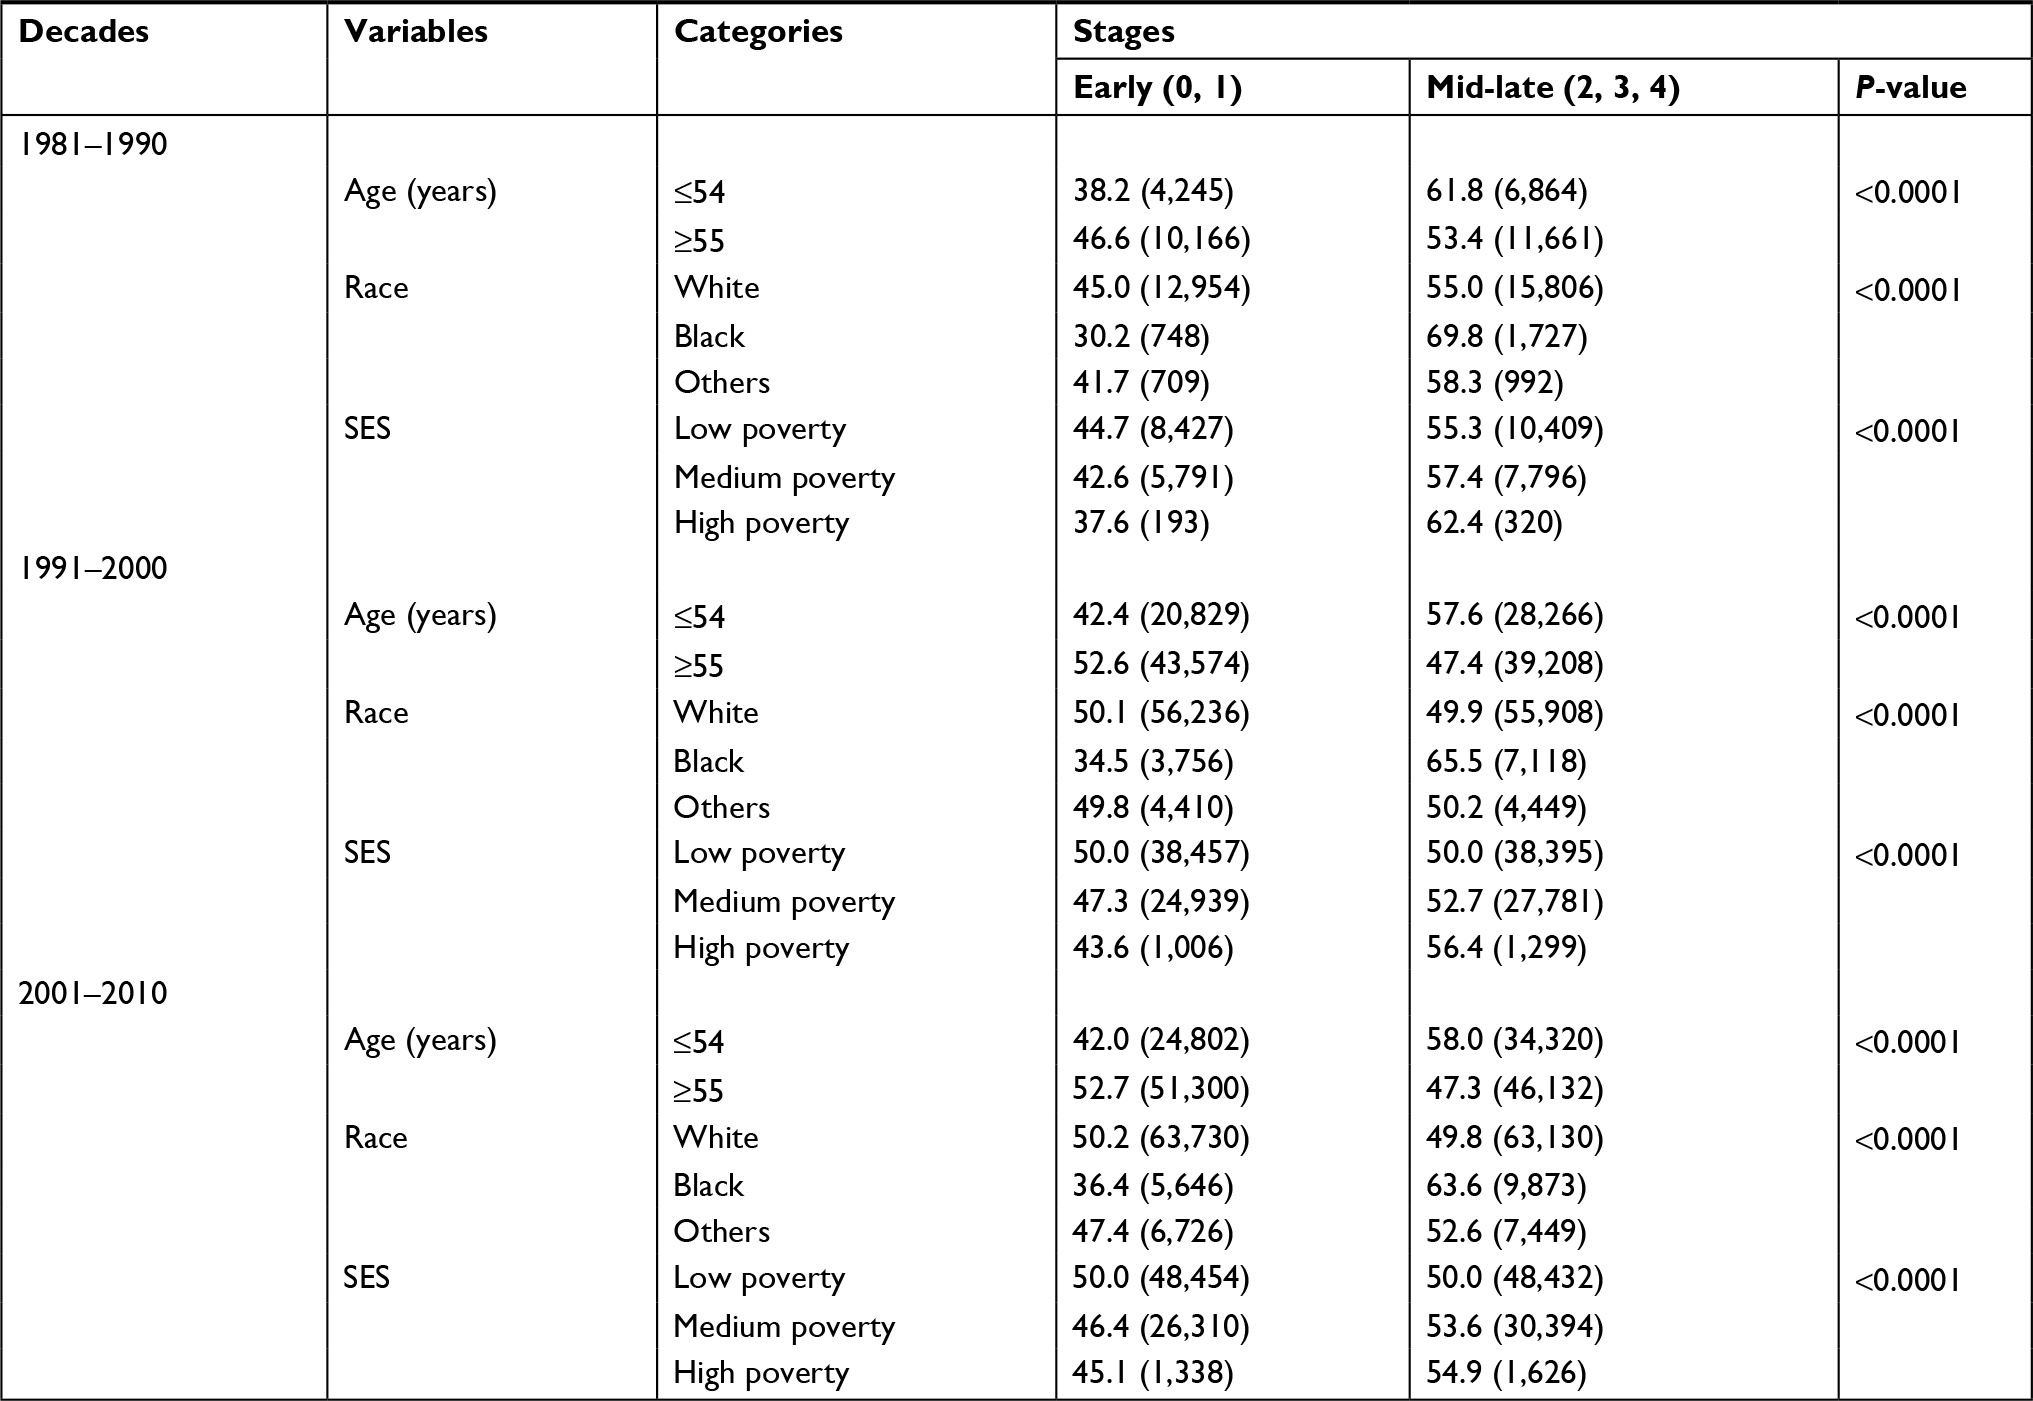 | Table 4 Summary data of percentages of early- or mid-late-stage of breast cancer patients according to age, race, SES, and calendar period from 1981 to 2010 at nine SEER sites Note: Data are represented as percentage, with number of patients in parentheses. Abbreviations: SEER, Surveillance, Epidemiology, and End Results; SES, socioeconomic status. |
Cox regression analysis of breast cancer patient survival
For Cox regression analysis, the current study mainly focused on four variables: age, race, stage, and SES. As shown in Table 5, these four variables were all independent risk factors for survival (P<0.001). The HR of age remained similar between univariate and multivariate analyses in all 3 decades (1.049 vs 1.0511 in 1981–1990, 1.049–1.0526 in 1990–2000, and 1.046–1.0512 in 2001–2010), indicating that the effect of age on the survival of breast cancer patients remained stable over time. In terms of race, the HR for black and others in multivariate Cox analyses are calculated, with increasing HRs for black patients (black: 1.3991 in 1981–1990, 1.5209 in 1990–2000, and 1.7173 in 2001–2010; others: 0.8076 in 1981–1990, 0.8397 in 1990–2000, and 0.9105 in 2001–2010, with whites as reference group). The HRs of SES in multivariate analysis are listed (medium poverty: 1.0719 in 1981–1990, 1.0435 in 1991–2000, and vs 1.086 in 2001–2010; high poverty: 1.1169 in 1981–1990, 1.1435 in 1991–2000, and 1.3632 in 2001–2010, with low poverty as a reference group). In terms of stage, the HR for medium- and late-stage patients in multivariate Cox analyses are calculated, with 3.053 in 1981–1990, 3.6849 in 1990–2000, and 5.489 in 2001–2010, with early-stage patients as a reference group).
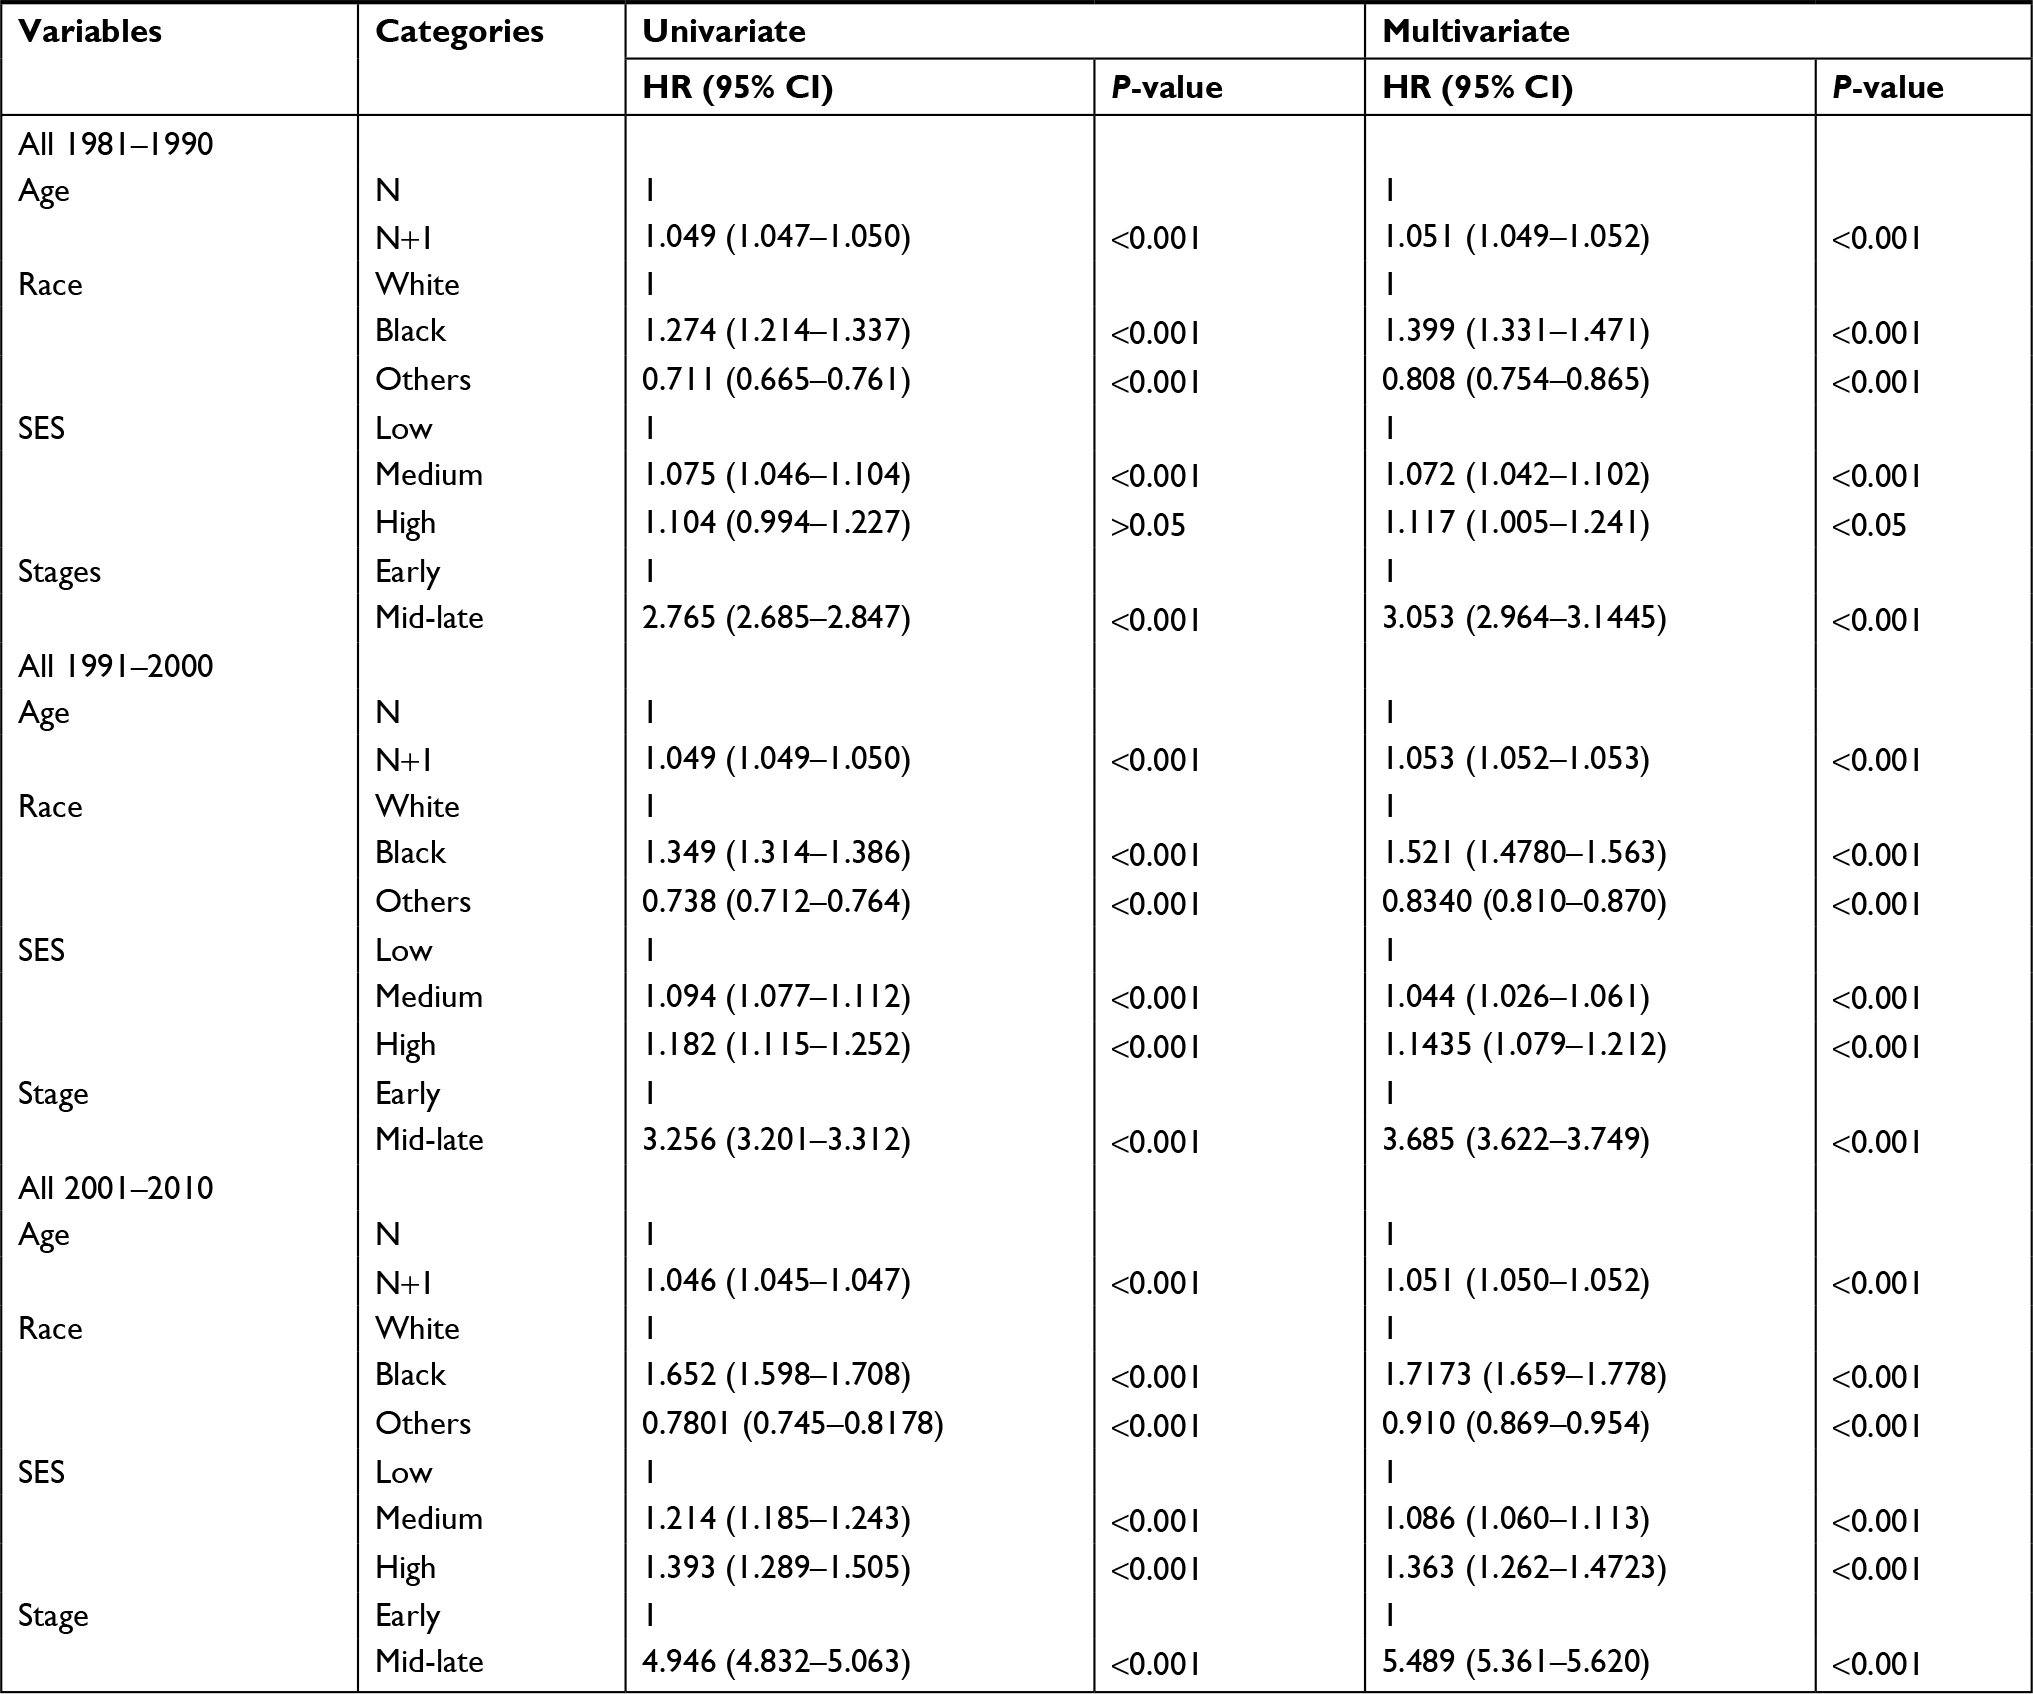 | Table 5 Summary data for Cox regression analysis of survival of patients with breast cancer from 1981 to 2010 at nine SEER sites Abbreviations: SEER, Surveillance, Epidemiology, and End Results; SES, socioeconomic status; N, any age group. |
Discussion
The incidence trend for breast cancer went through a fluctuating change, with an increase in the second decade and a decrease in the third decade. The OS rates of breast cancer patients continuously improved over the past 3 decades, from 1981 through 2010; this improvement was more remarkable in the second decade and then slowed in the third decade. Our data showed that SES, age, and race were independent predictors for survival and, for the first time, indicated increasing HRs in patients of different races and SES groups over time.
The incidence trend of breast cancer in the United States during the 1981–2010 period went through an increasing and then a decreasing trend. It is noted that mammography screening was widely adopted in the United States beginning in the early 1990s after its initiation in the early 1980s.15,16 The significant increase in the percentage of early-stage cancer at the time of diagnosis in 1991–2000 further reflected the widespread use of screening. In fact, many studies have clearly shown the relationship between the application of mammography screening and the increasing incidence of breast cancer.17–21 In addition, the increasing rates of obesity and hormone replacement therapy for menopause patients contributed to the increase in breast cancer incidence.21 Therefore, these factors contributed to the substantial incidence increase in 1990–2000. The percentage of women who accepted mammography screening reached its peak in 1999 and then remained stable during the 2000–2013 period.21,22 The use of hormones was reduced in the 1990s.23,24 Together these facts can partially explain the incidence changes in 2000–2010.
Our data showed a higher incidence among whites than among blacks and an apparent survival advantage of whites over blacks; however, the incidence gap between the two races was remarkably reduced in the third decade because of a more significant decrease in incidence among whites than among blacks. The survival gap did not show such a significant reduction tendency although the survival of both races continued to improve over time. It is known that whites and blacks exhibit differences in genetics, lifestyle, and reproduction patterns.25–31 As we discussed above, the reduction in hormone use after 2002 largely accounted for the sharp incidence decrease during the 2001–2010 period.24 This reduction in hormone use was better for whites than for blacks.31 Recently, the genetic evidence explaining incidence and survival disparity were explored, implying a biological difference between whites and blacks.33–36 Our data demonstrated that black breast cancer patients displayed more advanced tumors at the time of diagnosis. Furthermore, race-specific survival disparity can be partially attributed to the different SES distribution between them, specifically a bigger proportion of whites belong to low-poverty group. This race-specific SES distribution disparity may affect their access to health care resources and medication. Correlation analysis also confirmed the significant relationship between SES and race. In addition, other factors in addition to SES may also contribute to the late diagnosis in blacks, such as residential segregation, spatial access to mammography, residential pollution, and breast cancer awareness.6,37,38 Therefore, more in-depth studies, as well as better health care policies, are still required to reveal the underlying truth to narrow the gap between whites and blacks.
SES has previously been proposed to explain the differential incidence and survival of breast cancer patients between races. Lower SES has often been considered to be associated with a lower educational level, less access to medical facilities as a result of worse medical insurance coverage, less possibility to be diagnosed at an early stage and to be treated in a timely and efficient manner, and worse survival.2,39 In our analysis, the incidence of breast cancer in the better SES group was higher than that in the low-SES group; incidence differences across SES groups was appreciably narrowed in the third decade because of a marked incidence reduction in both low- and medium-poverty groups and stable incidence in the high-poverty group. Improvements in survival were found in all SES groups during the second decade but slowed down in the third decade. A previous study found that black women with breast cancer in the military system lived longer than those in general black population in the SEER system and that the difference in survival between races diminished but was not eliminated, suggesting that less accessibility to medical facilities resulting from worse SES only partially contributed to worse survival.40 Our data showed that a more advanced tumor was discovered at diagnosis in the low-SES group than in better SES groups.
Increases in OS can be attributed to early detection and/or improved treatments.41–43 Our data demonstrated that younger, black, and higher poverty breast cancer patients always showed more aggressive tumors at diagnosis during the past 3 decades. More notably, nearly all groups had increased percentages of early-stage tumors at diagnosis over time, but this increase remained relatively stable in the third decade. The increasing proportion of early-stage patients may partially contribute to the survival increase over time. Here, we demonstrate both the development of early detection and clinical management.
Although previous studies addressed the incidence and survival trends of breast cancer, these studies mainly focused on a specific group of patients. Our data were based on a large representative sample from the SEER registries during the 1980–2010 period when breast cancer was subjected to a variety of new strategies for detection, diagnosis, prevention, and therapy that were initiated and widespread in this period. We not only analyzed the incidence and survival of breast cancer but also investigated the impact of age, race, and SES to provide a clear recent trend of breast cancer. More importantly, the long-term trend of breast cancer in our study was analyzed and presented by decade; thus, the overall trend in each period is clearer than that analyzed by year. Moreover, we demonstrated that race was more relevant to the survival of patients with breast cancer than other independent risk factors such as age and SES.
It is worthwhile to note that the present analysis has some limitations. First, although the nine SEER sites cover approximately 10% of the general population in the United States and therefore reflect the trend in the total population, there would be some minor aberrance when applying the data to certain geographic locations that are not included in the SEER registry. Next, when the tumor stage at the time of diagnosis was analyzed, we used the adjusted AJCC, sixth edition, cancer stage definition for breast cancer that was available in the SEER data from the year 1988; thus, there may be some divergence in the stage data before 1988. Finally, some sources of error and bias such as under registration or misclassification and geological variation in SES might have affected the study.8,9 In addition, previous studies demonstrated that estrogen receptor (ER), progesterone receptor (PR), and HER2 molecules are important biomarkers for breast cancer classification and provide vital information for endocrine therapy and targeted therapy.44,45 However, in this longitudinal study, HER expression data are not available in the SEER database, and the ER and PR information are only provided since 1990. Therefore, the current study fails to address the epidemiological trend by these molecules.
Conclusion
The current study demonstrated the fluctuating characteristics of incidence and the continuously modest survival improvement of breast cancer patients during the period of 3 decades. In addition, our data show the changing impact of race and SES on patients’ survival. Elucidation of the incidence and survival of breast cancer patients over time will help predict coming trends and improve the quality of clinical trials, health care policies, and rules by balancing disparities. Looking ahead, studies that clarify the mechanisms and pathogenesis of breast cancer should pave the way for the design of novel agents that, together with better health care system, will yield improved survival.
Acknowledgment
This research was supported by the National Natural Science Foundation of China (81260071) and the Foundation of Education Bureau in Guangxi Province (KY2015YB232, KY2016YB342).
Author contributions
Research design: JW, HM, GL and HS. Data collection and drafting: GL, JL and SW. Statistical analysis: GL, HS and HM. Manuscript polishing: JL, SW and HM. Building figures: GL, HM, JP and ZW. Manuscript editing: HM, YM and JW. Manuscript revision: GL and HM. All authors contributed toward data analysis, drafting and critically revising the paper, gave final approval of the version to be published, and agree to be accountable for all aspects of the work.
Disclosure
The authors report no conflicts of interest in this work.
References
Siegel RL, Miller KD, Jemal A. Cancer Statistics, 2017. CA Cancer J Clin. 2017;67(1):7–30. | ||
Dreyer MS, Nattinger AB, McGinley EL, Pezzin LE. Socioeconomic status and breast cancer treatment. Breast Cancer Res Treat. 2018;167(1):1–8. | ||
Liu J, Su M, Hong S, et al. Nomogram predicts survival benefit from preoperative radiotherapy for non-metastatic breast cancer: A SEER-based study. Oncotarget. 2017;8(30):49861–49868. | ||
Hinyard L, Wirth LS, Clancy JM, Schwartz T. The effect of marital status on breast cancer-related outcomes in women under 65: A SEER database analysis. Breast. 2017;32:13–17. | ||
Carroll R, Lawson AB, Jackson CL, Zhao S. Assessment of spatial variation in breast cancer-specific mortality using Louisiana SEER data. Soc Sci Med. 2017;193:1–7. | ||
Yu JB, Gross CP, Wilson LD, Smith BD. NCI SEER public-use data: applications and limitations in oncology research. Oncology (Williston Park). 2009;23(3):288–295. | ||
World Health Organization. International Classification of Diseases for Oncology. 3rd ed. Geneva, Switzerland: World Health Organization; 2000. | ||
Krieger N, Chen JT, Waterman PD, et al. Geocoding and monitoring of US socioeconomic inequalities in mortality and cancer incidence: does the choice of area-based measure and geographic level matter?: the Public Health Disparities Geocoding Project. Am J Epidemiol. 2002;156(5):471–482. | ||
Krieger N, Chen JT, Waterman PD, Rehkopf DH, Subramanian SV. Race/ethnicity, gender, and monitoring socioeconomic gradients in health: a comparison of area-based socioeconomic measures--the public health disparities geocoding project. Am J Public Health. 2003;93(10):1655–1671. | ||
Singh GK, Miller BA, Hankey BF, Edwards BK. Area Socioeconomic Variations in US Cancer Incidence, Mortality, Stage, Treatment, and Survival, 1975–1999. National Cancer Institute, Bethesda. Report No.: 03-5417. 2003. | ||
Dickman PW, Adami HO. Interpreting trends in cancer patient survival. J Intern Med. 2006;260(2):103–117. | ||
Wang S, Tang J, Sun T, et al. Survival changes in patients with small cell lung cancer and disparities between different sexes, socioeconomic statuses and ages. Sci Rep. 2017;7(1):1339. | ||
Hakulinen T, Seppä K, Lambert PC. Choosing the relative survival method for cancer survival estimation. Eur J Cancer. 2011;47(14):2202–2210. | ||
SEER*Stat software [homepage on the Internet]. Surveillance Research Program, National Cancer Institute SEER*Stat software. Available from: www.seer.cancer.gov/seerstat. Accessed September 8, 2018. | ||
Smetherman DH. Screening, imaging, and image-guided biopsy techniques for breast cancer. Surg Clin North Am. 2013;93(2):309–327. | ||
McGuire A, Brown JA, Malone C, McLaughlin R, Kerin MJ. Effects of age on the detection and management of breast cancer. Cancers (Basel). 2015;7(2):908–929. | ||
Welch HG, Prorok PC, O’Malley AJ, Kramer BS. Breast-Cancer Tumor Size, Overdiagnosis, and Mammography Screening Effectiveness. N Engl J Med. 2016;375(15):1438–1447. | ||
van Steenbergen LN, Voogd AC, Roukema JA, et al. Screening caused rising incidence rates of ductal carcinoma in situ of the breast. Breast Cancer Res Treat. 2009;115(1):181–183. | ||
Martinez-Alonso M, Vilaprinyo E, Marcos-Gragera R, Rue M. Breast cancer incidence and overdiagnosis in Catalonia (Spain). Breast Cancer Res. 2010;12(4):R58. | ||
Kalager M, Adami HO, Bretthauer M, Tamimi RM. Overdiagnosis of invasive breast cancer due to mammography screening: results from the Norwegian screening program. Ann Intern Med. 2012;156(7):491–499. | ||
Dittus K, Geller B, Weaver DL, et al; Breast Cancer Surveillance Consortium. Impact of mammography screening interval on breast cancer diagnosis by menopausal status and BMI. J Gen Intern Med. 2013;28(11):1454–1462. | ||
White A, Thompson TD, White MC, et al. Cancer Screening Test Use - United States, 2015. MMWR Morb Mortal Wkly Rep. 2017;66(8):201–206. | ||
Coombs NJ, Cronin KA, Taylor RJ, Freedman AN, Boyages J. The impact of changes in hormone therapy on breast cancer incidence in the US population. Cancer Causes Control. 2010;21(1):83–90. | ||
DeSantis C, Ma J, Bryan L, Jemal A. Breast cancer statistics, 2013. CA Cancer J Clin. 2014;64(1):52–62. | ||
Caplan LS, Wells BL, Haynes S. Breast cancer screening among older racial/ethnic minorities and whites: barriers to early detection. J Gerontol. 1992;47 Spec No:101–110. | ||
Eidson M, Becker TM, Wiggins CL, Key CR, Samet JM. Breast cancer among Hispanics, American Indians and non-Hispanic whites in New Mexico. Int J Epidemiol. 1994;23(2):231–237. | ||
Family L, Bensen JT, Troester MA, Wu MC, Anders CK, Olshan AF. Single-nucleotide polymorphisms in DNA bypass polymerase genes and association with breast cancer and breast cancer subtypes among African Americans and Whites. Breast Cancer Res Treat. 2015;149(1):181–190. | ||
Mechanic LE, Millikan RC, Player J, et al. Polymorphisms in nucleotide excision repair genes, smoking and breast cancer in African Americans and whites: a population-based case-control study. Carcinogenesis. 2006;27(7):1377–1385. | ||
Millikan R, Eaton A, Worley K, et al. HER2 codon 655 polymorphism and risk of breast cancer in African Americans and whites. Breast Cancer Res Treat. 2003;79(3):355–364. | ||
Orom H, Kiviniemi MT, Shavers VL, Ross L, Underwood W 3rd. Perceived risk for breast cancer and its relationship to mammography in Blacks, Hispanics, and Whites. J Behav Med. 2013;36(5):466–476. | ||
Millikan RC, Heard K, Winkel S, et al. No association between the MDM2 -309 T/G promoter polymorphism and breast cancer in African-Americans or Whites. Cancer Epidemiol Biomarkers Prev. 2006;15(1):175–177. | ||
Ravdin PM, Cronin KA, Howlader N, et al. The decrease in breast-cancer incidence in 2003 in the United States. N Engl J Med. 2007;356(16):1670–1674. | ||
Shiao YH, Chen VW, Lehmann HP, Wu XC, Correa P. Patterns of DNA ploidy and S-phase fraction associated with breast cancer survival in blacks and whites. Clin Cancer Res. 1997;3(4):587–592. | ||
Savage N, Levin J, De Moor NG, Lange M. Cytosolic oestrogen receptor content of breast cancer tissue in blacks and whites. S Afr Med J. 1981;59(18):623–624. | ||
Retsky MW, Demicheli R, Gukas ID, Hrushesky WJ. Enhanced surgery-induced angiogenesis among premenopausal women might partially explain excess breast cancer mortality of blacks compared to whites: an hypothesis. Int J Surg. 2007;5(5):300–304. | ||
Rangel LB, Taraba JL, Frei CR, Smith L, Rodriguez G, Kuhn JG. Pharmacogenomic diversity of tamoxifen metabolites and estrogen receptor genes in Hispanics and non-Hispanic whites with breast cancer. Breast Cancer Res Treat. 2014;148(3):571–580. | ||
Mckenzie F, Zietsman A, Galukande M, et al. Drivers of advanced stage at breast cancer diagnosis in the multicountry African breast cancer - disparities in outcomes (ABC-DO) study. Int J Cancer. 2018;142(8):1568–1579. | ||
Webber C, Jiang L, Grunfeld E, Groome PA. Identifying predictors of delayed diagnoses in symptomatic breast cancer: a scoping review. Eur J Cancer Care (Engl). 2017;26(2):e12483. | ||
Di Salvo F, Caranci N, Spadea T, et al; Socioeconomic Inequalities and Oncological Outcomes Italian Working Group. Socioeconomic deprivation worsens the outcomes of Italian women with hormone receptor-positive breast cancer and decreases the possibility of receiving standard care. Oncotarget. 2017;8(40):68402–68414. | ||
Wojcik BE, Spinks MK, Optenberg SA. Breast carcinoma survival analysis for African American and white women in an equal-access health care system. Cancer. 1998;82(7):1310–1318. | ||
Holmes CE, Muss HB. Diagnosis and treatment of breast cancer in the elderly. CA Cancer J Clin. 2003;53(4):227–244. | ||
Hortobagyi GN. Treatment of breast cancer. N Engl J Med. 1998;339(14):974–984. | ||
Turner NC, Neven P, Loibl S, Andre F. Advances in the treatment of advanced oestrogen-receptor-positive breast cancer. Lancet. 2017;389(10087):2403–2414. | ||
Ignatiadis M, Sotiriou C. Luminal breast cancer: from biology to treatment. Nat Rev Clin Oncol. 2013;10(9):494–506. | ||
Rimawi MF, Schiff R, Osborne CK. Targeting HER2 for the treatment of breast cancer. Annu Rev Med. 2015;66:111–128. |
Supplementary materials
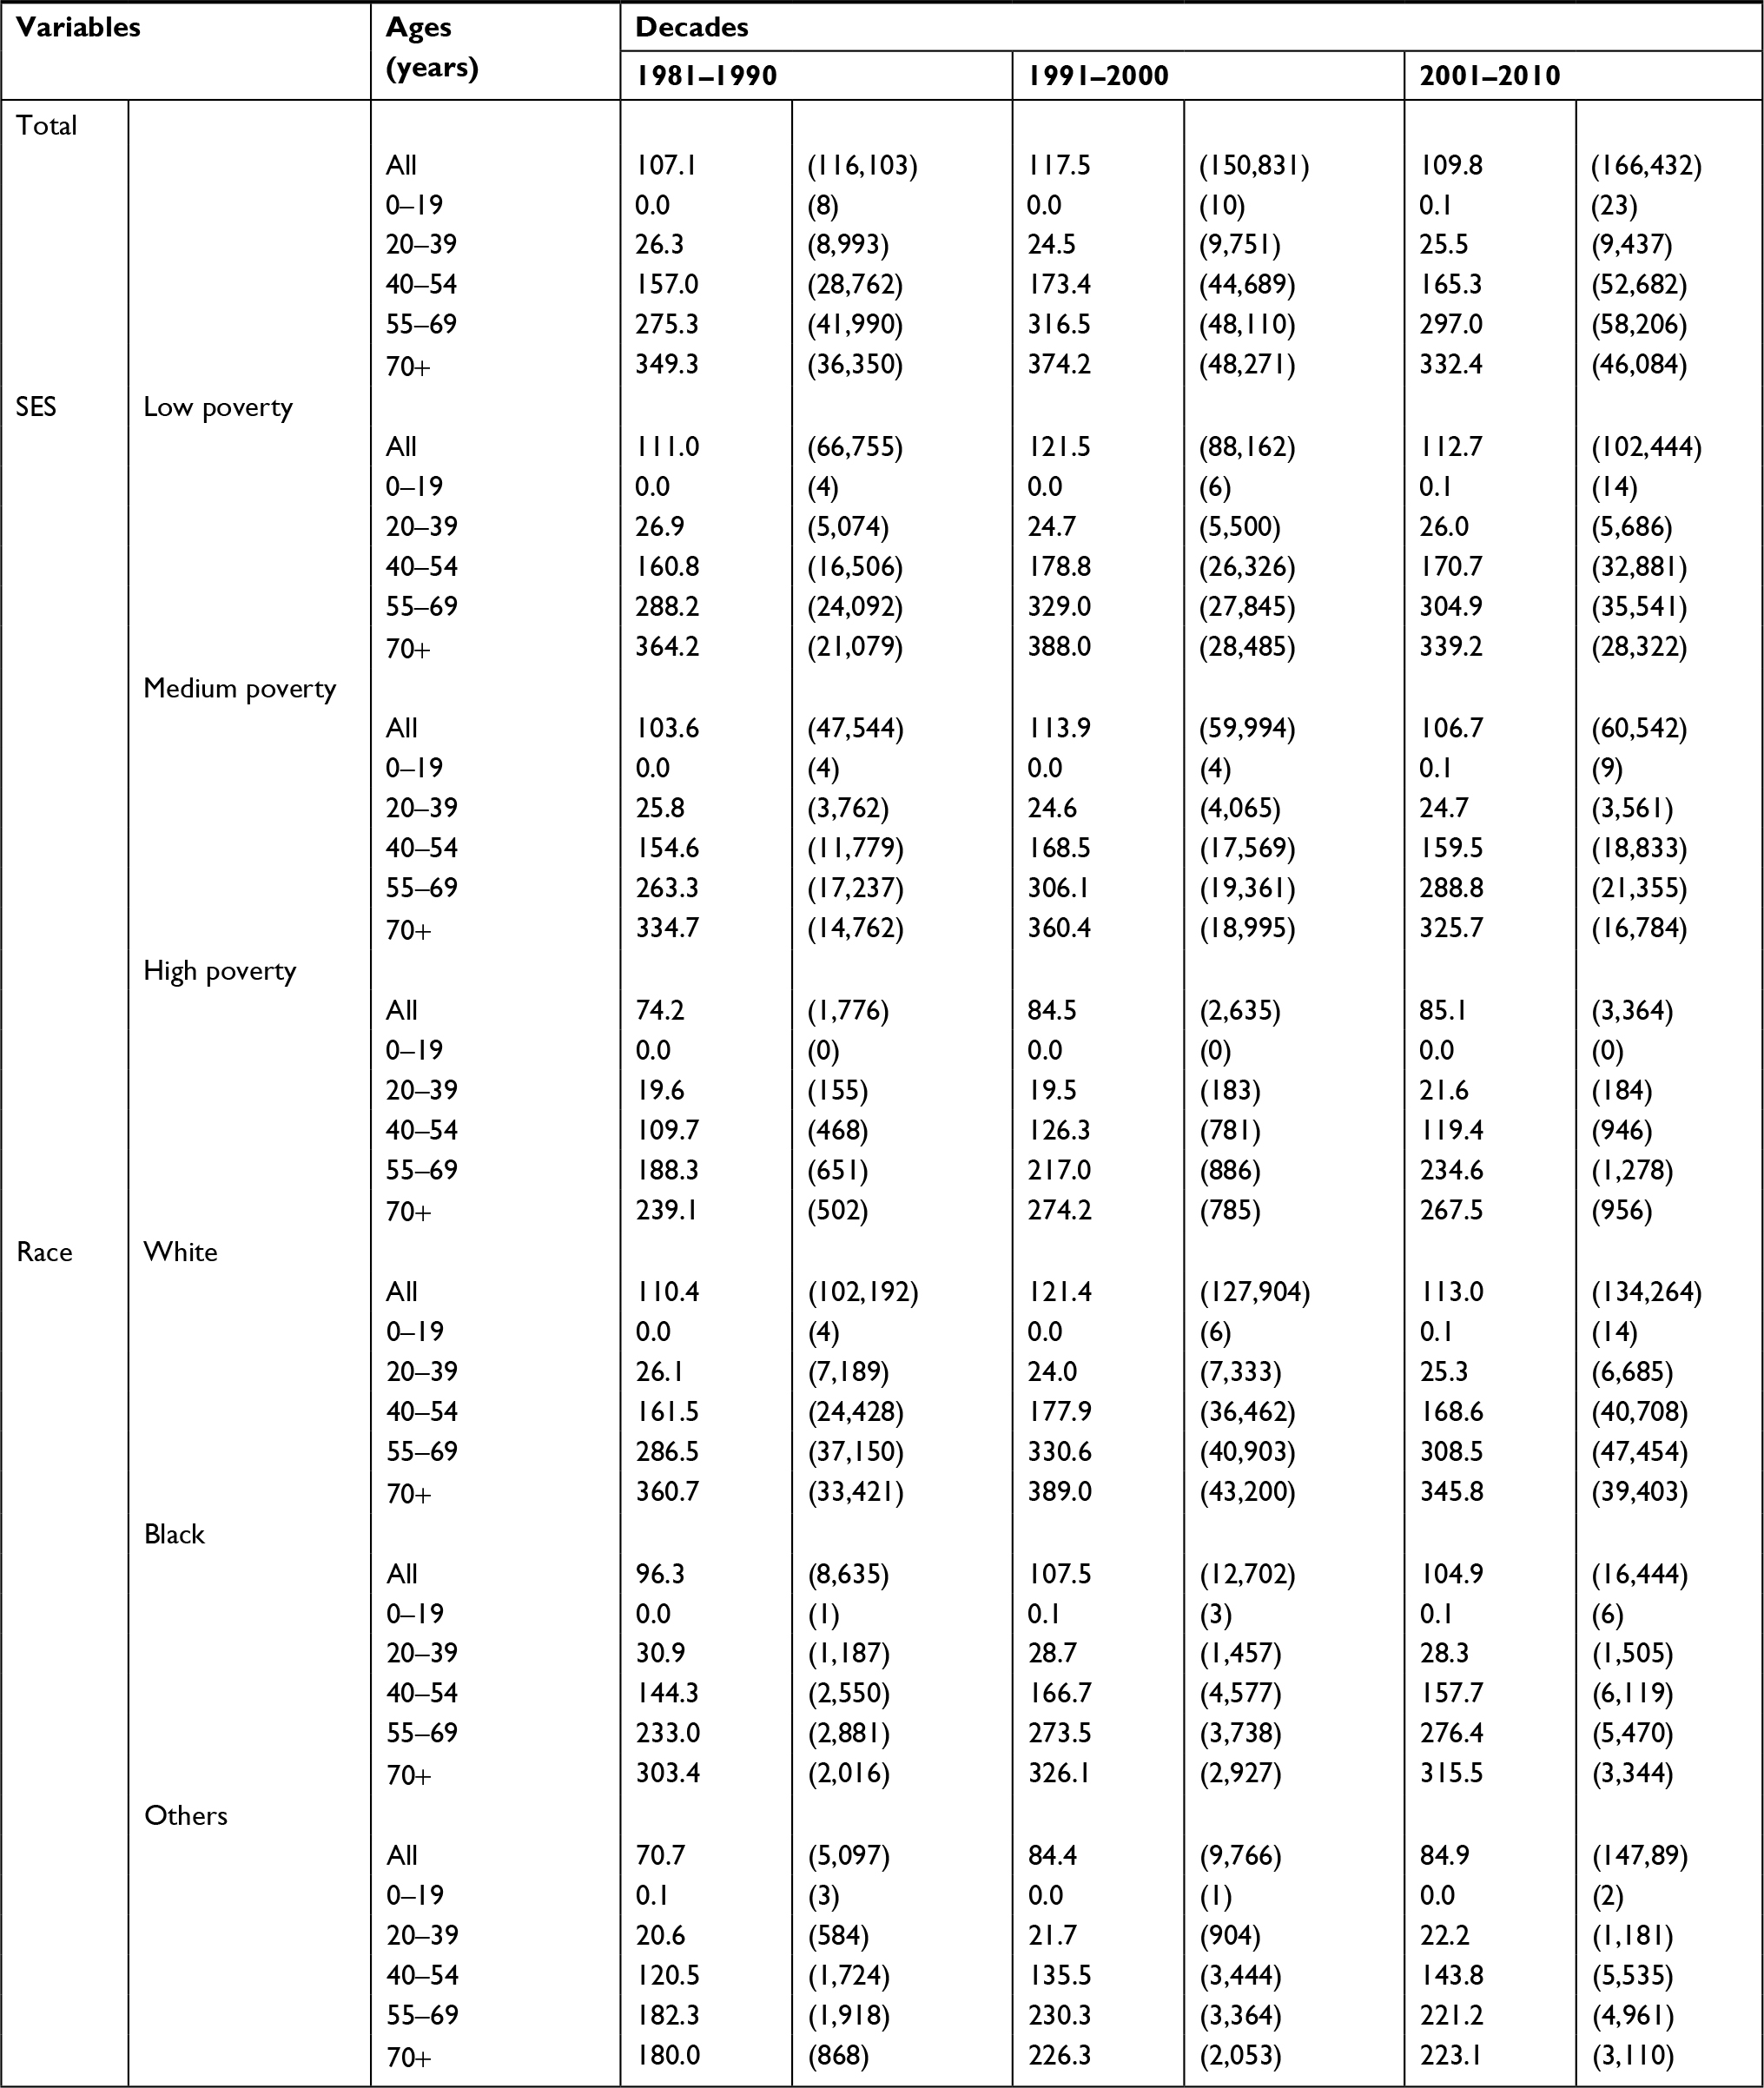 | Table S1 The incidence of breast cancer according to age group and decade within SES and race groups from 1981 to 2010 at the nine original SEER sites Note: Data are incidence per 100,000 people by year of diagnosis, with the number of patients in parentheses. Abbreviations: SES, socioeconomic status; SEER, Surveillance, Epidemiology, and End Results. |
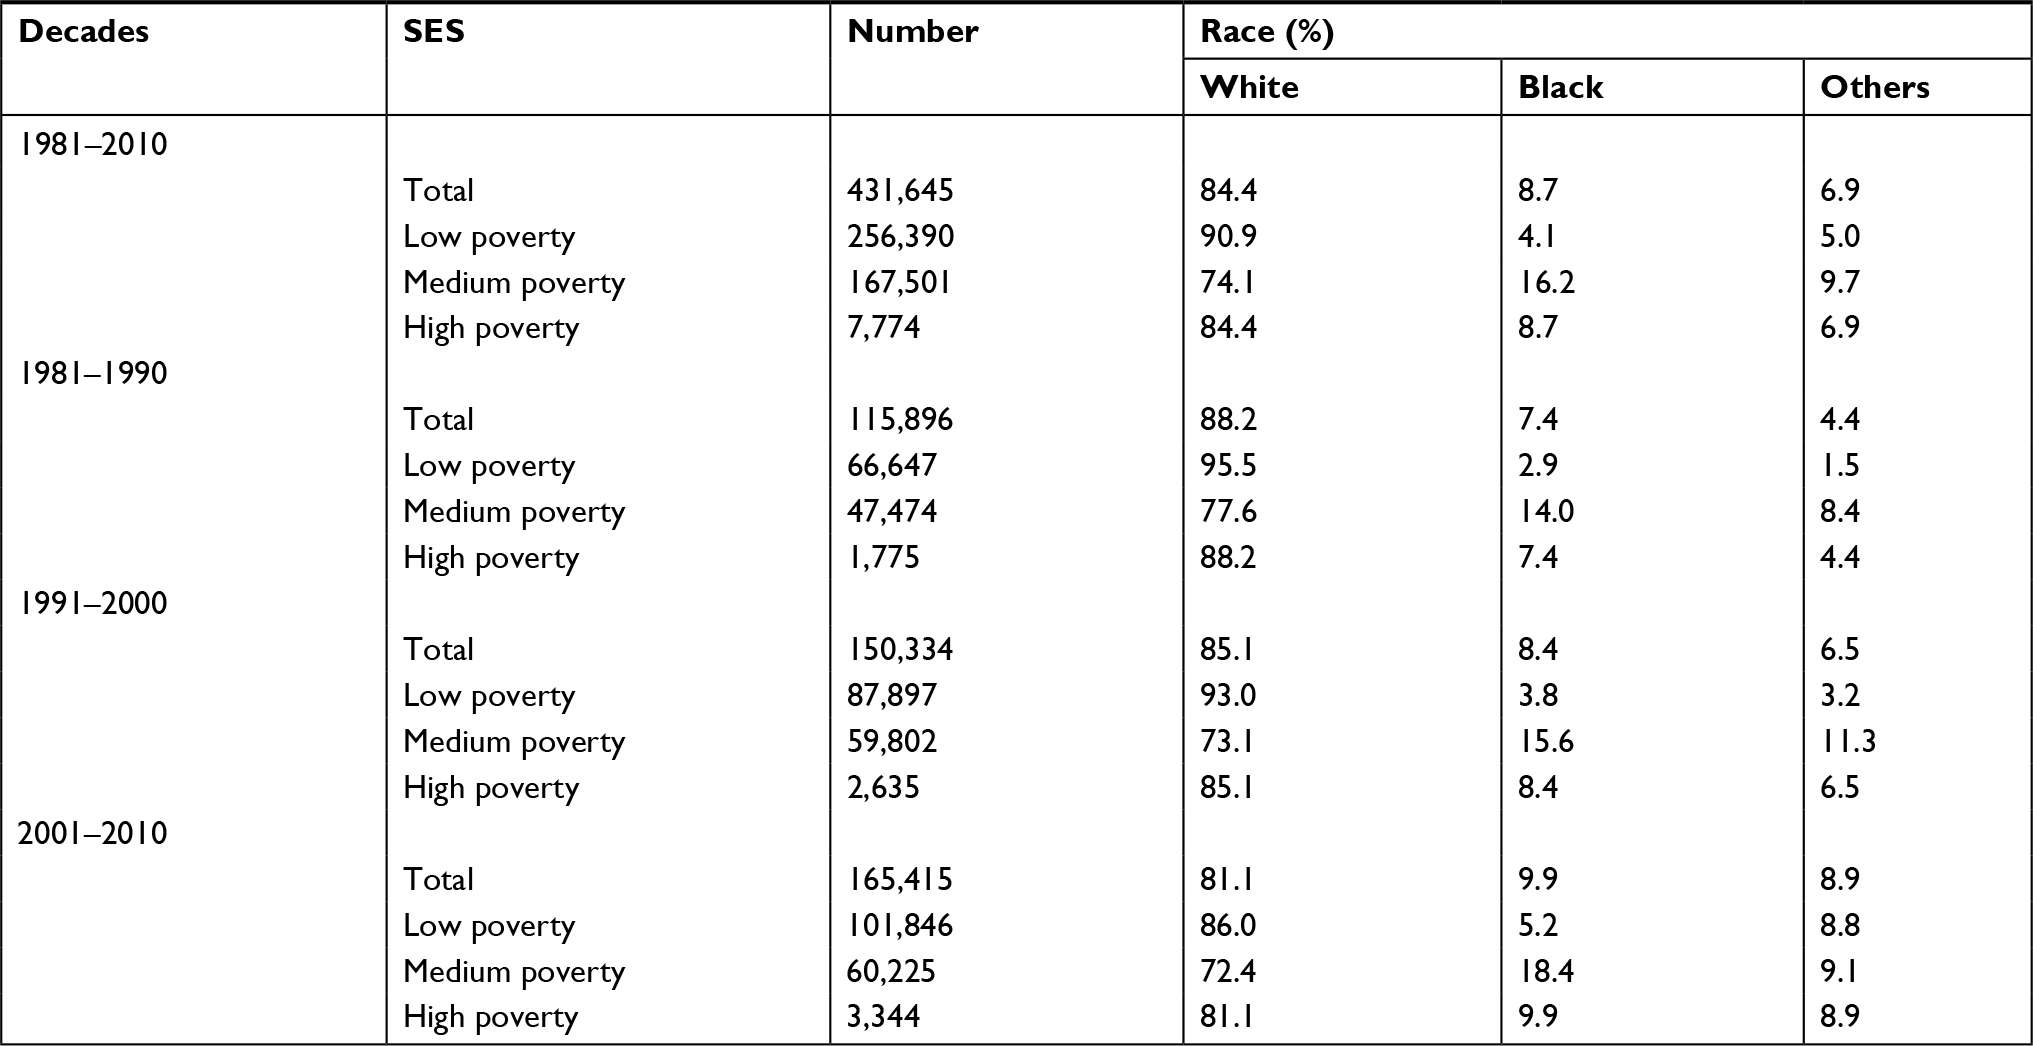 | Table S2 Summary data of race distribution by SES and calendar period in patients with breast cancer from 1981 to 2010 at nine SEER sites Abbreviations: SES, socioeconomic status; SEER, Surveillance, Epidemiology, and End Results. |
 | Figure S1 The changes of general population in the 1980, 1990, 2000, and 2010 in the United States. Note: (A) Population number in each decade by race (B) and incidence trend in each year (C). |
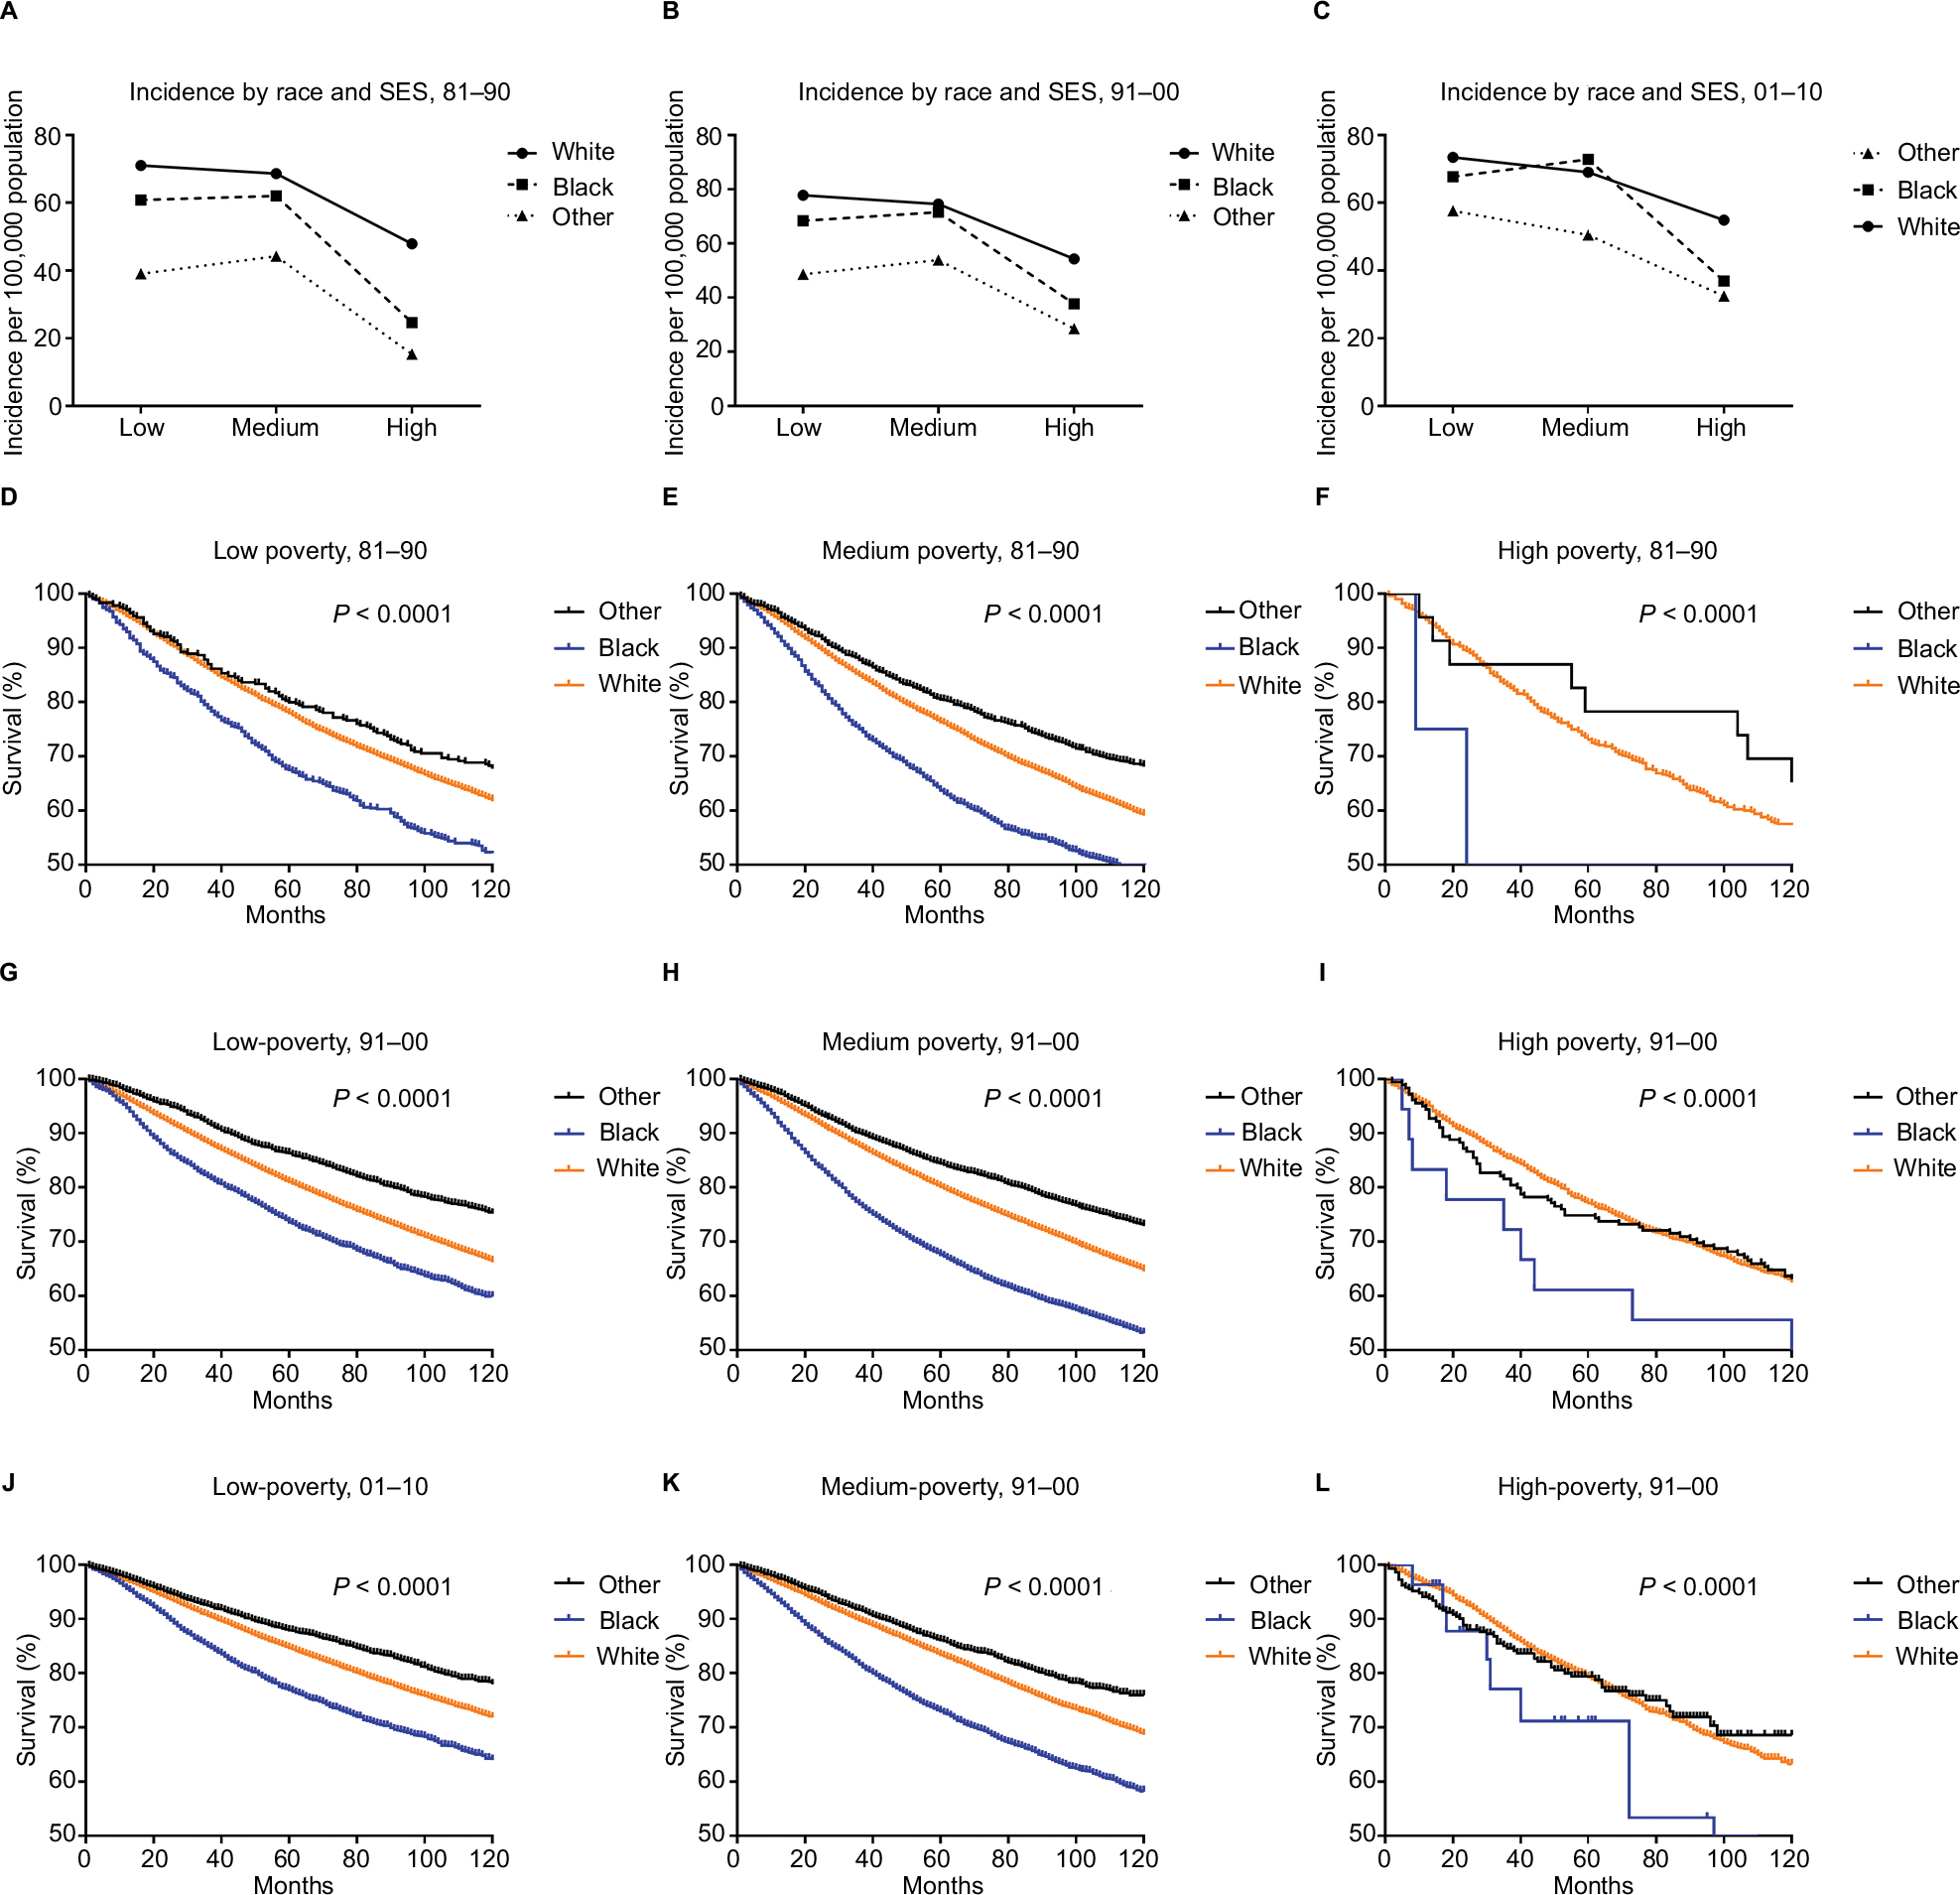 | Figure S2 Incidence trend by race and SES in each decade (A, B, and C). Survival analysis by race and SES in the first decade (D, E, and F), the second decade (G, H, and I), and the third decade (J, K, and L). Abbreviation: SES, socioeconomic status. |
 © 2018 The Author(s). This work is published and licensed by Dove Medical Press Limited. The full terms of this license are available at https://www.dovepress.com/terms.php and incorporate the Creative Commons Attribution - Non Commercial (unported, v3.0) License.
By accessing the work you hereby accept the Terms. Non-commercial uses of the work are permitted without any further permission from Dove Medical Press Limited, provided the work is properly attributed. For permission for commercial use of this work, please see paragraphs 4.2 and 5 of our Terms.
© 2018 The Author(s). This work is published and licensed by Dove Medical Press Limited. The full terms of this license are available at https://www.dovepress.com/terms.php and incorporate the Creative Commons Attribution - Non Commercial (unported, v3.0) License.
By accessing the work you hereby accept the Terms. Non-commercial uses of the work are permitted without any further permission from Dove Medical Press Limited, provided the work is properly attributed. For permission for commercial use of this work, please see paragraphs 4.2 and 5 of our Terms.