")
Back to Journals » OncoTargets and Therapy » Volume 13
The Expressions of Keratins and P63 in Primary Squamous Cell Carcinoma of the Thyroid Gland: An Application of Raman Spectroscopy
Authors Wang S, Ye D, Wang B, Xie C
Received 1 September 2019
Accepted for publication 5 December 2019
Published 20 January 2020 Volume 2020:13 Pages 585—591
DOI https://doi.org/10.2147/OTT.S229436
Checked for plagiarism Yes
Review by Single anonymous peer review
Peer reviewer comments 2
Editor who approved publication: Prof. Dr. Takuya Aoki
Si-si Wang, Dao-xiong Ye, Bo Wang, Chao Xie
Department of General Surgery, Fujian Medical University Union Hospital, Fuzhou, Fujian Province, The People’s Republic of China
Correspondence: Dao-xiong Ye
Department of General Surgery, Fujian Medical University Union Hospital, 29 Xinquan Road, Fuzhou, Fujian Province 350001, The People’s Republic of China
Tel/Fax +86-591-86218015
Email [email protected]
Purpose: Primary squamous cell carcinoma is a rare malignancy in the thyroid gland (SCCTh). The overall prognosis of this carcinoma is poor. This study aimed to explore the application of Raman spectroscopy in investigating the expression of CK5/6 and P63 in SCCTh.
Patients and Methods: Tissues of the SCCTh and adjacent normal thyroid, as well as blood serum, were collected from a patient with pathology-confirmed SCCTh. Whole genome sequencing analysis was performed with the tissue of the SCCTh. The expressions of keratins and TP53 family gene were investigated by the Raman spectroscopy in tissues of the SCCTh and adjacent normal thyroid. The serum was also investigated by the Raman spectroscopy for the expression of keratins and TP53 family gene.
Results: The whole genome sequencing analysis identified the mutation of the TP53 gene (42%) in the tissues of SCCTh. Accordingly, the Raman spectra analyses showed higher expression of keratins and TP53 family gene in the tissues of SCCTh compared with that in the adjacent normal thyroid. Raman spectra analyses of the serum of the patient also showed the expressions of the keratins and TP53 family gene.
Conclusion: The expressions of the keratins and TP53 are different in the tissues of SCCTh and adjacent normal thyroid, and the difference could be identified with high sensitivity by the Raman spectra analyses.
Keywords: SCCTh, thyroid neoplasms, CK5/6, P53, Raman spectrum analysis
Introduction
Primary squamous cell carcinoma of the thyroid gland (SCCTh) is a rare thyroid malignancy characterized by high aggressiveness and a poor prognosis, accounting for less than 1% of all thyroid malignancies.1 Patients with SCCTh usually present with a symptom of neck masses which grow progressively in a short period of time, followed by change of voice, dyspnea, or dysphagia, indicating tumour infiltration of adjacent tissues and organs.2 Due to its rare incidence, the existing literature of SCCTh is mainly case reports and studies investigating the aetiology and pathogenesis of SCCTh are largely lacking. There is no clinical guideline for the diagnosis and treatment of SCCTh. The widely suggested treatment for SCCTh is a combination of surgical resection and adjuvant radiotherapy and chemotherapy.1 However, the prognosis of SCCTh is still unfavourable regardless of the improvement in adjuvant therapy in recent years. Therefore, studies investigating the pathogenesis and molecular pathology of SCCTh are of clinical importance to the treatment of the disease.
The expression of cytokeratin 5/6 (CK5/6) and P63 in the immunohistochemistry analyses of SCCTh has been reported in the previous studies.3,4 The pattern of cytokeratin expression in SCCTh has been suggested and the expression of CK5/6 and P63 may be associated with the squamous metaplasia of papillary thyroid carcinoma cells, which may lead to the occurrence of a mixed-type carcinoma.5,6 However, studies investigating the role of CK5/6 and P63 in the pathogenesis of SCCTh are still lacking.
Raman Spectroscopy is regarded as the molecular “fingerprint” of samples. It is an optical technique measuring the molecular specific inelastic scattering of light. Changes in frequency and intensity of inelastic scattered light produce different characteristic spectral peaks, representing key substances of the molecule, providing information on structure and composition (lipids, proteins, sugars, water, DNA, and RNA, etc.) of the tissue, and localization and classification of the cells. In recent years, Raman spectroscopy has been increasingly applied in the detection and diagnosis of cancers.7 In 2009, Raman spectroscopy was reported to be used to distinguish between normal thyroid follicular epithelial cells and thyroid anaplastic carcinoma cells with a high degree of accuracy.8
The present study aimed to explore the potential feasibility of applying Raman spectroscopy in the study of SCCTh, and extend the application of Raman spectroscopy to investigate the expression of CK5/6 and P63 in SCCTh.
Materials and Methods
The Patient and Samples
A 59-year-old man was admitted to the Department of Thyroid Surgery of Union Hospital affiliated to Fujian Medical University with suspected SCCTh. The possibility of other malignancy metastasizing to the thyroid was ruled out by full-body Positron emission tomography-computed tomography (PET/CT), high resolution computed tomography (HRCT) for the chest, and contrast enhancement CT scan for the abdomen before the surgery. The patient had no other comorbidities and his liver and kidney functions were normal according to the preoperative blood test (data not shown). He accepted total thyroidectomy with resection of the central lymph nodes. The postoperative pathological diagnosis confirmed thyroid squamous cell carcinoma. There was no evidence of other co-existing thyroid diseases or other types of primary thyroid malignancy. After the surgery, he accepted one cycle of radiotherapy and two cycles of chemotherapy but was not willing to continue the systematic therapy afterwards. The patients were not decreased upon the latest contact in October, 2018 (10 months after the surgery), but whether he had experienced recurrence at that time was unknown. The patient was lost for follow-up afterwards.
After fasting for 12 hrs, the patient’s blood (6 mL) was collected intravenously with anticoagulation. The sample was then centrifuged for 10 mins at 4°C (rotation speed: 8000 rpm). Only the serum was collected and stored in −80°C.
The surgical samples were collected right after the resection. The samples were washed three times with 0.9% saline. Tissues of the carcinoma and normal thyroid were collected separately for later whole genome sequencing analysis. The samples were then placed on an aluminium sheet and Raman spectroscopy was then performed with a microscope (50×), and 2 to 3 measurement points were selected for each tissue. The thyroid was then fixed with 10% formalin and embedded in paraffin for pathological diagnosis.
Whole Genome Sequencing Analysis
The SCCTh tissue and adjacent normal thyroid tissues were sent to the whole genome sequencing analysis. The degree of DNA degradation and RNA contamination was analyzed by agarose gel electrophoresis. The purity of DNA was determined by Nanodrop (OD260/280 ratio), and DNA samples whose OD value was between 1.8 and 2.0 with the amount more than 1.5 ug were used to construct the sequencing library. The qualified DNA samples were randomly broken into fragments of 350 bp in length by a Covaris crusher. The TruSeq Library Construction Kit was used to prepare the library through a process of end-repair of the DNA fragments, addition of an adenine to the 3ʹ ends of DNA fragments, extension of the sequencing linker, purification, and PCR amplification. The constructed libraries were sequenced using the Illumina Hiseq platform. After that, DNA quantification was performed using Qubit 2.0. The libraries were diluted to 1 ng/μL, and Agilent 2100 was used to test the insert size of the libraries. When the insert size reached expectation, Real-Time PCR was used to accurately quantify the effective concentration of the libraries (effective library concentration > 2 nM). When the libraries were quantified, the Illumina Hiseq platform was used to sequence based on the effective concentration of the libraries.
Raman Spectroscopy
The Spectrum Excitement of the serum sample was realized by a laser excitation source of 785 nm using a Renishaw Raman microspectrometer® (UK). The objective lens was 40× and was used to excite light and collected the backscattered light signals. The signals were then filtered and transmitted to the Peltier cooled CCD (charge-coupled device), where the spectral resolution was set to 2 cm−1, the integration time was set to 10 s, and the Raman spectral acquisition range was between 400 and 1750 cm−1.
Design of Raman Probe
DNA-silver nano-hybrid films were prepared in situ. The as- prepared DNA-Ag+-incorporated multilayer films were reduced electrochemically to yield silver nanoparticles under a constant potential of −0.4 V in a N2-saturated 0.1 M KNO3 solution. Electrochemical reduction was performed on a CHI 660 B electrochemical workstation, i.e. a conventional three-electrode system containing a platinum counter electrode, a Ag/AgCl reference electrode, and multilayer films where ITO was coated as the working electrode. After the electrochemical reduction of silver was completed, ITO was removed from the solution. The film was then rinsed thoroughly in deionized water and allowed to dry in a nitrogen stream for further characterization and application.9
Raman Spectral Data Processing
The result of Surface-enhanced Raman scattering (SERS) was a combination of signals of the Raman scattering of the serum, auto-fluorescence, and noises, which needed to be removed of noises and normalized. In order to reduce the inference by auto-fluorescence and background signals, we performed a fifth-order polynomial fitting pre-treatment on the raw SERS spectral data. Afterwards, the spectral intensity of the subtracted background data was normalized (in the range of 400–1750 cm−1 wavenumber) to minimize the variety of the spectral signal that was likely caused by parameters setting and experimental operation.
Data Analysis
Multivariate statistical methods, i.e Principal Component Analysis (PCA) – Linear Discriminant Analysis (LDA), were used to identify meaningful Raman features among all the 1433 SERS spectral variables in the range of 400–1750 cm−1 wavenumber. PCA is a multivariate statistical method that uses complex variables or principal components to characterize all spectral information after processing complex spectral data, and principal components are also used to establish recognition models for different samples. LDA maximizes the difference between different samples and minimizes the difference between similar samples by analysing the linear combination of the variables. The PCA-LDA analyses were performed with SPSS software package® (SPSS Inc., Chicago).
Ethics
This study was conducted conforming to the Declaration of Helsinki and was approved by the ethics committee of Union Hospital affiliated to Fujian Medical University (reference number: 2018KY073). Written informed consent to publish the case details and related images was obtained from the patient.
Results
The post-operative histopathological report showed that these patients had differentiated squamous cell carcinoma in both of his thyroid glands. The carcinoma had invaded the bilateral recurrent laryngeal nerve, the trachea, and the oesophagus, and carcinoma thrombus was found in the vasculature. The immunohistochemistry showed CK5/6, P63 were positive in the tissue of the carcinoma (Figure 1).
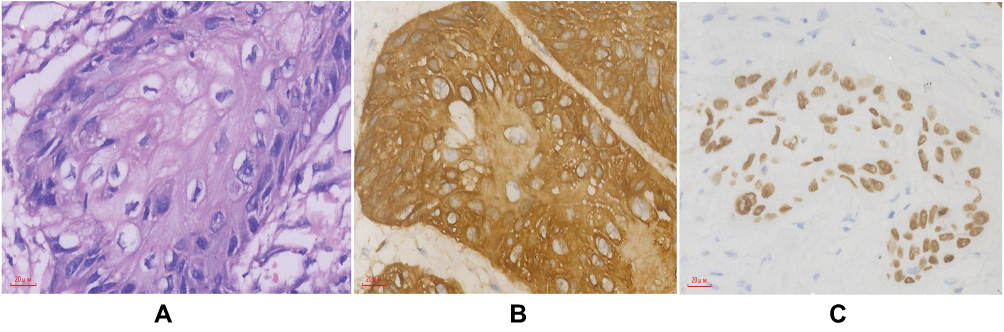 |
Figure 1 Microscopic and immunohistochemical stain of primary squamous cell carcinoma of the thyroid gland (SCCTh) from the resected sample of the patient. (A) SCCTh; (B) and (C) showed that SCCTh was positive for CK5/6 (b) and p63 (c). |
The Whole genome sequencing analysis identified the mutation of the TP53 gene in the tumour tissues of these patients, and the mutation frequency was up to 42%. Besides, there were also low-frequency mutations of the AT-rich interactive domain-containing protein 1A gene (ARID1A) and RNA binding protein fox-1 homolog 2 gene (RBFOX2) (Figure 2).
 |
Figure 2 Result of the whole genome sequencing analysis. Circos tool was used to demonstrate genomic variant in SCCTh samples. From outside to inside circles, the first circle: sequencing coverage; the second circle: the green dots indicated the density of the SNP indel; the third circle: CNV results, where red colour indicated the copy number increased, blue colour indicated the copy number was missing, and green colour indicated the copy number is normal; the fourth circle: SV Results of CTX (orange), INS (green), DEL (gray), ITX (pink), and INV (blue). |
In the results of Raman spectrum, the SCCTh tissue and adjacent normal thyroid tissues were abundant in the fingerprint region of 600–1800 cm−1, where the signal-to-noise ratio was also high. The main peaks were 523 cm−1 ((phosphatidylserine), 671 cm−1 (nucleic acids, nucleotides), 751 cm−1 (nucleic acids, nucleotides), 935 cm−1 (proline, hydroxyproline, collagen backbone), 1008 cm−1 (phenylalanine), 1099 cm−1 (amide III), 1231 cm−1 (amide III).), 1318 cm−1 (amide III), 1562 cm−1 (TP53), 1638 cm−1 (amide I band), and 1752 cm−1 (lipids, fatty acids) (Figure 3). Furthermore, the variety of the Raman spectrum intensity is greater in SCCTh tissue than that in the adjacent normal thyroid tissues within the entire range, and the differential spectrum (the Raman spectrum of the SCCTh tissue subtracted the Raman spectrum of the adjacent normal thyroid tissues) showed significant difference in several peaks, i.e. in peaks of the 755 cm−1 (nucleic acids, nucleotides), 935 cm−1 (proline, hydroxyproline, collagen backbone), 975 cm−1 (ribose), 1030 cm−1 (cytokeratin), 1202 cm−1 (tryptophan, phenylalanine, tryptophan, A, and amide III), 1231 cm−1 (amide III), 1445 cm−1 (collagen, phospholipids), 1502 cm−1 (benzenoid ring), 1562 cm−1 (TP53), and 1638 cm−1 (amide I band) (Figure 3). Among these peaks, the peaks of 935 cm−1, 1030 cm−1, and 1562 cm−1 reflected the different expression of keratins and TP53 in tissues of the SCCTh and adjacent normal thyroid. The differences in the peak intensity of the Raman spectra between SCCTh tissue and the adjacent normal thyroid tissues were more evident in the range of 1200–1800 cm−1.
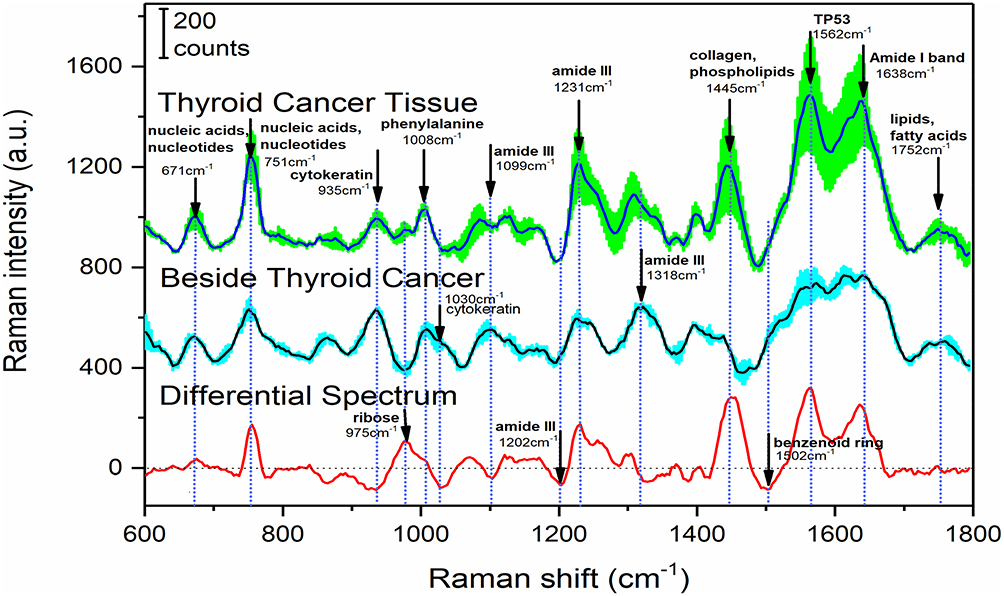 |
Figure 3 Raman spectrum of the primary squamous cell carcinoma of the thyroid (SCCTh), the adjacent normal thyroid, and the differential spectrum. The top curve is the Raman spectrum of the SCCTh. The curve in the middle is the Raman spectrum of the adjacent normal thyroid. And the curve in the bottom is the differential Raman spectrum of the SCCTh and the adjacent normal thyroid. The shadow around the spectrum indicates the standard deviation. |
The analyses on the Raman spectrum of the patient’s serum (Figure 4) showed that many spectral peaks occurred in the fingerprint region of 600–1800 cm−1 and there existed high signal-to-noise ratio. The main peaks were 830 cm−1 (nucleic acids, nucleotides), 853 cm−1 (amino acid, proline, hydroxyproline), 900 cm−1 (amino acid, proline, hydroxyproline), 940 cm−1 (proline, hydroxyproline, collagen backbone), 1004 cm−1 (phenylalanine), 1032 cm−1 (Proline, collagen), 1210 cm−1 (tyrosine, phenylalanine), 1258 cm−1 (amide III, adenine, cytosine), 1333 cm−1 (guanine), 1448 cm−1 (collagen), 1616 cm−1 (tyrosine, tryptophan), and 1660 cm−1 (structural proteins). Besides, the peaks of 935 cm−1, 1030 cm−1, and 1562 cm−1 were also visible on the Ramen spectrum of the serum, representing the expression of the keratin and proteins of the TP53 family in the patient’s serum.
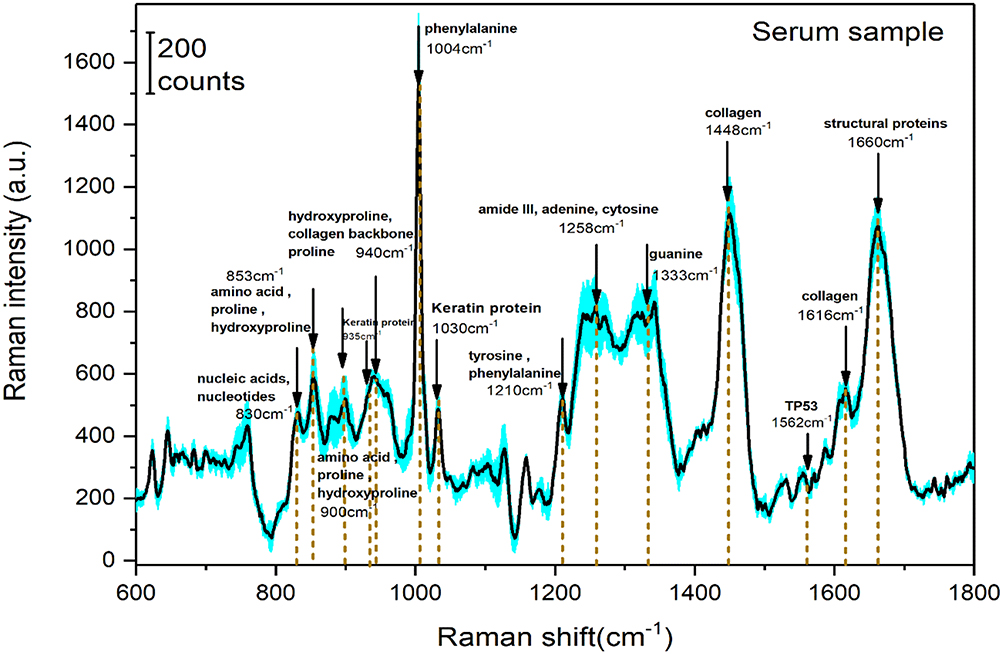 |
Figure 4 Serum Raman spectrum of the patient. The shadow around the spectrum indicates the standard deviation. |
Discussion
This study, with novel applications of the Raman spectroscopy, showed different expressions of keratins and TP53 in the tissues of SCCTh and adjacent normal thyroid. Besides, the expression of keratin and TP53 was also evident in the serum of the patient.
SCCTh is a thyroid disease with extremely rare incidence, and the clinical diagnosis and the effective therapy for this disease have not been well established.10 The prognosis of SCCTh is usually very poor. The median time for overall survival was reported to be only about 8–16.4 months, and the 1-year and 2-year survival rates were reported to be 22.7% and 0.11–13 The pathological characteristics of SCCTh are similar to that of the other squamous cell carcinomas. However, due to the absence of squamous epithelium in the thyroid gland, the source of SCCTh is still unclear and a hypothesis of follicular epithelial transformation has been proposed.14 Some studies have reported that the histopathological diagnosis of primary SCCTh was based on keratin or intercellular bridge structure, while the squamous differentiation in thyroid anaplastic carcinoma was reported to be without keratinization.15–18 Therefore, studies investigating the expression of cytokeratin in SCCTh may help to understand the carcinogenesis and pathogenesis of SCCTh. However, relevant studies are largely lacking. Besides, the expression of cytokeratin varies in tumours of different organ-site and may change with tumour differentiation.19 Thus, new techniques and applications are warranted to evaluate the role of cytokeratin in SCCTh.
On the other hand, the rapid development of Raman spectroscopy in recent years has promoted its application in the field of medical science and biology. The recent improvement in the technology, instruments and detection methods has made Raman spectroscopy more sensitive and reliable and some research has been conducted with this technology in thyroid diseases and thyroid tumours.20,21
The existence of missense mutation of the TP53 gene family in SCCTh was confirmed by the whole genome sequencing analysis in this study. In addition, higher expression of the TP53 gene family was also revealed by the Raman spectroscopy in both the SCCTh and the serum of the patient. The overexpression of TP53 gene family is related to cancer cell differentiation in SCCTh.5 Is a member of the TP53 gene family and evidence showed that p63 was abnormally expressed in thyroid cancer.22,23 The p63 gene is located on chromosome 3q27~3q29, expresses in the basement membrane of the epithelium of different organs, and has high specificity and sensitivity to diagnose malignancies.24,25 and P63 are homogenous genes that play a key role not only in the damage response of DNA, but also in the differentiation, proliferation, and apoptosis of tumour cells. It has been reported that the expression of P63 in LECos may indirectly reflect the role of P63 in the proliferation and differentiation of squamous epithelial cells.26
In this study, we also found different expressions of keratins in tissues of the SCCTh and adjacent normal thyroid. CK 5/6 is a keratin with a large molecular weight. Although there is no squamous epithelium in the thyroid, studies have shown that CK5/6 was expressed in the thyroid lympho-epithelial complex (LECo).27 There is evidence suggesting the squamous differentiation in thyroid solid cell nests (SCN), and SCNs may lead to immature squamous metaplasia because of its morphological characteristics and multifocality, resulting misdiagnosis of SCCTh.28,29
The limitation of the present study is that all the samples were collected from the same patient with SCCTh. Thus, more cases and studies are warranted to prove the result of this study. However, the Raman spectrum showed high sensitivity in identifying carcinogenesis-related biomarkers in both the tissues and the serum in this study, suggesting the promising application of this technique in future cancer research.
Conclusion
In this study, Raman spectroscopy was used to explore the expression of keratin and TP53 gene in SCCTh, and the results indicated the potential application of Raman spectroscopy in the diagnosis of thyroid tumour in the near future.
Abbreviations
SCCTh, Primary squamous cell carcinoma of the thyroid gland; SERS, Surface-enhanced Raman scattering.
Author Contributions
All authors made substantial contributions to conception and design, acquisition of data or analysis and interpretation of data; took part in drafting the article or revising it critically for important intellectual content; gave final approval of the version to be published; and agree to be accountable for all aspects of the work.
Disclosure
The authors declare no conflicts of interest.
References
1. Sapalidis K, Anastasiadis I, Panteli N, et al. Primary squamous cell carcinoma of the thyroid gland. J Surg Case Rep. 2014;2014:12. doi:10.1093/jscr/rju133
2. Cho JK, Woo SH, Park J, Kim MJ, Jeong HS. Primary squamous cell carcinomas in the thyroid gland: an individual participant data meta-analysis. Cancer Med. 2014;3(5):1396–1403. doi:10.1002/cam4.287
3. Zhou XH. Primary squamous cell carcinoma of the thyroid. Eur J Surg Oncol. 2002;28(1):42–45. doi:10.1053/ejso.2001.1180
4. Vardar E, Erkan N, Bayol U, Yilmaz C, Dogan M. Metastatic tumours to the thyroid gland: report of 3 cases and brief review of the literature. Radiol Oncol. 2011;45(1):53–58. doi:10.2478/v10019-010-0039-3
5. Lam KY, Lo CY, Liu MC. Primary squamous cell carcinoma of the thyroid gland: an entity with aggressive clinical behaviour and distinctive cytokeratin expression profiles. Histopathology. 2001;39(3):279–286. doi:10.1046/j.1365-2559.2001.01207.x
6. Handra-Luca A. Squamous cell differentiation in metastatic papillary thyroid carcinoma: metaplastic reversion or progression? Iran J Pathol. 2018;13(2):276–280.
7. Kallaway C, Almond LM, Barr H, et al. Advances in the clinical application of Raman spectroscopy for cancer diagnostics. Photodiagnosis Photodyn Ther. 2013;10(3):207–219. doi:10.1016/j.pdpdt.2013.01.008
8. Harris AT, Garg M, Yang XB, et al. Raman spectroscopy and advanced mathematical modelling in the discrimination of human thyroid cell lines. Head Neck Oncol. 2009;1:38. doi:10.1186/1758-3284-1-38
9. Shang L, Wang Y, Huang L, Dong S. Preparation of DNA−silver nanohybrids in multilayer nanoreactors by in situ electrochemical reduction, characterization, and application. Langmuir. 2007;23(14):7738–7744. doi:10.1021/la700700e
10. Zimmer PW, Wilson D, Bell N. Primary squamous cell carcinoma of the thyroid gland. Mil Med. 2003;168(2):124–125. doi:10.1093/milmed/168.2.124
11. Yasumatsu R, Sato M, Uchi R, et al. The treatment and outcome analysis of primary squamous cell carcinoma of the thyroid. Auris Nasus Larynx. 2018;45(3):553–557. doi:10.1016/j.anl.2017.07.009
12. Booya F, Sebo TJ, Kasperbauer JL, Fatourechi V. Primary squamous cell carcinoma of the thyroid: report of ten cases. Thyroid. 2006;16(1):89–93. doi:10.1089/thy.2006.16.89
13. Shrestha M, Sridhara SK, Leo LJ, Coppit GL
14. Sahoo M, Bal CS, Bhatnagar D. Primary squamous-cell carcinoma of the thyroid gland: new evidence in support of follicular epithelial cell origin. Diagn Cytopathol. 2002;27(4):227–231. doi:10.1002/(ISSN)1097-0339
15. Simpson WJ, Carruthers J. Squamous cell carcinoma of the thyroid gland. Am J Surg. 1988;156(1):44–46. doi:10.1016/S0002-9610(88)80169-7
16. Kleer CG, Giordano TJ, Merino MJ. Squamous cell carcinoma of the thyroid: an aggressive tumor associated with tall cell variant of papillary thyroid carcinoma. Mod Pathol. 2000;13(7):742–746. doi:10.1038/modpathol.3880129
17. Kumar PV, Malekhusseini SA, Talei AR. Primary squamous cell carcinoma of the thyroid diagnosed by fine needle aspiration cytology. A report of two cases. Acta Cytol. 1999;43(4):659–662. doi:10.1159/000331162
18. Toner M, Banville N, Timon CI. Laryngotracheal presentation of anaplastic thyroid carcinoma with squamous differentiation: seven cases demonstrating an under-recognized diagnostic pitfall. Histopathology. 2014;65(4):501–507. doi:10.1111/his.2014.65.issue-4
19. Lam KY, Loke SL, Shen XC, Ma LT. Cytokeratin expression in non-neoplastic oesophageal epithelium and squamous cell carcinoma of the oesophagus. Virchows Arch. 1995;426(4):345–349. doi:10.1007/BF00191342
20. Teixeira CS, Bitar RA, Martinho HS, et al. Thyroid tissue analysis through Raman spectroscopy. Analyst. 2009;134(11):2361–2370. doi:10.1039/b822578h
21. O’Dea D, Bongiovanni M, Sykiotis GP, et al. Raman spectroscopy for the preoperative diagnosis of thyroid cancer and its subtypes: an in vitro proof-of-concept study. Cytopathology. 2019;30(1):51–60. doi:10.1111/cyt.2019.30.issue-1
22. Ely KA, Tse G, Simpson JF, Clarfeld R, Page DL. Diabetic mastopathy. A clinicopathologic review. Am J Clin Pathol. 2000;113(4):541–545. doi:10.1309/K5HM-9603-PQ5T-KY3F
23. Melino G. p63 is a suppressor of tumorigenesis and metastasis interacting with mutant p53. Cell Death Differ. 2011;18(9):1487–1499. doi:10.1038/cdd.2011.81
24. Yang A, Kaghad M, Wang Y, et al. p63, a p53 homolog at 3q27-29, encodes multiple products with transactivating, death-inducing, and dominant-negative activities. Mol Cell. 1998;2(3):305–316. doi:10.1016/S1097-2765(00)80275-0
25. Aiad HA, Abd El-Halim Kandil M, Abd El-Wahed MM, Abdou AG, Hemida AS. Diagnostic role of p63 immunostaining in fine needle aspiration cytology of different breast lesions. Acta Cytol. 2011;55(2):149–157. doi:10.1159/000323313
26. Mills AA, Zheng B, Wang XJ, Vogel H, Roop DR, Bradley A. p63 is a p53 homologue required for limb and epidermal morphogenesis. Nature. 1999;398(6729):708–713. doi:10.1038/19531
27. Handra-Luca A, Dragoescu E. Cytokeratin 5/6 and P63 immunophenotype of thyroid lymphoepithelial complexes. Ann Diagn Pathol. 2016;23:58–61. doi:10.1016/j.anndiagpath.2016.03.003
28. Fonseca E, Nesland JM, Hoie J, Sobrinho-Simoes M. Pattern of expression of intermediate cytokeratin filaments in the thyroid gland: an immunohistochemical study of simple and stratified epithelial-type cytokeratins. Virchows Arch. 1997;430(3):239–245. doi:10.1007/BF01324808
29. Rosai J. Rosai and Ackerman’s Surgical Pathology.
 © 2020 The Author(s). This work is published and licensed by Dove Medical Press Limited. The full terms of this license are available at https://www.dovepress.com/terms.php and incorporate the Creative Commons Attribution - Non Commercial (unported, v3.0) License.
By accessing the work you hereby accept the Terms. Non-commercial uses of the work are permitted without any further permission from Dove Medical Press Limited, provided the work is properly attributed. For permission for commercial use of this work, please see paragraphs 4.2 and 5 of our Terms.
© 2020 The Author(s). This work is published and licensed by Dove Medical Press Limited. The full terms of this license are available at https://www.dovepress.com/terms.php and incorporate the Creative Commons Attribution - Non Commercial (unported, v3.0) License.
By accessing the work you hereby accept the Terms. Non-commercial uses of the work are permitted without any further permission from Dove Medical Press Limited, provided the work is properly attributed. For permission for commercial use of this work, please see paragraphs 4.2 and 5 of our Terms.