")
Back to Journals » OncoTargets and Therapy » Volume 10
The expression of aplysia ras homolog I (ARHI) and its inhibitory effect on cell biological behavior in esophageal squamous cell carcinoma
Received 26 October 2016
Accepted for publication 21 January 2017
Published 27 February 2017 Volume 2017:10 Pages 1217—1226
DOI https://doi.org/10.2147/OTT.S125742
Checked for plagiarism Yes
Review by Single anonymous peer review
Peer reviewer comments 2
Editor who approved publication: Dr Samir Farghaly
Yuqiang Mao, Yun Han, Wenjun Shi
Department of Thoracic Surgery, Shengjing Hospital of China Medical University, Shenyang, China
Background: Aplysia ras homolog I (ARHI) is a Ras-related maternally imprinted tumor suppressor gene. Loss of ARHI expression contributes to the malignant progression of various tumors. However, reports on the clinical implications and functional role of ARHI expression in esophageal squamous cell carcinoma (ESCC) are limited. This study examined the role of ARHI in ESCC.
Methods: In total, 81 patients diagnosed with ESCC based on histopathological evaluations who were subjected to surgical resection were included in the study. ARHI expression was analyzed by immunohistochemistry and western blotting, examining the correlations between ARHI expression and patient clinicopathological features. The functional effects of ARHI overexpression were examined using a Cell Counting Kit-8 assay, flow cytometry, a Transwell assay, wound healing, and western blotting in the ECA109 cell line.
Results: ARHI was highly expressed in 27.5% (22/81) of ESCC specimens (adjacent non-cancerous tissues, 85.2%, 69/81; P<0.05). The ARHI expression level was significantly lower in patients with lymph node metastasis than in patients without (P<0.05). A Kaplan–Meier survival analysis showed that patients with low ARHI expression had shorter survival than patients with high expression (P<0.05), and a multivariate Cox analysis revealed that ARHI is an independent predictor of overall survival (P=0.029). Finally, overexpression of ARHI in ESCC cells indicates that ARHI suppresses proliferative capacity, invasive capacity, and cell cycle progression and may also suppress epithelial–mesenchymal transition and induce apoptosis and autophagy.
Conclusion: ARHI may be a prognostic biomarker and a potential therapeutic target in ESCC.
Keywords: aplysia ras homolog I, esophageal squamous cell carcinoma, cell biological behavior
Introduction
Esophageal squamous cell carcinoma (ESCC) is one of the most aggressively malignant neoplasms, with a poor prognosis. Although considerable diagnostic and therapeutic progress has been made, substantial improvements in patient outcome have not been achieved.1 The overall 5-year survival rate for ESCC is <40%,2 mainly because it is usually diagnosed at a late stage, increasing instances with early metastasis to the lymph nodes and distant metastases.3–5 Therefore, the identification of useful biomarkers for ESCC treatment is urgently needed.
Aplysia ras homolog I (ARHI) is a recently identified maternally imprinted tumor-suppressor gene located on the human chromosome 1p31. It encodes a 26 kDa small GTP-binding protein and shares 54%–62% amino acid homology with Ras/Rap family members.6 It is the first reported tumor-suppressor gene in the Ras superfamily. Recent research shows that ARHI is involved in breast, ovary, pancreas, liver, and lung carcinogenesis.7–13 However, it is unclear whether it plays a role in ESCC.
One mechanism by which ARHI may mediate cancer progression is through the regulation of programmed cell death (PCD), which includes apoptosis and autophagic cell death. Apoptosis, also known as type I PCD, is a caspase-dependent process, and autophagy, type II PCD, is a type of non-apoptotic cell death. Autophagy is a physiological process in eukaryotic cells by which cytoplasm and other cellular components are targeted to lysosomes for degradation.14,15 Autophagy has gradually become an important area in cancer research,16–18 but data connecting cancer prognosis with autophagy are limited.
The aim of this study was to investigate the correlation between ARHI expression and patient clinicopathological characteristics. In addition, the effects of ARHI on invasion, proliferation, autophagy, apoptosis, and cell cycle progression were also investigated.
Materials and methods
Patients and tissue samples
A total of 81 ESCC tissue specimens were obtained from patients in the Department of Thoracic Surgery of Shengjing Hospital, the second affiliated hospital of the China Medical University, between 2007 and 2009. All patients underwent a resection with biopsy and diagnosis at the pathology department. The specimens consisted of 10% formalin-fixed, paraffin-embedded tissue sections; 4 μm sections were cut for histopathological analysis. None of the patients received anticancer therapy or adjuvant treatment prior to the operation.
All the 81 cases were independently classified as ESCC by two experienced pathologists according to the World Health Organization classification. Patients were staged according to the International Union Against Cancer TNM classification of malignant tumors, seventh edition, 2009. All the 81 patients received follow-ups through telephone enquiry or questionnaires. The follow-up time ranged from 6 to 73 months (median, 29 months).
Immunohistochemistry analysis
Immunohistochemical studies on ARHI were performed using 81 10% formalin-fixed, paraffin-embedded tissue sections (4 μm thick) obtained from patients with ESCC. The expression of ARHI was detected using the DAB color system and the PV-9000 method. The primary antibody was anti-ARHI (working dilution 1:50; Santa Cruz Biotechnology Inc., Dallas, TX, USA). The DAB and PV-9000 kit were obtained from Zhongshan Chemical (Beijing, China). The tissue sections were dewaxed in xylene and hydrated with graded alcohol and phosphate-buffered saline (PBS). Sections were then subjected to heat-induced epitope retrieval by boiling in 10 mM citrate buffer, pH 6.0, for 10 min. Sections were then incubated with primary antibodies overnight at 4°C, stained using the PV-9000 kit, and counterstained with hematoxylin following the manufacturer’s instructions. For negative controls, the primary antibody was replaced with PBS.
Two experienced pathologists who were blinded to patient histopathological data independently scored immunohistochemically stained tissue sections. ARHI-positive staining was located in the cytoplasm. The evaluation was standardized based on the staining classification system of Rosen et al,19 but it was modified slightly for simplification. Staining intensity was scored as follows: 0, no staining; 1, faint yellow or yellow; 2, tan. The extent of positive cells was classified as 0 (≤10%) or 1 (>10%). The intensity and extent scores were multiplied to evaluate expression in each case. A score of 0 and 1 was classified as low expression and a score of 2 was classified as high expression.
Western blot analysis
Total cell extracts were obtained, and the protein content was quantitatively analyzed using a bicinchoninic acid protein assay and separated using 12% sodium dodecyl sulfate polyacrylamide gel electrophoresis. The separated proteins were transferred to a polyvinylidene fluoride membrane (Millipore, Bedford, MA, USA). Samples were blocked in 5% bovine serum albumin for 2 h at room temperature and incubated with appropriate primary antibodies overnight at 4°C. The primary antibodies were as follows: 1) anti-ARHI (1:1,000; Santa Cruz Biotechnology Inc., Dallas, TX, USA), 2) anti-LC3 (1:1,000; Abcam, Cambridge, UK), 3) anti-GAPDH (1:5,000; Sigma-Aldrich Co., St Louis, MO, USA), 4) anti-bcl-2 (1:1,000; Santa Cruz Biotechnology), 5) anti-Mmp-2 (1:1,000; Santa Cruz Biotechnology), 6) anti-Mmp-9 (1:1,000; Santa Cruz Biotechnology), 7) anti-E-cadherin (1:1,000; Abcam), 8) anti-N-cadherin (1:1,000; Abcam). The membrane was washed in PBST and incubated with horseradish peroxidase-conjugated goat anti-rabbit IgG at room temperature for 1 h. The membrane was washed with PBST again, and the ECL kit was used for western blot detection. For whole images, ImageJ was used to estimate the band intensity. To normalize protein loading, monoclonal GAPDH antibody was used.
Cell culture and transient transfection
The human ESCC cell line ECA109 (purchased from ATCC, Manassas, VA, USA) was cultured in RPMI-1640 (GIBCO, Waltham, MA, USA; 1.5 g/L NaHCO3, 2.5 g/L glucose, 0.11 g/L sodium pyruvate), with 10% fetal calf serum, at 37°C and 5% CO2. PCMV-ARHI-AC-GFP and PCMV-AC-GFP were purchased from OriGene (Rockville, MD, USA). The ARHI plasmid PCMV-ARHI-AC-GFP was transfected into ECA109 cells; ARHI was overexpressed in vitro and verified by western blotting. The empty plasmid PCMV-AC-GFP (OriGene) was used as a negative control. ARHI-targeted small interfering RNA (siRNA) was purchased from GenePharma (Shanghai, China), the sequence of target was: CUGCUUGACAAGUGCAUAATT. Lipofectamine 2000 (Thermo Fisher Scientific, Waltham, MA, USA) was used for transfection according to the manufacturer’s instructions. After 48 h, the transfected cells were harvested and used for further experiments.
Cell proliferation assays
Cell proliferation was examined using the Cell Counting Kit-8 (CCK-8; Dojindo, Kumamoto, Japan). The ESCC cells were divided into an ARHI group, a control group, and an ECA109 group. Cells were plated in 96-well plates at a concentration of 3×10³ cells/well and incubated for 24 h. Each plate was supplemented with 90 μL of fresh complete RPMI-1640 medium. Then, 10 μL of CCK-8 was added to each well, and the plates were incubated for 3 h at room temperature. Absorbance was measured at wavelengths of 490 nm daily for 5 days.
Cell invasion assay
Infected ECA109 cells (3×10⁴) were transferred to the upper chambers of Transwell plates (Costar, Cambridge, MA, USA), and 200 μL of serum-free RPMI-1640 was added. The lower chamber was supplemented with 0.5 mL of RPMI-1640 with 10% fetal bovine serum as an inducer of cell migration. After incubation at 37°C for 48 h, cells in the upper chamber were removed using a sterile cotton tip. Invasive cells were fixed with 4% cold methanol for 15 min, rinsed with PBS, and stained with hematoxylin for 5 min. Cells were counted in five randomly selected areas for each well.
Wound-healing assay
ESCC cells were divided into an ARHI group, a control group, and an ECA109 group. Infected cells were suspended by trypsin digestion containing RPMI-1640 with 10% fetal bovine serum and incubated at 37°C for 24 h. When the cells reached 90% confluence, wounds were made using a 20 μL pipette tip and washed three times with PBS. After replacing the medium with serum-free media, wounds were observed and photographed every 12 h under a light microscope.
Apoptosis analysis using flow cytometry
For the apoptosis analysis, cells (1–500,000/L per well) were washed with PBS twice and single-cell suspensions were prepared by trypsin digestion. Cells were resuspended after adding 0.5 mL of Binding Buffer. Cells were stained with the Annexin V-Light 650/PI Apoptosis Detection Kit (Wanleibio, Shenyang, China) according to the manufacturer’s instructions, and cell death was measured using a flow cytometer (BD).
Statistical analysis
The data were analyzed using the SPSS 17.0 software package. The relationship between clinicopathological factors and the results of immunohistochemistry experiments was examined using χ2 tests. Differences in protein expression among groups were assessed using paired t-tests. Kaplan–Meier survival curves and log-rank tests were used to describe patient survival. The multivariate Cox hazard model was used to identify independent prognostic factors for survival. P<0.05 was considered statistically significant.
Ethics
This study was approved by the Research Ethics Committee of China Medical University. Written informed consent was obtained from all patients for this study.
Results
Expression of ARHI is decreased in ESCC tissues
ARHI immunoreactivity was predominantly located in the cytoplasm (Figure 1), appearing as brownish-yellow granules. ARHI was expressed at a significantly lower rate (22/81, 27.16%) in ESCC tissues than in matched normal esophageal epithelia tissues (69/81, 85.19%, P<0.01).
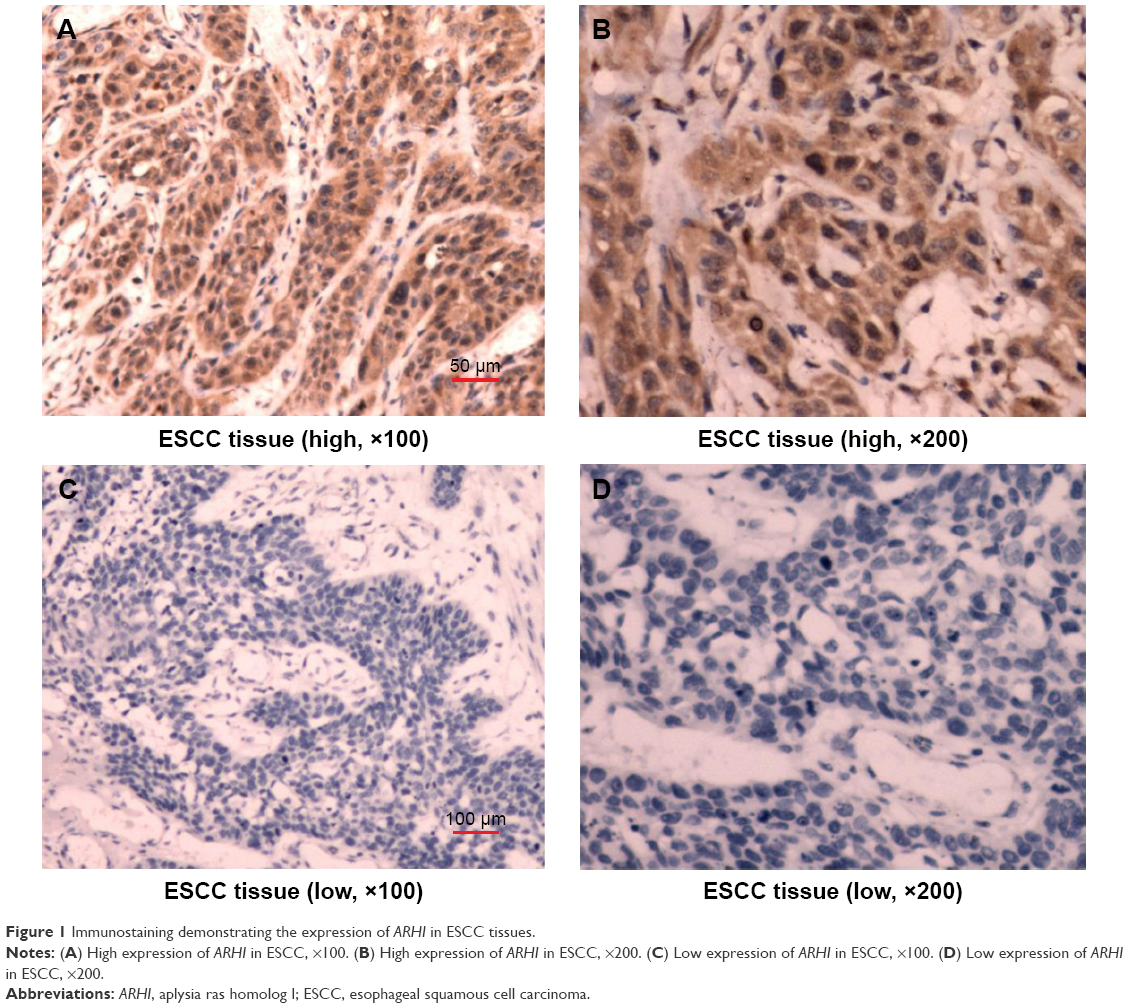 | Figure 1 Immunostaining demonstrating the expression of ARHI in ESCC tissues. |
Low expression of ARHI in ESCC tissues is correlated with lymph node metastasis
The ARHI expression rate was significantly lower (11.11%) in ESCC patients with lymphatic metastasis than in those without lymphatic metastasis (40%, P<0.05, Table 1). There was no significant correlation between ARHI expression and age, gender, TNM stage, T stage, M stage, or degree of differentiation in ESCC patients (P>0.05, Table 1).
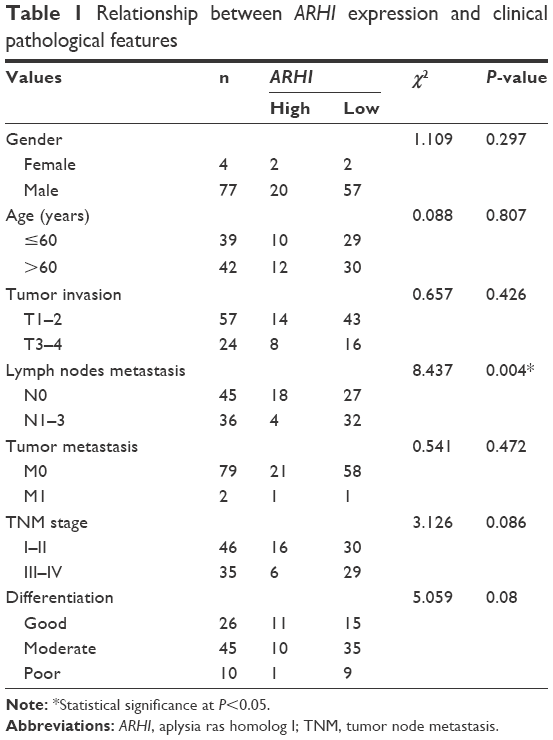 | Table 1 Relationship between ARHI expression and clinical pathological features |
Survival analysis
Patients with high ARHI expression had significantly higher 5-year survival rates than those with low levels of ARHI expression (log-rank test, P<0.01; Figure 2A). A univariate analysis demonstrated that N stage (P<0.001), TNM stage (P=0.001), and high ARHI expression (P=0.005) were significant prognostic factors (Table 2). A multivariate analysis using a forward stepwise Cox regression analysis showed that N stage (P<0.001) and high ARHI expression (P=0.029) were independent prognostic factors in ESCC patients (Table 2).
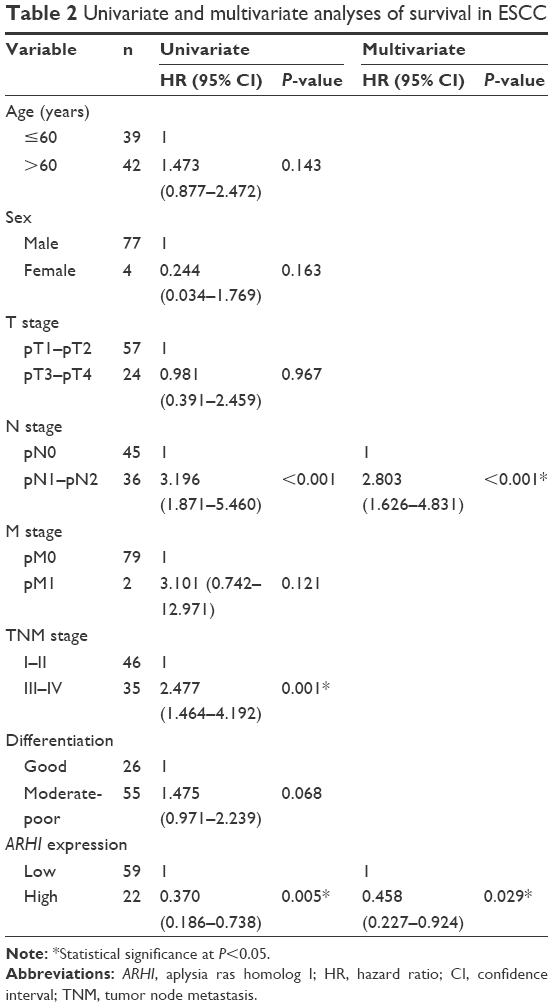 | Table 2 Univariate and multivariate analyses of survival in ESCC |
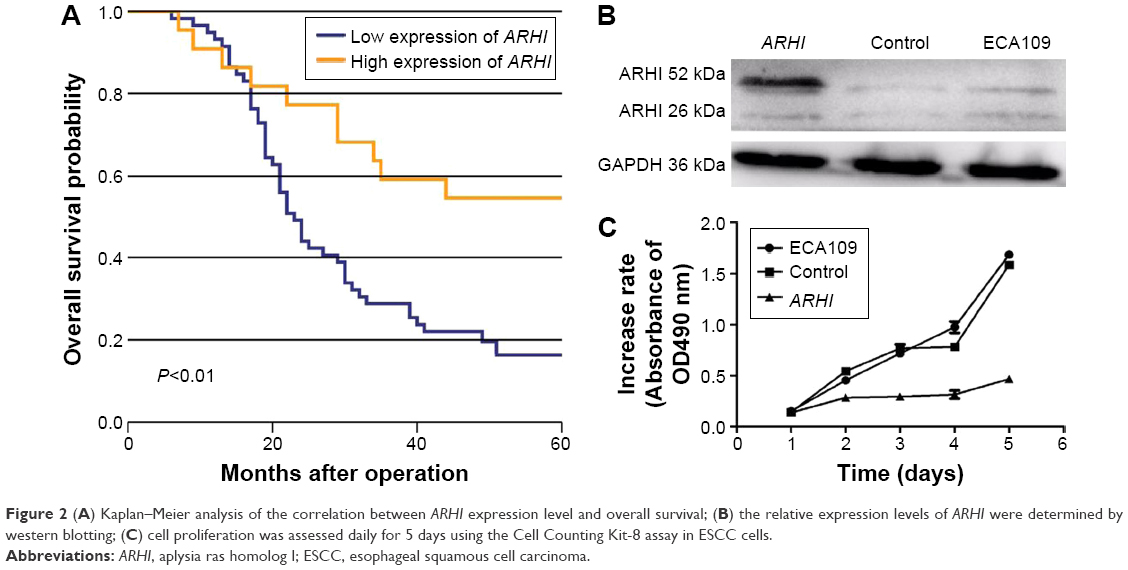 | Figure 2 (A) Kaplan–Meier analysis of the correlation between ARHI expression level and overall survival; (B) the relative expression levels of ARHI were determined by western blotting; (C) cell proliferation was assessed daily for 5 days using the Cell Counting Kit-8 assay in ESCC cells. |
Overexpression of ARHI inhibits the proliferation of ESCC cells
The ECA-109 cell line was transfected with the ARHI plasmid. After 48 h, the transfection efficiency was detected through western blot analysis. The ARHI cells had bands at 52 kDa, and the prompt endogenous ARHI protein expression quantity did not change, thus indicating that the ARHI gene was successfully transfected (Figure 2B). To evaluate the impact of ARHI overexpression on cell proliferation, a CCK8 assay was performed. The proliferation of ECA109 cells following PCMV-ARHI-AC-GFP transfection was significantly inhibited compared with the control group and the blank group. The rates of cell proliferation inhibition for the ECA109 group, control group, and ARHI group were 1.65±0.041, 1.613±0.083, and 0.466±0.001, respectively, indicating that ARHI upregulation significantly suppressed the proliferation of ECA109 cells (P<0.01, Figure 2C).
Overexpression of ARHI inhibits the invasion and migration ability of ESCC cells
Transwell invasion assays were performed to evaluate the effect of ARHI on the invasive ability of ESCC cells. Following ARHI overexpression for 48 h, the average number of invading cells was 257.8±12.13, significantly lower than that of the control group (415.4±20.48) (Figure 3A and B). Wound assays indicated that the migration ability was also lower for ECA109 cells infected with ARHI than for the control group (P<0.01, Figure 3C). We detected the expression of Mmp-2 and Mmp-9 using western blotting. Compared with the control group, the ARHI plasmid-transfected group showed significantly lower levels of Mmp-2 and Mmp-9, two proteins commonly correlated with tumor progression and metastasis (Figure 4A). These results indicate that ARHI inhibits the invasion and migration capacities of ESCC cells.
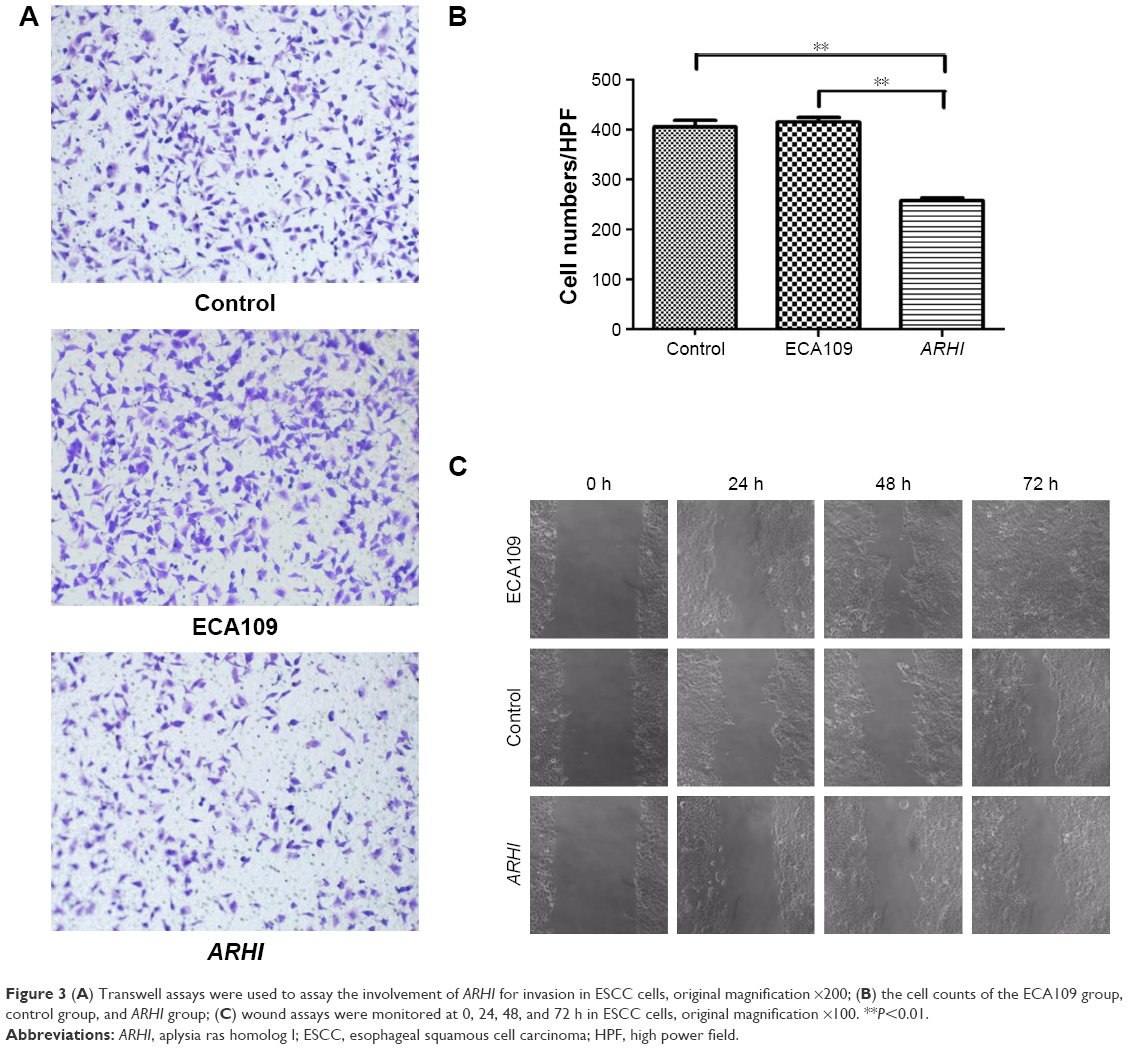 | Figure 3 (A) Transwell assays were used to assay the involvement of ARHI for invasion in ESCC cells, original magnification ×200; (B) the cell counts of the ECA109 group, control group, and ARHI group; (C) wound assays were monitored at 0, 24, 48, and 72 h in ESCC cells, original magnification ×100. **P<0.01. |
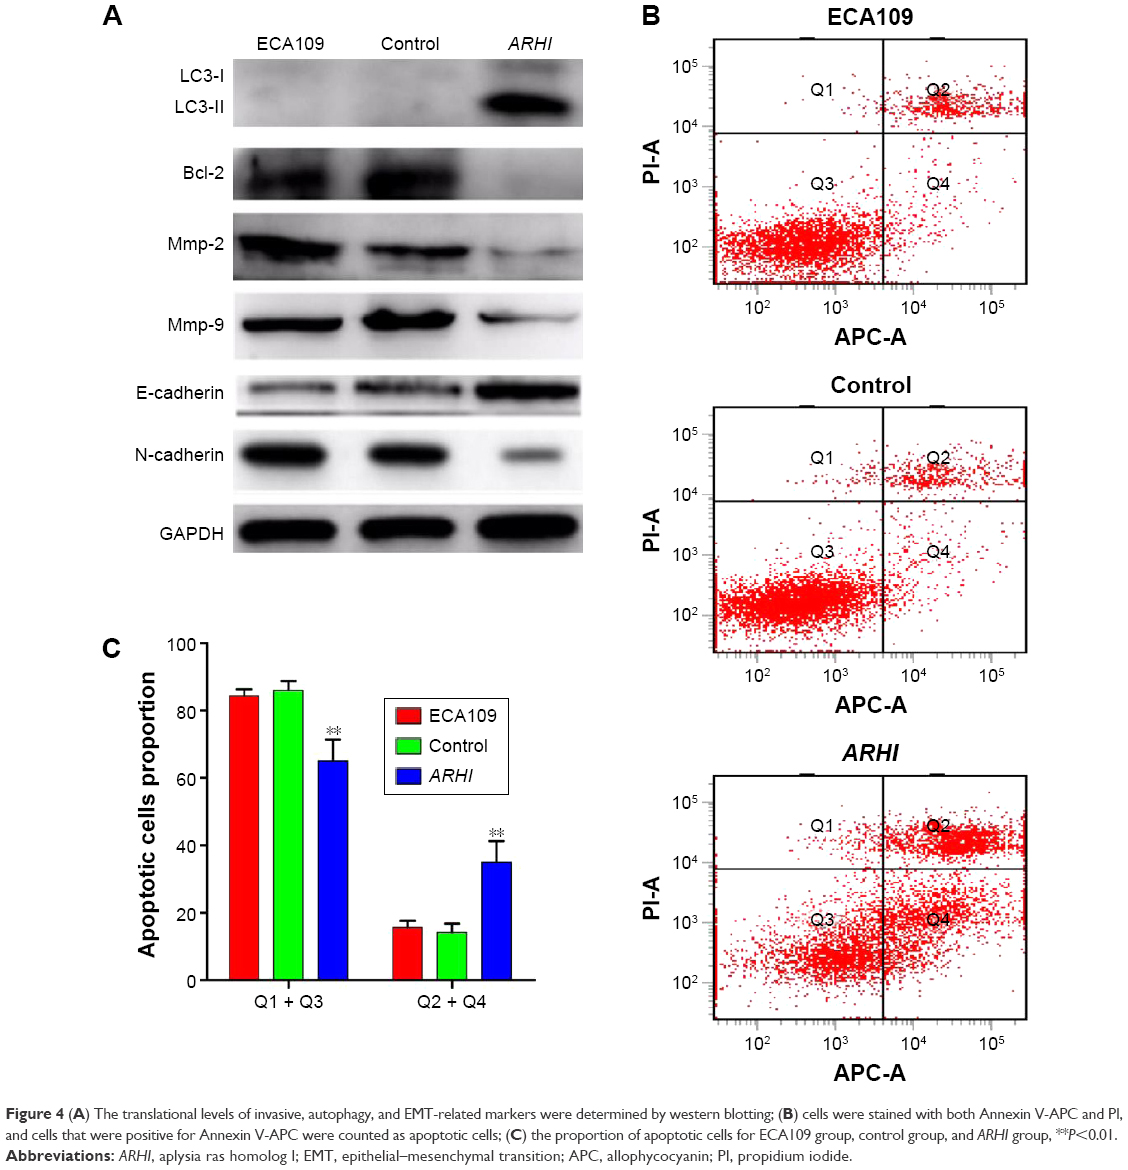 | Figure 4 (A) The translational levels of invasive, autophagy, and EMT-related markers were determined by western blotting; (B) cells were stained with both Annexin V-APC and PI, and cells that were positive for Annexin V-APC were counted as apoptotic cells; (C) the proportion of apoptotic cells for ECA109 group, control group, and ARHI group, **P<0.01. |
Inhibition of ARHI promotes the proliferation and invasion of ECA109 cells
In addition, siRNA was used to inhibit the level of ARHI in ECA109 cells. The results of cell proliferation assays and cell invasion assays showed that inhibition of ARHI can promote the proliferation and invasion of ECA109 cells (Figure S1). Thus, these results also confirmed the inhibitory effect of ARHI on ECA109 cell biological behavior.
Overexpression of ARHI in ECA109 cells may induce apoptosis
Annexin V and light staining were performed to evaluate whether ARHI could induce ECA109 cell apoptosis. The proportion of apoptotic cells (Q2+Q4) was significantly higher in the ARHI group than the control and ECA109 groups (P<0.01, Figure 4B and C). Furthermore, the expression of Bcl-2 was analyzed using western blotting. Compared with the control and ECA109 groups, the ARHI plasmid-transfected group showed lower levels of Bcl-2 expression (Figure 4A). In summary, ARHI induces apoptosis and inhibits cell cycle progression in ECA109 cell lines.
ARHI may be involved in cell autophagy and epithelial–mesenchymal transition (EMT) of ESCC cells
The expressions of LC3, E-cadherin, and N-cadherin were also detected through western blotting. There are two forms of LC3, LC3-I and LC3-II (an LC3-phospholipid conjugate). Many types of stressors upregulate LC3 expression and promote the binding of cytosolic LC3-I to phosphatidylethanolamine to form autophagosome-specific LC3-II. Therefore, LC3-II is considered a special marker of autophagy.20,21 Compared to the control and ECA109 groups, the ARHI plasmid-transfected group showed significantly higher levels of LC3-II and E-cadherin and lower levels of N-cadherin expression (Figure 4A). Thus, ARHI may induce autophagy and inhibit EMT of ESCC cells.
Discussion
The autophagy-related gene ARHI is a maternally imprinted tumor-suppressor gene that was discovered in 1999. It is the first reported tumor-suppressor gene in the Ras super family, sharing 54%–62% amino acid homology with Ras/Rap family members.6 It is absent or downregulated in many cancers including breast, ovarian, pancreatic, liver, lung, and many others and is involved in tumor development.7–13 These observations suggest an important role of ARHI in tumor development. However, to our knowledge, the role of ARHI in ESCC is not known.
ARHI inhibits growth, reproductive development, proliferation, and migration and is involved in apoptosis, and autophagy.11,22–25 ARHI may suppress pancreatic cancer by regulating the MAPK/ERK 1/2 pathway.26 Yu et al27 used in situ hybridization and immunohistochemical methods to examine ARHI expression in 64 cases of mammary ductal carcinoma and paired normal breast tissue samples and found that ARHI is absent or downregulated in breast cancer.
This study found that ARHI expression was absent or downregulated in ESCC tissue samples compared with normal tissues. Moreover, ARHI expression was associated with lymph node metastasis and poor prognosis. This finding suggests that ARHI is associated with ESCC progression and may act as a potential therapeutic target. Previous studies have revealed that low ARHI expression is associated with a shorter survival time for patients with pancreatic cancer.28 Similarly, in this study, a multivariate Cox regression analysis indicated that low expression of ARHI is associated with poor prognosis in ESCC patients and is an independent prognostic factor and a potential therapeutic target.
Metastasis and invasion ability are basic biological characteristics of tumor cells and present major challenges for clinical treatment of esophageal cancer. A previous study suggests that ARHI regulates proliferation, invasion, and migration of ovarian carcinoma cells through the STAT3 and FAK/Rho pathways.29 Accordingly, it was inferred that ARHI might also regulate these processes in ESCC cells.
Specifically, CCK8 assays, a Transwell invasion assay, wound assays, and flow cytometry were used to determine the influence of ARHI overexpression on proliferation, invasion, migration, and apoptosis in ECA109 cells. It was found that ARHI overexpression reduced the proliferation, invasion, and migration capacities of ECA109 cells. Previous studies have established that Mmp-2 and Mmp-9 are positively correlated with tumor progression, metastasis, and poor overall prognosis.30 Consistent with this, significantly lower levels of Mmp-2 and Mmp-9 expression were observed in the ARHI-transfected group than the control group. Proteins in the BCL-2 family control the mitochondrial pathway of apoptosis.31 The evasion of apoptosis is the main cause of therapeutic resistance.32 Bao et al33 found that ARHI mediates apoptosis through a caspase-independent calpain-dependent pathway. Based on Annexin V and light staining, it was found that apoptosis was significantly higher in the transfected group than the control group.
Bcl-2 was suggested to be an anti-apoptosis molecule that develops adverse effects on the modulation of cell death.34 It has been reported that in HeLa cells, PI3K/AKT lies upstream of the Bcl-2 and can regulate its expression.35 Li et al found that ARHI can trigger PI3K/AKT pathway to modulate the expression of Bcl-2, and overexpressed ARHI could reduce the phosphorylation of AKT and increase the levels of PI3K inhibitor LY294002 to suppress the expression of Bcl-2 in epithelial ovarian cancer cells.36 This study found that overexpression of ARHI could reduce the protein expression of Bcl-2 to induce apoptosis in ECA109 cells. Thus, it indicates that Bcl-2 may be one of the targets that lie downstream of ARHI pathways.
Abundant evidence supports the role of EMT in tumor progression, and E-cadherin and N-cadherin are important hallmarks of EMT.37 In the current study, the results of western blotting showed that overexpressed ARHI could increase the expression of E-cadherin and decrease the expression of N-cadherin, indicating that overexpression of ARHI may inhibit EMT in ECA109 cells. On the other hand, Wu et al reported that Bcl-2 can regulate EMT by calcium signals in cancers.38 Thus, ARHI may regulate the expression of cadherin and EMT by acting on Bcl-2. However, the exact mechanism between them remains unknown, and further studies are needed to confirm.
Abundant evidence supports the role of EMT in tumor progression. Lowered E-cadherin is a hallmark of EMT.34 In the current study, E-cadherin expression was significantly higher in the ARHI plasmid-transfected group than the control group. Hence, ARHI may inhibit EMT in ESCC cells.
In summary, the results suggest that ARHI is absent or downregulated in ESCC tissues and is associated with lymph node metastasis and prognosis. High ARHI expression is a good independent prognostic factor in ESCC patients. In the ECA-109 ESCC cell line, the overexpression of ARHI can suppress proliferative and invasive capacities and induce apoptosis and autophagy. This study provides the first evidence that ARHI may inhibit EMT in ESCC cells.
Acknowledgment
We thank Dr XiaoY Liu (Department of Plastic Surgery, The First Clinical College China Medical University, Shenyang, Liaoning, China) for providing technological assistance.
Disclosure
The authors report no conflicts of interest in this work.
References
Thallinger CM, Kiesewetter B, Raderer M, Hejna M. Pre- and postoperative treatment modalities for esophageal squamous cell carcinoma. Anticancer Res. 2012;11:4609–4627. | ||
Crosby T, Evans M, Gillies RS, Maynard ND. The management of a patient with an operable carcinoma of the oesophagus. Ann R Coll Surg Engl. 2009;91:366–370. | ||
Kaz AM, Grady WM. Epigenetic biomarkers in esophageal cancer. Cancer Lett. 2014;342:193–199. | ||
Yokobori T, Kuwano H. Molecular biological review of esophageal cancer. Kyobu geka Japanese J Thorac Surg. 2013;66:73–84. | ||
Zhao Q, Shen JH, Shen ZY, et al. Phosphorylation of fascin decreases the risk of poor survival in patients with esophageal squamous cell carcinoma. J Histochem Cytochem. 2010;58:979–988. | ||
Badgwell DB, Lu Z, Le K, et al. The tumor-suppressor gene ARHI (DIRAS3) suppresses ovarian cancer cell migration through inhibition of the Stat3 and FAK/Rho signaling pathways. Oncogene. 2012;31:68–79. | ||
Peng H, Xu F, Pershad R, et al. ARHI is the center of allelic deletion on chromosome 1p31 in ovarian and breast cancers. Int J Cancer. 2000;86:690–694. | ||
Hu YQ, Si LJ, Ye ZS, Lin ZH, Zhou JP. Inhibitory effect of ARHI on pancreatic cancer cells and NF-κB activity. Mol Med Rep. 2013;7:1180–1184. | ||
Huang J, Lin Y, Li L, et al. ARHI, as a novel suppressor of cell growth and downregulated in human hepatocellular carcinoma, could contribute to hepatocarcinogenesis. Mol Carcinog. 2009;48:130–140. | ||
Wu X, Liang L, Dong L, Yu Z, Fu X. Effect of ARHI on lung cancer cell proliferation, apoptosis and invasion in vitro. Mol Biol Rep. 2013;40:2671–2678. | ||
Lu X, Qian J, Yu Y, Yang H, Li J. Expression of the tumor suppressor ARHI inhibits the growth of pancreatic cancer cells by inducing G1 cell cycle arrest. Oncol Rep. 2009;22:635–640. | ||
Yu Y, Luo R, Lu Z, et al. Biochemistry and biology of ARHI (DIRAS3), an imprinted tumor suppressor gene whose expression is lost in ovarian and breast cancers. Methods Enzymol. 2006;407:455–468. | ||
Wu X, Liang L, Dong L. Effect of ARHI on lung cancer cell proliferation, apoptosis and invasion in vitro. Mol Biol Rep. 2013;40:2671–2678. | ||
Sivridis E, Koukourakis MI, Mendrinos SE, et al. Beclin-1 and LC3A expression in cutaneous malignant melanomas: a biphasic survival pattern for beclin-1. Melanoma Res. 2011;21:188–195. | ||
Karpathiou G, Sivridis E, Koukourakis MI. Light-chain 3A autophagic activity and prognostic significance in non-small cell lung carcinomas. Chest. 2011;140:127–134. | ||
Eskelinen EL, Saftig P. Autophagy: a lysosomal degradation pathway with a central role in health and disease. Biochim Biophys Acta. 2009;1793:664–673. | ||
Bialik S, Kimchi A. Autophagy and tumor suppression: recent advances in understanding the link between autophagic cell death pathways and tumor development. Adv Exp Med Biol. 2008;615:177–200. | ||
Cheong H, Klionsky DJ. Biochemical methods to monitor autophagy-related processes in yeast. Methods Enzymol. 2008;451:1–26. | ||
Rosen DG, Wang L, Jain AN, et al. Expression of the tumor suppressor gene ARHI in epithelial ovarian cancer is associated with increased expression of p21WAF1/CIP1 and prolonged progression-free survival. Clin Cancer Res. 2004;10:6559–6566. | ||
Kabeya Y, Mizushima N, Ueno T. Lc3, a mammalian homologue of yeast apg8p, is localized in autophagosome membranes after processing. EMBO J. 2000;19:5720–5728. | ||
Mizushima N, Yamamoto A, Matsui M. In vivo analysis of autophagy in response to nutrient starvation using transgenic mice expressing a fluorescent autophagosome marker. Mol Biol Cell. 2004;15:1101–1111. | ||
Papademetriou K, Ardavanis A, Kountourakis P. Neoadjuvant therapy for locally advanced breast cancer: focus on chemotherapy and biological targeted treatments’ armamentarium. J Thorac Dis. 2010;2:160–170. | ||
Janssen EA, Øvestad IT, Skaland I. LOH at 1p31 (ARHI) and proliferation in lymph node-negative breast cancer. Cell Oncol. 2009;31:335–343. | ||
Yang H, Lu X, Qian J, et al. Imprinted tumor suppressor gene ARHI induces apoptosis correlated with changes in DNA methylation in pancreatic cancer cells. Mol Med Report. 2010;3:581–587. | ||
Zou CF, Jia L, Jin H, et al. Re-expression of ARHI (DIRAS3) induces autophagy in breast cancer cells and enhances the inhibitory effect of paclitaxel. BMC Cancer. 2011;1:22. | ||
Hu Y, Yang H, Lu XQ, Xu F, Li J, Qian J. ARHI suppresses pancreatic cancer by regulating MAPK/ERK 1/2 pathway. Pancreas. 2015;44:342–343. | ||
Yu Y, Fujii S, Yuan J, et al. Epigenetic regulation of ARHI in breast and ovarian cancer cells. Ann N Y Acad Sci. 2013;983:268–277. | ||
Dalai I, Missiaglia E, Barbi S, et al. Low expression of ARHI is associated with shorter progression-free survival in pancreatic endocrine tumors. Neoplasia. 2007;9:181–183. | ||
Pei XH, Yang Z, Liu HX, Qiao SS. Aplasia Ras homologue member I overexpression induces apoptosis through inhibition of survival pathways in human hepatocellular carcinoma cells in culture and in xenograft. Cell Biol Int. 2011;35:1019–1024. | ||
Jacob A, Prekeris R. The regulation of MMP targeting to invadopodia during cancer metastasis. Front Cell Dev Biol. 2015;3:4. | ||
Besbes S, Mirshahi M, Pocard M, Billard C. New dimension in therapeutic targeting of BCL-2 family proteins. Oncotarget. 2015;6:12862–12871. | ||
Kelly GL, Strasser A. The essential role of evasion from cell death in cancer. Adv Cancer Res. 2011;111:39–96. | ||
Bao JJ, Le XF, Wang RY, et al. Reexpression of the tumor suppressor gene ARHI induces apoptosis in ovarian and breast cancer cells through a caspase-independent calpain-dependent pathway. Cancer Res. 2002;62:7264–7272. | ||
Brunelle JK, Letai A. Control of mitochondrial apoptosis by the Bcl-2 family. J Cell Sci. 2009;122:437–441. | ||
Griffiths GS, Grundl M, Leychenko A, et al. Bit-1 mediates integrin-dependent cell survival through activation of the NFkappaB pathway. J Biol Chem. 2011;286:14713–14723. | ||
Li J, Cui G, Sun L, et al. ARHI overexpression induces epithelial ovarian cancer cell apoptosis and excessive autophagy. Int J Gynecol Cancer. 2014;24:437–443. | ||
Huber MA, Kraut N, Beug H. Molecular requirements for epithelial-mesenchymal transition during tumor progression. Curr Opin Cell Biol. 2005;17:548–558. | ||
Wu Y, Tang L. Bcl-2 family proteins regulate apoptosis and epithelial to mesenchymal transition by calcium signals. Curr Pharm Des. 2016;22:4700–4704. |
Supplementary material
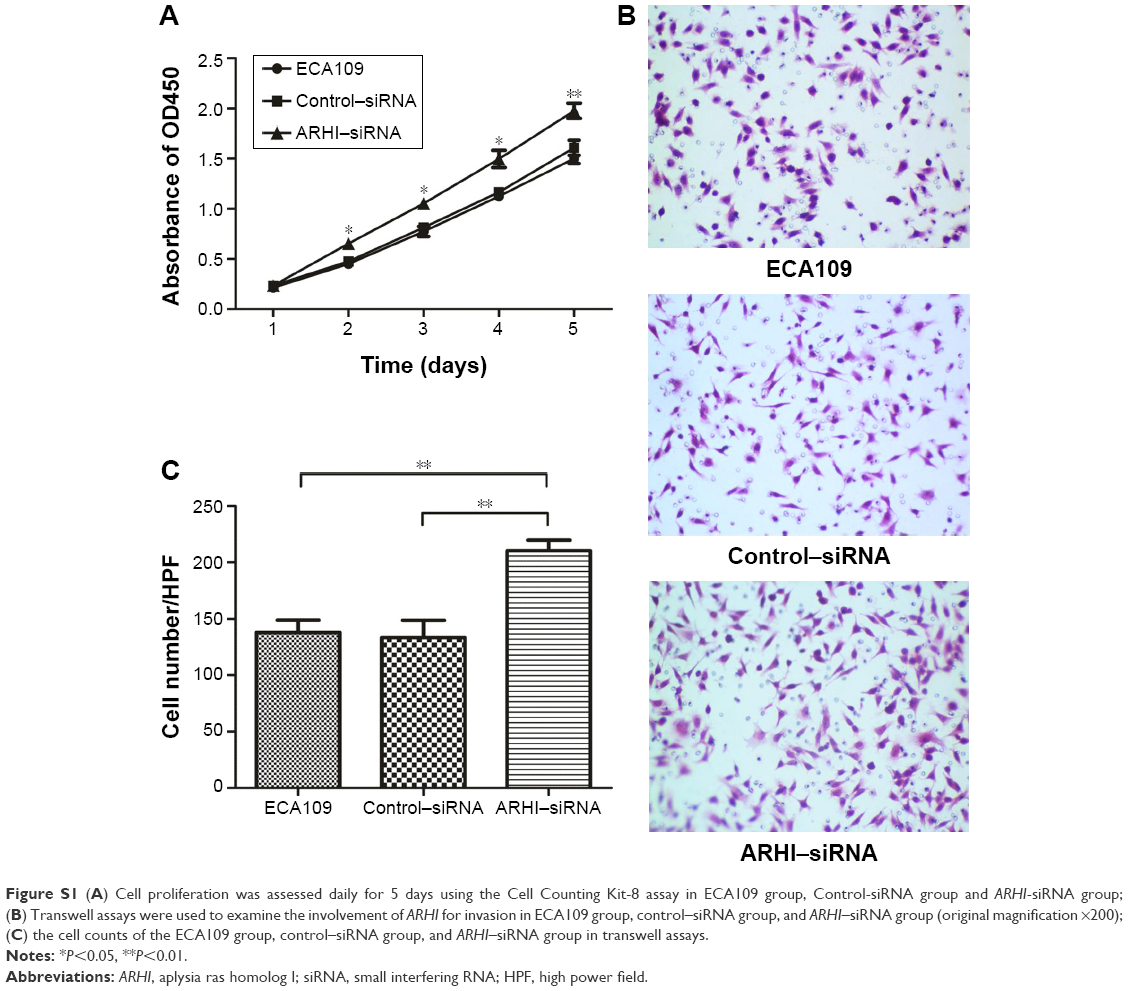 | Figure S1 (A) Cell proliferation was assessed daily for 5 days using the Cell Counting Kit-8 assay in ECA109 group, Control-siRNA group and ARHI-siRNA group; (B) Transwell assays were used to examine the involvement of ARHI for invasion in ECA109 group, control–siRNA group, and ARHI–siRNA group (original magnification ×200); (C) the cell counts of the ECA109 group, control–siRNA group, and ARHI–siRNA group in transwell assays. |
 © 2017 The Author(s). This work is published and licensed by Dove Medical Press Limited. The full terms of this license are available at https://www.dovepress.com/terms.php and incorporate the Creative Commons Attribution - Non Commercial (unported, v3.0) License.
By accessing the work you hereby accept the Terms. Non-commercial uses of the work are permitted without any further permission from Dove Medical Press Limited, provided the work is properly attributed. For permission for commercial use of this work, please see paragraphs 4.2 and 5 of our Terms.
© 2017 The Author(s). This work is published and licensed by Dove Medical Press Limited. The full terms of this license are available at https://www.dovepress.com/terms.php and incorporate the Creative Commons Attribution - Non Commercial (unported, v3.0) License.
By accessing the work you hereby accept the Terms. Non-commercial uses of the work are permitted without any further permission from Dove Medical Press Limited, provided the work is properly attributed. For permission for commercial use of this work, please see paragraphs 4.2 and 5 of our Terms.