")
Back to Journals » OncoTargets and Therapy » Volume 9
The evaluative value of Sema3C and MFN2 co-expression detected by immunohistochemistry for prognosis in hepatocellular carcinoma patients after hepatectomy
Authors feng X, Zhu K, Liu J , Chen J, tang J, Liang Y, Jin R, Liang X, Cai X
Received 14 October 2015
Accepted for publication 10 January 2016
Published 30 May 2016 Volume 2016:9 Pages 3213—3221
DOI https://doi.org/10.2147/OTT.S98322
Checked for plagiarism Yes
Review by Single anonymous peer review
Peer reviewer comments 2
Editor who approved publication: Dr William C. Cho
Xu Feng,1,* Kelei Zhu,1,2,* Jinghua Liu,1 Jiang Chen,1 Jiacheng Tang,3 Yuelong Liang,1 Renan Jin,1 Xiao Liang,1 Xiujun Cai1,3
1Department of General Surgery, Sir Run Run Shaw Hospital, Zhejiang University, Hangzhou, 2Department of General Surgery, Yinzhou People’s Hospital, Ningbo, 3Key Lab of Surgery of Zhejiang Province, Sir Run Run Shaw Hospital, Zhejiang University, Hangzhou, Zhejiang, People’s Republic of China
*These authors contributed equally to this work
Background: The ability to evaluate the prognosis of hepatocellular carcinoma (HCC) following hepatectomy using biological markers is of great importance.
Materials and methods: In this study, we collected samples from 54 patients with HCC after hepatectomy. Immunohistochemistry was used to detect the expression of Sema3C and MFN2 in the HCC samples.
Results: Immunohistochemistry results showed that Sema3C and MFN2 co-expression was significantly associated with tumor size. In addition, a significant association between high Sema3C and low MFN2 levels and shorter overall survival was noted, when Sema3C and MFN2 co-expression was analyzed.
Conclusion: The results suggest that the correlative expression level of Sema3C and MFN2 has a strong value in the prognosis of patients with HCC following hepatectomy.
Keywords: Sema3C, MFN2, hepatocellular carcinoma (HCC), prognosis, survival analysis
Introduction
Hepatocellular carcinoma (HCC) is the fifth most common cancer worldwide. It is currently the third leading cause of cancer mortality, contributing to half a million deaths each year. Although there have been many advances in HCC therapeutic strategies over the past few years, the overall prognosis has not improved for cases that present with advanced or terminal stage disease at diagnosis. Therefore, besides novel markers, new and useful prognostic methods, in particular those specific for liver cancer, would clearly be of great benefit. Consequently, the identification of biological markers that can contribute to the evaluative prognosis of HCC after hepatectomy is necessary.
Class 3 secreted semaphorins (Sema3 proteins) are a group of seven widely expressed chemotropic factors, from Sema3A to Sema3G, with repulsive and attractive activities.1 All Sema3 proteins analyzed to date (ie, Sema3A, Sema3B, Sema3D, Sema3E, Sema3F, and Sema3G) inhibit cell migration and seem to have antitumor properties.2 For example, Sema3A has been shown to inhibit the migration of breast cancer cells3 and to block tumor growth in vivo.4 In contrast to other class 3 semaphorins, Sema3C has been poorly characterized. It has been shown to have high level of expression in various types of tumor cells; a correlation between its expression and tumor development and progression has been reported.5,6 It can promote tumor migration and is highly expressed in metastatic tumor cells, such as prostate cancer cells.7,8 Concurrent Sema3C-positive and Sema3A-, 3B-, and 3E-negative staining is associated with adverse prognoses in low- and intermediate-risk patients with prostate cancer after radical prostatectomy.9
Mitofusin-2 (MFN2), an integral outer mitochondrial membrane protein consisting of 757 residues in humans,10 is associated with mitochondrial fusion processes. MFN2 plays an important role in the development of many tumor types. It has been reported that MFN2 expression was significantly higher in lung adenocarcinoma tissues than in adjacent normal tissues.11 However, another report showed that MFN2 immunostaining was very weak in HCC tissues, and patients with HCC with lower MFN2 expression had a poorer prognosis.12 MFN2 has been shown to induce apoptosis in HCC cells, but the exact molecular mechanism remains unclear.
The exact roles of Sema3C and MFN2 in HCC remain undetermined. In this study, we analyzed the expression of Sema3C and MFN2 in 54 cases of HCC and evaluated the prognoses of those patients.
Subjects and methods
Study subjects
HCC tissue microarrays were obtained from Shanghai Outdo Biotech Co., Ltd. (Shanghai, People’s Republic of China). Letters of consent were obtained from all patients, and the experimental protocols were approved by the ethics committee of Sir Run Run Shaw Hospital of Zhejiang University. Irregular/segment/hemihepatectomy was performed for patients by the size and location of the tumor, with surgical margins above 1–2 cm. Patient charts were reviewed to obtain relevant clinical data, including age, sex, tumor size, alpha-fetoprotein, cirrhosis, hepatitis B virus surface antigen (HBsAg), vascular invasion, TNM (tumor, nodes, metastasis) stage (American Joint Committee on Cancer), tumor differentiation, time of recurrence, and death or time of last follow-up. Patient survival was calculated in months from the day of surgery until death.
Immunohistochemistry
Immunohistochemistry (IHC) was performed as described in the following section, using primary antibodies against MFN2 (1:200; Abcam, Cambridge, UK) and Sema3C (1:200; Abcam). Nonimmune mouse immunoglobulin G was used as the primary antibody negative control.
Tissue sections were cut at a thickness of 3 μm and mounted on slides, deparaffinized in xylene, and rehydrated in a series of graded alcohol dilutions. Heat epitope retrieval was performed for 20 minutes in target retrieval solution at pH 7.5. Sections were incubated with the appropriate primary antibody at 4°C overnight. Then, the sections were washed and incubated with secondary antibodies. Following another washing step, the slides were incubated with horseradish peroxidase at room temperature for 30 minutes and were visualized for 5–10 minutes using the chromogen 3,3′-diaminobenzidine substrate kit.
Sections were scored semiquantitatively as follows: 0% immunoreactive cells, negative/0; <5% immunoreactive cells, weakly positive/+; 5%–50% immunoreactive cells, intermediate positive/++; >50% immunoreactive cells, highly positive/+++. For statistical purposes, negative and weakly positive cases were considered to have low expression and intermediate and highly positive cases were considered to have high expression.
RNA extraction, reverse transcription, and real-time quantitative polymerase chain reaction
Total RNA from liver tissues of patients who underwent surgery was extracted using an Ultrapure RNA Extract Kit (Cwbiotech, Beijing, People’s Republic of China). Reverse transcription was performed on 1 μg of total RNA using iScript cDNA Kit (Bio-Rad Laboratories Inc., Hercules, CA, USA) with random hexamers. Real-time quantitative polymerase chain reaction (qPCR) was achieved with ABS-7500 real-time PCR system (Thermo Fisher Scientific, Waltham, MA, USA) and SYBR EvaGreen mixed with low ROX (Bio-Rad Laboratories Inc.) for product detection.
Complementary DNA was amplified with AATCTGAGGCGACTGGTGA as forward primer and CTCCTCCTGTTCGACAGTCA as reverse primer for MFN2 detection and TTTGCGTGTTGGTTGGAGTAT as forward primer and TCCTGTAGTCTAAAGGATGGTGG as reverse primer for Sema3C detection. To normalize gene expression, β-actin was used as a reference gene and was amplified with CATGTACGTTGCTATCCAGGC as forward primer and CTCCTTAATGTCACGCACGAT as reverse primer. The cycling program was set up as follows: 5 minutes at 95°C and 40 cycles at 95°C for 15 seconds, 60°C for 30 seconds.
Western blot analysis
For detection of the target proteins in the sample cells, MFN2 (Abcam) and Sema3C (Abcam) antibodies were used to determine the correlation expression of these two proteins in HepG2 cells.
HepG2 cells were grown in Dulbecco’s Modified Eagle’s Medium (Thermo Fisher Scientific) supplemented with 10% fetal bovine serum (Thermo Fisher Scientific) at 37°C, 5% CO2.
In order to detect the relationship of these proteins, siRNA was used for interference of the expression of MFN2 in HepG2 cells. Furthermore, vector overexpression of Sema3C was used to increase the level of Sema3C in HepG2 cells.
Western blot was performed as described in Esselens et al.7
Statistical analysis
The data were analyzed using SPSS Version 17.0. The chi-square test or Fisher’s exact test and linear regression analysis were used to evaluate any potential association between Sema3C/MFN2 expression and the clinicopathologic parameters. Overall survival rates were calculated using the Kaplan–Meier method, and the statistical difference between survival curves was determined by the log-rank test. A P-value <0.05 was considered statistically significant.
Results
Immunohistochemical analysis of Sema3 and MFN2 correlated with clinical data
Based on the IHC results, all the 54 patients with HCC were divided into high-expression and low-expression groups. As shown in Table 1 and Figure 1A, high expression of Sema3C was observed in carcinoma samples (n=34) compared with adjacent nonneoplastic tissues (P=0.000). Taking into account the clinicopathologic features of age, sex, tumor size, alpha-fetoprotein, HBsAg, vascular invasion, TNM stage (American Joint Committee on Cancer), and tumor differentiation, high expression of Sema3C was significantly correlated with tumor size (P=0.02) and portal vein embolization and metastasis (P=0.014).
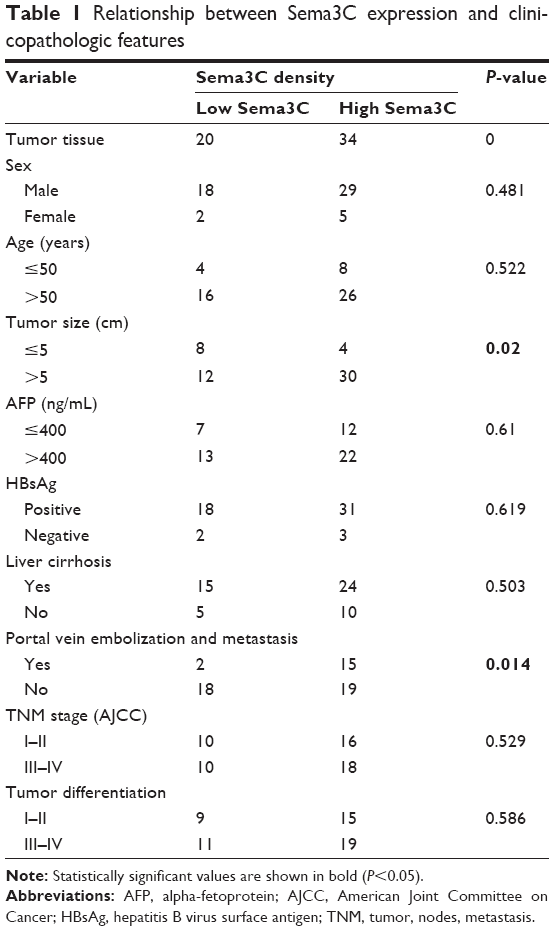 | Table 1 Relationship between Sema3C expression and clinicopathologic features |
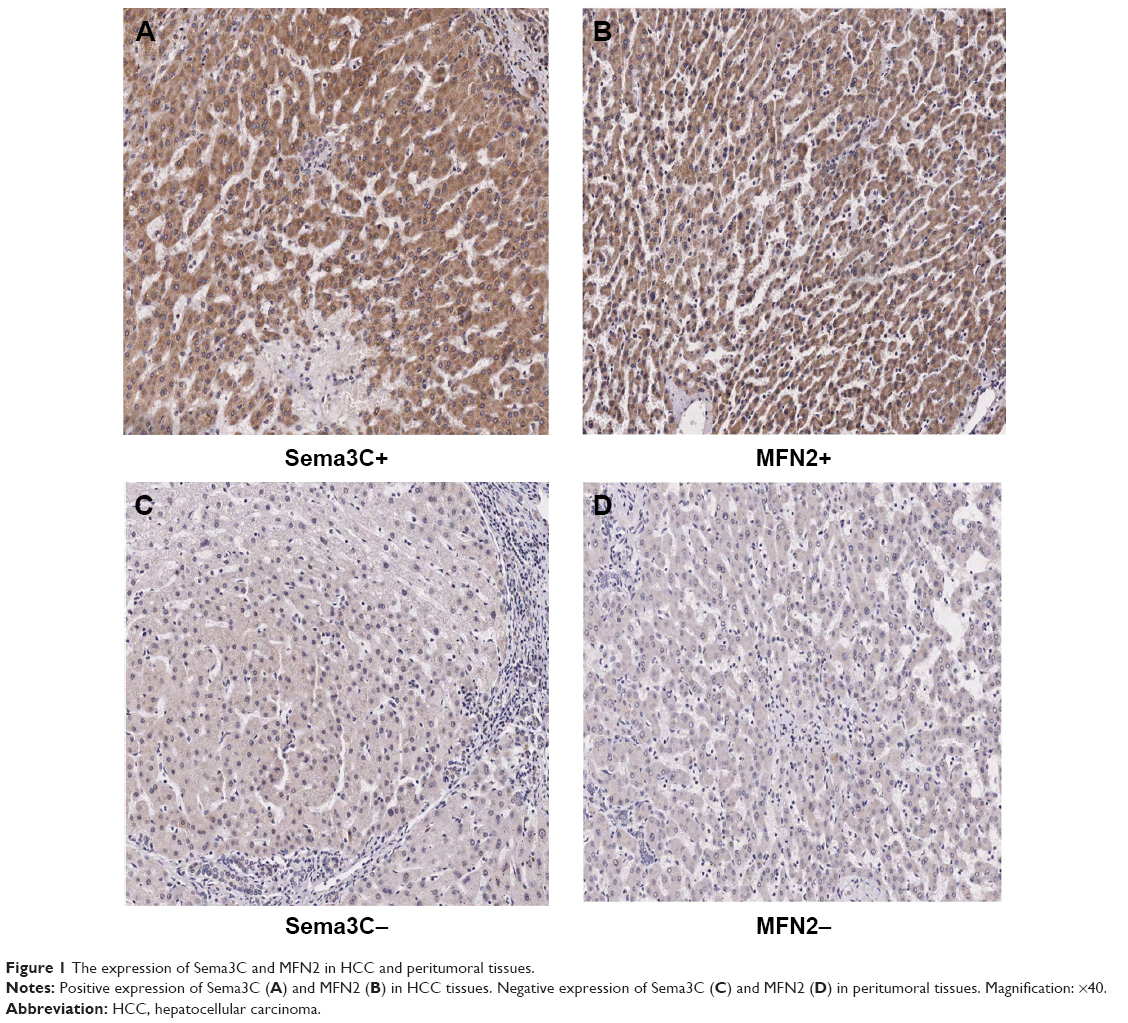 | Figure 1 The expression of Sema3C and MFN2 in HCC and peritumoral tissues. |
In contrast, as shown in Table 2 and Figure 1B, immunostaining for MFN2 revealed low expression in carcinoma samples (n=31) compared with adjacent nonneoplastic tissues (P=0.016). Low MFN2 expression was also significantly correlated with tumor size (P=0.012).
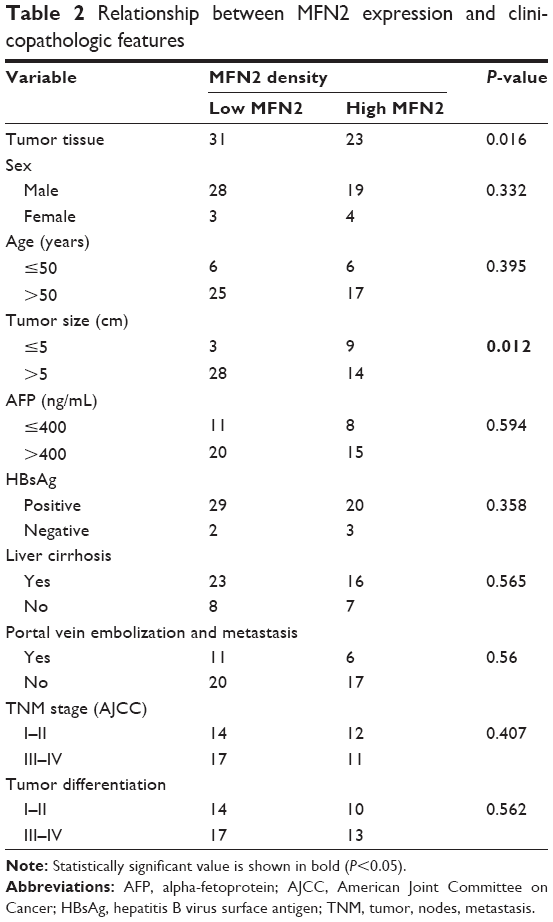 | Table 2 Relationship between MFN2 expression and clinicopathologic features |
Expression of Sema3C and MFN2 correlated with prognosis
Following IHC analysis, we then carried out survival analysis. In univariate analysis, Sema3C and MFN2 immunostaining was strongly associated with survival.
Compared with patients with low expression, patients with high Sema3C expression had worse overall survival (Table 3 and Figures 2 and 3A). There was no difference in the 1-year overall survival rates between the two groups (low and high Sema3C expression). However, the 3-year and 5-year overall survival rates were much worse in the Sema3C-high group than in the Sema3C-low group (P=0.029).
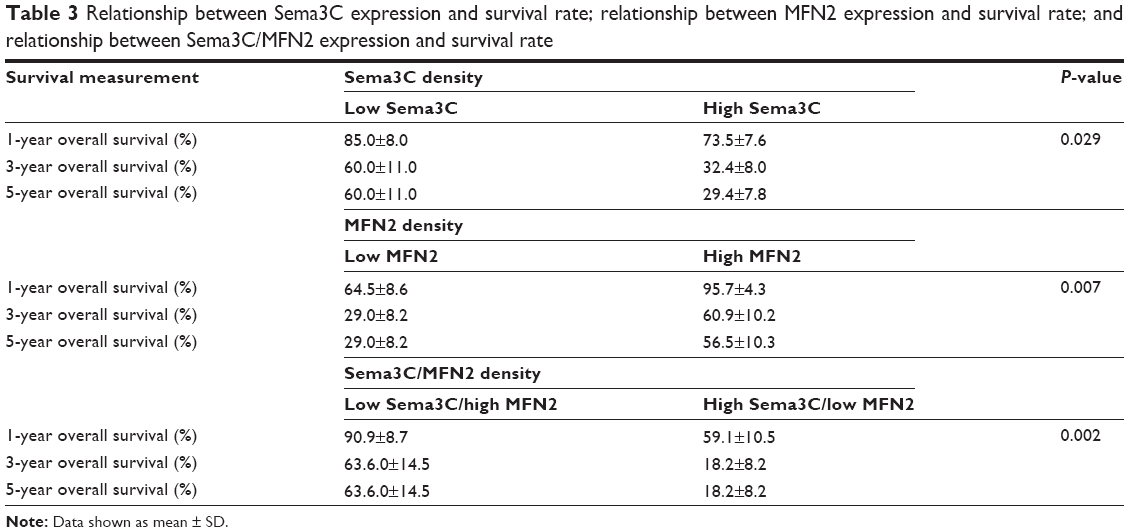 | Table 3 Relationship between Sema3C expression and survival rate; relationship between MFN2 expression and survival rate; and relationship between Sema3C/MFN2 expression and survival rate |
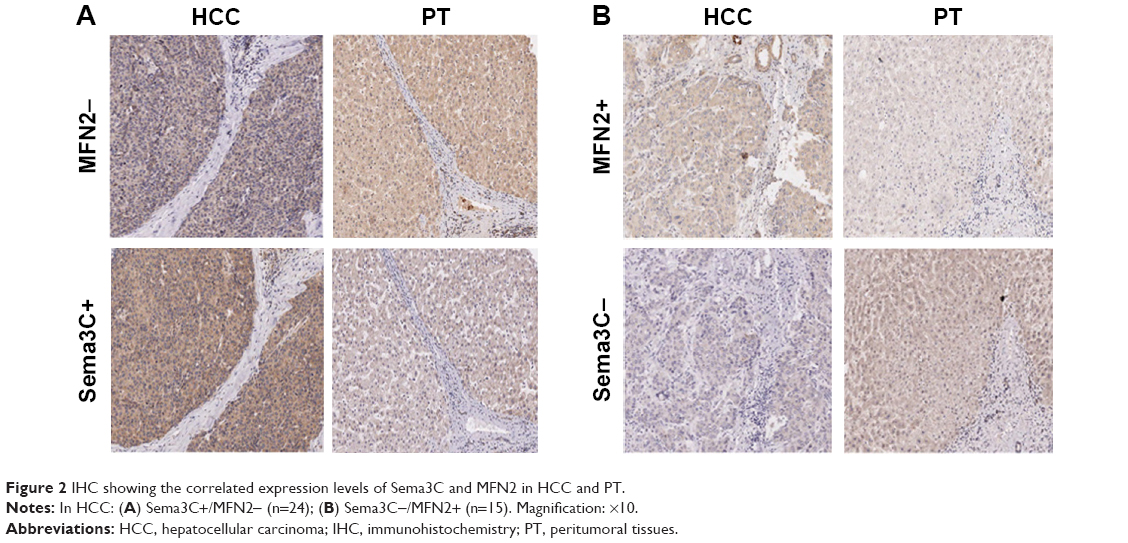 | Figure 2 IHC showing the correlated expression levels of Sema3C and MFN2 in HCC and PT. |
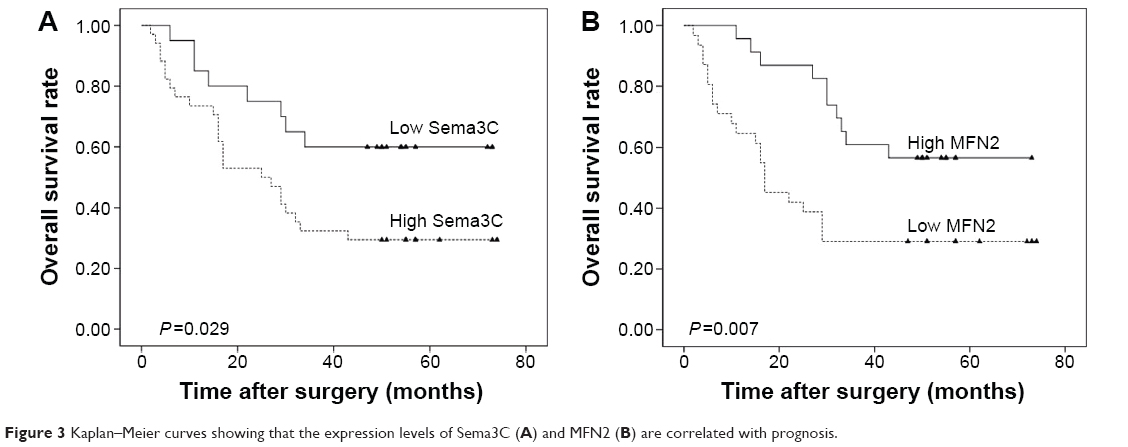 | Figure 3 Kaplan–Meier curves showing that the expression levels of Sema3C (A) and MFN2 (B) are correlated with prognosis. |
The 1-year, 3-year, and 5-year overall survival rates for patients with low and high expression of MFN2 were 64.5%, 29.0%, 29.0% and 95.7%, 60.9%, 56.5%, respectively (Table 3). Consistently, the 1-year, 3-year, and 5-year overall survival rates were much worse for MFN2-low than MFN2-high patients (P=0.007; Table 3 and Figure 3B).
Therefore, we conclude that high expression of Sema3C and low expression of MFN2, as single biological markers, can be used for the assessment of poor prognosis in HCC. A Kaplan–Meier curve showing the association between Sema3C and MFN2 staining and overall survival is shown in Figures 3 and 4.
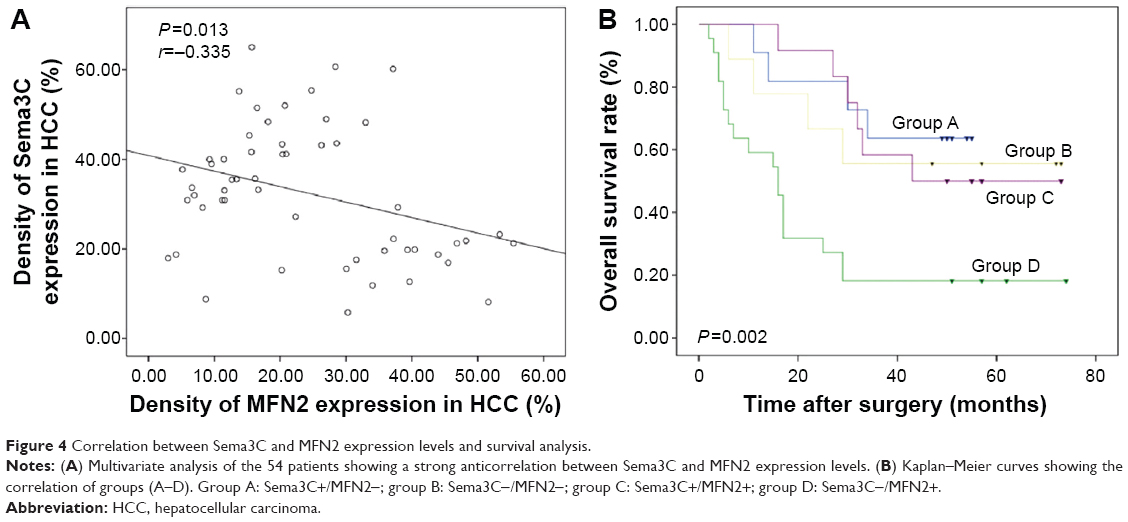 | Figure 4 Correlation between Sema3C and MFN2 expression levels and survival analysis. |
Combination analysis of Sema3C and MFN2 levels has a better prognostic value in HCC
Multivariate analysis of the 54 patients showed a strong anticorrelation between Sema3C and MFN2 expression levels (Figure 4A; r=−0.335, P=0.013). In most of the tumor tissues, Sema3C expression showed an inverse correlation with MFN2. Therefore, we divided the patients into four groups. Group A: Sema3C+/MFN2- (n=11); group B: Sema3C-/MFN2- (n=9); group C: Sema3C+/MFN2+ (n=12); group D: Sema3C−/MFN2+ (n=22).
The 1-year and 5-year overall survival rates in group A (90.9% and 63.6%, respectively) were much better than those in group D (59.1% and 18.2%, respectively). The combined analysis of these two parameters increased the prognostic value (P=0.002; Table 3 and Figure 4B), compared with that of Sema3C or MFN2 alone.
Combination expression of Sema3C and MFN2 levels in vitro/in vivo
In our experiment, we detected the correlated expression of Sema3C and MFN2 mRNA in liver tissues by qPCR method; we found that MFN2 expression was inhibited in HCC tissues compared with normal liver tissues (P=0.027; Figure S1B) and Sema3C showed a reverse result in HCC/normal liver tissues (P=0.017; Figure S1C).
Furthermore, we analyzed the combination expression of these proteins, and they showed an obvious reverse relationship in mRNA level of liver tissues (P=0.012; Figure S1D). Our experimental result proved the analyzed results of The Cancer Genome Atlas (TCGA)/oncomine database (P=0.09; Figure S1A).
In vitro, we cultured HepG2 cells and interfered the level of MFN2 expression with siRNA. As shown in Western blotting analysis, the interfered HepG2 cells showed a decreased level of MFN2 expression but an increased level of Sema3C level (Figure S1E). This proved that decreasing the MFN2 expression can promote the Sema3C level. Furthermore, we overexpressed Sema3C with vector and found that the level of MFN2 was decreased as shown in Western blotting analysis (Figure S1F). It showed the same result as that of the interference experiment.
Discussion
HCC is one of the most common malignancies worldwide,13 and it is responsible for half a million deaths each year. Although there have been many advances in the therapeutic strategies for HCC over the past years, the overall prognosis for patients with advanced or terminal stage disease at diagnosis has not improved as expected. Therefore, the identification of a series of biological markers that could evaluate the prognosis of HCC would be extremely useful when considering treatment and follow-up options after hepatectomy. A single marker alone may also be useful, but a set of differentially expressed markers would provide more information when making treatment and follow-up decisions.
Sema3 proteins appeared to be endowed with antitumor properties;2 this has been reported in patients with breast cancer,3 prostate cancer,7,8 lung adenocarcinoma, and ovarian cancer.14
Early reports on Sema3C, an axonal guidance molecule, demonstrated its association with multidrug resistance in cancer cells; it was found to be readily induced by diverse chemotherapeutic agents.15,16 In addition, its overexpression was linked to shorter patient survival. Similar to these previous studies, our results showed that patients with Sema3C-positive HCC have a poor prognosis. Concurrent Sema3C-positive and Sema3A-, Sema3B-, or Sema3E-negative staining is associated with an adverse prognosis in patients with low- and intermediate-risk prostate cancer after radical prostatectomy.9
Initial reports on MFN2 described its marked downregulation in the vascular smooth muscle cells of spontaneously hypertensive rats. In our study, MFN2 expression was low in HCC liver tissues compared with nearby normal tissues, which is consistent with these reports. MFN2 in HCC has been well studied. Upregulation of MFN2 promotes apoptosis and inhibits proliferation of HCC cells through the activation of the mitochondrial apoptotic pathway. Moreover, in breast cancer cells, low expression of MFN2 protein resulted in increased cell spreading and lamellipodia formation, more mitochondrial distribution to lamellipodia regions, and enhancement of the metastatic ability of the cells.17 The reported association of low MFN2 expression and increased metastatic ability indicates the poor prognosis of this tumor type. In our report, we showed that low expression of MFN2 was linked to poor prognosis, which is consistent with the previous studies.
Concurrent Sema3C-positive and MFN2-negative staining was associated with an adverse prognosis in HCC patients; the disparity in the prognosis between Sema3C+/MFN2- and Sema3C-/MFN2+ patients was much more apparent than the disparity observed when evaluating Sema3C or MFN2 alone. The combined analysis of Sema3C and MFN2 expression has a great evaluative value for prognosis in patients with HCC after hepatectomy.
Moreover, Sema3C is correlated with tumor size and portal vein embolization and metastasis, and MFN2 is correlated with tumor size. Further, microvascular invasion is a risk factor for poor survival. Portal vein embolization metastasis is a typical microvascular invasion. This may show that the expression of these genes has a relationship with oncogenesis and metastasis. The combination expression of Sema3C-/MFN2+ patient is much more apparent than the disparity observed when evaluating Sema3C or MFN2 alone. Based on the evaluation of expression of Sema3C/MFN2 and its relation with clinicopathologic features, we could make a supposition about the function of Sema3C/MFN2 in HCC, but this supposition must be confirmed by further experiments.
There is no report showing a direct/indirect relationship of Sema3C and MFN2. Initially, we searched the correlated expression of MFN2 and Sema3C in TCGA database, but the analyzed results showed a weak correlation, with P-value 0.162. Then, we analyzed the mRNA level of HCC and peritumoral tissues in 23 pairs of clinical samples, and our result showed a strong correlation with P-value 0.012 (Figure S1). In vitro, we detected the reversed expression of MFN2 and Sema3C in HCC cells; the result showed that they have revised combination expression in protein level.
It has been reported that semaphorin signaling can regulate local mitochondrial function by positioning mitochondria in a particular axonal location.18 Since we found that the expression of Sema3C is related to that of MFN2, we hypothesize that Sema3C-regulated mitochondrial distribution could be, directly or indirectly, related to the low expression of MFN2. Future studies investigating the effect of Sema3C on mitochondrial function will be required to determine this.
Conclusion
Our study showed that the expression of Sema3C in HCC is associated with prognosis. Moreover, we demonstrated that the concurrent expression of Sema3C and MFN2 has large evaluative value for prognosis in patients with HCC after hepatectomy.
Acknowledgments
This article was supported by: 1) the Fundamental Funds for the Central Universities (2014FZA7005); 2) International Scientific and Technological Cooperation Projects (2012DFA30410); 3) Key Scientific and Technological Innovation Team Project of Zhejiang Province (2009R50040); and 4) the National Science-Technology Support Plan Projects (2012BAI14B06).
Disclosure
The authors report no conflicts of interest in this work.
References
Raper JA. Semaphorins and their receptors in vertebrates and invertebrates. Curr Opin Neurobiol. 2000;10(1):88–94. | ||
Capparuccia L, Tamagnone L. Semaphorin signaling in cancer cells and in cells of the tumor microenvironment – two sides of a coin. J Cell Sci. 2009;122(pt 11):1723–1736. | ||
Bachelder RE, Lipscomb EA, Lin X, et al. Competing autocrine pathways involving alternative neuropilin-1 ligands regulate chemotaxis of carcinoma cells. Cancer Res. 2003;63(17):5230–5233. | ||
Kigel B, Varshavsky A, Kessler O, Neufeld G. Successful inhibition of tumor development by specific class-3 semaphorins is associated with expression of appropriate semaphorin receptors by tumor cells. PLoS One. 2008;3(9):e3287. | ||
Vachkov IH, Huang X, Yamada Y, et al. Inhibition of axonal outgrowth in the tumor environment: involvement of class 3 semaphorins. Cancer Sci. 2007;98(8):1192–1197. | ||
Neufeld G, Kessler O. The semaphorins: versatile regulators of tumour progression and tumour angiogenesis. Nat Rev Cancer. 2008;8(8):632–645. | ||
Esselens C, Malapeira J, Colomé N, et al. The cleavage of semaphorin 3C induced by ADAMTS1 promotes cell migration. J Biol Chem. 2010;285(4):2463–2473. | ||
Herman JG, Meadows GG. Increased class 3 semaphorin expression modulates the invasive and adhesive properties of prostate cancer cells. Int J Oncol. 2007;30(5):1231–1238. | ||
Li K, Chen MK, Li LY, et al. The predictive value of semaphorins 3 expression in biopsies for biochemical recurrence of patients with low- and intermediate-risk prostate cancer. Neoplasma. 2013;60(6):683–689. | ||
Santel A, Fuller MT. Control of mitochondrial morphology by a human mitofusin. J Cell Sci. 2001;114(pt 5):867–874. | ||
Lou Y, Li R, Liu J, et al. Mitofusin-2 over-expresses and leads to dysregulation of cell cycle and cell invasion in lung adenocarcinoma. Med Oncol. 2015;32(4):132. | ||
Wang W, Xie Q, Zhou X, et al. Mitofusin-2 triggers mitochondria Ca2+ influx from the endoplasmic reticulum to induce apoptosis in hepatocellular carcinoma cells. Cancer Lett. 2015;358(1):47–58. | ||
Jemal A, Bray F, Center MM, Ferlay J, Ward E, Forman D. Global cancer statistics. CA Cancer J Clin. 2011;61(2):69–90. | ||
Galani E, Sgouros J, Petropoulou C, et al. Correlation of MDR-1, nm23-H1 and H Sema E gene expression with histopathological findings and clinical outcome in ovarian and breast cancer patients. Anticancer Res. 2002;22(4):2275–2280. | ||
Yamada T, Endo R, Gotoh M, Hirohashi S. Identification of semaphorin E as a non-MDR drug resistance gene of human cancers. Proc Natl Acad Sci U S A. 1997;94(26):14713–14718. | ||
Konno R. Gene expression profiling of human ovarian epithelial tumors by oligonucleotide microarray [Article in Japanese]. Hum Cell. 2001;14(4):261–266. | ||
Zhao J, Zhang J, Yu M, et al. Mitochondrial dynamics regulates migration and invasion of breast cancer cells. Oncogene. 2013;32(40):4814–4824. | ||
Brand MD, Nicholls DG. Assessing mitochondrial dysfunction in cells. Biochem J. 2011;435(2):297–312. |
Supplementary material
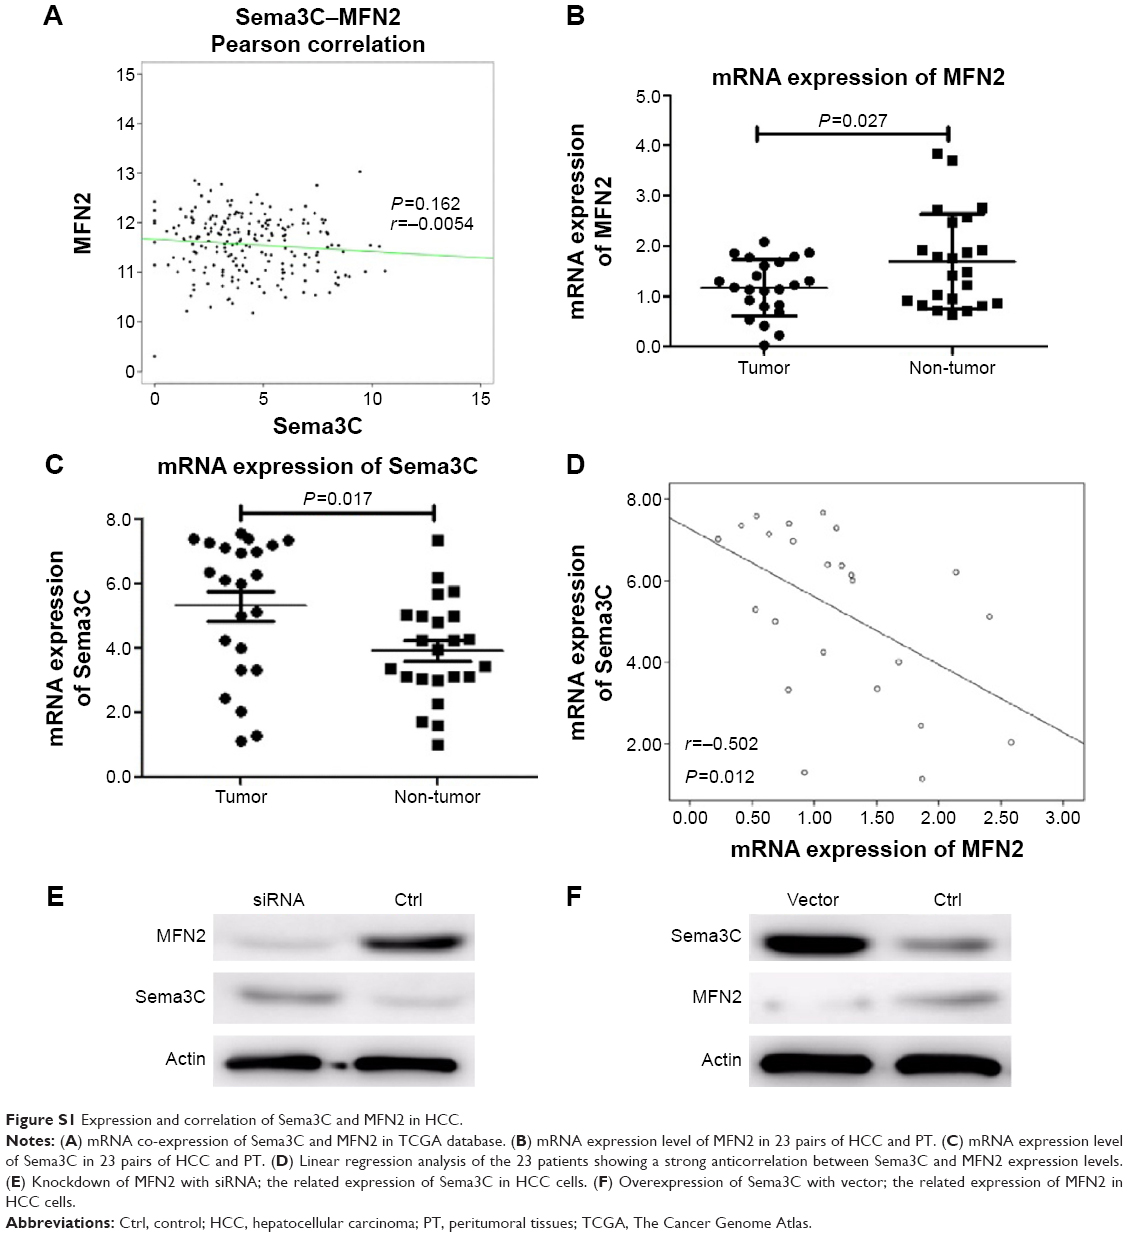 | Figure S1 Expression and correlation of Sema3C and MFN2 in HCC. |
 © 2016 The Author(s). This work is published and licensed by Dove Medical Press Limited. The full terms of this license are available at https://www.dovepress.com/terms.php and incorporate the Creative Commons Attribution - Non Commercial (unported, v3.0) License.
By accessing the work you hereby accept the Terms. Non-commercial uses of the work are permitted without any further permission from Dove Medical Press Limited, provided the work is properly attributed. For permission for commercial use of this work, please see paragraphs 4.2 and 5 of our Terms.
© 2016 The Author(s). This work is published and licensed by Dove Medical Press Limited. The full terms of this license are available at https://www.dovepress.com/terms.php and incorporate the Creative Commons Attribution - Non Commercial (unported, v3.0) License.
By accessing the work you hereby accept the Terms. Non-commercial uses of the work are permitted without any further permission from Dove Medical Press Limited, provided the work is properly attributed. For permission for commercial use of this work, please see paragraphs 4.2 and 5 of our Terms.