")
Back to Journals » ClinicoEconomics and Outcomes Research » Volume 8
The epidemiology and burden of Alzheimer’s disease in Taiwan utilizing data from the National Health Insurance Research Database
Authors Hung Y, Kadziola Z, Brnabic A, Yeh J, Fuh J, Hwang J, Montgomery W
Received 29 July 2015
Accepted for publication 16 June 2016
Published 2 August 2016 Volume 2016:8 Pages 387—395
DOI https://doi.org/10.2147/CEOR.S93323
Checked for plagiarism Yes
Review by Single anonymous peer review
Peer reviewer comments 3
Editor who approved publication: Professor Giorgio Colombo
Yen-Ni Hung,1 Zbigniew Kadziola,2 Alan JM Brnabic,3 Ju-Fen Yeh,4 Jong-Ling Fuh,5,6 Jen-Ping Hwang,7,8 William Montgomery,9
1School of Gerontology Health Management and Master Program in Long-Term Care, College of Nursing, Taipei Medical University, Taipei, Taiwan, Republic of China; 2Real World Analytics, Eli Lilly GmbH, Vienna, Austria; 3Real World Analytics, Eli Lilly Australia Pty Ltd, West Ryde, NSW, Australia; 4Department of Medicine, Eli Lilly and Company, Taiwan, Republic of China; 5Department of Neurology, Neurological Institute, Taipei Veterans General Hospital, 6Faculty of Medicine, School of Medicine, National Yang Ming University, 7Department of Psychiatry, Taipei Veterans General Hospital, 8Division of Psychiatry, School of Medicine, National Yang-Ming University, Taipei, Taiwan, Republic of China; 9Eli Lilly Australia Pty Ltd, West Ryde, NSW, Australia
Purpose: The objectives of this study were to estimate the incidence, cumulative incidence, and economic burden of Alzheimer’s disease (AD) in Taiwan, using data from the National Health Insurance Research Database (NHIRD).
Materials and methods: This was a retrospective, longitudinal, observational study using data from the Longitudinal Health Insurance Database of the NHIRD. Patients were included in this study if they were 50 years of age or older and their records included a primary or secondary diagnosis of AD. New patients who met inclusion criteria were followed up longitudinally from 2005 to 2010. Costs were calculated for the first year following the diagnosis of AD.
Results: Overall, a higher percentage of women than men were diagnosed with AD (54% vs 46%, respectively). The first AD diagnosis occurred most frequently in the age of 75–84 years. The person-year incidence rate increased from 5.63/1,000 persons (95% CI, 5.32–5.94) in 2005 to 8.17/1,000 persons (95% CI, 7.78–8.57) in 2010. The cumulative incidence rate was 33.54/1,000 persons (95% CI, 32.76–34.33) in 2005–2010. The total mean inflated annual costs per patient in new Taiwan dollars (NT$) in the first year of diagnosis ranged from NT$205,413 (2009) to NT$227,110 (2005), with hospitalization representing the largest component.
Conclusion: AD represents a substantial burden in Taiwan, and based on the observed increase in incidence rate over time, it is likely that this burden will continue to increase. The findings reported here are consistent with previous research. The NHIRD contains extensive real-world information that can be used to conduct research, allowing us to expand our understanding of the incidence, prevalence, and burden of disease in Taiwan.
Keywords: Alzheimer’s disease, incidence, medical costs, resource utilization
Introduction
Dementia is a clinical syndrome that is defined as a cluster of symptoms including memory difficulties, language and other cognitive function disturbances, behavior changes, and impairment of daily living activities.1 The World Health Organization estimates that there are 35.6 million people living with dementia worldwide, with these numbers expected to double by 2030 and triple by 2050.2
Alzheimer’s disease (AD) is a chronic and progressive neurodegenerative disorder, which accounts for up to 75% of all dementia cases.1 The onset of AD occurs predominantly in the elderly individuals, with >95% of individuals who develop AD being the age of >65 years.3 The risk of dementia due to AD continues to increase with age, affecting an estimated 5% of individuals 65 years of age or older and 30% of individuals 85 years of age or older.4
The worldwide prevalence of AD was estimated to be 26.6 million in 2006.5 By 2050, an estimated 107 million individuals worldwide are expected to have AD.5
A systematic literature review of data across Europe and the US from 2002 to 2012 revealed prevalence estimates ranging between 3% and 7%.6 Country-specific estimates included France (3.0% among ≥60 years of age), Italy (3.0% among ≥65 years of age to 6.7% among ≥75–97 years of age), the UK (4.9%), Spain (6.4% among ≥75 years of age to 6.7% among ≥70 years of age), and the US (4.9%–6.8% among ≥70 years of age). Although other research has estimated the prevalence of AD to be much higher (12%) in the US,7 in the Takizawa et al’s review, the incidence of AD varied greatly between countries, ranging from 0.04/1,000 person-years in the UK (45–65 years) to 16.8/1,000 person-years in the US (≥65 years). Studies that examined age consistently found that prevalence and incidence of AD increased with age.6
In East Asia, the prevalence of AD in persons 65 years of age and older appears to be similar to that found in Europe and the US, with slightly higher rates in the People’s Republic of China and Taiwan than that in Japan. The prevalence of AD has been estimated to be 5% in the People’s Republic of China,8 2% in Japan,9 and 4% in Taiwan.10–12
AD represents a significant financial burden, with an estimated 43% of patients requiring a high level of care.5 The worldwide total cost of dementia was estimated at US$604 billion in 2010.13 The indirect costs associated with informal care and social care of patients with AD account for a significant portion to the total cost, whereas the direct medical costs are generally much lower in comparison.13 Caregivers of patients with AD have been shown to have higher rates of some illnesses, with high levels of anxiety and depression observed in >50% of caregivers.14 This also represents an additional burden that is unlikely to be captured when assessing the overall burden of AD.
A literature review summarized the medical costs per person associated with AD in the US and Europe.6 To allow comparisons between countries, the costs were converted into 2013 international dollars (int$) using purchasing power parity conversion factors. Countries in the review included France, Germany, the Netherlands, Spain, the UK, and the US. The total direct medical cost estimates for mild AD ranged from 5,476 int$ per year per patient in France to 27,380 int$ per year per patient in Spain. For moderate-to-severe AD, total direct medical cost estimates ranged from 5,713 int$ per year per patient in France to 34,118 int$ per year per patient in Germany. Total direct medical costs increased as the severity of AD increased across all included countries.6
A previous study by Chan et al15 examined the direct medical costs of AD in Taiwan from 2000 to 2002 for patients with an International Classification of Diseases, ninth revision, Clinical Modification (ICD-9-CM) code of 331.0 (AD) as a primary or secondary diagnosis using data from the National Health Insurance Research Database (NHIRD). In this study, the incidence rate of AD was 8.5/1,000 person-years for those aged ≥65 years. Average per patient, inpatient, outpatient, and total direct medical cost estimates increased in each of the 3 years. Outpatient cost estimates in new Taiwan dollars (NT$) increased from NT$36,298 in 2000 to NT$71,048 in 2002. Inpatient cost estimates increased from NT$20,502 in 2000 to NT$96,091 in 2002. Finally, total direct cost estimates increased from NT$56,801 in 2000 to NT$167,139 in 2002. In 2002, medication costs accounted for >33% of the total costs.
In 1995, Taiwan initiated a single-payer national health insurance program managed by the Bureau of National Health Insurance (BNHI).16 As of 2007, 98% of Taiwan’s population was enrolled in this program. The NHIRD contains de-identified registration files and original health care use claims data for reimbursement purposes. Access to this database is made available to academic scientists in Taiwan for research purposes. Many hundreds of studies (http://www.pubfacts.com/search/NHIRD) have been published using the NHIRD demonstrating the value of this dataset for health care research. This current research project was conducted to further our understanding of the burden of AD in Taiwan. The objectives of this study were to estimate the incidence and cumulative incidence and direct costs of AD in Taiwan, using data from the NHIRD.
Materials and methods
Study design
In 1995, Taiwan initiated a single-payer national health insurance program managed by the BNHI.16 As of 2007, 98% of Taiwan’s population was enrolled in this program. The NHIRD contains de-identified registration files and original health care use claims data that are primarily used for reimbursement purposes. A number of sub-datasets have been created within the NHIRD, including the Longitudinal Health Insurance Database (LHID2005). The LHID2005 contains complete original medical and pharmacy claims data from a random sample of 1 million beneficiaries enrolled in the 2005 Registry for Beneficiaries (identification) of the entire NHIRD population. The random sample of 1 million patients used in this analysis has previously been shown to be representative of the entire population contained within the NHIRD.17
This was a retrospective, longitudinal, observational study using data from the LHID2005 of the NHIRD. Key data elements extracted included information on patient demographics, diagnoses, health care service use, and costs. The application to use the NHIRD in this study was reviewed and approved in accordance with the regulations of the National Health Insurance Administration and National Health Research Institutes of Taiwan. Written informed consent was obtained for this study
Demographics
Demographic information was obtained from the Registry for Beneficiaries and included information on sex, date of birth, and low-income status (yes/no).
Diagnoses
Diagnosis codes, using the ICD-9-CM, that consist of a principal and up to four secondary diagnoses for inpatient care and two secondary diagnoses for outpatient care were used.
Health care service use
This service use includes codes for all inpatient and outpatient treatment procedures, examination procedures (computerized tomography [CT], magnetic resonance imaging [MRI], positron emission tomography [PET], etc), and medications (both western and traditional Chinese medicines).
Costs
The costs include all inpatient costs per admission and all ambulatory costs per visit and include the total expenditure for each outpatient visit or admission.
For the examination of incidence, cumulative incidence, and cost during the first year, the years 2000–2004 were used as a washout period to ensure that patients did not have AD. New patients who met the inclusion criteria were followed longitudinally from 2005 to 2010. Cumulative incidence from 2005 to 2010 was estimated to provide a low-end estimate of prevalence. Costs were calculated for the first year following the diagnosis of AD. The first date that a patient received a diagnosis for AD was used as the index date for each patient.
Inclusion criteria
Patients were included if they were 50 years of age or older at the beginning of 2005 and their records included a diagnostic code for a primary or secondary diagnosis of AD (ICD-9-CM codes 331.0, 290.0, 290.1X, 290.2X, and 290.3) and no history of a diagnosis of AD between 2000 and 2004. Patients were required to have at least two outpatient visits or at least one hospitalization with one of the above diagnostic codes.
Data analyses
Demographic information and comorbidities (identified via ICD-9-CM codes) were extracted, and the Charlson comorbidity index (CCI)18 was calculated for each patient. Comorbidities of interest included congestive heart failure, peripheral vascular disease, cerebrovascular disease, major depressive disorder, chronic pulmonary disease, rheumatologic disease, peptic ulcer disease, mild liver disease, moderate or severe liver disease, diabetes (mild-to-moderate), diabetes with chronic complications, hemiplegia or paraplegia, renal disease, malignancy (including lymphoma and leukemia), metastatic solid tumor, and AIDS.
Health care service utilization information was extracted for all patients with a primary or secondary diagnosis of AD, based on the use of medications (including both western and traditional Chinese medicines), diagnostic procedures, physician and dentist clinic visits, the number of outpatient clinic visits, and the number and duration of inpatient visits. Actual costs (NT$) for each resource/service were extracted from the NHIRD and adjusted to 2009 costs using the consumer price index data from Taiwan for the years 2005–2009. The cost of medications from community pharmacies and all services provided outside of the hospital were included in the outpatient costs. For patients with a survival of <1 year, health care resource utilization data were adjusted based on time observed in the cohort. Information was also summarized for all prescription medications reimbursed by the National Health Insurance Scheme in Taiwan, including medications used for the treatment of AD, dementia-specific treatments (donepezil, rivastigmine, galantamine, memantine, ergoloid mesylates, and ginko), and medicines used to manage the common behavioral and psychological symptoms associated with AD (antipsychotics, antidepressants, antianxiety agents, and hypnotics).
Incidence estimates were calculated based on the calendar year, using a closed cohort that included patients who were ≥50 years of age and were not diagnosed with AD prior to 2005. Cumulative incidence was calculated across the full 2005–2010 follow-up period. Although incidence was calculated based on calendar year for health care utilization, the index date for each patient was the date of his/her first diagnosis. For example, for a patient who was newly diagnosed in December 2005, only the costs attributable to that proportion of 2005 were included in the cost estimates for that year.
CIs were calculated as follows. For cumulative incidence, the 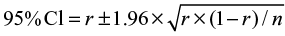 , where r is the cumulative incidence rate stated as a decimal fraction, and n is the appropriate denominator (ie, population at risk)19 The person-time incidence rate is the number of new cases during the time period/total person-time of observation, and the
 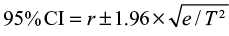 , where r is the person-time incidence rate stated as a decimal fraction, e is the number of new events, and T is the total person-time units at risk.20
Privacy of information
Access to the NHIRD is strictly controlled. All researchers who wish to use the NHIRD and its data subsets are required to sign a written agreement declaring that they have no intention of attempting to obtain information that could potentially violate the privacy of patients or care providers. Data in the NHIRD are de-identified and scrambled, and the data cannot be used to identify individuals at any level. The application to use the NHIRD in this study was reviewed and approved in accordance with the regulations of the National Health Insurance Administration and National Health Research Institutes of Taiwan. All analyses were completed using SAS© Version 9.2 (SAS Institute Inc., Cary, NC, USA).
Results
Patient demographics
The demographic characteristics, CCI, and comorbid conditions of the incident cases by year are shown in Table 1. At the beginning of 2005, there were 230,865 individuals enrolled in the NHIRD who were 50 years of age or older and free of AD. Between 2005 and 2010, a total of 8,603 incident cases of AD were identified. Overall, a higher percentage of women than men were diagnosed with AD (54% vs 46%, respectively). The diagnosis of AD was made most frequently between the ages of 75–84 years. The vast majority of patients were not from a low-income household, which was defined as a monthly average household income per person that was <60% of an average cost of living per person. Among all incident cases, 80% had a CCI score of ≥1, 25% had a CCI score of 1, 21% had a CCI score of 2, 15% had a CCI score of 3, and 19% had a CCI score of ≥4, while only 20% had a CCI score of 0. The most common comorbid conditions were cerebrovascular disease (39%), chronic pulmonary disease (26%), and peptic ulcer disease (24%).
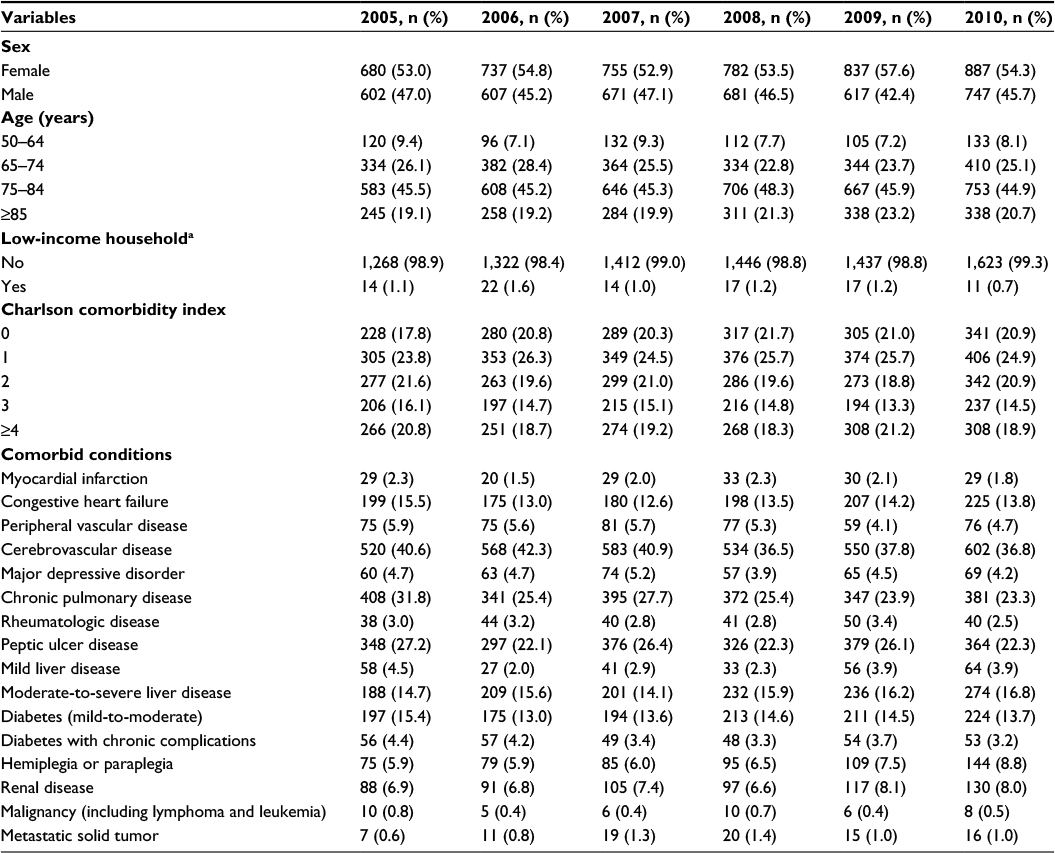 | Table 1 Demographic characteristics, Charlson comorbidity index, and comorbid conditions of the incident cases by year Note: aLow-income household was defined as a monthly average household income per person that was <60% of an average cost of living per person. |
Medication use
Table 2 shows the medication use per person by year. Benzodiazepines were the most commonly used medication, with 58.4%–63.0% of patients having been dispensed this medication at least once over the course of a given year. Atypical antipsychotics were the second most commonly used medication and were dispensed at least once for 36.8%–39.2% of patients. Cholinesterase inhibitors and N-methyl-d-aspartate (NMDA) receptor agonists, approved treatments for the symptoms of AD, were given to only a small proportion of patients.
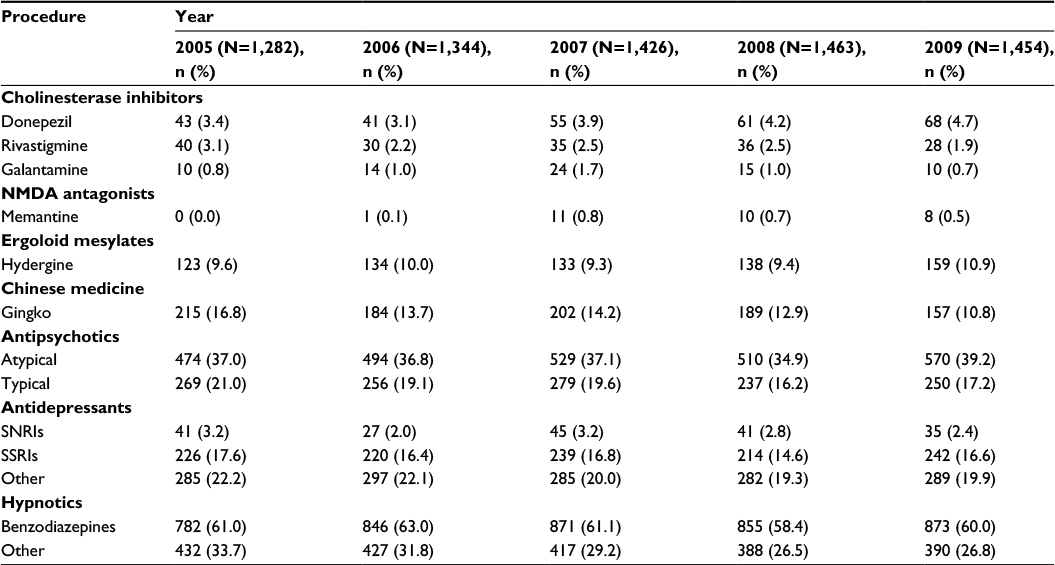 | Table 2 Number of patients being dispensed medication at least oncea by year from 2005 to 2009 Note: aBased on inpatient and outpatient medications used in the first year after diagnosis of Alzheimer’s disease and adjusted for survival. Abbreviations: NMDA, N-methyl-d-aspartate; SNRIs, serotonin–norepinephrine reuptake inhibitors; SSRIs, selective serotonin reuptake inhibitors. |
Imaging procedures
The use of imaging procedures was not observed for the majority of patients with AD (Table 3). Of the imaging procedures used, CT scans were the most commonly utilized. Patients receiving at least one CT scan ranged from 34.8% in 2005 to 41.4% in 2009. MRI scans were the second most common procedure. Patients receiving at least one MRI scan ranged from 7.5% in 2005 to 10.9% in 2009. Less than 1% of patients received a PET or single-photon emission CT (SPECT) scan of the observational period.
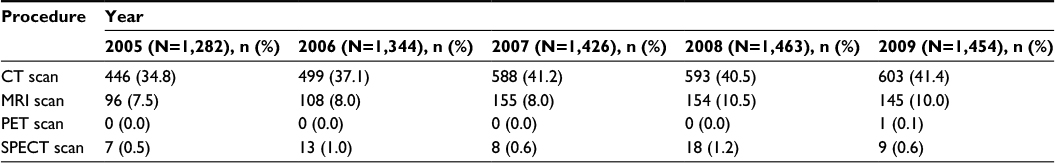 | Table 3 Number of patients undergoing an imaging procedure one or more times by year from 2005 to 2009a Note: aBased on inpatient and outpatient procedures used in the first year after diagnosis of Alzheimer’s disease and adjusted for survival. Abbreviations: CT, computerized tomography; MRI, magnetic resonance imaging; PET, positron emission tomography; SPECT, single-photon emission CT. |
Incidence
Based on the 95% CIs, the person-year incidence rate appeared to increase steadily over the 5-year observational period from 5.63/1,000 persons (95% CI, 5.32–5.94) in 2005 to 8.18/1,000 persons (95% CI, 7.78–8.57) in 2010 (Figure 1). The cumulative incidence rate from 2005 to 2010 was 33.54/1,000 persons (95% CI, 32.76–34.33).
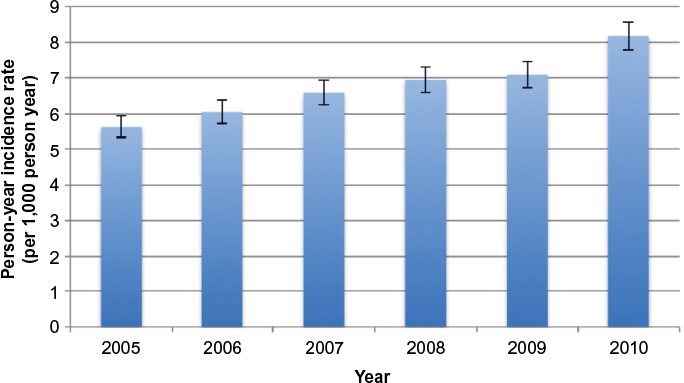 | Figure 1 Person-year incidence rates from 2005 to 2010. Notes: The person-year incidence rates increased over time. In 2005, the person-year incidence rate was 5.63/1,000 persons (95% CI, 5.32–5.94). By 2010, the person-year incidence rate was 8.18/1,000 persons (95% CI, 7.78–8.57). Incident rates were determined based on a closed cohort of patients who were ≥50 years of age at the beginning of 2005 and were not diagnosed with Alzheimer’s disease prior to 2005. Error bars shown in figure represent 95% CIs. Abbreviation: CI, confidence interval. |
Burden
Resource utilization
The mean number of total outpatient visits per person remained relatively consistent from 2005 to 2009. The mean number of outpatient visits (for any cause) ranged from 31.05 (SD 23.94) in 2009 to 34.13 (SD 25.10) in 2005. In 2005–2009, the mean number of hospitalizations (for any cause) per person ranged from a low of 1.78 (SD 4.01) in 2006 to a high of 2.42 (SD 8.66) in 2005.
Costs
The mean cost by year for outpatient treatment, hospitalizations, and all health care utilization from 2005 to 2009 is shown in Figure 2. In 2005–2009, all mean inflated costs showed a similar trend. In NT$, the total mean inflated costs per person ranged from a low of NT$205,413 (SD 460,900) in 2009 to a high of NT$227,110 (SD 458,675) in 2005. For each year, mean hospitalization costs per person accounted for the majority of the total costs per person. The mean hospitalization costs per person ranged from a low of NT$139,433 (SD 437,994) in 2009 to a high of NT$160,255 (SD 444,235) in 2005, while the mean outpatient treatment costs per person ranged from a low of NT$65,158 (SD 91,244) in 2006 to a high of NT$67,455 (SD 110,060) in 2007.
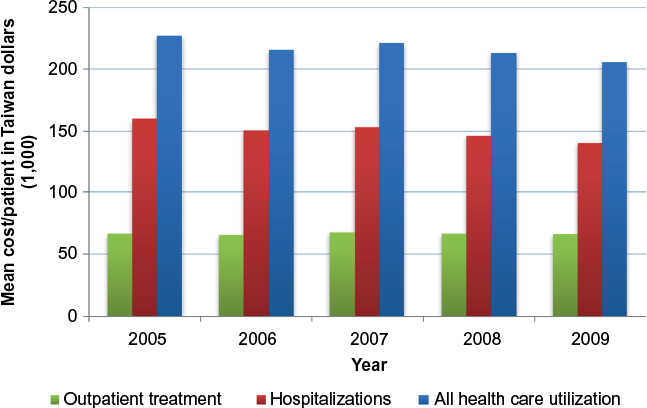 | Figure 2 Mean cost of outpatient treatment, hospitalizations, and all health care utilization by year from 2005 to 2010 (inflated to 2009 Taiwan dollars). Notes: The total mean costs (including outpatient treatment and hospitalizations) per person ranged from NT$205,413 (SD 460,900) in 2009 to NT$217,287 (SD 438,835) in 2005. For each year, mean hospitalization costs per person accounted for the majority of the total costs per person. Costs were based on expenditures in the first year after diagnosis of Alzheimer’s disease and were adjusted for survival. Abbreviations: NT$, new Taiwan dollars; SD, standard deviation. |
Discussion
In this retrospective analysis, the person-year incidence rates increased from 5.63/1,000 persons in 2005 to 8.18/1,000 persons in 2010. Over this time period, the cumulative incidence rate was 33.54/1,000 person-years. For each observational year, incident cases of AD most commonly occurred between the ages of 75 years and 84 years, and <2% of all incident cases were from a low-income household. A large majority (80%) of the incident cases had a CCI score of ≥1, and 19% had a CCI score of ≥4, indicating that this population is at a relatively high risk of mortality from comorbid disease.18
Benzodiazepines and atypical antipsychotics were the first and second most commonly used medications, respectively. For any given observational year, approximately half of all patients were dispensed a benzodiazepine at least once, while over one-third of patients were dispensed an atypical antipsychotic at least once. The frequent use of benzodiazepines and antipsychotics suggests that many patients had behavioral and psychological symptoms. These symptoms can lead to high levels of distress and burden to their families and may be the reason for seeking medical attention. However, while the antipsychotics are widely used to treat the behavioral and psychological symptoms of dementia, their use has been shown to be associated with serious side effects.19,20 On the other hand, while acknowledging that the treatment benefit associated with cholinesterase inhibitors and NMDA receptor agonists is modest, treatment guidelines recommend pharmacotherapy with one of these agents.21,22 Therefore, the low rate of usage for cholinesterase inhibitors and NMDA receptor agonists observed here are somewhat surprising. More than 95% of patients recorded no usage for either of these treatments for any year. However, these findings may reflect the fact that cholinesterase inhibitors and NMDA receptor agonists are more restricted by the BNHI reimbursement guidelines than are atypical antipsychotics and benzodiazepines. In addition, a portion of patients with AD may have opted to pay for these medications out of pocket, which would not have been captured by the BNHI.
There are wide variations in existing guidelines regarding the use of neuroimaging in the evaluation of dementia.23,24 Nearly all recommend the inclusion of either a CT or MRI scan, with some indicating a preference for MRI. The findings in this study that CT and MRI scans were the two most commonly used imaging procedures are consistent with existing guidelines. CT scans were utilized at least once for 34.8%–41.4% of patients. MRI scans were used to a lesser extent with the percentage of patients receiving at least one MRI ranging from 7.5% to 10.9%. PET scans are not reimbursed by BNHI, and only one patient received a PET scan. SPECT scans are reimbursed by BNHI but were still used very infrequently. The National Institute for Health and Care Excellence guidelines recommend the use of SPECT to help differentiate AD, vascular dementia, and frontotemporal dementia in cases where the diagnosis is in doubt.25 In light of these guideline recommendations and BNHI reimbursement rules, the low utilization of SPECT scans was surprising.
An analyses of resource utilization revealed that patients with AD averaged 31–34 outpatient visits per year in the first year of diagnosis, with the median number of visits ranging from 25 to 29. Greater variability was observed with regard to hospitalizations. The mean number of annual hospitalizations for patients with AD ranged from a low of 1.78 to a high of 2.42. In general, the mean number of hospitalizations showed a decreasing trend over the 5-year study period.
The total annual per patient inflated costs in the first year of diagnosis ranged from NT$205,413 to NT$227,110. These total annual costs comprised hospitalizations (NT$139,433–160,255) and outpatient treatment (NT$65,158–67,455). Hospitalizations accounted for the highest cost component.
The incidence rates found in this study are consistent with those found in a previous study in Taiwan, among patients who were 65 years of age or older, for the years 2000–2002.15 Based on information provided by Chan et al,15 the incidence rate was estimated to be 8.5/1,000 person-years. The person-year incidence rates in our study ranged from 5.63/1,000 persons in 2005 to 8.18/1,000 persons in 2010; however, it should be noted that unlike the Chan et al study, our study included patients who were 50 years of age or older whereas Chan et al examined patients who were 65 years of age or older. We found that AD was diagnosed most frequently among those in the age range of 75–84 years.
Our findings regarding incidence rates are also generally consistent with incidence rates from the US and Europe.6 There is considerable variability in the incidence rates reported from these countries (0.04–16.8/1,000 person-years), which is likely due, in part, to the differences in methodology and age ranges utilized in the various studies. In the US, studies that included individuals aged 65 years and older have reported incidence rates of 2.7/1,000, 14.3/1,000, and 16.8/1,000 person-years. In Spain, an incidence rate of 5.4/1,000 person-years (>55 years of age and older) was reported, and in Italy, a study based on individuals who were 65–84 years of age reported an incidence rate of 7.0/1,000 person-years.
The costs reported here are generally consistent with previous reports for Taiwan.15 Chan et al estimated total annual direct costs at NT$56,801 in 2000, and increasing to NT$167,139 in 2002. The NT$205,413–217,287 total direct costs found in the current study suggest a continued trend of increasing costs for patients with AD.
The current study examined only the direct costs of AD, but past research has found that the indirect costs associated with AD (ie, caregiving that was unpaid, lost work time, lost productivity as a result of having to take early retirement, inability to work, unemployment, sick leave, and reduced labor time caused by AD) are usually higher than the direct costs. In a systematic literature of data across Europe and the US, Takizawa et al reported that indirect cost estimates for mild AD were up to fourfold higher per year in France, while in the US and Spain, indirect costs were roughly equal to the direct costs.6 In this same review, annual indirect cost estimates for moderate-to-severe AD were much higher in general, ranging approximately twofold higher in the US to eightfold in France. As such, the overall burden of disease would be significantly greater than reported here.
Study limitations
There are important limitations regarding this study that should be noted. The NHIRD only includes information for reimbursed services so information regarding nonreimbursed services or out of pocket health care expenses was not available. Estimates of incidence are likely to vary based on the study design, as reflected in the variability of reported estimates reviewed here. Some approaches are more restrictive regarding how an individual with AD is identified, leading to lower estimates, while other methods that are less restrictive may lead to higher estimates. In the current study, cases were only included if they sought treatment and were diagnosed with AD. Therefore, individuals who were not diagnosed, or who were misdiagnosed, would not have been included. Another limitation applies to all studies that utilize health insurance claims data, in that missing and incorrectly coded data are not uncommon. Long-term services, such as assisted living or nursing home resource use, are not captured in the NHIRD. Based on the debilitating nature of AD, it is reasonable to assume that these costs are substantial. Therefore, it is likely that the economic burden of AD in Taiwan presented here underestimates the total costs.
Conclusion
AD represents a substantial burden in Taiwan. Based on the observed trend in incidence rates over time, it is likely that this burden will only continue to increase. The findings of this study reported here are both consistent with, and complimentary to, previous research, which in turn, demonstrates the value of the NHIRD claims data. That is, the NHIRD contains extensive information on health care resource, costs, and medication utilization patterns, which in turn allows for the development of more robust cost estimates that use a bottom-up approach. The NHIRD also provides useful information that allows us to expand our understanding regarding the incidence and prevalence of any disease. At the present time, however, direct access to the NHIRD is limited to locally based academic researchers. As industry and academia frequently share common research goals, improved access to such a comprehensive and rich data source as the NHIRD, utilizing appropriate governance procedures, would seem to be warranted in order to capitalize on the value of this high-quality source of real-world health care information.
Acknowledgments
This study is based in part on data from the NHIRD provided by the BNHI, Department of Health, and managed by National Health Research Institutes. The interpretation and conclusions contained herein do not represent those of National Health Insurance Administration, Department of Health, or National Health Research Institutes. The authors thank Thomas Lee and Michael Stensland of Agile Outcomes Research, Inc., for their technical and writing support in the development of this article. This study was sponsored by Eli Lilly and Company.
Author contributions
All authors contributed toward data analysis, drafting and critically revising the paper and agree to be accountable for all aspects of the work.
Disclosure
Zbigniew Kadziola, Alan JM Brnabic, Ju-Fen Yeh, and William Montgomery are full-time employees of Eli Lilly and Company, or one or one of its subsidiaries, and minor stockholders in Eli Lilly and Company. Yen-Ni Hung is a member of a scientific advisory board of Eli Lilly and Company. Jong-Ling Fuh is a member of a scientific advisory board of Eli Lilly and Company. Jen-Ping Hwang has been on speaker bureaus of Janssen-Cilag and Eli Lilly, Taiwan. The authors report no other conflicts of interest in this work.
References
Qiu C, Kivipelto M, von Strauss E. Epidemiology of Alzheimer’s disease: occurrence, determinants, and strategies toward intervention. Dialogues Clin Neurosci. 2009;11(2):111. | ||
World Health Organization [webpage on the Internet]. Dementia; 2012. Available from: http://www.who.int/mediacentre/factsheets/fs362/en/. Accessed October 1, 2014. | ||
Reitz C, Brayne C, Mayeux R. Epidemiology of Alzheimer disease. Nat Rev Neurol. 2011;7(3):137–152. | ||
Ghezzi L, Scarpini E, Galimberti D. Disease-modifying drugs in Alzheimer’s disease. Drug Des Devel Ther. 2013;7:1471–1478. | ||
Brookmeyer R, Johnson E, Ziegler-Graham K, Arrighi HM. Forecasting the global burden of Alzheimer’s disease. Alzheimers Dement. 2007;3(3):186–191. | ||
Takizawa C, Thompson PL, van Walsem A, Faure C, Maier WC. Epidemiological and economic burden of Alzheimer’s disease: a systematic literature review of data across Europe and the United States of America. J Alzheimers Dis. 2015;43(4):1271–1284. | ||
Hebert LE, Weuve J, Scherr PA, Evans DA. Alzheimer disease in the United States (2010–2050) estimated using the 2010 census. Neurology. 2013;80(19):1778–1783. | ||
Zhang Z-X, Zahner GEP, Román GC, et al. Dementia subtypes in China: prevalence in Beijing, Xian, Shanghai, and Chengdu. Arch Neurol. 2005;62(3):447–453. | ||
Yamada T, Hattori H, Miura A, Tanabe M, Yamori Y. Prevalence of Alzheimer’s disease, vascular dementia and dementia with Lewy bodies in a Japanese population. Psychiatry Clin Neurosci. 2001;55(1):21–25. | ||
Lin RT, Lai CL, Tai CT, Liu CK, Yen YY, Howng SL. Prevalence and subtypes of dementia in southern Taiwan: impact of age, sex, education, and urbanization. J Neurol Sci. 1998;160(1):67–75. | ||
Liu HC, Chou P, Lin KN, et al. Assessing cognitive abilities and dementia in a predominantly illiterate population of older individuals in Kinmen. Psychol Med. 1994;24(3):763–770. | ||
Liu HC, Lin KN, Teng EL, et al. Prevalence and subtypes of dementia in Taiwan: a community survey of 5297 individuals. J Am Geriatr Soc. 1995;43(2):144–149. | ||
World Health Organization [webpage on the Internet]. Dementia: A Public Health Priority; 2012. Available from: http://www.who.int/mental_health/neurology/dementia/en/. Accessed October 1, 2014. | ||
García-Alberca JM, Lara JP, Berthier ML. Anxiety and depression in caregivers are associated with patient and caregiver characteristics in Alzheimer’s disease. Int J Psychiatry Med. 2011;41(1):57–69. | ||
Chan ALF, Cham T-M, Lin S-J. Direct medical costs in patients with Alzheimer’s disease in Taiwan: a population-based study. Curr Ther Res Clin Exp. 2009;70(1):10–18. | ||
National Health Insurance Research Database. 2014. Available from: http://nhird.nhri.org.tw/en/index.htm. Accessed June 29, 2016. | ||
Cheng CL, Kao YH, Lin SJ, Lee CH, Lai ML. Validation of the National Health Insurance Research Database with ischemic stroke cases in Taiwan. Pharmacoepidemiol Drug Saf. 2011;20(3):236–242. | ||
Charlson ME, Pompei P, Ales KL, MacKenzie CR. A new method of classifying prognostic comorbidity in longitudinal studies: development and validation. J Chronic Dis. 1987;40(5):373–383. | ||
Wallis S. Binomial confidence intervals and contingency tests: mathematical fundamentals and the evaluation of alternative methods. J Quant Linguist. 2013;20(3):178–208. | ||
Sahai H, Khurshid A. Statistics in Epidemiology: Methods, Techniques, and Applications. Boca Raton, FL: CRC Press, Inc; 1996. | ||
Liperoti R, Pedone C, Corsonello A. Antipsychotics for the treatment of behavioral and psychological symptoms of dementia (BPSD). Curr Neuropharmacol. 2008;6(2):117–124. | ||
Ballard C, Waite J. The effectiveness of atypical antipsychotics for the treatment of aggression and psychosis in Alzheimer’s disease. Cochrane Database Syst Rev. 2006;(1):CD003476. | ||
Geldmacher DS, Kerwin DR. Practical diagnosis and management of dementia due to Alzheimer’s disease in the primary care setting: an evidence-based approach. Prim Care Companion CNS Disord. 2013;15(4):CC.12r01474. | ||
Health Quality Ontario. The appropriate use of neuroimaging in the diagnostic work-up of dementia: an evidence-based analysis. Ont Health Technol Assess Ser. 2014;14(1):1–64. | ||
National Institute for Health and Care Excellence (NICE) [webpage on the Internet]. Dementia: Supporting people with dementia and their carers in health and social care. Available from: http://www.nice.org.uk/guidance/cg42/chapter/1-recommendations#diagnosis-and-assessment-of-dementia. Accessed April 22, 2015. |
 © 2016 The Author(s). This work is published and licensed by Dove Medical Press Limited. The full terms of this license are available at https://www.dovepress.com/terms.php and incorporate the Creative Commons Attribution - Non Commercial (unported, v3.0) License.
By accessing the work you hereby accept the Terms. Non-commercial uses of the work are permitted without any further permission from Dove Medical Press Limited, provided the work is properly attributed. For permission for commercial use of this work, please see paragraphs 4.2 and 5 of our Terms.
© 2016 The Author(s). This work is published and licensed by Dove Medical Press Limited. The full terms of this license are available at https://www.dovepress.com/terms.php and incorporate the Creative Commons Attribution - Non Commercial (unported, v3.0) License.
By accessing the work you hereby accept the Terms. Non-commercial uses of the work are permitted without any further permission from Dove Medical Press Limited, provided the work is properly attributed. For permission for commercial use of this work, please see paragraphs 4.2 and 5 of our Terms.