")
Back to Journals » OncoTargets and Therapy » Volume 11
The elevated glutaminolysis of bladder cancer and T cells in a simulated tumor microenvironment contributes to the up-regulation of PD-L1 expression by interferon-γ
Authors Wang LP, Yang XC, Li D, Liang ZJ, Chen YB, Ma GF , Wang YH, Li YX, Liang Y, Niu HT
Received 17 July 2018
Accepted for publication 10 September 2018
Published 18 October 2018 Volume 2018:11 Pages 7229—7243
DOI https://doi.org/10.2147/OTT.S180505
Checked for plagiarism Yes
Review by Single anonymous peer review
Peer reviewer comments 2
Editor who approved publication: Dr Faris Farassati
Liping Wang,1,* Xuecheng Yang,2,* Dan Li,1 Zhijuan Liang,1 Yuanbin Chen,1 Guofeng Ma,2 Yonghua Wang,2 Yongxin Li,3 Ye Liang,1 Haitao Niu1,2
1Key Laboratory, Department of Urology and Andrology, Affiliated Hospital of Qingdao University, Qingdao, Shandong 266003, China; 2Department of Urology, Affiliated Hospital of Qingdao University, Qingdao, Shandong 266003, China; 3Department of Vascular Surgery, Affiliated Hospital of Qingdao University, Qingdao, Shandong 266003, China
*These authors contributed equally to this work
Background: Metabolic reprogramming occurs in the tumor microenvironment and influences the survival and function of tumor and immune cells. Interferon-γ (IFN-γ) produced by T cells up-regulates PD-L1 expression in tumors. However, reports regarding the relationship between nutrient metabolism and the up-regulation of PD-L1 expression are lacking.
Materials and methods: In this paper, we analyzed the metabolic changes in T cells and bladder cancer cells in a simulated tumor microenvironment to provide evidence regarding their relevance to PD-L1 up-regulation.
Results: The glutaminolysis was increased in both activated T cells and glucose-deprived T cells. IFN-γ production by T cells was decreased in a glucose-free medium and severely decreased when cells were simultaneously deprived of glutamine. Furthermore, the glutaminolysis of the bladder cancer cells under glucose deprivation exhibited a compensatory elevation. The glucose concentration of T cells co-cultured with bladder cancer cells was decreased and T cell proliferation was reduced, but IFN-γ production and glutaminolysis were increased. However, in bladder cancer cells, the elevation in glutaminolysis under co-culture conditions did not compensate for glucose deprivation because the glucose concentration in the culture medium did not significantly differ between the cultures with and without T cells. Our data also show that inhibiting glutamine metabolism in bladder cancer cells could reduce the elevation in PD-L1 expression induced by IFN-γ.
Conclusion: In a simulated tumor microenvironment, elevated glutaminolysis may play an essential role in IFN-γ production by T cells, ultimately improving the high PD-L1 expression, and also directly contributing to producing more PD-L1 in bladder cancer cells.
Keywords: T cells, bladder cancer cells, glutaminolysis, PD-L1, co-culture
Introduction
Cancer cells characteristically differ from normal cells and exhibit altered metabolic programming promoting proliferation and survival.1,2 To divert carbon sources to biosynthetic pathways, metabolism in cancer cells shifts oxidative phosphorylation to glycolysis and up-regulates glutaminolysis.3 Cancer cells can convert pyruvate to lactate with high efficiency in the presence of adequate oxygen, which is termed aerobic glycolysis or the “Warburg effect”.4 Glutaminolysis is similarly up-regulated in cancers and converts glutamine to α-ketoglutarate for entry into the tricarboxylic acid (TCA) cycle. Aerobic glycolysis and glutaminolysis represent two important metabolic changes that enable cancer growth.5
Resting T cells exhibit low metabolic levels that serve to fuel basal energy generation, whereas stimulated T cells require a high metabolic flux to rapidly grow, divide, and exert effector functions, in a similar way to cancer cells.6 To support the rapid biosynthesis of lipid membranes, nucleic acids, and proteins, the metabolic pathways of activated T lymphocytes are reprogrammed to the glycolytic, pentose phosphate, and glutaminolytic pathways.7 Stimulated lymphocytes choose aerobic glycolysis over more energy-efficient mitochondrial oxidative pathways because glycolysis produces many intermediates that can be used for biosynthesis.6 In addition, glutamine metabolism provides α-ketoglutarate for the TCA cycle and metabolic intermediates for biosynthesis.8 The metabolism of immune cells is intimately linked to their function, and changes in cell metabolism have been shown to enhance or suppress specific T cell functions. Currently, cell metabolism is considered a key regulator of T cell function.6
However, tumor-infiltrating lymphocytes (TILs) are exposed to low extracellular glucose levels owing to the high nutrient uptake by cancer cells, which can decrease T cell proliferation and impair effector functions.9,10 In the tumor microenvironment, metabolic competition exists between tumor cells and T cells, which can drive cancer progression. The glucose consumption by tumors metabolically restricts T cells, resulting in a reduced glycolytic capacity and interferon-γ (IFN-γ) production, thereby leading to the failure of T cells to protect against cancer.11 In addition to the metabolic inhibition, T cells are strongly inhibited by other mechanisms, decreasing their effector activities. Tumors can escape T cell-mediated tumor-specific immunity via a pathway consisting of PD-1 and PD-L1. PD-L1 can be induced by oncogenic signals and inflammatory cytokines, such as the highly potent IFN-γ.12 In the tumor microenvironment, T cells can recognize tumor neoantigens and produce IFN-γ, which can induce the expression of PD-L1 in cancer cells and other immune cells.13 Studies have confirmed that the up-regulation of PD-L1 expression by IFN-γ is associated with the janus kinase (JAK)–STAT pathway.14 However, whether nutrient metabolism contributes to this process remains unknown.
To determine the metabolic changes in T cells and bladder cancer cells in a simulated tumor microenvironment and provide evidence regarding the relationship between nutrient metabolism and PD-L1 up-regulation in an IFN-γ-containing tumor microenvironment, we investigated the glycolysis- and glutaminolysis-associated gene expression15–20 in T cells and bladder cancer cells under glucose deprivation or co-culture conditions, and the proliferation and IFN-γ production of T cells under the co-culture conditions were also assessed. In addition, we investigated the relationship between glutaminolysis and PD-L1 expression in a simulated tumor microenvironment, and a glutamine analog was used to inhibit glutamine metabolism in bladder cancer cells. Furthermore, the expression of glutaminase and PD-L1 was evaluated.
Material and methods
Cells and reagents
Human peripheral T cells were obtained as follows. The peripheral blood samples used for the preparation of the peripheral blood mononuclear cells (PBMCs) were obtained from healthy volunteers and isolated using human lymphocyte separation medium (Solarbio, Beijing, China, cat. no P8610). The PBMCs were cultured in an anti-human CD3 antibody (Bio-Tool, Beijing, China, no M02001A) and RetroNectin (Takara, Kusatsu, Japan, code no T100A) pre-coating culture flask, and IL-2 (PeproTech, Rocky Hill, NJ, USA, cat. no 200-02) and IFN-γ (Novus, Littleton, CO, USA, cat. no NBP2-34992) were added to the 1640 culture medium. After culturing for 5 days, the T cell purity was assessed using a BD FACSCalibur (BD Biosciences, Franklin Lakes, NJ, USA) and anti-CD3-fluorescein isothiocyanate (FITC) (Thermo Fisher Scientific, Waltham, MA, USA, clone HIT3a, cat. no 11-0039-41; mouse IgG2a kappa isotype control, FITC, Thermo Fisher Scientific, clone eBM2a, cat. no 11-4724-81). The study was conducted with approval from the Institutional Review Board of the Affiliated Hospital of Qingdao University and received written informed consent from the healthy volunteers.
The 5637 and T24 cell lines were supplied by the cell bank of the Chinese Academy of Sciences. The materials used for the cell culture, including the 1640 culture medium, FBS, trypsin, penicillin, and streptomycin, were purchased from Gibco Co. (Grand Island, NY, USA).
T cell stimulation and glucose restriction
The cells were seeded at 1×10⁶ cells/well in 24-well plates before the treatment and incubated at 37°C in a humidified atmosphere containing 5% CO2. After 24 hours, the cells were stimulated with 100 ng/mL phorbol 12-myristate 13-acetate (PMA) (MedChem Express, cat. no HY-18739) and 1 μg/mL ionomycin (Iono) (Solarbio, cat. no I8800) for 5 hours; then, the glycolysis-, oxidative phosphorylation-, and glutaminolysis-associated gene expression was investigated by performing real-time quantitative PCR (RT-qPCR). Unstimulated T cells served as controls.
The cells were starved for 24 hours in glucose-free 1640 medium and then seeded at 1×10⁶ cells/well in 24-well plates cultured with normal glutamine medium (glutamine 300 mg/L), low-glutamine medium (glutamine 150 mg/L), or glutamine-free medium (glutamine 0 mg/L) with or without glucose. After 24 hours, the cells were stimulated with 100 ng/mL PMA and 1 μg/mL Iono for 5 hours; then, IFN-γ production was investigated by performing an ELISA (Elabscience, Wuhan, China). The starved T cells were seeded at 1×10⁶ cells/well in 24-well plates cultured with normal 1640 medium (glucose 2,000 mg/L), low-glucose medium (glucose 1,000 mg/L), or glucose-free medium (glucose 0 mg/L). After 24 hours, the cells were stimulated with PMA/Iono for 5 hours; then, the glycolysis- and glutaminolysis-associated gene expression was investigated by performing RT-qPCR.
Glucose restriction of bladder cancer cells
The 5637 and T24 cells were seeded at 1–5×10⁵ cells/well in 24-well plates for 24 hours before the treatment and incubated at 37°C in a humidified atmosphere containing 5% CO2. Then, the cells were cultured in low-glucose medium (glucose 250 mg/L) for 24 hours, and the glycolysis- and glutaminolysis-associated gene expression was investigated by performing RT-qPCR. The cells cultured in normal medium served as controls.
Co-culture of T cells and bladder cancer cells
T cells were seeded at 5×10⁵ cells/well in a 24 mm Transwell insert (Corning, New York, NY, USA); the pore size of the membrane was 0.4 μm, which would not allow the cells to pass through. The bladder cancer cells were seeded at 2×10⁵ cells/well on corresponding six-well receiver plates. Therefore, the T cells and bladder cancer cells could be collected separately after co-culture. After culturing for 3 days with 50 ng/mL PMA and 1 μg/mL Iono, half of the culture medium was replaced with fresh medium with PMA/Iono. After culturing for another 2 days, the glucose concentrations in the supernatant were measured using a Glucose Assay Kit (Nanjing Jiancheng Bioengineering Institute, Nanjing, China) and compared with those in the T cells or bladder cancer cells cultured alone. The T cells in the Transwell insert were collected and proliferation was detected using Cell Counting Kit-8 (CCK-8) (MedChemExpress, Monmouth Junction, NJ, USA). The IFN-γ production of T cells in the supernatant was investigated by performing an ELISA. T cells and bladder cancer cells were seeded together at 1–5×10⁵ cells/well in the same 24-well plates for 24 hours; then, the morphology of the T cells co-cultured with 5637 and T24 cells was observed under a microscope (Olympus, Tokyo, Japan) and compared with that of T cells cultured alone. The glycolysis- and glutaminolysis-related gene expression in the T cells and bladder cancer cells (5637 and T24) under the co-culture conditions was investigated by performing RT-qPCR. The PD-1 expression in the T cells and PD-L1 expression in the bladder cancer cells were determined by performing RT-qPCR, and the PD-L1 protein level in the 5637 and T24 cells was determined by Western blotting.
Glutamine restriction of bladder cancer cells
The 5637 and T24 cells were seeded at 2–10×105 cells/well in 12-well plates for 24 hours before the treatment and incubated at 37°C in a humidified atmosphere containing 5% CO2. Then, the cells were cultured in IFN-γ- and 6-diazo-5-oxo-L-norleucine (DON)-containing medium (IFN-γ, 1.2 nM; DON, 12 μM, 30 μM, and 60 μM; DON: Sigma-Aldrich, St. Louis, MO, USA, cat. no D2141) for 48 hours. The cells cultured in normal medium and IFN-γ-containing medium served as controls. The protein expression of glutaminase and PD-L1 was investigated by Western blotting.
CCK-8
The cells incubated with 100 μL culture medium in a 96-well plate were supplemented with 10 μL CCK-8 solution and incubated for 1–4 hours at 37°C. The absorbance at 450 nm was measured using a Thermo Fisher Scientific Microplate Reader (Thermo Fisher Scientific).
Glucose assay
The glucose concentrations in the supernatant were measured using a Glucose Assay Kit. In brief, 2 μL supernatant was mixed with 100 μL R1 solution and 100 μL R2 solution in a 96-well plate and incubated for 15 minutes at 37°C. The absorbance at 505 nm was measured using a Thermo Fisher Scientific Microplate Reader, and the glucose concentrations were calculated according to the glucose standards.
ELISA
The IFN-γ production of the T cells in the supernatant was investigated using a human IFN-γ ELISA kit according to the manufacturer’s instructions. In brief, samples (10 μL) and diluent buffer (90 μL) or standard were added to the wells for 90 minutes at 37°C and then removed. Immediately, 100 μL biotinylated detection antibody was added for 1 hour at 37°C, then the samples were washed three times for 1–2 minutes. Horseradish peroxidase (HRP) conjugate was added to the wells for 30 minutes at 37°C. After washing, the substrate reagent was added for 15 minutes at 37°C in the dark and then stopped. The absorbance at 450 nm was measured using a Thermo Fisher Scientific Microplate Reader.
RT-qPCR
The total RNA was extracted using Trizol (Takara, code no 9109) according to the manufacturer’s recommendations. For the detection of mRNA levels, the total RNA (500 ng) was transcribed into cDNA using a PrimeScript™ RT reagent kit (Perfect Real Time) (Takara, code no RR037A). All the primers were synthesized by Huada Gene (Beijing, China) and are shown in Table 1. The RT-qPCR was performed using a Roche LightCycler 480II real-time PCR detection system (Roche, Basel, Switzerland). The fold changes in the expression of each gene were calculated by the comparative threshold cycle (Ct) method using the formula 2−(ΔΔCt).
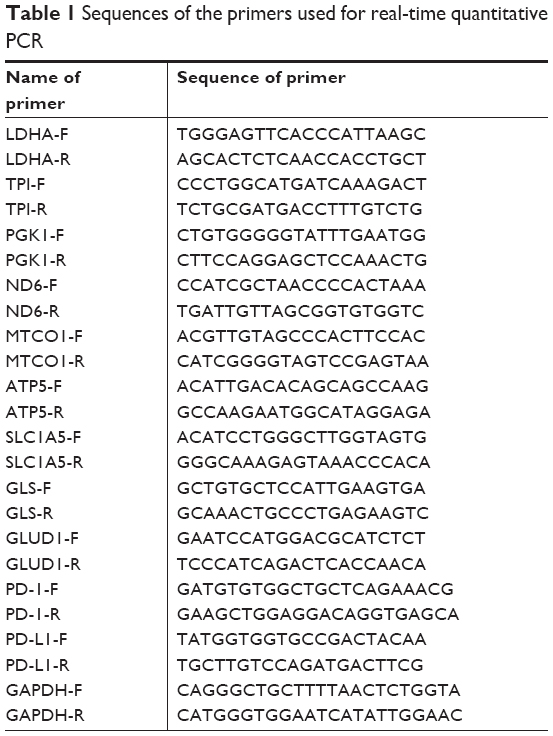 | Table 1 Sequences of the primers used for real-time quantitative PCR |
Western blot analysis
The total protein was extracted by SDS buffer, and then the protein concentrations were measured using a bicinchoninic acid (BCA) kit (Thermo Fisher Scientific). Subsequently, the proteins (20 μg) were separated by 10% SDS-PAGE, followed by transfer to polyvinylidene fluoride membranes (Millipore, Billerica, MA, USA). After blocking with 5% non-fat milk, the membranes were incubated with the primary antibodies at 4°C overnight, using antibodies for PD-L1 (Cell Signaling Technology, Danvers, MA, USA, no 13684, at a dilution of 1:1,000), glutaminase (Abcam, Cambridge, UK, cat. no ab156876; dilution 1:1,000), β-actin (Cell Signaling Technology, no 4970; dilution 1:1,000), and glyceraldehyde-3-phosphate dehydrogenase (GAPDH) (Sigma-Aldrich, no G9545; dilution 1:5,000). Then, the membranes were incubated with HRP-conjugated secondary antibodies (Jackson ImmunoResearch, West Grove, PA, USA; dilution 1:10,000) for another 1 hour at room temperature. The immune complexes were detected using an enhanced chemiluminescence kit (Millipore). The results were normalized to GAPDH or β-actin to correct for the differences in the loading of the proteins. Densitometric analysis was conducted using AlphaView SA software.
Statistical analysis
Data are shown as the mean ± SD of a representative point from triplicate experiments. Comparisons between two groups were performed using an unpaired, two-tailed Student’s t-test and graphs using the GraphPad Prism 6 software program. The results were considered significant at P<0.05 and highly significant at P<0.01 (*P<0.05, **P<0.01).
Results
Elevated glutaminolysis in activated human T cells
After culturing, the T cell purity was greater than 98%, as confirmed by flow cytometry (Figure 1A). To investigate how human T cells reprogram the metabolic pathways to support proliferation and function upon activation, the T cells were stimulated with PMA and Iono; then, the glycolysis-, oxidative phosphorylation-, and glutaminolysis-associated gene expression was investigated by performing RT-qPCR. Compared with the unstimulated T cells, the activated T cells exhibited enhanced expression of glycolytic enzymes, including LDHA, TPI, and PGK1 (Figure 1B), but the expression of genes associated with oxidative phosphorylation, such as ND6, MTCO1, and ATP5, was decreased (Figure 1C). The glutaminolysis-associated gene expression of SLC1A5, GLS, and GLUD1 was significantly elevated (Figure 1D). These results indicate that active T cells prefer glycolysis and glutaminolysis over oxidative phosphorylation for obtaining fuel.
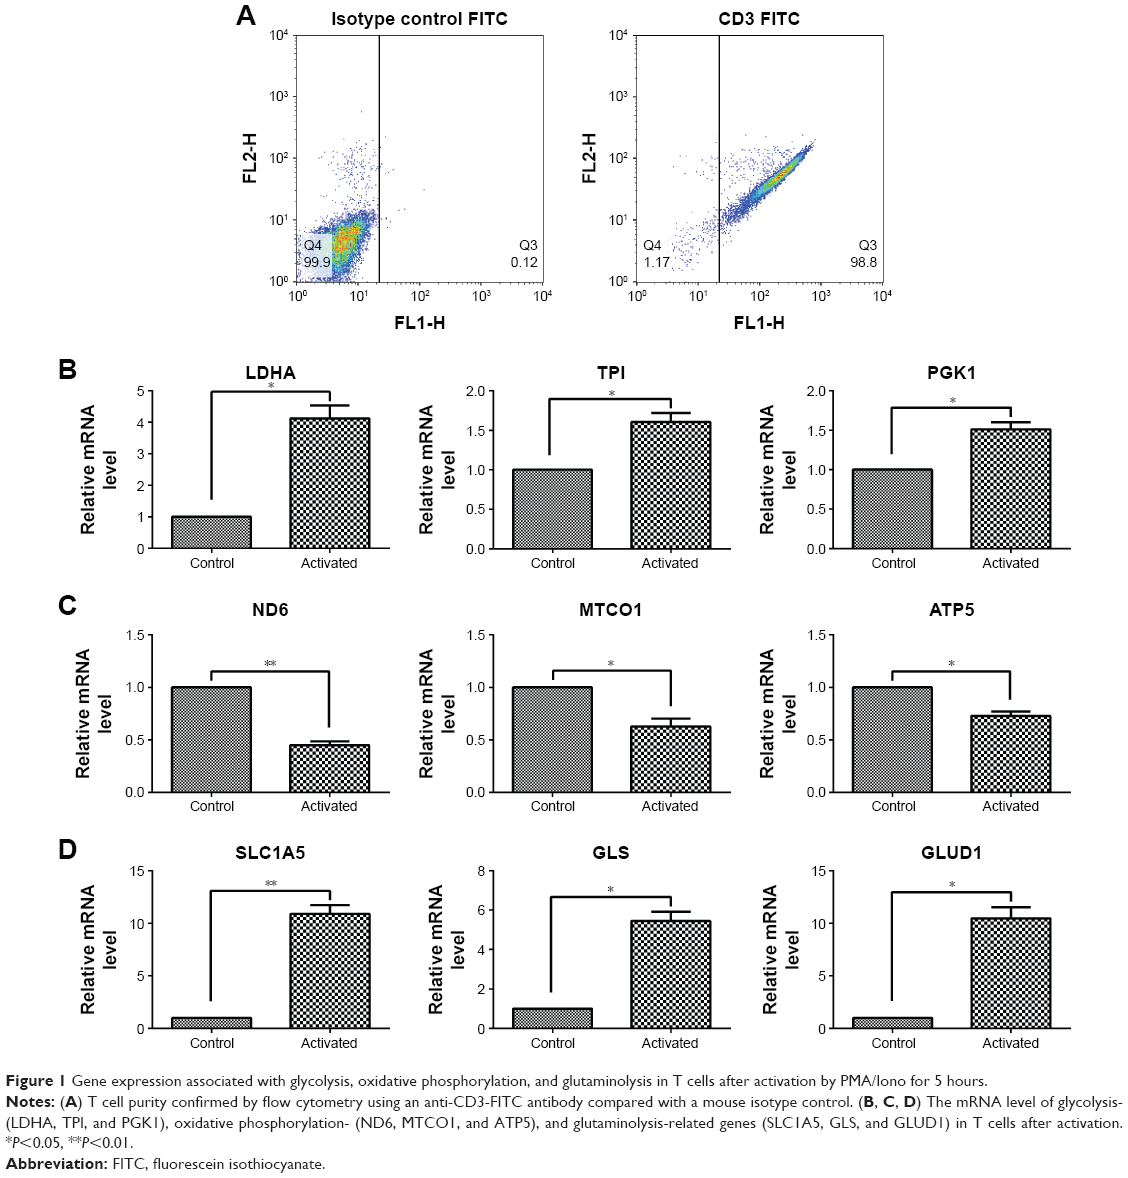 | Figure 1 Gene expression associated with glycolysis, oxidative phosphorylation, and glutaminolysis in T cells after activation by PMA/Iono for 5 hours. |
Elevated glutaminolysis in T cells maintains IFN-γ production under glucose deprivation
The production of IFN-γ in the T cells was decreased after culturing with glucose-free medium (Figure 2A). In the presence of glucose, IFN-γ production was not affected by the glutamine concentration. However, in the absence of glucose, the production of IFN-γ was severely reduced when glutamine was simultaneously deprived (Figure 2A). Thus, glutamine is important for IFN-γ production in glucose-deprived T cells.
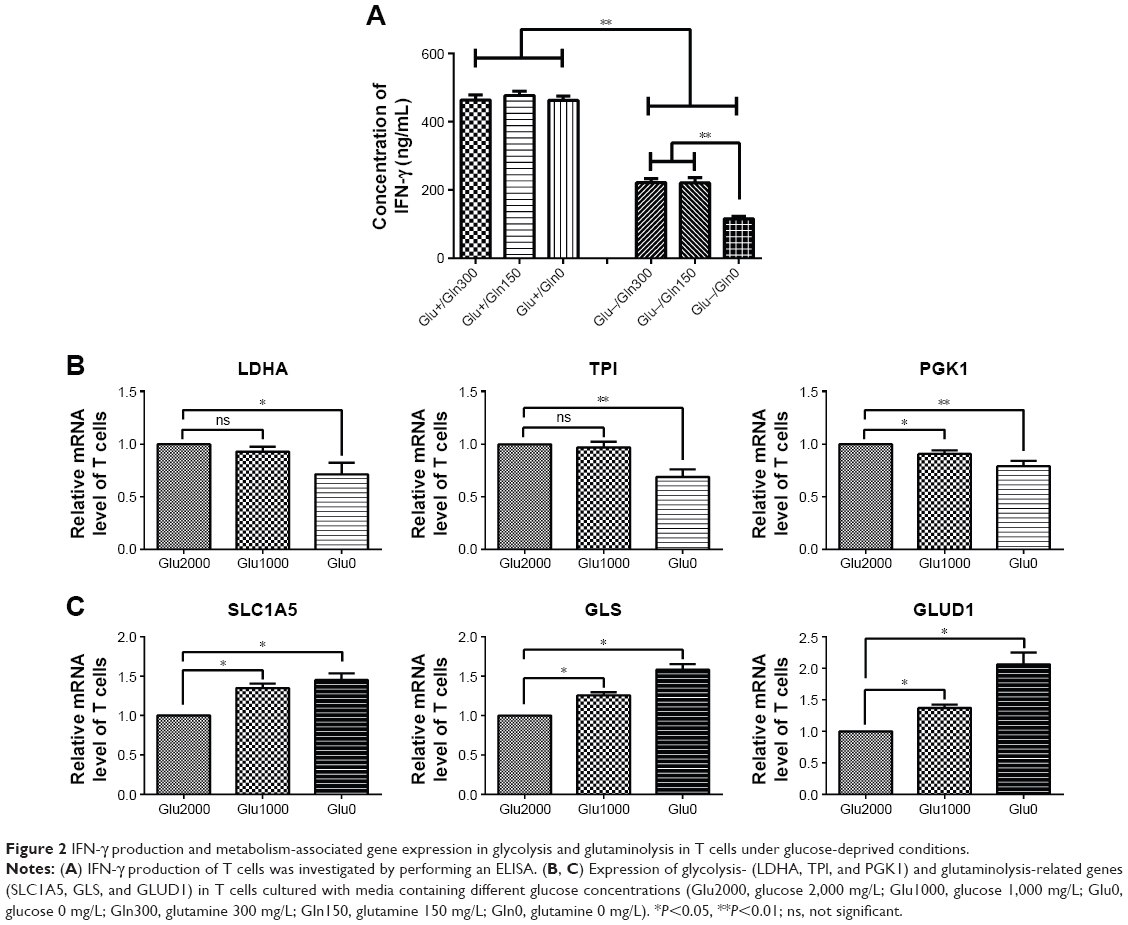 | Figure 2 IFN-γ production and metabolism-associated gene expression in glycolysis and glutaminolysis in T cells under glucose-deprived conditions. |
In addition, in T cells cultured with low-glucose medium, glycolytic enzymes, such as LDHA and TPI, showed no significant changes, and PGK1 was slightly decreased. In T cells cultured with glucose-free medium, all glycolytic enzymes, including LDHA, TPI, and PGK1, were decreased (Figure 2B). However, the mRNA levels of the glutaminolysis enzymes (GLS and GLUD1) and transporter (SLC1A5) were successively increased in low-glucose medium and glucose-free medium (Figure 2C). In brief, the glutaminolysis-associated gene expression was increased and glycolysis-associated gene expression was decreased in T cells under glucose-deprived conditions, and the elevation in glutaminolysis was associated with the production of IFN-γ in the glucose-deprived T cells.
Elevated glutaminolysis in bladder cancer cells under glucose deprivation
To investigate the metabolism-associated gene expression of bladder cancer cells under glucose-deprived conditions, 5637 and T24 cells were cultured with low-glucose medium. The glycolytic enzymes of 5637 and T24, such as LDHA, TPI, and PGK1, all showed no significant changes compared with the control cells that were cultured in normal medium (Figure 3A and C). However, the mRNA levels of the glutaminolysis enzymes (GLS and GLUD1) and transporter (SLC1A5) were increased in the low-glucose medium (Figure 3B and D). Thus, glutaminolysis leads to a compensatory enhancement in glucose-deprived bladder cancer cells.
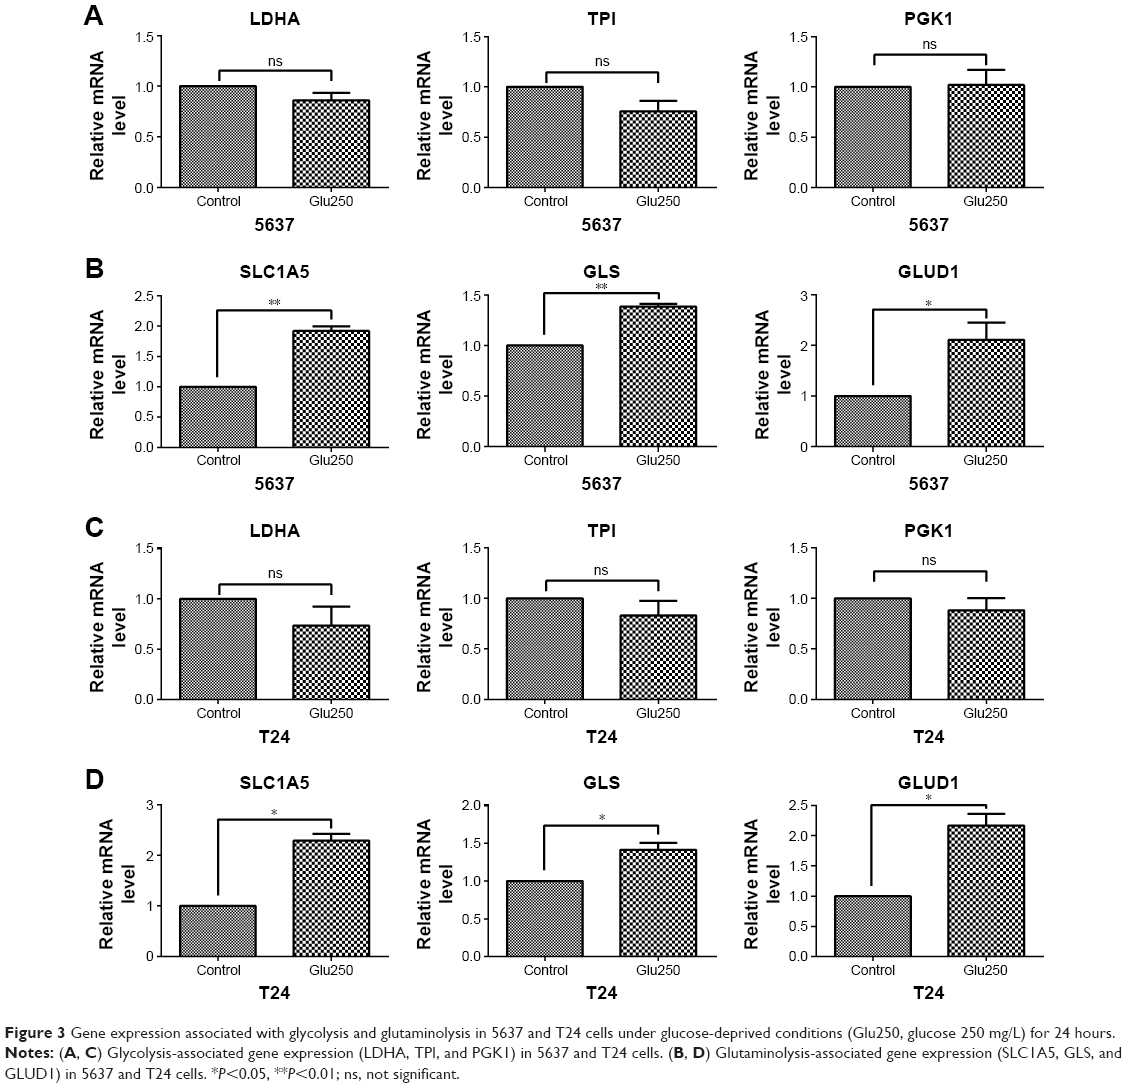 | Figure 3 Gene expression associated with glycolysis and glutaminolysis in 5637 and T24 cells under glucose-deprived conditions (Glu250, glucose 250 mg/L) for 24 hours. |
Elevated glutaminolysis in T cells maintains IFN-γ production after co-culturing with bladder cancer cells
T cells and bladder cancer cells (5637 and T24) were co-cultured in a Transwell system. The glucose concentration in the culture medium sharply decreased in the co-culture with the 5637 and T24 cells compared with that in the T cell-only culture (Figure 4A). The T cell proliferation level was decreased after culturing with the 5637 and T24 cells (Figure 4B). The state of the T cells was observed under a microscope and was worse than that of the controls, and the normal clumping growth was reduced in the co-culture with the 5637 cells. The clumping growth worsened in the culture with the T24 cells, and it was eliminated (Figure 4D). However, the IFN-γ production of the T cells was increased after the co-culture with the 5637 and T24 cells (Figure 4C), even at low glucose concentrations and when the T cells were in poor condition.
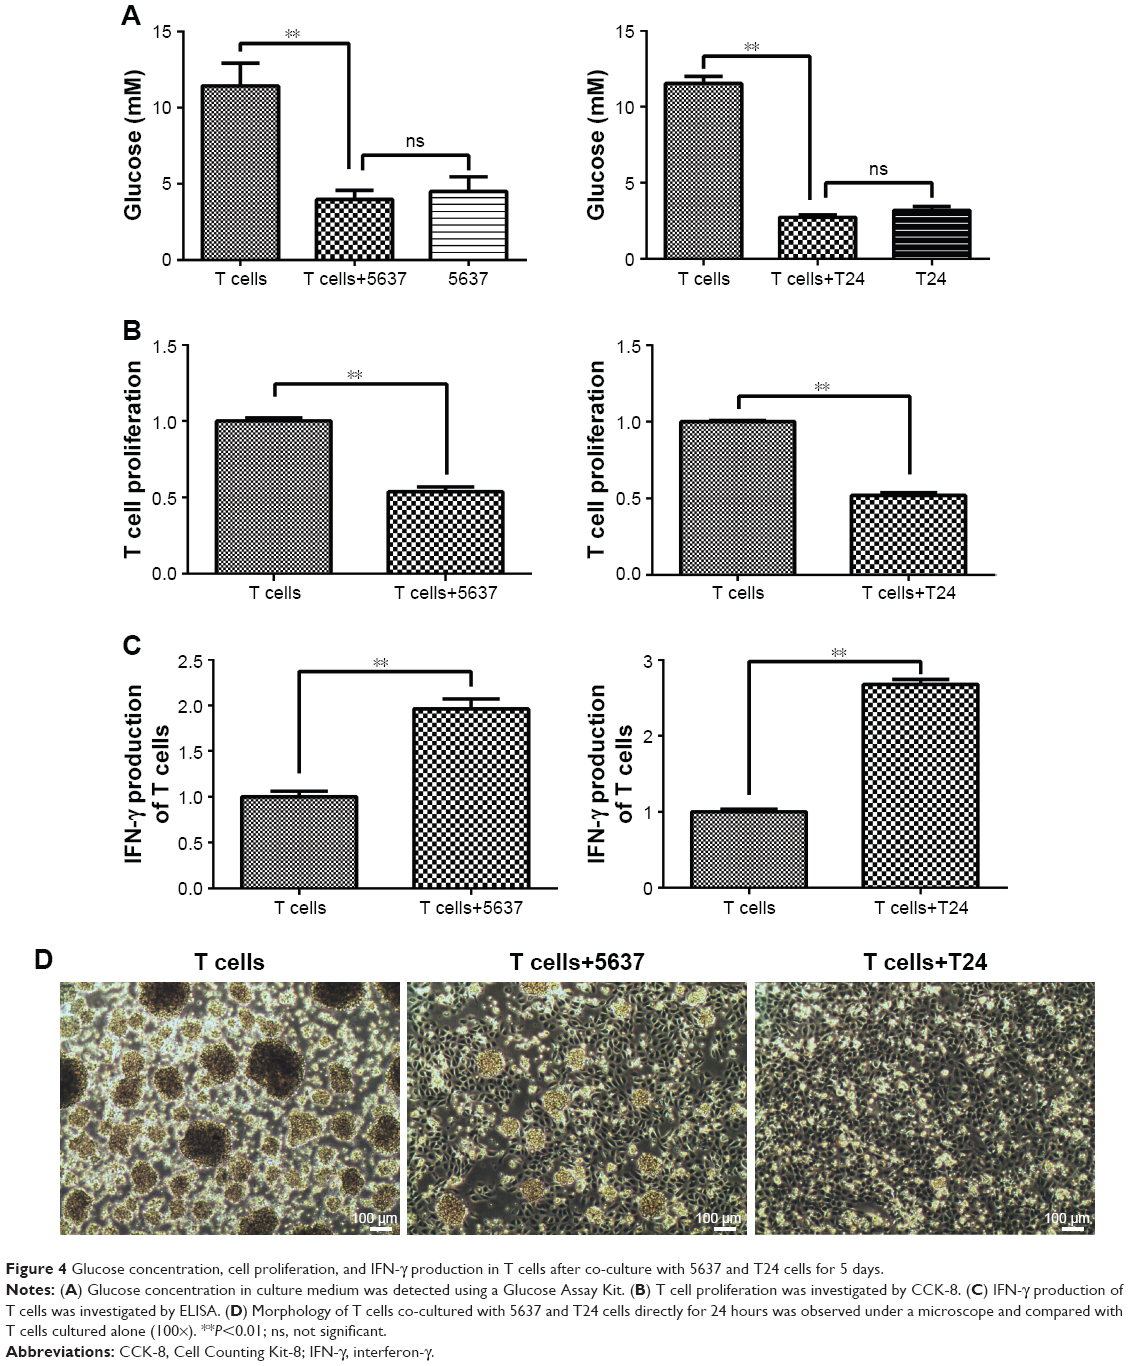 | Figure 4 Glucose concentration, cell proliferation, and IFN-γ production in T cells after co-culture with 5637 and T24 cells for 5 days. |
In addition, the gene expression associated with glycolysis and glutaminolysis was investigated in T cells after co-culture with bladder cancer cells (5637 and T24) by RT-qPCR. In T cells co-cultured with 5637 cells, the mRNA levels of the glycolytic enzymes (LDHA, TPI, and PGK1) were decreased (Figure 5A), while the levels of the glutaminolysis enzymes (GLS and GLUD1) and transporter (SLC1A5) were increased (Figure 5B). In T cells co-cultured with T24 cells, no significant changes were observed in the glycolytic enzymes (LDHA, TPI, and PGK1), which differed from the results observed in the co-culture with the 5637 cells (Figure 5C). However, the mRNA levels of the glutaminolysis enzymes (GLS and GLUD1) and transporter (SLC1A5) were increased (Figure 5D).
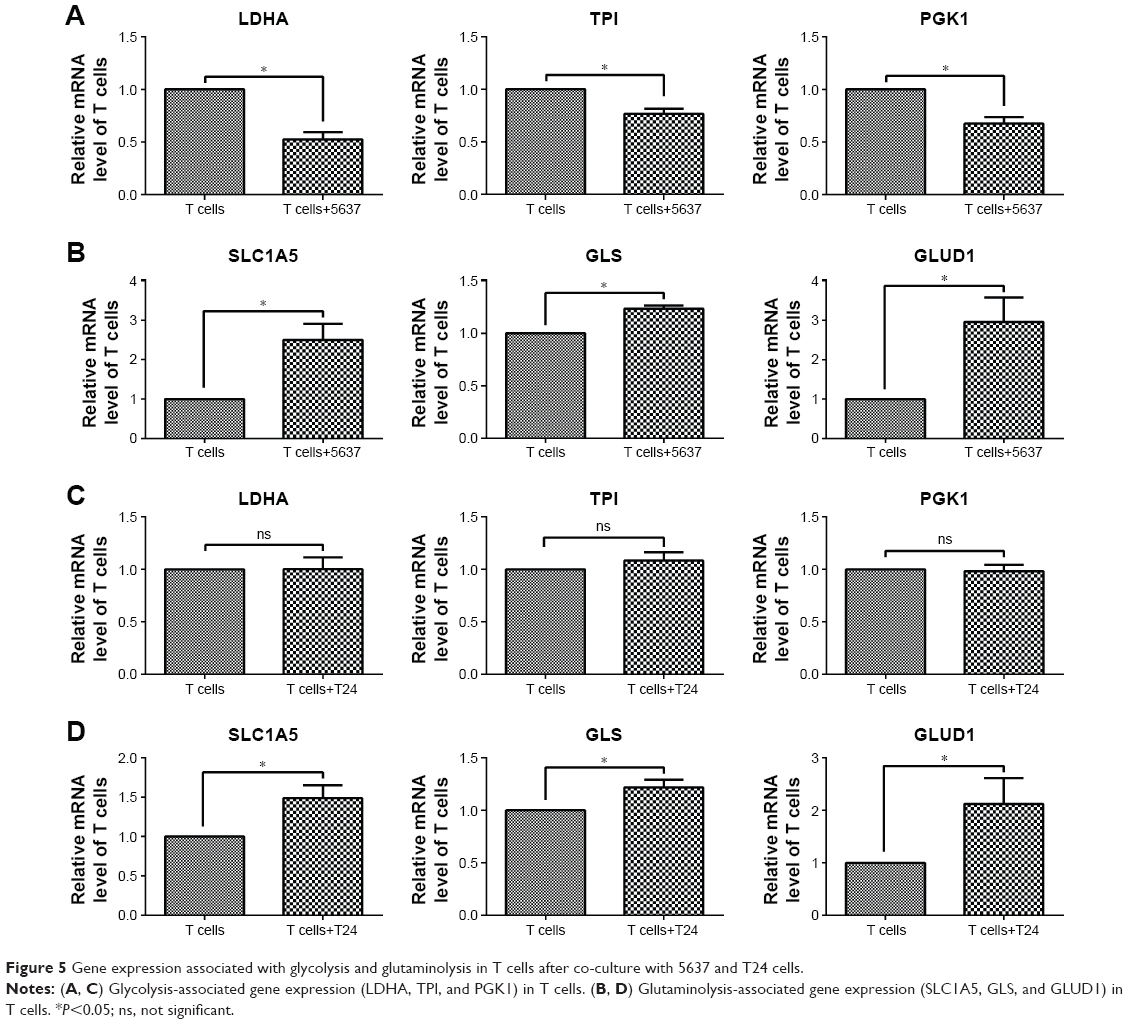 | Figure 5 Gene expression associated with glycolysis and glutaminolysis in T cells after co-culture with 5637 and T24 cells. |
In summary, the T cells cultured with bladder cancer cells were under low-glucose conditions and stimulated by the cancer cells, all of which could lead to an elevation in glutaminolysis (Figures 1 and 2). The elevated glutaminolysis contributed to the increased IFN-γ production by the T cells after the co-culture with the bladder cancer cells.
Elevated glutaminolysis in bladder cancer cells co-cultured with T cells
After culturing with T cells, the glycolytic enzymes LDHA and PGK1, but not TPI, were increased in the 5637 cells (Figure 6A), and the glutaminolysis enzymes (GLS and GLUD1) and transporter (SLC1A5) were also increased, especially the significantly elevated GLS and GLUD1 (Figure 6B). In the co-cultured T24 cells, the glycolytic enzymes (LDHA, TPI, and PGK1) showed no significant changes (Figure 6C), and the gene expression of the glutaminolysis enzymes (GLS and GLUD1) and transporter (SLC1A5) was increased (Figure 6D). Because the glucose concentration in the culture medium did not significantly differ between the cultures with and those without the T cells (Figure 4A), the elevation in glutaminolysis is unlikely to compensate for the glucose deprivation.
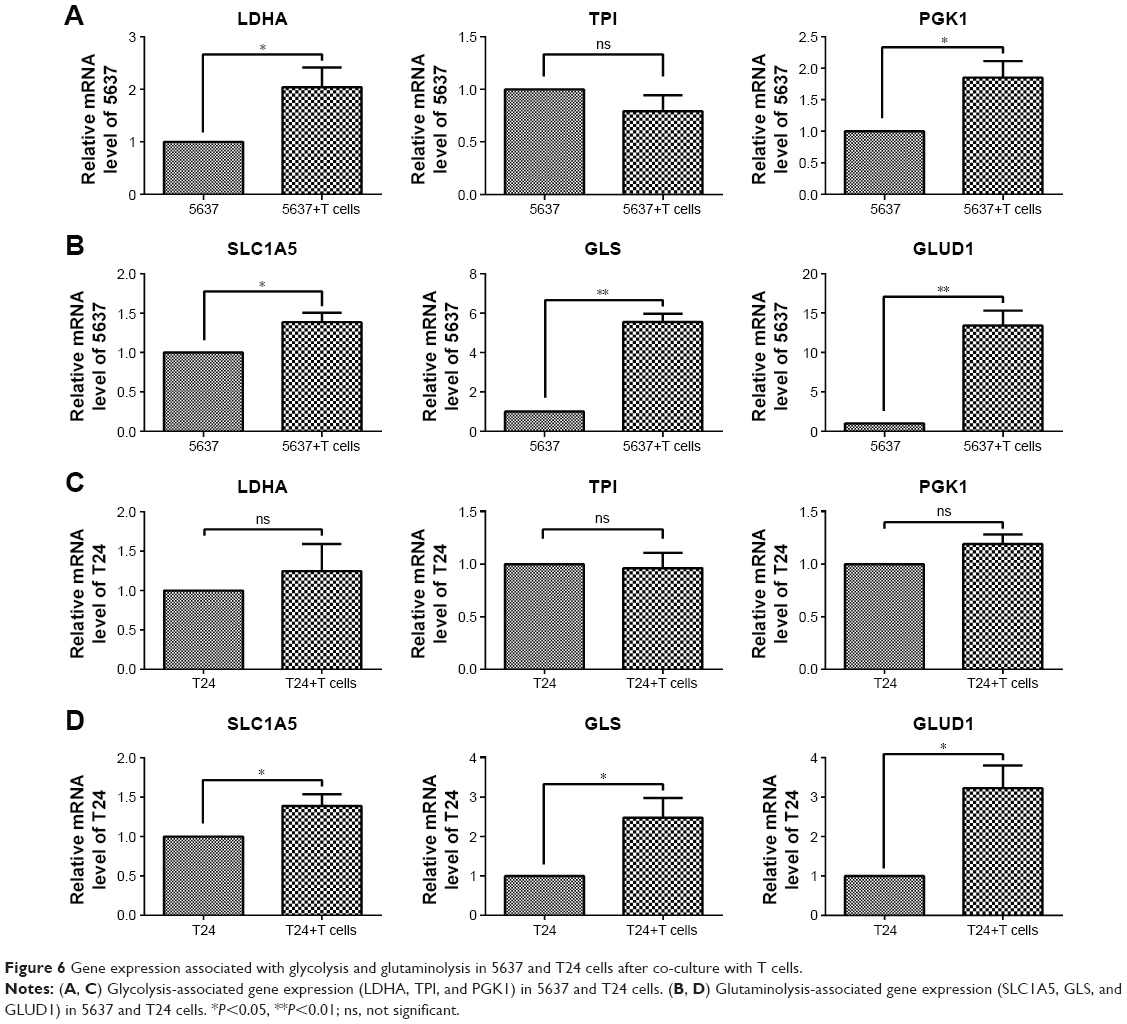 | Figure 6 Gene expression associated with glycolysis and glutaminolysis in 5637 and T24 cells after co-culture with T cells. |
Glutaminolysis contributes to the up-regulation of PD-L1 expression by IFN-γ in bladder cancer cells
The mRNA level of PD-1 did not significantly change in the T cells after the culture with the bladder cancer cells (5637 and T24) (Figure 7A), while both the mRNA and protein levels of PD-L1 were sharply elevated in the 5637 and T24 cells under the co-culture conditions (Figure 7B). This increase was mostly induced by IFN-γ produced by the T cells (Figure 4C).
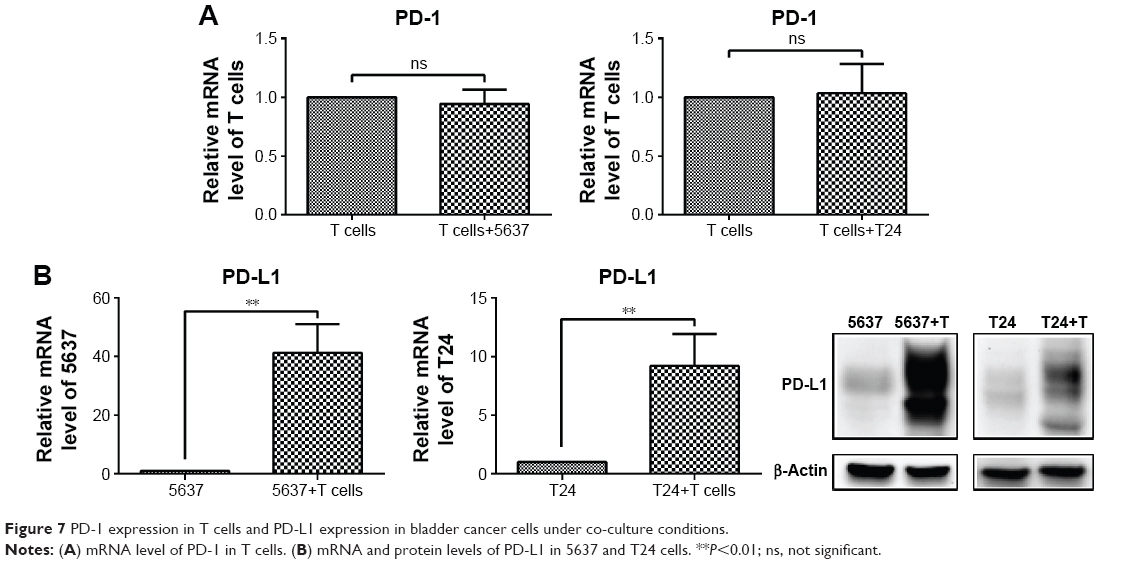 | Figure 7 PD-1 expression in T cells and PD-L1 expression in bladder cancer cells under co-culture conditions. |
To investigate the relationship between glutaminolysis and PD-L1 expression, DON, which is a glutamine analog, was used to inhibit glutamine metabolism in the bladder cancer cells. As shown in Figure 8, DON could reduce the protein expression of GLS and effectively reduce the up-regulation of PD-L1 expression induced by IFN-γ. As the dose of DON increased, the decrease in PD-L1 became more obvious. Altogether, our data clearly show that inhibiting glutamine metabolism could reduce the elevation in PD-L1 expression induced by IFN-γ in bladder cancer cells. Thus, after culturing with T cells, the elevated glutaminolysis in bladder cancer cells may contribute to the IFN-γ-induced PD-L1 expression.
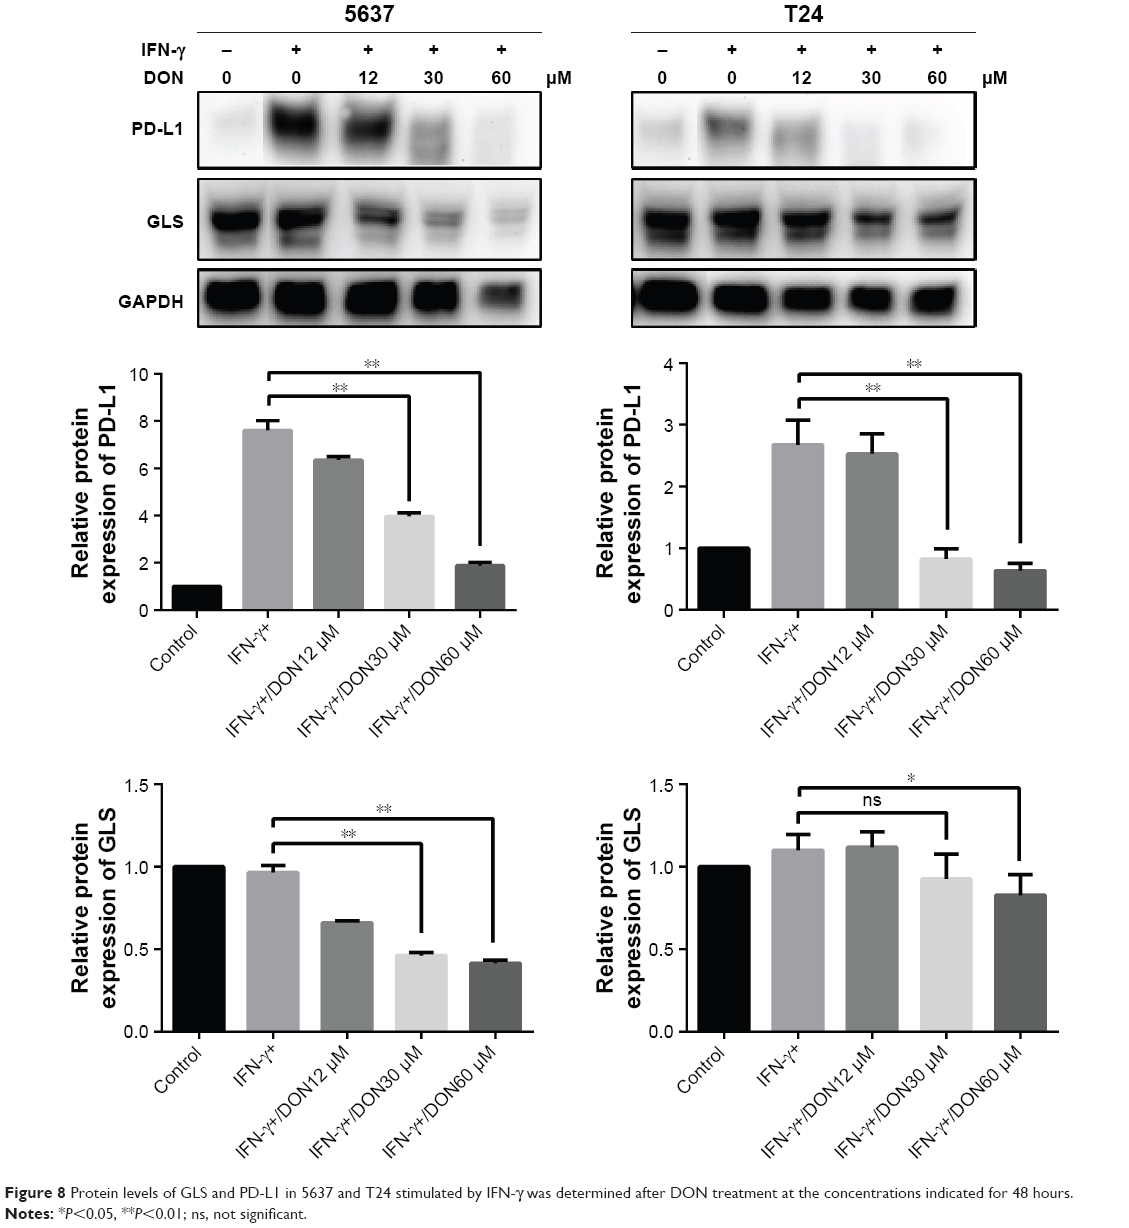 | Figure 8 Protein levels of GLS and PD-L1 in 5637 and T24 stimulated by IFN-γ was determined after DON treatment at the concentrations indicated for 48 hours. |
Discussion
Metabolic alterations associated with T cell function occur in activated T cells.21 Upon immune stimulation, T cells undergo metabolic reprogramming to increase the glycolysis rate, which is related to cell growth, proliferation, and IFN-γ production.22 Evidence suggests that mitochondrial oxidative phosphorylation is also important for T cell activation,23 including mitochondrial-derived ROS.24–26 However, in our study, the gene expression of metabolic enzymes responsible for glycolysis (LDHA, TPI, and PGK1) and glutaminolysis (SLC1A5, GLS, and GLUD1) was increased in activated T cells (Figure 1B and D), but the oxidative phosphorylation level (ND6, MTCO1, and ATP5) was decreased (Figure 1C). Thus, activated T cells prefer glycolysis and glutaminolysis over oxidative phosphorylation in obtaining fuel. Similarly, the activation of T cells has been reported to dramatically up-regulate glycolysis and glutamine consumption but down-regulate both mitochondria-dependent fatty acid β-oxidation and pyruvate oxidation via the TCA cycle.7 In addition, glutamine has been reported to be related to T cell proliferation27–29 and IFN-γ production.30,31 Thus, the elevated glutaminolysis may play an important role in activated T cells.
In the tumor microenvironment, T cells are exposed to low extracellular glucose, which is approximately ten times lower than that in the blood or spleen. The glucose uptake by Th1 cells is reduced when co-cultured with cancer cells.9 Furthermore, glucose deprivation leads to a decrease in IFN-γ production in T cells.22 To adapt to the low glucose levels, T cells promote their glutamine metabolism to maintain cellular energy and survival.32,33 We confirmed that the IFN-γ production of T cells decreased when deprived of glucose (Figure 2A). The glutaminolysis-associated gene expression was increased and glycolysis-associated gene expression was decreased in T cells under glucose-deprived conditions (Figure 2B and C). In addition, in the absence of glucose, the production of IFN-γ was severely reduced when glutamine was simultaneously deprived (Figure 2A). Thus, glutamine plays a significant role in IFN-γ production, and a compensatory glutaminolysis enhancement occurs in glucose-deprived T cells. Moreover, similarly to T cells, we found that the glutaminolysis-associated gene expression was elevated in bladder cancer cells under glucose deprivation (Figure 3B and D). The glutaminolysis enhancement may be a mechanism that compensates for the lack of glucose. Cancer cells have metabolic flexibility depending on the nutrient availability in the tumor microenvironment. For example, cancer cells can choose either oxidative phosphorylation or glycolysis for ATP generation.34
In addition, the glucose concentration in the culture medium sharply decreased when the T cells were cultured with the bladder cancer cells (Figure 4A). T cell proliferation decreased, but IFN-γ production increased (Figure 4B and C). The glutaminolysis-associated gene expression was increased in the T cells under the co-culture conditions (Figure 5B and D), and the same results were observed under the glucose-deprived conditions (Figure 2C). Thus, a compensatory glutaminolysis enhancement occurs in T cells under glucose-deprived co-culture conditions that may play an essential role in the maintenance of viability and the production of IFN-γ when cultured with bladder cancer cells. Other studies have also shown that glutamine plays an important role in IFN-γ production. Glutamine supplementation has been shown to up-regulate several IFN-γ-inducible genes and enhance the number of IFN-γ-producing CD8 T cells in latently herpes simplex virus-infected ganglia in mice, suggesting that glutamine may enhance the IFN-γ-associated immune response.35 Glutamine supplementation can also enhance IFN-γ expression in septic mice36 and murine intestinal intraepithelial lymphocytes.30
Glutaminolysis is up-regulated in cancers, and glutamine is imported into cells and converted to α-ketoglutarate for entry into the TCA cycle.5 Glutamine is among the main nutrients used by cancer cells for biosynthesis and promotes cancer cell proliferation via the mTOR pathway.37,38 The migration of melanoma cells also depends on enhanced glutaminolysis.5 Studies have shown that it is highly dependent on glutamine in platinum-resistant ovarian cancer cells, and targeting glutamine metabolism along with platinum offers a potential treatment strategy, particularly for drug-resistant ovarian cancer.39 Other studies also confirm that glutamine metabolism is a potential target for cancer therapy.40,41 These studies prove that glutamine metabolism is essential for cancer survival and progression. In this study, glutaminolysis was also enhanced in bladder cancer cells co-cultured with T cells (Figure 6B and D). However, the glucose concentration in the culture medium did not significantly differ when cultured with or without T cells (Figure 4A); thus, the elevation in glutaminolysis did not compensate for the glucose deprivation. This elevation must be associated with other biological processes to resist the adverse environment when cultured with T cells.
In the tumor microenvironment, PD-L1 expression in tumor cells is often up-regulated. Reports suggest that the mechanisms of PD-L1 up-regulation include genomic alterations, oncogenic signaling, and IFN-γ produced by TILs.42–44 IFN-γ up-regulates PD-L1 expression in gastric cancer.14 In our study, when cultured with active T cells, PD-L1 expression was sharply elevated in the 5637 and T24 cells (Figure 7B). The elevation in PD-L1 was induced by the highly potent IFN-γ, which was produced by the T cells. Several studies have shown that IFN-γ up-regulates PD-L1 expression in tumor cells via the JAK signal transducer. Li et al found that the JAK/STAT1/IRF1 pathway is the primary pathway responsible for the induction of PD-L1 expression by IFN-γ in human hepatocellular carcinoma cell lines.45 Mimura et al confirmed that the up-regulation of PD-L1 induced by the activation of IFN-γ is associated with the JAK-STAT1, but not the mitogen-activated protein kinase (MAPK) and phosphotidylinositol-3-phosphate (PI3K)–protein kinase B (Akt) pathways,14 while other reports suggest that the MAPK and PI3K-AKT pathways are also involved in the IFN-γ-induced PD-L1 overexpression.46–48 Thus, different pathways may mediate IFN-γ-regulated PD-L1 expression depending on the cell type. However, whether the nutrient metabolism contributes to this process in tumors is unknown. In this study, glutaminolysis (Figure 6B and D) and PD-L1 expression (Figure 7B) were enhanced in bladder cancer cells under the co-culture conditions. Therefore, we investigated the link between glutaminolysis and PD-L1 expression. Our data show that inhibiting glutamine metabolism could reduce the elevation in the IFN-γ-induced PD-L1 expression in bladder cancer cells (Figure 8). Thus, glutamine metabolism significantly contributes to the IFN-γ-induced PD-L1 overexpression in bladder cancer cells. However, the mechanism is not discussed in depth in this paper. Future studies should focus on the mechanism by which glutamine metabolism influences PD-L1 expression in bladder cancer cells under co-culture conditions.
Taken together, under the co-culture conditions, because of the large amount of glucose consumption by the bladder cancer cells, a compensatory glutaminolysis enhancement occurred in the T cells to maintain IFN-γ production, which finally led to PD-L1 up-regulation in the bladder cancer cells. However, the elevation of glutaminolysis in the bladder cancer cells did not compensate for the glucose deprivation but contributed to the IFN-γ-induced PD-L1 overexpression. In summary, our results indicate that glutaminolysis was elevated in bladder cancer and T cells in a simulated tumor microenvironment, which contributed to the up-regulation of PD-L1 expression.
Conclusion
Our key finding is that glutaminolysis represents a compensatory method that maintains cellular function when glucose is deprived. In the simulated tumor microenvironment, the glutaminolysis of T cells was elevated to maintain IFN-γ production in the low-glucose environment, which could up-regulate PD-L1 expression in bladder cancer cells. Meanwhile, the glutaminolysis of bladder cancer cells was also elevated, which promoted the high expression of PD-L1 induced by IFN-γ and did not compensate for the glucose deficiency. Thus, glutaminolysis likely plays an essential role in the up-regulation of PD-L1 expression by IFN-γ through driving the different functions of T cells and bladder cancer cells in the tumor microenvironment.
Acknowledgments
This work was supported by the National Natural Science Foundations of China (81772713, 81472411, 81372752, 81401899); Taishan Scholar Program of Shandong Province (tsqn20161077); Natural Science Foundation of Shandong Province (ZR2014HM088, ZR2016HQ18); Key Research and Development Program of Shandong Province (2018GSF118197); China Postdoctoral Science Foundation (2017M622144); Qingdao Postdoctoral Application Research Project; and Qingdao Young Scientist Applied Basic Research Fund (15-9-1-51-jch, 15-9-1-105-jch).
Author contributions
Conceptualization: Liping Wang, Ye Liang, and Haitao Niu; data curation: Liping Wang and Dan Li; funding acquisition: Haitao Niu; methodology, Liping Wang, Xuecheng Yang, Zhijuan Liang, Yuanbin Chen, Guofeng Ma, Yonghua Wang, and Yongxin Li; project administration: Haitao Niu; writing – original draft: Liping Wang; writing – review and editing: Ye Liang. All authors contributed to data analysis, drafting and revising the article, gave final approval of the version to be published, and agree to be accountable for all aspects of the work.
Disclosure
The authors report no conflicts of interest in this work.
References
Cairns RA, Harris IS, Mak TW. Regulation of cancer cell metabolism. Nat Rev Cancer. 2011;11(2):85–95. | ||
Hanahan D, Weinberg RA. Hallmarks of cancer: the next generation. Cell. 2011;144(5):646–674. | ||
Allison KE, Coomber BL, Bridle BW. Metabolic reprogramming in the tumour microenvironment: a hallmark shared by cancer cells and T lymphocytes. Immunology. 2017;152(2):175–184. | ||
Warburg O, Wind F, Negelein E. The metabolism of tumors in the body. J Gen Physiol. 1927;8(6):519–530. | ||
Rodrigues MF, Obre E, de Melo FH, et al. Enhanced OXPHOS, glutaminolysis and β-oxidation constitute the metastatic phenotype of melanoma cells. Biochem J. 2016;473(6):703–715. | ||
Maciver NJ, Michalek RD, Rathmell JC. Metabolic regulation of T lymphocytes. Annu Rev Immunol. 2013;31:259–283. | ||
Wang R, Dillon CP, Shi LZ, et al. The transcription factor Myc controls metabolic reprogramming upon T lymphocyte activation. Immunity. 2011;35(6):871–882. | ||
Ganeshan K, Chawla A. Metabolic regulation of immune responses. Annu Rev Immunol. 2014;32:609–634. | ||
Ho PC, Bihuniak JD, Macintyre AN, et al. Phosphoenolpyruvate Is a Metabolic Checkpoint of Anti-tumor T Cell Responses. Cell. 2015;162(6):1217–1228. | ||
Finlay DK. Starved human T lymphocytes keep fighting. Eur J Immunol. 2015;45(9):2480–2483. | ||
Chang CH, Qiu J, O’Sullivan D, et al. Metabolic Competition in the Tumor Microenvironment Is a Driver of Cancer Progression. Cell. 2015;162(6):1229–1241. | ||
Karachaliou N, Gonzalez-Cao M, Crespo G, et al. Interferon gamma, an important marker of response to immune checkpoint blockade in non-small cell lung cancer and melanoma patients. Ther Adv Med Oncol. 2018;10:1758834017749748. | ||
Boussiotis VA. Molecular and Biochemical Aspects of the PD-1 Checkpoint Pathway. N Engl J Med. 2016;375(18):1767–1778. | ||
Mimura K, Teh JL, Okayama H, et al. PD-L1 expression is mainly regulated by interferon gamma associated with JAK-STAT pathway in gastric cancer. Cancer Sci. 2018;109(1):43–53. | ||
Zhang C, Cai T, Zeng X, et al. Astragaloside IV reverses MNNG-induced precancerous lesions of gastric carcinoma in rats: Regulation on glycolysis through miRNA-34a/LDHA pathway. Phytother Res. 2018;32(7):1364–1372. | ||
da Silva MD, de Oliveira Silva RL, Ferreira Neto JRC, Benko-Iseppon AM, Kido EA. Genotype-dependent regulation of drought-responsive genes in tolerant and sensitive sugarcane cultivars. Gene. 2017;633:17–27. | ||
Kazemi-Rad E, Mohebali M, Khadem-Erfan MB, et al. Identification of antimony resistance markers in Leishmania tropica field isolates through a cDNA-AFLP approach. Exp Parasitol. 2013;135(2):344–349. | ||
Takahashi S, Saegusa J, Sendo S, et al. Glutaminase 1 plays a key role in the cell growth of fibroblast-like synoviocytes in rheumatoid arthritis. Arthritis Res Ther. 2017;19(1):76. | ||
Wallace L, Mehrabi S, Bacanamwo M, Yao X, Aikhionbare FO. Expression of mitochondrial genes MT-ND1, MT-ND6, MT-CYB, MT-COI, MT-ATP6, and 12S/MT-RNR1 in colorectal adenopolyps. Tumour Biol. 2016;37(9):12465–12475. | ||
Cetindis M, Biegner T, Munz A, et al. Glutaminolysis and carcinogenesis of oral squamous cell carcinoma. Eur Arch Otorhinolaryngol. 2016;273(2):495–503. | ||
Cham CM, Gajewski TF. Glucose availability regulates IFN-gamma production and p70S6 kinase activation in CD8+ effector T cells. J Immunol. 2005;174(8):4670–4677. | ||
Chang CH, Curtis JD, Maggi LB, et al. Posttranscriptional control of T cell effector function by aerobic glycolysis. Cell. 2013;153(6):1239–1251. | ||
Pearce EL, Poffenberger MC, Chang CH, Jones RG. Fueling immunity: insights into metabolism and lymphocyte function. Science. 2013;342(6155):1242454. | ||
Sena LA, Li S, Jairaman A, et al. Mitochondria are required for antigen-specific T cell activation through reactive oxygen species signaling. Immunity. 2013;38(2):225–236. | ||
Jones RG, Bui T, White C, et al. The proapoptotic factors Bax and Bak regulate T Cell proliferation through control of endoplasmic reticulum Ca(2+) homeostasis. Immunity. 2007;27(2):268–280. | ||
Krauss S, Brand MD, Buttgereit F. Signaling takes a breath – new quantitative perspectives on bioenergetics and signal transduction. Immunity. 2001;15(4):497–502. | ||
Hörig H, Spagnoli GC, Filgueira L, et al. Exogenous glutamine requirement is confined to late events of T cell activation. J Cell Biochem. 1993;53(4):343–351. | ||
Gabriel SS, Kallies A. Glucose- and glutamine-fueled stabilization of C-Myc is required for T-cell proliferation and malignant transformation. Cell Death Discov. 2016;2:16047. | ||
Sener Z, Cederkvist FH, Volchenkov R, Holen HL, Skålhegg BS. T Helper Cell Activation and Expansion Is Sensitive to Glutaminase Inhibition under Both Hypoxic and Normoxic Conditions. PLoS One. 2016;11(7):e0160291. | ||
Horio Y, Osawa S, Takagaki K, et al. Glutamine supplementation increases Th1-cytokine responses in murine intestinal intraepithelial lymphocytes. Cytokine. 2008;44(1):92–95. | ||
Boelens PG, Houdijk AP, Fonk JC, et al. Glutamine-enriched enteral nutrition increases in vitro interferon-gamma production but does not influence the in vivo specific antibody response to KLH after severe trauma. A prospective, double blind, randomized clinical study. Clin Nutr. 2004;23(3):391–400. | ||
Blagih J, Coulombe F, Vincent EE, et al. The energy sensor AMPK regulates T cell metabolic adaptation and effector responses in vivo. Immunity. 2015;42(1):41–54. | ||
Han F, Li G, Dai S, Huang J. Genome-wide metabolic model to improve understanding of CD4(+) T cell metabolism, immunometabolism and application in drug design. Mol Biosyst. 2016;12(2):431–443. | ||
Chaube B, Malvi P, Singh SV, et al. Targeting metabolic flexibility by simultaneously inhibiting respiratory complex I and lactate generation retards melanoma progression. Oncotarget. 2015;6(35):37281–37299. | ||
Wang K, Hoshino Y, Dowdell K, et al. Glutamine supplementation suppresses herpes simplex virus reactivation. J Clin Invest. 2017;127(7):2626–2630. | ||
Yeh CL, Hsu CS, Yeh SL, Chen WJ. Dietary glutamine supplementation modulates Th1/Th2 cytokine and interleukin-6 expressions in septic mice. Cytokine. 2005;31(5):329–334. | ||
Yuan L, Sheng X, Willson AK, et al. Glutamine promotes ovarian cancer cell proliferation through the mTOR/S6 pathway. Endocr Relat Cancer. 2015;22(4):577–591. | ||
Salabei JK, Lorkiewicz PK, Holden CR, et al. Glutamine Regulates Cardiac Progenitor Cell Metabolism and Proliferation. Stem Cells. 2015;33(8):2613–2627. | ||
Hudson CD, Savadelis A, Nagaraj AB, et al. Altered glutamine metabolism in platinum resistant ovarian cancer. Oncotarget. 2016;7(27):41637–41649. | ||
Zhan H, Ciano K, Dong K, Zucker S. Targeting glutamine metabolism in myeloproliferative neoplasms. Blood Cells Mol Dis. 2015;55(3):241–247. | ||
Bajpai R, Matulis SM, Wei C, et al. Targeting glutamine metabolism in multiple myeloma enhances BIM binding to BCL-2 eliciting synthetic lethality to venetoclax. Oncogene. 2016;35(30):3955–3964. | ||
Taube JM, Anders RA, Young GD, et al. Colocalization of inflammatory response with B7-h1 expression in human melanocytic lesions supports an adaptive resistance mechanism of immune escape. Sci Transl Med. 2012;4(127):127ra137. | ||
Marzec M, Zhang Q, Goradia A, et al. Oncogenic kinase NPM/ALK induces through STAT3 expression of immunosuppressive protein CD274 (PD-L1, B7-H1). Proc Natl Acad Sci U S A. 2008;105(52):20852–20857. | ||
Pardoll DM. The blockade of immune checkpoints in cancer immunotherapy. Nat Rev Cancer. 2012;12(4):252–264. | ||
Li N, Wang J, Zhang N, et al. Cross-talk between TNF-α and IFN-γ signaling in induction of B7-H1 expression in hepatocellular carcinoma cells. Cancer Immunol Immunother. 2018;67(2):271–283. | ||
Respa A, Bukur J, Ferrone S, et al. Association of IFN-gamma signal transduction defects with impaired HLA class I antigen processing in melanoma cell lines. Clin Cancer Res. 2011;17(9):2668–2678. | ||
Yamamoto R, Nishikori M, Tashima M, et al. B7-H1 expression is regulated by MEK/ERK signaling pathway in anaplastic large cell lymphoma and Hodgkin lymphoma. Cancer Sci. 2009;100(11):2093–2100. | ||
Liu J, Hamrouni A, Wolowiec D, et al. Plasma cells from multiple myeloma patients express B7-H1 (PD-L1) and increase expression after stimulation with IFN-{gamma} and TLR ligands via a MyD88-, TRAF6-, and MEK-dependent pathway. Blood. 2007;110(1):296–304. |
 © 2018 The Author(s). This work is published and licensed by Dove Medical Press Limited. The full terms of this license are available at https://www.dovepress.com/terms.php and incorporate the Creative Commons Attribution - Non Commercial (unported, v3.0) License.
By accessing the work you hereby accept the Terms. Non-commercial uses of the work are permitted without any further permission from Dove Medical Press Limited, provided the work is properly attributed. For permission for commercial use of this work, please see paragraphs 4.2 and 5 of our Terms.
© 2018 The Author(s). This work is published and licensed by Dove Medical Press Limited. The full terms of this license are available at https://www.dovepress.com/terms.php and incorporate the Creative Commons Attribution - Non Commercial (unported, v3.0) License.
By accessing the work you hereby accept the Terms. Non-commercial uses of the work are permitted without any further permission from Dove Medical Press Limited, provided the work is properly attributed. For permission for commercial use of this work, please see paragraphs 4.2 and 5 of our Terms.