")
Back to Journals » Drug Design, Development and Therapy » Volume 10
The effects of the insulin resistance index on the virologic response to entecavir in patients with HBeAg-positive chronic hepatitis B and nonalcoholic fatty liver disease
Authors Zhu L, Wang Y, Wei L, Zhou J, Dai W, Zhang X
Received 10 June 2016
Accepted for publication 22 July 2016
Published 30 August 2016 Volume 2016:10 Pages 2739—2744
DOI https://doi.org/10.2147/DDDT.S114761
Checked for plagiarism Yes
Review by Single anonymous peer review
Peer reviewer comments 2
Editor who approved publication: Prof. Dr. Wei Duan
Li-Yao Zhu,1,* Yu-Gang Wang,2,* Li-Qing Wei,3,* Jian Zhou,1 Wei-Jie Dai,4 Xiao-Yu Zhang5,6
1Department of Hepatology, The Fourth People’s Hospital of Huai’an, Huai’an, Jiangsu, 2Department of Gastroenterology, Shanghai Tongren Hospital, Shanghai Jiao Tong University School of Medicine, Shanghai, 3Department of Medical Laboratory, The Central Hospital of Wuhan, Tongji Medical College, Huazhong University of Science and Technology, Wuhan, Hubei, 4Department of Gastroenterology, Huai’an First People’s Hospital, Nanjing Medical University, 5Division of Gastrointestinal Surgery, Department of General Surgery, The Affiliated Huai’an Hospital of Xuzhou Medical College, 6Division of Gastrointestinal Surgery, Department of General Surgery, The Second People’s Hospital of Huai’an, Huai’an, Jiangsu, People’s Republic of China
*These authors contributed equally to this work
Purpose: To further observe and verify the effect of nonalcoholic fatty liver disease (NAFLD) on the response to antiviral therapy in patients with chronic hepatitis B (CHB) and investigate the relationship between the virologic response and insulin resistance.
Patients and methods: A retrospective study was adopted and 61 NAFLD patients with HBeAg-positive CHB were included as the observation group (group A), and 64 patients with simple CHB were included as the control group (group B).
Results: After 12 weeks of treatment with entecavir, the total virologic response rate in group A was statistically significantly lower than that in group B (P<0.05). During weeks 24–96, the difference was not statistically significant (P>0.05). In weeks 48 and 96, there was no significant difference in the HBeAg seroconversion rates between the two groups (P>0.05). In weeks 12 and 24, there was also no significant difference in the alanine transaminase (ALT) normalization rate between the two groups (P>0.05). Then, in weeks 48 and 96, the ALT normalization rate of group A was obviously lower than that of group B (P<0.05). Group A patients were divided into group A1 (≤M) and group A2 (>M) according to the median value (M=2.79) of the baseline homeostatic model assessment method insulin resistance levels. In weeks 48 and 96, the ALT normalization rate of group A1 was significantly higher than that of group A2 (P<0.05). The correlation coefficient (r) of the baseline homeostatic model assessment method insulin resistance level and the severity of fatty liver in group A was 0.426 (P=0.001).
Conclusion: NAFLD cannot affect the long-term total virologic response rate and HBeAg seroconversion rate in CHB patients treated with entecavir but can reduce the long-term biochemical response rate, which has a positive correlation with the severity of fatty liver and the insulin resistance index.
Keywords: hepatitis B virus, chronic, fatty liver, entecavir, insulin resistance index
Introduction
After years of effective prevention and control, the incidence of patients with HBsAg has been significantly reduced; however, chronic hepatitis B (CHB) is still the primary chronic liver disease that threatens people’s health in the People’s Republic of China.1,2 With the improvement in living standards, the morbidity of fatty liver disease has gradually increased, and it has become the second most common chronic liver disease surpassed only by hepatitis, especially for nonalcoholic fatty liver disease (NAFLD) due to an improper diet and lifestyle.3 Definitions of NAFLD have been proposed using biochemical criteria and hepatic imaging, such as ultrasonography (US), computed tomography, and magnetic resonance imaging.4–10 Among these definitions, the US definition has been used most frequently in Chinese research studies,4–6,11,12 and this approach has been endorsed by the Asia-Pacific regional guidelines.7–10 NAFLD is commonly associated with type II diabetes mellitus and conditions associated with metabolic syndrome. CHB is frequently associated with hepatic steatosis.13–15 Long-term studies of obese patients with the spectrum of NAFLD have shown that the progression of liver disease is predominantly observed in patients with biopsy-proven nonalcoholic steatohepatitis. As a result, the number of patients suffering from CHB with NAFLD has increased, and the complexity of liver disease has expanded, which introduces new challenges to the clinical diagnosis and treatment. NAFLD appears to be associated with insulin resistance and represents the hepatic manifestation of metabolic syndrome. Hepatic steatosis is significantly associated with entecavir treatment failure, and the metabolic factors seem to be independent of hepatic steatosis in CHB patients, therefore requiring a specific antiviral strategy for CHB patients with NAFLD.16 Not surprisingly, patients with NAFLD are at a high risk of developing metabolic complications, which may be much higher than the risk of developing liver cirrhosis.3 However, a recent study17 in Turkey found that virologic replication decreases in CHB patients in the presence of NAFLD, and NAFLD had no impact on the virologic response to entecavir along with tenofovir treatment. Therefore, in the present study, we analyzed the effect of NAFLD on the response to antiviral therapy of CHB through a retrospective clinical analysis and explored the relationship between the differences in response to therapy and insulin resistance index.
Patients and methods
Patient selection
Between June 2008 and June 2013, 125 HBeAg-positive patients with CHB received entecavir as an initial treatment at The Fourth People’s Hospital of Huai’an, Jiangsu province. Of them, 61 patients (48.8%) emerged with NAFLD. This retrospective study was performed with the approval of the ethics committee of The Fourth People’s Hospital of Huai’an. The ethics committee of The Fourth People’s Hospital of Huai’an did not require patient consent be obtained for this study, as this was a retrospective study, and all data was anonymous.
The inclusion criteria were as follows: 1) age between 18 years and 60 years; 2) a standard diagnosis of CHB and antiviral treatment indications according to the CHB prevention guidelines (2015),18 including i) patients with a history of CHB or those who are HBsAg positive for >6 months, without normal antiviral therapy; ii) patients who are HBeAg positive; iii) alanine transaminase (ALT) two or more times of the upper limit of normal; iv) hepatitis B virus (HBV) DNA ≥105 copies/mL; and v) the exclusion of other factors that lead to increases in ALT, such as another infection with hepatotropic viruses, alcohol, liver toxic drugs, autoimmune liver disease, and hepatolenticular degeneration; and 3) for patients with both CHB and fatty liver disease, the diagnosis of fatty liver must be in accordance with the diagnosis of nonalcoholic fatty liver disease (revised in 2010),9,10 which must meet two or more of the three abdominal ultrasound findings in the diagnostic criteria, including i) the echo of the near-field liver is enhanced and stronger than the kidney; ii) the echo of the far-field liver is gradually attenuated; and (iii) the intrahepatic duct structure display is not clear.
A diagnosis of fatty liver by US is defined by the presence of at least two of the following three abnormal findings: diffusely increased echogenicity “bright” liver with liver echogenicity greater than the kidney or spleen, vascular blurring, and deep attenuation of the ultrasound signal.5 In addition, the dividing standards of fatty liver based on US19 are as follows: in the mild fatty liver, the liver and hepatorenal echogenicity is increased and the diaphragm is shown clearly; in the moderate fatty liver, the echo shows an enhancement in the anterior region of the liver and the hepatorenal contrast but a weakening in the posterior region, and the diaphragm is shown less clearly; in the serious fatty liver, the echo is increased in the anterior region of the liver and weakened in the posterior region, and the diaphragm and structure of the intrahepatic bile duct are not shown clearly. All patients provided verbal informed consent to the antiviral treatment.
In this retrospective study, we assigned 61 patients with CHB and NAFLD into group A and 64 patients with only CHB into group B. We observed the effects of NAFLD in CHB patients treated with entecavir on the virology, serology, and biochemical responses. Hepatitis B virus serum markers (HBsAG, anti-HBs, HBeAg, anti-HBe, and anti-HBc) were tested by enzyme-linked immunosorbent assay. The fluorescent quantitative polymerase chain reaction test was used to test the serum HBV-DNA level. ALT, fasting blood glucose (FBG), concentrations of triglyceride, total cholesterol, high-density lipoprotein cholesterol, and low-density lipoprotein cholesterol in serum were measured using an automatic serum biochemical assay device. Using the radioimmunity method to determine the fasting insulin level, we then estimated insulin sensitivity by homeostasis model assessment method insulin resistance (HOMA-IR = fasting serum insulin × FBG/22.5). Standard methods were used to measure the height, waist circumference, and body mass. Body mass index = body mass (kg)/height (m).2 All patients’ liver ultrasound results were evaluated by an ultrasound doctor, and unified diagnostic reports were issued. The evaluation criteria were as follows: biochemical response to the serum ALT returned to normal; complete virologic response referred to the serum DNA-HBV load of <500 copies/mL; and HBeAg seroconversion referred to HBeAg negative and anti-HBe positive.
Statistical analysis
The SPSS 21.0 statistical software (IBM Corporation, Armonk, NY, USA) was used for the statistical analysis. The measurement data were shown as mean ± standard deviation, the mean value of the two samples was compared by t-test, and the rate was compared by χ2 test. Spearman correlation analysis was used to compare the correlation between the severity of fatty liver and the HOMA-IR index. All statistical tests were two sided and evaluated at the 0.05 alpha level.
Results
The two groups were well-matched in terms of age, sex, ALT levels, HBV-DNA levels, genotyping, and low-density lipoprotein cholesterol levels (P>0.05). The patients in group A showed a higher level of body mass index, waist circumference, fasting serum insulin, FBG, HOMA-IR, triglyceride, total cholesterol, and high-density lipoprotein cholesterol compared with group B (P<0.05), and all these variables were statistically significantly different. The propensity scores generated from the variables before antiviral therapy are listed in Table 1.
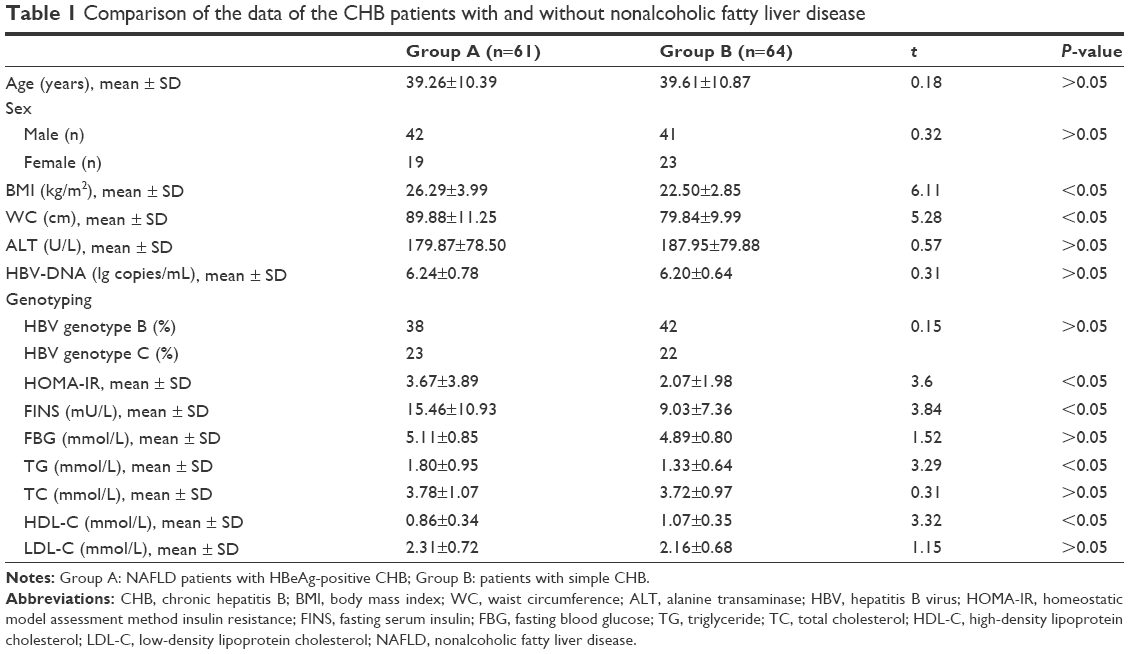 | Table 1 Comparison of the data of the CHB patients with and without nonalcoholic fatty liver disease |
In both group A and group B, the HBV-DNA untestable rate (HBV-DNA level <500 copies/mL) increased gradually after treatment with entecavir. However, there was a difference in the HBV-DNA untestable rate at different follow-up time points. After 12 weeks of entecavir therapy, the total virologic response rate in group A was lower than that in group B (group A 32.8% vs group B 51.6%, P=0.034). However, after 24, 48, and 96 weeks, the differences were not statistically significant (group A 52.5%, 62.3%, 82.0% vs group B 64.1%, 75.0%, 85.9%; P=0.188, P=0.125, P=0.545, respectively; Table 2).
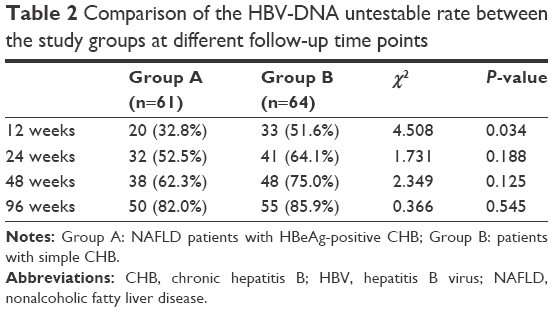 | Table 2 Comparison of the HBV-DNA untestable rate between the study groups at different follow-up time points |
For both group A and group B, the HBeAg seroconversion rate increased gradually after entecavir treatment. The HBeAg seroconversion rate was equivalent for both groups at 48 and 96 weeks (group A 21.3%, 29.5% vs group B 23.4%, 32.8%; P=0.776, P=0.690, respectively; Table 3).
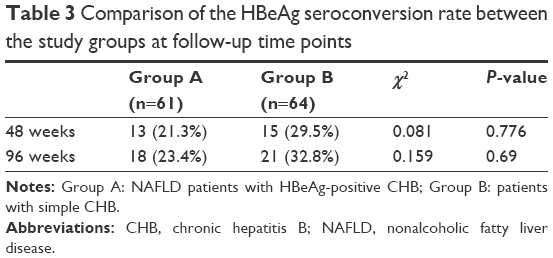 | Table 3 Comparison of the HBeAg seroconversion rate between the study groups at follow-up time points |
After entecavir treatment, the ALT normalization rate increased gradually (Table 4). An equivalent percentage of patients’ serum ALT levels returned to normal in each cohort at 12 and 24 weeks (group A 50.8%, 55.7% vs group B 59.4%, 65.5%; P=0.336, P=0.258, respectively). However, at 48 and 96 weeks, the ALT normalization rates were significantly lower in group A than in group B (group A 65.6%, 82.0% vs group B 81.3%, 93.8%; P=0.047, P=0.043, respectively).
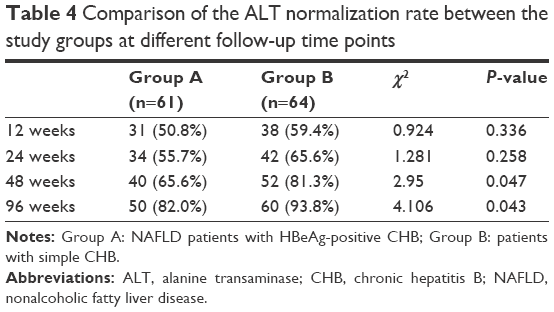 | Table 4 Comparison of the ALT normalization rate between the study groups at different follow-up time points |
According to the baseline level of the HOMA-IR median (M=2.79), the 61 patients in group A were divided into two groups (group A1, IR ≤M, 31 patients and group A2, IR >M, 30 patients). Table 5 shows that the A1 patients’ ALT normalization rates were higher than those of A2 patients at 48 and 96 weeks (group A1 77.4%, 93.5% vs group A2 53.3%, 70.0%; P=0.048, P=0.017, respectively).
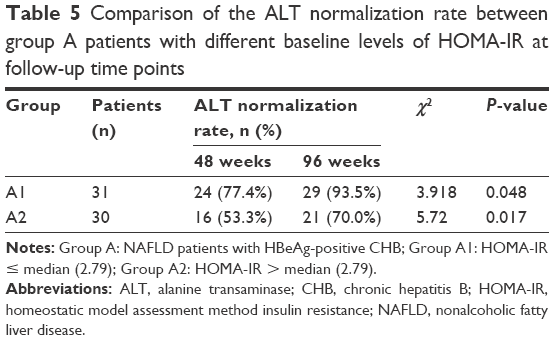 | Table 5 Comparison of the ALT normalization rate between group A patients with different baseline levels of HOMA-IR at follow-up time points |
The 61 patients in group A were divided into three groups according to the severity of the fatty liver determined by ultrasonic results. Of them, 30 patients were categorized as mild, 22 patients were categorized as moderate, and 9 patients were categorized as severe. The severity of the pathological changes due to the fatty liver was positively correlated with HOMA-IR (r=0.426, P=0.001; Table 6).
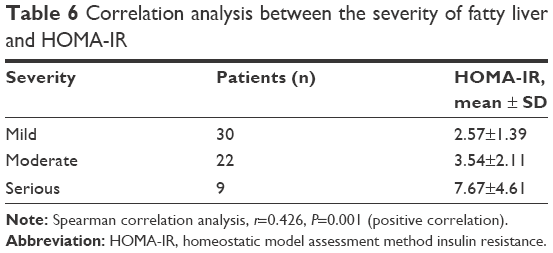 | Table 6 Correlation analysis between the severity of fatty liver and HOMA-IR |
Discussion
The key to treating CHB is antiviral therapy, and there are many guidelines for treatment programs. However, there is no clear antiviral treatment program for CHB patients who also have NAFLD, and it is unknown whether the antiviral effect is affected by the fatty infiltration of the liver. Therefore, there is no consensus, and it has gradually become a hot issue of public concern.
Ates et al20 found that the occurrence of hepatic steatosis is significantly higher in CHB patients, and this association leads to a trend of decreased, but statistically insignificant, sustained virologic response rates to 48-week PEGylated interferon treatment. Jin et al16 investigated the effect of hepatic steatosis, a common hepatocyte change in NAFLD, on antiviral therapy in patients with CHB. They found that hepatic steatosis is significantly associated with entecavir treatment failure and that metabolic factors are independent of hepatic steatosis in CHB patients, which calls for a specified antiviral strategy in CHB patients with NAFLD.
The purpose of this study was to observe and verify the effects of NAFLD on the antiviral therapy response in patients with CHB and investigate the relationship between the response differences and the insulin resistance index. In our study, the HBV-DNA clearance rate was lower in patients with NAFLD than that of the CHB group at 12 weeks, but it was equivalent at 24, 48, and 96 weeks. The results indicated that NAFLD may affect the rate of early viral response in CHB, but it would not affect the long-term treatment virologic response rate. However, this result was not consistent with that of Jin et al.16 Considering the HBeAg seroconversion rate, we found that there were no significant differences between the two groups at 48 and 96 weeks, which suggested that NAFLD was not affecting patients’ HBeAg seroconversion rate with CHB. Unfortunately, the aforementioned finding was also different from that of Jin et al.16
The ALT normalization rate indicated that there were significant differences between the two groups after treatment with entecavir for 48 and 96 weeks but showed an equivalent percentage at 12 and 24 weeks. The results we observed suggested that NAFLD did not affect the early biochemical response rate in CHB patients, which might be due to the early use of drugs to protect the liver and reduce enzymes. However, it might affect the long-term biochemical response rate, which is consistent with the results of related studies.16
According to the demographic information and baseline of the two groups, it was demonstrated that the occurrence of NAFLD was not related to viral factors and ALT levels, while the disorder of the metabolism and insulin resistance might play an important role. Further studies found that the level of insulin resistance was positively correlated with the severity of the fatty liver in group A (r=0.426, P=0.001). The subgroup analysis of group A indicated that the baseline levels of HOMA-IR and the biochemical responses were negatively correlated, which was more apparent when treatment period was longer.
Admittedly, there are many limitations to this study. First, the diagnosis may be biased without a liver biopsy at the baseline diagnosis. Furthermore, the sample of observed patients is small. Finally, there are differences in the conclusion when compared with related research. Future research should increase the number of observed patients and conduct liver biopsies at baseline to provide a reference for clinical diagnosis and treatment.
Conclusion
The results of this study indicated that NAFLD may decrease the total virologic response rate in patients with CHB over a short period of time, but it does not affect the long-term total virologic response rate and HBeAg seroconversion rate. NAFLD may not have a significant effect in the short-term on the biochemical response rate in CHB patients, but it can decrease the biochemical response rate in long-term treatment, and the decrease in the biochemical response rate is related to the severity of NAFLD, especially the insulin resistance index.
Acknowledgment
This study was supported by the Key Project of Research and Development of Huai’an (HAS2015009).
Disclosure
The authors report no conflicts of interest in this work.
References
Liang X, Bi S, Yang W, et al. Reprint of: epidemiological serosurvey of hepatitis B in China – declining HBV prevalence due to hepatitis B vaccination. Vaccine. 2013;31(suppl 9):J21–J28. | ||
Liang X, Bi S, Yang W, et al. Epidemiological serosurvey of hepatitis B in China – declining HBV prevalence due to hepatitis B vaccination. Vaccine. 2009;27(47):6550–6557. | ||
Fan JG, Farrell GC. Epidemiology of non-alcoholic fatty liver disease in China. J Hepatol. 2009;50(1):204–210. | ||
Fatty Liver and Alcoholic Liver Disease Study Group of Chinese Liver Disease Association. [Diagnostic criteria of nonalcoholic fatty liver disease]. Zhonghua Gan Zang Bing Za Zhi. 2003;11(2):71. Chinese. | ||
Yajima Y, Ohta K, Narui T, Abe R, Suzuki H, Ohtsuki M. Ultrasonographical diagnosis of fatty liver: significance of the liver-kidney contrast. Tohoku J Exp Med. 1983;139(1):43–50. | ||
Zeng MD, Fan JG, Lu LG, et al. Guidelines for the diagnosis and treatment of nonalcoholic fatty liver diseases. J Dig Dis. 2008;9(2):108–112. | ||
Farrell GC, Chitturi S, Lau GK, Sollano JD. Guidelines for the assessment and management of non-alcoholic fatty liver disease in the Asia-Pacific region: executive summary. J Gastroenterol Hepatol. 2007;22(6):775–777. | ||
Chitturi S, Farrell GC, Hashimoto E, et al. Non-alcoholic fatty liver disease in the Asia-Pacific region: definitions and overview of proposed guidelines. J Gastroenterol Hepatol. 2007;22(6):778–787. | ||
Fan JG, Jia JD, Li YM, et al. Guidelines for the diagnosis and management of nonalcoholic fatty liver disease: update 2010: (published in Chinese on Chinese Journal of Hepatology. 2010;18:163–166). J Dig Dis. 2011;12(1):38–44. | ||
Jian-gao F. Guidelines for management of nonalcoholic fatty liver disease: an updated and revised edition. Zhonghua Gan Zang Bing Za Zhi. 2010;18(3):163–166. | ||
Amarapurkar DN, Hashimoto E, Lesmana LA, et al. How common is non-alcoholic fatty liver disease in the Asia-Pacific region and are there local differences? J Gastroenterol Hepatol. 2007;22(6):788–793. | ||
Fan JG, Saibara T, Chitturi S, et al. What are the risk factors and settings for non-alcoholic fatty liver disease in Asia-Pacific? J Gastroenterol Hepatol. 2007;22(6):794–800. | ||
Hayman AV, Sofair AN, Manos MM, et al. Prevalence and predictors of hepatic steatosis in adults with newly diagnosed chronic liver disease due to hepatitis C. Medicine (Baltimore). 2009;88(5):302–306. | ||
Gordon A, McLean CA, Pedersen JS, Bailey MJ, Roberts SK. Hepatic steatosis in chronic hepatitis B and C: predictors, distribution and effect on fibrosis. J Hepatol. 2005;43(1):38–44. | ||
Persico M, Iolascon A. Steatosis as a co-factor in chronic liver diseases. World J Gastroenterol. 2010;16(10):1171–1176. | ||
Jin X, Chen YP, Yang YD, Li YM, Zheng L, Xu CQ. Association between hepatic steatosis and entecavir treatment failure in Chinese patients with chronic hepatitis B. PLoS One. 2012;7(3):e34198. | ||
Ceylan B, Arslan F, Batirel A, et al. Impact of fatty liver on hepatitis B virus replication and virologic response to tenofovir and entecavir. Turk J Gastroenterol. 2016;27(1):42–46. | ||
Chinese Society of Hepatology, Chinese Medical Association; Chinese Society of Infectious Diseases, Chinese Medical Association; Hou JL, Lai W. [The guideline of prevention and treatment for chronic hepatitis B: a 2015 update]. Zhonghua Gan Zang Bing Za Zhi. 2015;23(12):888–905. Chinese. | ||
Icer S, Coskun A, Ikizceli T. Quantitative grading using grey relational analysis on ultrasonographic images of a fatty liver. J Med Syst. 2012;36(4):2521–2528. | ||
Ates F, Yalniz M, Alan S. Impact of liver steatosis on response to pegylated interferon therapy in patients with chronic hepatitis B. World J Gastroenterol. 2011;17(40):4517–4522. |
 © 2016 The Author(s). This work is published and licensed by Dove Medical Press Limited. The full terms of this license are available at https://www.dovepress.com/terms.php and incorporate the Creative Commons Attribution - Non Commercial (unported, v3.0) License.
By accessing the work you hereby accept the Terms. Non-commercial uses of the work are permitted without any further permission from Dove Medical Press Limited, provided the work is properly attributed. For permission for commercial use of this work, please see paragraphs 4.2 and 5 of our Terms.
© 2016 The Author(s). This work is published and licensed by Dove Medical Press Limited. The full terms of this license are available at https://www.dovepress.com/terms.php and incorporate the Creative Commons Attribution - Non Commercial (unported, v3.0) License.
By accessing the work you hereby accept the Terms. Non-commercial uses of the work are permitted without any further permission from Dove Medical Press Limited, provided the work is properly attributed. For permission for commercial use of this work, please see paragraphs 4.2 and 5 of our Terms.