")
Back to Journals » OncoTargets and Therapy » Volume 9
The effects of miR-1207-5p expression in peripheral blood on cisplatin-based chemosensitivity of primary gallbladder carcinoma
Authors Shen E, Liu B, Yu X, Xiang Z, Huang H
Received 25 November 2015
Accepted for publication 10 March 2016
Published 20 June 2016 Volume 2016:9 Pages 3633—3642
DOI https://doi.org/10.2147/OTT.S101310
Checked for plagiarism Yes
Review by Single anonymous peer review
Peer reviewer comments 4
Editor who approved publication: Professor Min Li
Er-Dong Shen,1 Bo Liu,2 Xin-Shuang Yu,3 Zhen-Fei Xiang,4 Hui-Yun Huang5
1Department of Oncology, The First People’s Hospital of Yueyang, Yueyang, 2Department of General Surgery, The Second Xiangya Hospital of Central South University, Changsha, 3Department of Radiotherapy, Qianfou Mount Hospital of Shandong Province, Jinan, 4Department of Radiotherapy, Ningbo Medical Treatment Center Lihuili Hospital, Ningbo, 5Department of Dermatology, The First People’s Hospital of Yueyang, Yueyang, People’s Republic of China
Objective: The aim of this study was to investigate the association between miR-1207-5p expression in peripheral blood and the chemosensitivity of primary gallbladder carcinoma (PGBC).
Methods: A total of 85 patients with PGBC undergoing preoperative chemotherapy were divided into effective (n=18) and ineffective (n=67) groups. Another 70 healthy individuals were selected as the control group. An miR-1207-5p mimic (mimic group), an inhibitor (inhibitor group), and a negative control (NC group) sequence were transfected into human gallbladder carcinoma GBC-SD cells. Real-time quantitative polymerase chain reaction was used to determine miR-1207-5p expression. After 48 hours of cisplatin treatment, CCK-8 method was used to detect cell proliferation and flow cytometry were performed to examine cell apoptosis.
Results: miR-1207-5p expression in peripheral blood was significantly associated with tumor node metastasis staging of PGBC (P<0.05). Before chemotherapy, miR-1207-5p expression in patients was higher than in healthy individuals (P<0.05). After chemotherapy, the effective group had lower miR-1207-5p expression than the ineffective group (P<0.05). The rates of positive expression of Ki67 protein in the effective group were significantly lower than those in the ineffective group (P<0.05). Receiver operating characteristic curves showed that the area under curve, sensitivity, and specificity of miR-1207-5p used to diagnose PGBC were 0.898, 77.6%, and 97.1% at a cutoff of 1.470, respectively. After 48 hours of cisplatin treatment, compared with the NC group and nontransfected (non-T) group, the mimic group had decreased rates of cell inhibition and apoptosis, but the inhibitor group had increased rates (all P<0.05). The expression levels of caspase3 protein were increased in the mimic group and decreased in the inhibitor group. Cell survival rates in the mimic group at different time points after cisplatin treatment were significantly higher than the corresponding rates in the NC and non-T groups, whereas the cell survival rates in the inhibitor group were significantly lower than the rates in the NC and non-T groups (all P<0.05). The concentration and action time of cisplatin were negatively associated with the cell survival rate in each group (all P<0.05).
Conclusion: Cisplatin-based chemosensitivity of PGBC increased as expression of miR-1207-5p in peripheral blood declined. Thus, miR-1207-5p appears to be a promising and novel chemosensitizer for the treatment of PGBC.
Keywords: primary gallbladder carcinoma, miR-1207-5p, peripheral blood, chemosensitizer, diagnosis, cisplatin
Introduction
Primary gallbladder carcinoma (PGBC) is a malignant gastrointestinal cancer with high mortality, and the mortality of PGBC ranks sixth among gastrointestinal cancers worldwide.1 Despite a relatively low incidence (2.5 per 100,000 individuals), the median survival time for PGBC patients varies from 2 to 19 months depending on the stage of disease.2,3 The incidence of PGBC varies with geographic region, sex, and age. The prevalence increases with age, and females have an approximately threefold higher incidence than males.3 In the Western world, chronic cholecystitis and cholelithiasis are the primary factors related to PGBC.4 Interestingly, early diagnosis, identification of high-risk factors, and surgical management may offer a potential cure for PGBC patients.5 However, PGBC is difficult to diagnose in the initial stage, and <10% of patients are candidates for curative resection.1,6 With the progress in adjuvant chemotherapy drugs, drug side effects are repressed as much as possible, and the combination of surgical management and chemoradiotherapy has achieved good outcomes. Despite progress in PGBC research, the molecular markers associated with chemosensitivity of PGBC have not yet been fully elucidated.7
MicroRNAs (miRNAs) are a class of noncoding RNAs that are 18–25 nucleotides in length and play important roles in various cellular processes, including proliferation, differentiation, metabolism, and apoptosis.8,9 Previous studies have demonstrated that miRNAs expression varies in human cancers, such as esophageal cancer and colorectal cancer, and that these molecules function as tumor suppressors or oncogenes.10,11 Among the miRNA families, miR-1207-5p is highly expressed in gastrointestinal cancers. It has been reported that miR-1207-5p is involved in suppressing gastric cancer growth and invasion, which is an independent risk factor for gastric cancer lymph node metastasis.12,13 In esophageal carcinoma, miR-1207-5p is associated with cancer progression by targeting STOML-2.9 However, the role of miR-1207-5p in PGBC, especially its effect on therapeutic chemosensitivity, has not been well documented. Given that molecular markers associated with PGBC chemosensitivity aid in producing better outcomes,14,15 miR-1207-5p represents a novel target and may yield insights into PGBC therapy. In the present study, we investigated the role of miR-1207-5p in PGBC and its clinical application. Our study will lead to a novel strategy for the diagnosis and treatment of PGBC.
Materials and methods
Subjects
A total of 85 patients with PGBC undergoing cisplatin-based chemotherapy who were admitted to the Department of Oncology at the First People’s Hospital of Yueyang from October 2011 to October 2014 were enrolled in our study. Each chemotherapy regimen was repeated every 3–4 weeks. After two to three chemotherapy cycles, there were three patients in complete remission (CR), 15 in partial remission (PR), 65 with stable disease (SD), and two with progressive disease (PD) identified based on the Response Evaluation Criteria in Solid Tumors (RECIST) recommended by the World Health Organization (WHO).16 The effective group (CR + PR, n=18) had a mean age of 62.50±7.98 years and a mean body mass index (BMI) of 22.05±2.90 kg/m2, whereas the ineffective group (SD + PD, n=67) had a mean age of 58.15±10.23 years and a mean BMI of 22.20±2.51 kg/m2. Another 70 healthy individuals were selected as the control group; these patients had a mean age of 59.59±8.48 years and a mean BMI of 23.15±2.09 kg/m2. The inclusion criteria for PGBC were as follows: 1) gallbladder occupation or abnormal thickening of the gallbladder wall and other tumor lesions found by ultrasound, computed tomography (CT), and magnetic resonance imaging (MRI) examinations; 2) normal blood counts before chemotherapy (white blood cell >4×10⁹/L, neutrophil granulocyte >2×10⁹/L, platelet count >800×109/L), no severe liver function damage or other serious complications, and a normal electrocardiogram; 3) an expected survival time >3 months; 4) a tumor in the local PD phase and a measurable lesion identified based on RECIST that was not resected; 5) no radiochemotherapy before enrollment except cisplatin-based chemotherapy; 6) no history of other malignant tumors; 7) complete clinical data; and 8) agreement to receive all relevant questionnaire surveys and undergo all venous blood draws. We excluded patients with allergies to cisplatin, pregnant or breast-feeding females, and patients who died from cardiovascular and cerebrovascular diseases that were not induced by tumors. Additionally, there were no pregnant or breast-feeding females in the control group. There was no significant difference in age and sex among the three groups (all P>0.05). This study was approved by the Ethics Committee of the First People’s Hospital of Yueyang. Written informed consent was obtained from all patients.
Chemotherapy regimen and evaluation of curative effects
All of the PGBC patients displayed thick wall-type, nodular-type, or solid mass-type tumors during ultrasound, CT, and MRI examinations. In the thick wall-type tumor, the gallbladder wall was thickened irregularly at specific locations or diffusely. There was local irregular protuberance, blurry gallbladder contour, and rough wall, and it was difficult to distinguish the tumor from acute cholecystitis or chronic cholecystitis. The nodular type displayed small lumps or nodules with irregular shapes in the gallbladder wall and clear gallbladder contours and was generally not accompanied by infiltration of adjacent structures. Finally, the solid mass type displayed no liquid dark area in the gallbladder cavity, a large inhomogeneous soft tissue mass in the gallbladder fossa, an uneven echo mass in the gallbladder cavity, and infiltration of surrounding structures and signs of adjacent metastasis. Forty-nine patients were treated with an intravenous infusion of 100 mg/m2 oxaliplatin for 1 day and orally administered 40–60 mg/m2 tegafur twice a day for between 1 and 14 days or for 21 days for one cycle. Thirty-three patients were treated with an intravenous infusion of 130 mg/m2 oxaliplatin for 1 day and orally administered 1,000 mg/m2 capecitabine twice a day, for totally 1–14 days or 21 days for one cycle. Finally, three patients were treated with only an intravenous infusion of 100 mg/m2 oxaliplatin for 1 day. After two to three cycles and according to the RECIST recommended by the WHO,16 PGBC was classified using the following terms: 1) CR, where all of the target lesions disappeared and the short diameter of all pathological lymph nodes was reduced to <10 mm; 2) PR, where the sum of the target lesion diameters decreased by at least 30% compared with the baseline level; 3) SD, where the target lesions were between CR and PR; and 4) PD, where the sum of the target lesion diameters increased by at least 20% compared with the minimum value of the sum of the measured target lesion diameters during the entire experiment, the absolute value of the sum of the diameters increased at least 5 mm, or one or more new lesions appeared.
Immunohistochemical detection of Ki67 protein expression
Tissue slices were obtained from patients in the effective and ineffective group during the operation after chemotherapy; adjacent tissues that were 5 cm away from cancer tissues were also obtained. All of the specimens were fixed in 10% formaldehyde and embedded in paraffin. The detection of Ki67 was conducted with streptavidin peroxidase. The primary antibody was produced by the Shanghai Santa Cruz Company (Shanghai, People’s Republic of China). According to kit instructions, paraffin sections were dehydrated and dewaxed, rinsed with distilled water, microwave repaired, stained with 3,3′-diaminobenzidine tetrahydrochloride, washed, stained with hematoxylin, and finally mounted. Phosphate-buffered saline (PBS) replaced primary antibody as a negative control. Cells that were positive for Ki67 exhibited brown granules in the nucleus, and each slice was randomly observed in ten representative high-power fields. One hundred tumor-positive cells were counted, and color in ≤10% of these cells was regarded as negative, whereas color in >10% was regarded as positive.
Cell culture
The human gallbladder cancer cell line GBC-SD was purchased from the Shanghai Institute of Biochemistry and Cell Biology at the Chinese Academy of Sciences. The cells were maintained in Roswell Park Memorial Institute (RPMI) medium 1640 supplemented with 10% fetal bovine serum at 37°C in a humidified incubator with 5% CO2. The GBC-SD cells in logarithmic growth phase were transfected by electroporation.17 Before electroporation, the culture medium was removed from the cells, and the cells were washed with Hank’s fluid twice before 1 mL of 0.25% tryptase and 0.02% ethylene diamine tetraacetic acid were added to the cells, which were incubated at 37°C for 4 minutes. Then, 1 mL of normal culture medium was added to the tryptase to stop the digestion. The cell suspension was extracted, transferred into Eppendorf tubes, and centrifuged at 1,000 rpm for 5 minutes at room temperature. The supernatant was removed, and the cells were resuspended in electroporation buffer. The cell suspension and transfected sequences were added into a 2 mm electric rotary cup, mixed evenly, and incubated in an ice bath for 5–10 minutes. The electric rotary cup was put into the electric rotary slot, and electroporation was conducted at 450 V and 500 μF. Then, the cells were divided into the following four groups: 1) the mimic group (transfected with the miR-1207-5p mimic: 5′-UGGCAGGGAGGCUGGGAGGGG-3′), 2) the inhibitor group (transfected with the miR-1207-5p inhibitor: 5′-CCCCUCCCAGCCUCCCUGCCA-3′), 3) the negative control group (NC group, transfected with negative control: 5′-UUCUCCGAACGUGUCACGU-3′), and 4) the nontransfected (non-T) group. All of the oligonucleotides were purchased from Qiagen NV (Venlo, the Netherlands). After 6 hours, the cells were cultured by the addition of regular nutrient solutions.
Real-time quantitative polymerase chain reaction
Total RNA isolation was carried out with the serum from the venous blood of PGBC patients before chemotherapy, the serum of healthy controls, and the GBC-SD cells from four groups after 48 hours of transfection using the TRIzol method.18 Total RNA content was measured with an ND-1000 Spectrophotometer (NanoDrop Products; Thermo Fisher Scientific, Waltham, MA, USA). Total RNA purity and concentration were measured with an ultraviolet spectrophotometer, and the integrity of the total RNA was also examined by agarose gel electrophoresis. cDNA was synthesized using the PrimeScript™ 1st Strand cDNA Synthesis Kit (TaKaRa Biotechnology [Dalian] Co., Ltd., Dalian, People’s Republic of China). Each group was placed in three wells, with U6 as an internal reference, to determine the relative expression of miR-1207-5p. Real-time quantitative polymerase chain reaction (RT-qPCR) was performed on an ABI7500 real-time PCR system (Thermo Fisher Scientific) with the primer sequences presented in Table 1. The reaction conditions were as follows: 1) pr-denaturation at 95°C for 5 minutes; and 2) 40 cycles of denaturation at 95°C for 15 seconds, annealing at 60°C for 1 minute, and elongation at 72°C for 40 seconds. The relative expression of miR-1207-5p was calculated using the 2−ΔΔCt method, which refers to the ratio of target gene expression in the experimental group to the target gene expression in the control group, with following formula: ΔΔCt = ΔCtexperiment group − ΔCtcontrol group, (ΔCt = Cttargeted gene − Ctinternal reference gene).19
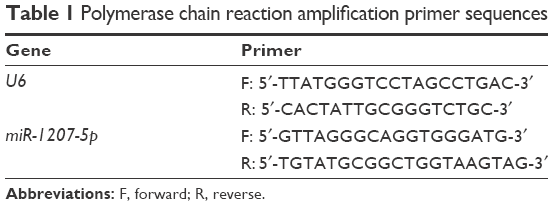 | Table 1 Polymerase chain reaction amplification primer sequences |
Detection of Tcaspase3 protein expression by Western blot
Protein was extracted from each group at 48 hours after transfection, and the protein concentrations were determined using a bicinchoninic acid protein assay kit (Beijing Bomaide Science & Technology Development Co., Ltd., Beijing, People’s Republic of China). After adding loading buffer, the extracted proteins were incubated at 95°C for 10 minutes; each well contained 30 μg of total protein. Protein separation was performed with 10% polyacrylamide gel electrophoresis (Wuhan Boshide Company, Wuhan, People’s Republic of China). The proteins were wet-transferred to a polyvinylidene fluoride transmembrane at 80–120 V, with a transmembrane voltage of 100 mV, for 45–70 minutes and then incubated for 1 hour with 5% bovine serum albumin at room temperature. The caspase3 primary antibody, which was purchased from Abcam (Cambridge, UK), was added to the membrane, which was incubated overnight at 4°C. Then, the membrane was washed three times with PBS for 5 minutes each. Next, the corresponding secondary antibody was added, and the membrane was again incubated at room temperature for 1 hour. After the incubation with the secondary antibody, the membrane was washed three times with PBS for 5 minutes and then developed with a chemiluminescence reagent. β-Actin was regarded as the reference. The gray-value analysis of the target bands was conducted with ImageJ software. ImageJ was also used to calculate the relative expression level of each protein (integral gray value of target band/integral gray value of β-actin).
Cell counting kit-8 method
The GBC-SD cells in the transfected groups after 16 hours and the GBC-SD cells in logarithmic growth phase in the non-T group were seeded on a 96-well plate with a total volume of 90 μL at a density of 3×10³ cells/well. Then, 10 μL of cisplatin (2 μmol/L) was added to each well. After 48 hours of treatment, 10 μL of cell counting kit-8 (CCK-8) solution (Beyotime Biotechnology Co., Ltd., Haimen, People’s Republic of China) was added to the wells, which was then incubated for 1 hour. Then, optical density (OD) was measured at 450 nm using a microplate reader (Bio-Rad Laboratories Inc., Hercules, CA, USA). The nontransfected GBC-SD cells that were not treated with cisplatin were set as the blank control (BC) group. There were six wells for each group, and the average was used to calculate cell viability (ODexperiment group/ODcontrol group).
Flow cytometry
The GBC-SD cells in the transfected groups after 16 hours and the GBC-SD cells in logarithmic growth phase in the non-T group were seeded onto a six-well plate with a total volume of 1.8 mL at a density of 5×10⁵ cells/well. Then, 200 μL of cisplatin (2 μmol/L) was added to each well. After 48 hours of treatment, the digested cells were adjusted to 1×10⁵ cells/mL. Next, the cell suspension (0.5 mL) was centrifuged, followed by resuspension in 250 μL of cold AnnexinV-fluorescein isothiocyanate (FITC) (KeyGen Biotech, Nanjing, People’s Republic of China) under dark conditions for 15 minutes. After adding 10 μL of propidium iodide (PI), flow cytometry (BD Biosciences, San Jose, CA, USA) was performed to examine apoptosis. The GBC-SD cells without transfection and without cisplatin were set as the BC group. The results are shown in the scatter diagram, with the normal living cells (FITC−/PI−) in the left lower quadrant, cells undergoing early apoptosis (FITC+/PI−) in the lower right quadrant (LR), and cells undergoing advanced apoptosis and necrosis (FITC+/PI+) in the upper right quadrant (UR). The apoptosis rate = LR + UR.
Detection of cisplatin sensitivity
GBC-SD cells in each group at 16 hours after transfection and 5×10⁵ GBC-SD cells in logarithmic growth phase were plated in 24-well plates; the cells for each group were plated in three wells. The cisplatin test concentration (3.0 μg/mL) referred to the reference peak plasma concentration.20 Additionally, the non-T group was plated and stained with trypan blue at 0 hour, 12 hours, 24 hours, 36 hours, 48 hours, and 60 hours. The dead cells were blue, and the living cells were colorless. The living cells were counted to draw the survival curves. The other GBC-SD cells were plated in 12-well plates and treated with different concentrations of cisplatin (0.5 μg/mL, 3.0 μg/mL, and 6 μg/mL) for 48 hours. Then, 20 μL of MTT was added to each well; this was repeated three times for each group. After incubation at 37°C for 2 hours, the absorbance value at 490 nm was read by enzyme-linked immunosorbent assay, with the blank control as zero. The inhibition rates of the GBC-SD cells following treatment with different concentrations of cisplatin were calculated.
Statistical analysis
SPSS 20.0 software (IBM Corporation, Armonk, NY, USA) was used for statistical analysis. Quantitative data were expressed as the mean ± standard deviation. Comparisons between groups were conducted using the t-test and among groups using one-way analysis of variance (ANOVA). The comparison between the quantitative data was conducted using the independent sample t-test. Categorical data were expressed as a ratio and percentage, and their comparison was examined using a chi-square test. A receiver operating characteristic (ROC) curve was drawn to estimate the diagnostic significance of miR-1207-5p in PGBC. Repeated-measure ANOVA was used to compare data at different time points and different concentrations. A two-tailed P<0.05 was considered statistically significant.
Results
miR-1207-5p expression in the peripheral blood of PGBC patients
As shown in Figure 1, the miR-1207-5p bands were clearly visible on the gel, suggesting no measurable degradation of the RNAs. After examining the associations between miR-1207-5p expression and clinicopathological characteristics, the results indicated that miR-1207-5p expression was associated with tumor node metastasis (TNM) staging (P<0.001) but not with age and sex (both P>0.05) (Table 2).
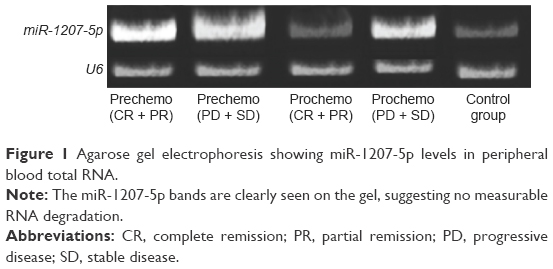 | Figure 1 Agarose gel electrophoresis showing miR-1207-5p levels in peripheral blood total RNA. |
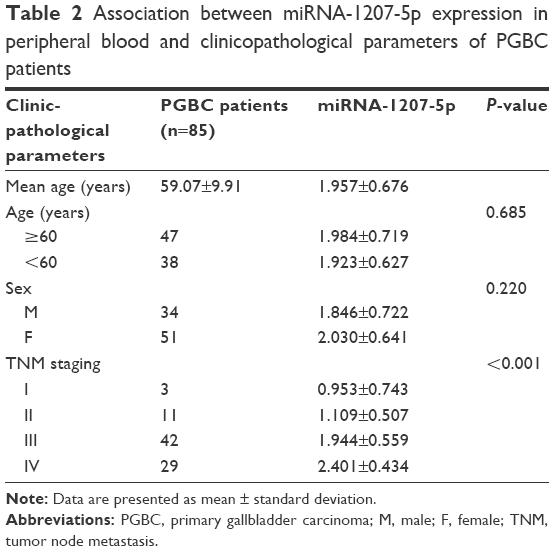 | Table 2 Association between miRNA-1207-5p expression in peripheral blood and clinicopathological parameters of PGBC patients |
miR-1207-5p expression before and after chemotherapy
RT-qPCR analysis showed that miR-1207-5p was overexpressed in both the effective and ineffective groups compared with the control group before chemotherapy (both P<0.05). After chemotherapy, miR-1207-5p expression in both the effective and ineffective groups declined (both P<0.05), and expression was significantly lower in the effective group than in the ineffective group (0.917± standard deviation 0.318 vs 1.074± standard deviation 0.289, P<0.05). Expression in the effective group was slightly higher (P>0.05), although the ineffective group had significantly higher miR-1207-5p expression (P<0.05) than the control group (Figure 2).
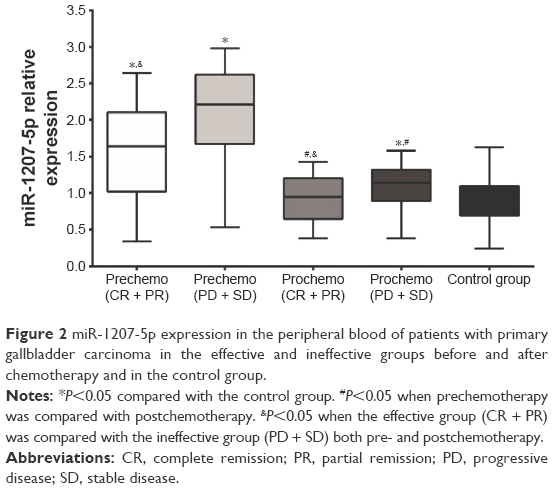 | Figure 2 miR-1207-5p expression in the peripheral blood of patients with primary gallbladder carcinoma in the effective and ineffective groups before and after chemotherapy and in the control group. |
Ki67 protein expression after chemotherapy
The immunohistochemistry results are shown in Figure 3. Ki67-positive cells displayed brown granules in the nucleus. There were fewer positive cells in the effective group than in the ineffective group. There were 22.22% (4/18) positive cases detected in the effective group and 71.05% (27/38) in the ineffective group. The number of positive cells between the two groups was significantly different (P<0.05).
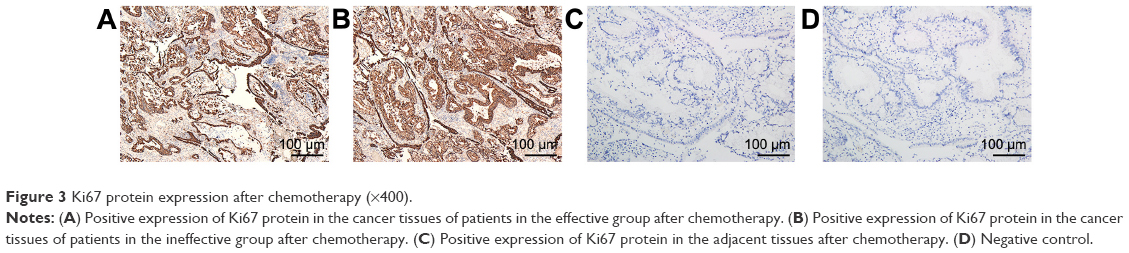 | Figure 3 Ki67 protein expression after chemotherapy (×400). |
Diagnostic significance of miR-1207-5p in PGBC
As shown in Figure 4, the ROC curve revealed that the area under curve (AUC), sensitivity, and specificity of miR-1207-5p used to diagnose PGBC were 0.898, 77.6%, and 97.1% at cutoff of 1.470, respectively (95% confidence interval 0.847–0.949).
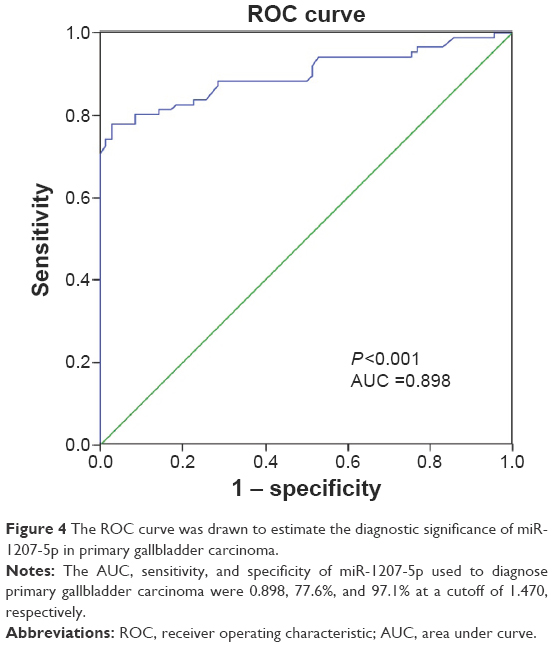 | Figure 4 The ROC curve was drawn to estimate the diagnostic significance of miR-1207-5p in primary gallbladder carcinoma. |
miR-1207-5p expression after transfection
After transfection, there was no significant difference in miR-1207-5p expression between the non-T and NC groups (P>0.05). Moreover, miR-1207-5p expression was increased in the mimic group but decreased in the inhibitor group (both P<0.05) (Figure 5). All of the above results suggest successful cell transfection.
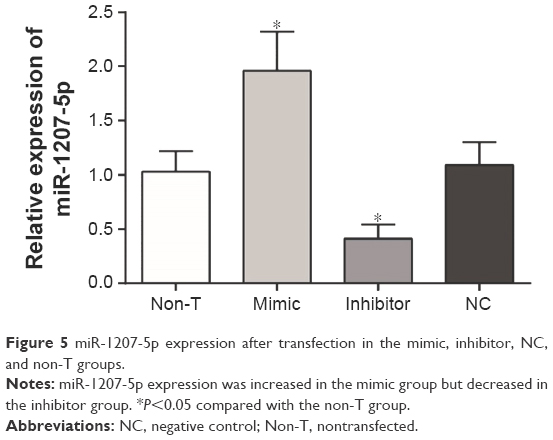 | Figure 5 miR-1207-5p expression after transfection in the mimic, inhibitor, NC, and non-T groups. |
Caspase3 expression changes after transfection
The changes in caspase3 protein levels detected by Western blot are shown in Figure 6. After transfection, the NC group displayed no significant differences in caspase3 expression levels compared with the non-T group (P>0.05). Caspase3 protein expression levels increased in the mimic group and decreased in the inhibitor group; both of these results were statistically significant (both P<0.05).
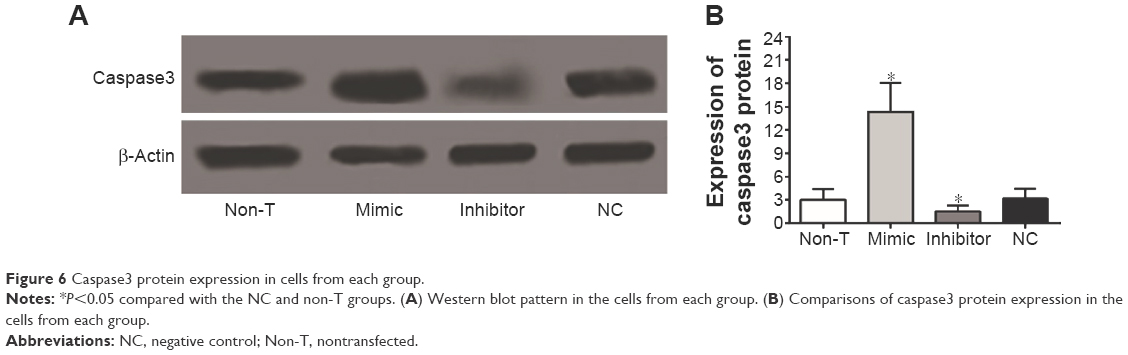 | Figure 6 Caspase3 protein expression in cells from each group. |
Effect of miR-1207-5p on the ability of cisplatin to inhibit cell proliferation
CCK-8 results showed that the GBC-SD cells in the other groups exhibited decreased cell viability compared with the BC group (all P<0.05), indicating that cisplatin could inhibit GBC-SD cell proliferation. After 48 hours of cisplatin treatment, the mimic group had an enhanced cell viability rate, but the inhibitor group had a decreased cell viability rate compared with the non-T and NC groups (both P<0.05). Additionally, there was no significant difference in the cell viability rate between the NC and non-T groups (P>0.05) (Figure 7). All of the above results revealed that miR-1207-5p downregulation could increase the effect of cisplatin on GBC-SD cells.
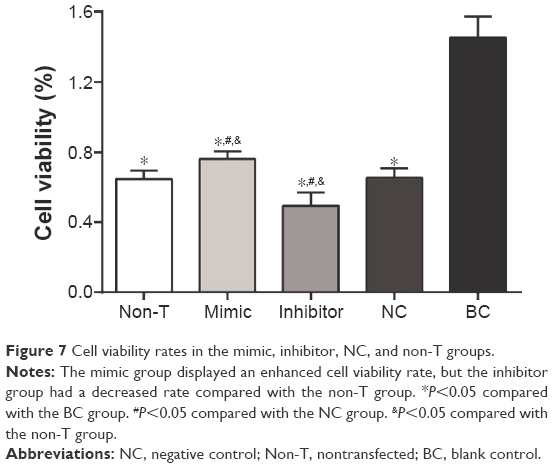 | Figure 7 Cell viability rates in the mimic, inhibitor, NC, and non-T groups. |
Effect of miR-1207-5p on the ability of cisplatin to promote cell apoptosis
The results of the flow cytometry assay demonstrated that the GBC-SD cells in the other groups exhibited increased apoptosis rates compared with the BC group (all P<0.05). After 48 hours of cisplatin treatment, the mimic group had a decreased cell apoptosis rate, but the inhibitor group had an enhanced rate compared with the non-T group (both P<0.05), which further indicated that miR-1207-5p expression could functionally regulate the sensitivity of GBC-SD cells to cisplatin (Figure 8).
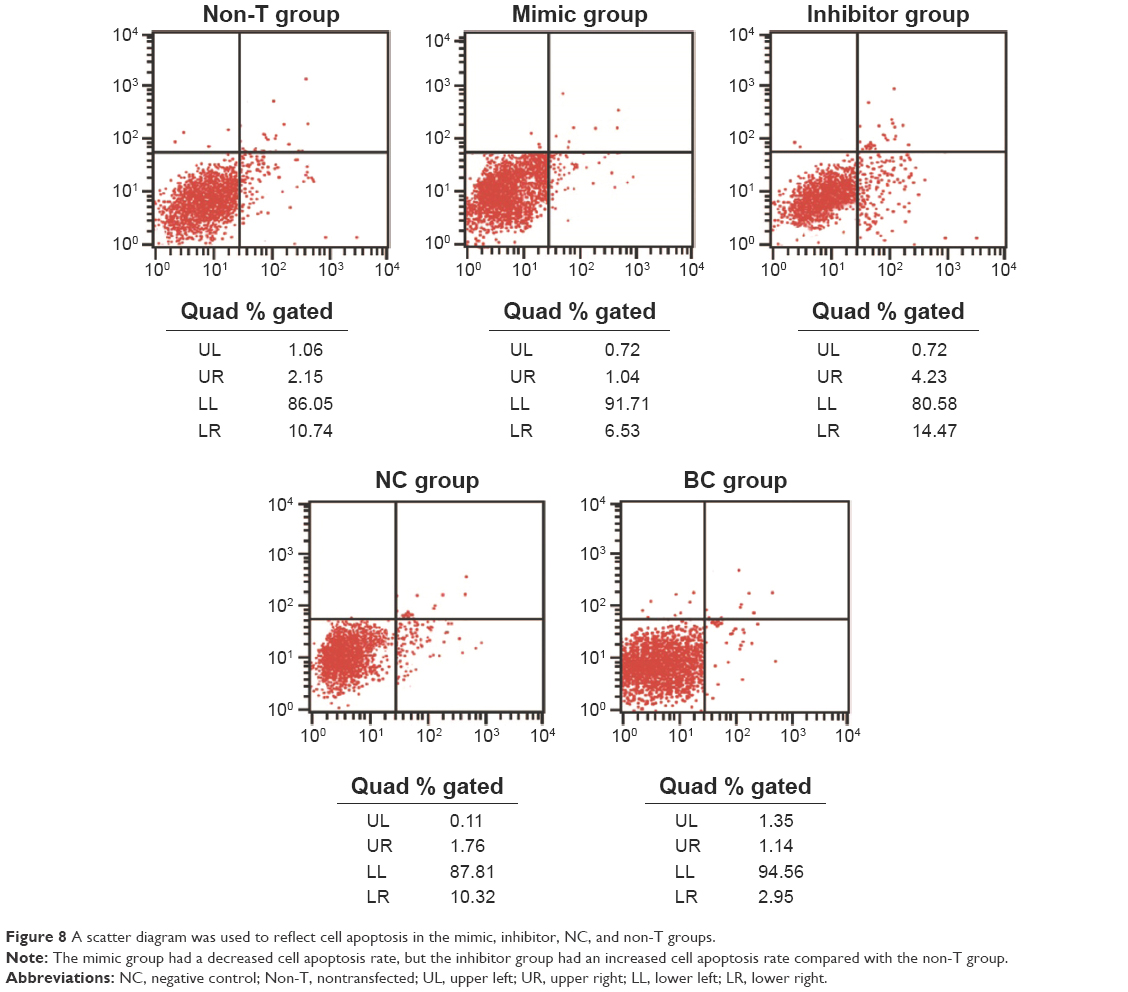 | Figure 8 A scatter diagram was used to reflect cell apoptosis in the mimic, inhibitor, NC, and non-T groups. |
Sensitivity of the cells in each group to cisplatin after transfection
Cell survival rates at different time points and at different cisplatin concentrations for each group are shown in Figure 9. Cell counting showed that the cell survival rates at different amounts of time and treatment and different cisplatin concentrations between the non-T and NC groups were not significantly different (all P>0.05). The cell survival rates of the mimic group at different time points after cisplatin treatment were significantly higher than the rates in the NC and non-T groups, whereas the cell survival rates in the inhibitor group were significantly lower than the rates in the NC and non-T groups (all P<0.05). When treated with 0.5 g/mL cisplatin, the cell survival rates of each group displayed no significant differences (all P>0.05). However, when treated with 3 μg/mL and 6 μg/mL cisplatin, the cell survival rates in the mimic group were significantly higher than the rates in the non-T and NC groups (both P<0.05), whereas the rates in the non-T and NC groups were significantly higher than those in the inhibitor group. The concentration and length of cisplatin treatment were negatively associated with the survival rates of cells in each group (both P<0.05).
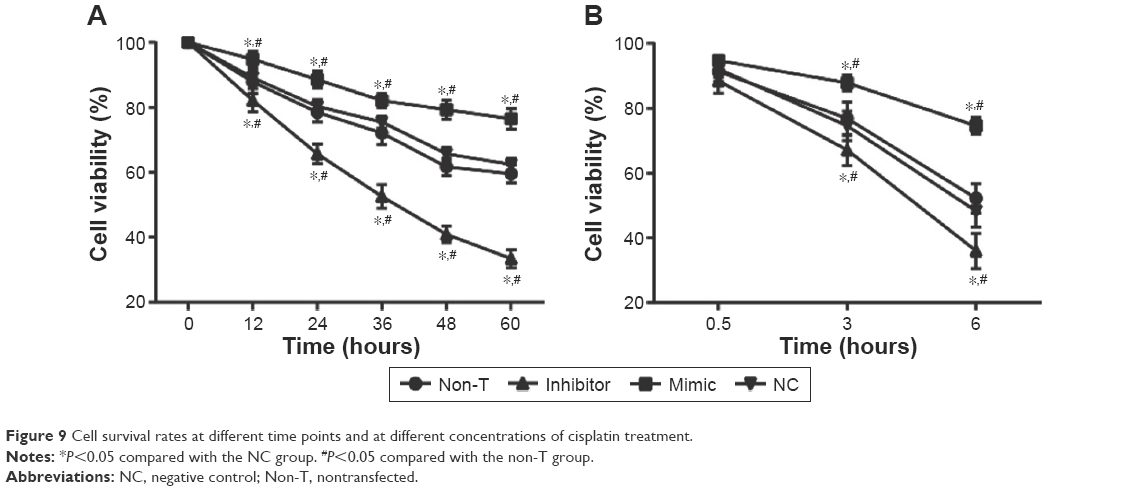 | Figure 9 Cell survival rates at different time points and at different concentrations of cisplatin treatment. |
Discussion
In the present study, we found that miR-1207-5p expression was associated with the TNM stage of PGBC, but not with sex and age, suggesting that miR-1207-5p is a significantly specific miRNA expressed in peripheral blood in those with PGBC. miR-1207-5p is related to epithelial–mesenchymal transformation mediated by transforming growth factor (TGF)-β, and its upregulation can inhibit the growth and invasion of PGBC cells, which influences chemosensitivity. In colon cancer, miR-1207-5p has been shown to be one of the top 30 overexpressed miRNAs.21 miR-1207-5p also influences tumor progression in esophageal carcinoma.9 Therefore, based on the studies mentioned, we propose that miR-1207-5p may be a potential target in PGBC therapy, as well.
Our RT-qPCR results showed that prechemotherapy expression of miR-1207-5p was high in the peripheral blood of PGBC patients compared with control patients. In contrast, miR-1207-5p expression was significantly decreased after chemotherapy, suggesting that miR-1207-5p expression is associated with the efficacy of chemotherapy. miR-1207-5p functions through EDEM3, NL-GN4, SLC6A8, JAG2, GDll, and FGDl,22 and changes in its expression influence cellular biological processes. miR-1207-5p is also involved in the epithelial–mesenchymal transition mediated by TGF-β.23 These data suggest that miR-1207-5p aberrations play critical roles in tumor progression. PGBC is a malignant gastrointestinal cancer with high mortality, and its incidence ranks sixth worldwide.1 Early diagnosis and therapy have not yet achieved a breakthrough. Thus, it is urgent to develop novel strategies. The miR-1207-5p mechanism is the main focus of the present study.
In this study, the CCK-8 results indicated that cisplatin could significantly suppress PGBC cells. Previous studies have shown that miR-1207-5p is derived from miRNA PVT1, which is abundantly expressed in gallbladder cells and upregulates glucose, as well as TGF-β1.23 Furthermore, miR-1207-5p increases the expression of TGF-β1, PAI-1, and FN1-like PVT1 in a manner that is independent of the host gene. Additionally, among the discovered internal modulators, miRNAs incorporate into the noncoding region of the genome,24,25 suggesting that miR-1207-5p plays a role in PGBC development and progression. Some previous studies have shown the aberrant expression of miRNAs in various tumors.10,11,26–28 In our study, the ROC curve showed that the AUC, sensitivity, and specificity of miR-1207-5p used to diagnose PGBC were 0.898, 77.6%, and 97.1% at cutoff of 1.470, respectively. These data suggest that miR-1207-5p is valuable for the early diagnosis of PGBC. We confirmed the relationship between chemotherapy and gallbladder carcinoma cell apoptosis and found that the gallbladder carcinoma cells with high miR-1207-5p expression had an even higher proliferation rate and lower apoptosis rate than those with low miR-1207-5p expression after treatment with cisplatin.
Our study also showed that Ki67-positive cells displayed brown granules in the nucleus and that there were fewer positive cells in the effective group than in the ineffective group, suggesting that Ki67 may be used as a marker for PGBC proliferation and invasion and that it had certain significance in PGBC prognosis. It was also reported that Ki67 expression had a strong relationship with PGBC cell proliferation and invasion and that the detection of Ki67 expression was helpful for evaluating tumor biological behavior and prognosis in PGBC patients.29 Additionally, after transfection, the NC group displayed no significant differences in caspase3 protein expression levels compared with the non-T group. However, caspase3 expression levels increased in the mimic group and decreased in the inhibitor group, which implies that cell apoptosis decreased, whereas cell proliferation increased after miR-1207-5p inhibition. Caspase3 plays an important role in Fas/FasL signaling, which induces tumor cell apoptosis through a series of kinase activations or substrate cleavages, and caspase3 overexpression was strongly related to the degree of malignancy and differentiation.30 Finally, the cell survival rates in the mimic group at different time points after cisplatin treatment were significantly higher than the rates in the NC and non-T groups, whereas the cell survival rates in the inhibitor group were significantly lower than the rates in the NC and non-T groups. The concentration and action time of cisplatin were negatively associated with the cell survival rate in each group, showing that enhanced miR-1207-5p expression can reduce the sensitivity of cells to cisplatin and that miR-1207-5p inhibition can enhance the sensitivity of cells to cisplatin. Therefore, the sensitivity of GBC-SD cells to cisplatin is both time- and dose dependent.
Taken together, our study demonstrated that cisplatin-based chemosensitivity of PGBC was enhanced as miR-1207-5p expression declined in peripheral blood. Thus, miR-1207-5p appears to be a promising and novel chemosensitizer for PGBC treatment. However, PGBC carcinogenesis is not associated with a single gene. Despite the increase in cancer suppressor genes during early diagnosis, prognosis, and efficacy monitoring, novel diagnostic and therapeutic methods still require further investigation. Progress in laboratory medicine and biological techniques, especially in genomics and proteomics, and clinical applications will aid in PGBC diagnosis and therapy.
Acknowledgments
The authors would like to acknowledge the reviewers for their helpful comments on this paper.
Disclosure
The authors report no conflicts of interest in this work.
References
Hundal R, Shaffer EA. Gallbladder cancer: epidemiology and outcome. Clin Epidemiol. 2014;6:99–109. | ||
Li M, Zhang F, Wang X, et al. Magnolol inhibits growth of gallbladder cancer cells through the p53 pathway. Cancer Sci. 2015;106(10):1341–1350. | ||
Heavey SF, Roeland EJ, Tipps AM, Datnow B, Sicklick JK. Rapidly progressive subcutaneous metastases from gallbladder cancer: insight into a rare presentation in gastrointestinal malignancies. J Gastrointest Oncol. 2014;5(4):E58–E64. | ||
Ciombor KK, Goff LW. Current therapy and future directions in biliary tract malignancies. Curr Treat Options Oncol. 2013;14(3):337–349. | ||
Vijayakumar A, Vijayakumar A, Patil V, Mallikarjuna MN, Shivaswamy BS. Early diagnosis of gallbladder carcinoma: an algorithm approach. ISRN Radiol. 2012;2013:239424. | ||
Hong EK, Kim KK, Lee JN, et al. Surgical outcome and prognostic factors in patients with gallbladder carcinoma. Korean J Hepatobiliary Pancreat Surg. 2014;18(4):129–137. | ||
Gao H, Xie J, Peng J, et al. Hispidulin inhibits proliferation and enhances chemosensitivity of gallbladder cancer cells by targeting HIF-1alpha. Exp Cell Res. 2015;332(2):236–246. | ||
Peng HH, Zhang YD, Gong LS, et al. Increased expression of microRNA-335 predicts a favorable prognosis in primary gallbladder carcinoma. Onco Targets Ther. 2013;6:1625–1630. | ||
Yang X, Zang W, Xuan X, et al. miRNA-1207-5p is associated with cancer progression by targeting stomatin-like protein 2 in esophageal carcinoma. Int J Oncol. 2015;46(5):2163–2171. | ||
Hede K. Studies define role of microRNA in cancer. J Natl Cancer Inst. 2005;97(15):1114–1115. | ||
Wang Y, Li M, Zang W, et al. MiR-429 up-regulation induces apoptosis and suppresses invasion by targeting Bcl-2 and SP-1 in esophageal carcinoma. Cell Oncol (Dordr). 2013;36(5):385–394. | ||
Chen L, Lu MH, Zhang D, et al. miR-1207-5p and miR-1266 suppress gastric cancer growth and invasion by targeting telomerase reverse transcriptase. Cell Death Dis. 2014;5:e1034. | ||
Huang KH, Lan YT, Fang WL, et al. The correlation between miRNA and lymph node metastasis in gastric cancer. Biomed Res Int. 2015;2015:543163. | ||
Zhu AX, Hong TS, Hezel AF, et al. Current management of gallbladder carcinoma. Oncologist. 2010;15(2):168–181. | ||
Andersen JB, Thorgeirsson SS. A perspective on molecular therapy in cholangiocarcinoma: present status and future directions. Hepat Oncol. 2014;1(1):143–157. | ||
Eisenhauer EA, Therasse P, Bogaerts J, et al. New response evaluation criteria in solid tumours: revised RECIST guideline (version 1.1). Eur J Cancer. 2009;45(2):228–247. | ||
Vidic S, Markelc B, Sersa G, et al. MicroRNAs targeting mutant K-ras by electrotransfer inhibit human colorectal adenocarcinoma cell growth in vitro and in vivo. Cancer Gene Ther. 2010;17(6):409–419. | ||
Rio DC, Ares M Jr, Hannon GJ, et al. Purification of RNA using TRIzol (TRI reagent). Cold Spring Harb Protoc. 2010;2010(6):pdb.prot5439. | ||
Kim YK, Shin DH, Kim KB, et al. MUC5AC and MUC5B enhance the characterization of mucinous adenocarcinomas of the lung and predict poor prognosis. Histopathology. 2015;67(4):520–528. | ||
Olie RA, Simões-Wüst AP, Baumann B, et al. A novel antisense oligonucleotide targeting survivin expression induces apoptosis and sensitizes lung cancer cells to chemotherapy. Cancer Res. 2000;60(11):2805–2809. | ||
Barsotti AM, Beckerman R, Laptenko O, et al. p53-Dependent induction of PVT1 and miR-1204. J Biol Chem. 2012;287(4):2509–2519. | ||
D’Adamo P, Welzl H, Papadimitriou S, et al. Deletion of the mental retardation gene Gdi1 impairs associative memory and alters social behavior in mice. Hum Mol Genet. 2002;11(21):2567–2580. | ||
Hanada K, Tsuchida A, Kajiyama G. Cellular kinetics and gene mutations in gallbladder mucosa with an anomalous junction of pancreaticobiliary duct. J Hepatobiliary Pancreat Surg. 1999;6(3):223–228. | ||
Matsubara T, Sakurai Y, Sasayama Y, et al. K-ras point mutations in cancerous and noncancerous biliary epithelium in patients with pancreaticobiliary maljunction. Cancer. 1996;77(8 Suppl):1752–1757. | ||
Yukawa M, Fujimori T, Hirayama D, et al. Expression of oncogene products and growth factors in early gallbladder cancer, advanced gallbladder cancer, and chronic cholecystitis. Hum Pathol. 1993;24(1):37–40. | ||
Chiyomaru T, Seki N, Inoguchi S, et al. Dual regulation of receptor tyrosine kinase genes EGFR and c-Met by the tumor-suppressive microRNA-23b/27b cluster in bladder cancer. Int J Oncol. 2015;46(2):487–496. | ||
Cheng T, Hu C, Yang H, et al. Transforming growth factor-β-induced miR143 expression in regulation of non-small cell lung cancer cell viability and invasion capacity in vitro and in vivo. Int J Oncol. 2014;45(5):1977–1988. | ||
Pei J, Robu V, Feder M, et al. Copy neutral loss of heterozygosity in 20q in chronic lymphocytic leukemia/small lymphocytic lymphoma. Cancer Genet. 2014;207(3):98–102. | ||
Wu CH. Expression of Ki67 and MMP-9 in gallbladder carcinoma. World Chin J Digestol. 2008;16(14):1585–1587. Chinese. | ||
Wu JH, Yao YL, Gu T, et al. MiR-421 regulates apoptosis of BGC-823 gastric cancer cells by targeting caspase-3. Asian Pac J Cancer Prev. 2014;15(13):5463–5468. |
 © 2016 The Author(s). This work is published and licensed by Dove Medical Press Limited. The full terms of this license are available at https://www.dovepress.com/terms.php and incorporate the Creative Commons Attribution - Non Commercial (unported, v3.0) License.
By accessing the work you hereby accept the Terms. Non-commercial uses of the work are permitted without any further permission from Dove Medical Press Limited, provided the work is properly attributed. For permission for commercial use of this work, please see paragraphs 4.2 and 5 of our Terms.
© 2016 The Author(s). This work is published and licensed by Dove Medical Press Limited. The full terms of this license are available at https://www.dovepress.com/terms.php and incorporate the Creative Commons Attribution - Non Commercial (unported, v3.0) License.
By accessing the work you hereby accept the Terms. Non-commercial uses of the work are permitted without any further permission from Dove Medical Press Limited, provided the work is properly attributed. For permission for commercial use of this work, please see paragraphs 4.2 and 5 of our Terms.