")
Back to Journals » Journal of Asthma and Allergy » Volume 14
The Effects of Asthma on the Association Between Pulmonary Function and Obesity: A 16-Year Longitudinal Study
Authors Huang YJ , Chu YC, Huang HL, Hwang JS, Chan TC
Received 25 December 2020
Accepted for publication 1 March 2021
Published 8 April 2021 Volume 2021:14 Pages 347—359
DOI https://doi.org/10.2147/JAA.S299186
Checked for plagiarism Yes
Review by Single anonymous peer review
Peer reviewer comments 4
Editor who approved publication: Dr Luis Garcia-Marcos
Ying-Jhen Huang,1 Yi-Chi Chu,1 Hung-Ling Huang,2– 4 Jing-Shiang Hwang,5 Ta-Chien Chan1,6
1Research Center for Humanities and Social Sciences, Academia Sinica, Taipei, Taiwan; 2Kaohsiung Municipal Ta-Tung Hospital, Kaohsiung, Taiwan; 3Division of Pulmonary and Critical Care Medicine, Department of Internal Medicine, Kaohsiung Medical University Hospital, Kaohsiung, Taiwan; 4Graduate Institute of Medicine, College of Medicine, Kaohsiung Medical University, Kaohsiung, Taiwan; 5Institute of Statistical Science, Academia Sinica, Taipei, Taiwan; 6Institute of Public Health, School of Medicine, National Yang-Ming University, Taipei, Taiwan
Correspondence: Ta-Chien Chan
Research Fellow, Research Center for Humanities and Social Sciences, Academia Sinica, 128 Academia Road, Section 2, Nankang, Taipei, 115, Taiwan
Tel +886 2-2785-7108 ext. 312
Email [email protected]
Background: Asthma and obesity are important public health issues around the world. Obesity is considered a risk factor associated with the severity and incidence of asthma. We investigated the relationships between poor pulmonary function (defined by forced vital capacity (FVC) and percentage of predicted FVC (FVC%)) and obesity.
Methods: This is a retrospective longitudinal study using the MJ health examination database in Taiwan from 2000 to 2015. There were 160,609 participants aged ≥ 20 years with complete obesity indicators and lung function data, and having at least two visits. A generalized estimation equation (GEE) model was applied to estimate the association between lung function and obesity.
Results: BMI was the best indicator to predict poor pulmonary function for our participants. Results of BMI are presented as an example: Obesity (body mass index (BMI) ≥ 27.0 kg/m2) is significantly associated with lower FVC [adjusted coefficients (β) for asthmatics: -0.11 L (95% CI: -0.14, -0.08); adjusted β for non-asthmatics: -0.08 L (-0.09, -0.08)] and FVC% [adjusted β for asthmatics: -1.91% (95% CI: -2.64, -1.19); adjusted β for non-asthmatics: 1.48% (-1.63, -1.33)]. Annual change of BMI (ΔBMI/year) is an independent risk factor for decreased FVC [adjusted β for asthmatics: -0.030 L (-0.048, -0.013); adjusted β for non-asthmatics: -0.019 L (-0.022, -0.016)] and FVC% [adjusted β for non-asthmatics: -0.603% (-1.063, -0.142); adjusted β for non-asthmatics: -0.304% (-0.393, -0.214)], and is significantly associated with accelerated FVC decline [adjusted β of ΔFVC/year and ΔFVC %/year for asthmatics: -0.038 L (-0.054, -0.022) and -0.873% (-1.312, -0.435); adjusted β of ΔFVC/year and ΔFVC %/year for non-asthmatics: -0.033 L (-0.042, -0.024) and -0.889% (-1.326, -0.452)].
Conclusion: Obesity is significantly associated with decreased lung function, and asthmatics had a higher risk than non-asthmatics.
Keywords: asthma, obesity, BMI, pulmonary function, FVC
Introduction
Asthma is the most prevalent chronic respiratory disease, posing a worldwide health burden. It affects over 300 million people worldwide, with about 24.8 million disability-adjusted life years (DALYS) in 2016.1,2 In Taiwan, about 15.7% of children and adolescents and 10.6% of adults suffer from asthma.3 Pulmonary function tests (PFTs) based on determining the amount of airway obstruction4 are commonly used in clinical diagnosis of asthma. Clarifying the precipitating factors for chronic airway inflammation and bronchial hyperresponsiveness is beneficial to reduce the risk of incident asthma, improve patient outcome, and reduce the burden of disease costs.
Obesity is one of the most important public health issues in the world. The prevalence of obesity worldwide continues to rise, as it does in Taiwan. The prevalence rose from 11.5% in 1993–1996 to 22.8% in 2013–2016 among adults aged 18 and older according to the Nutrition and Health Survey in Taiwan (NAHSIT), an increase of 11.3%.5 The mechanism linking obesity and asthma is not clear, but several possible ones have been proposed, including the following:6 (1) excess adipose tissue covers the thorax and abdomen, leading to a decrease in lung volume, which affects the expiratory reserve volume (ERV) and functional residual capacity (FRC), (2) pro‐inflammatory cytokines (eg TNFα, IL6), markers of systemic inflammation (such as C‐reactive protein), markers of oxidative stress (such as 8‐isoprostane) or leptin increase, and adiponectin levels drop, influencing the inflammatory response within the immune system, and/or (3) genetic factors. A considerable body of epidemiological evidence suggests that obesity is not only a major risk factor but also a disease modifier of asthma.7 Recently, some studies have investigated the bidirectional association of obesity and asthma. Bidirectional Mendelian randomization studies in children and adults show that obesity may lead to the development of asthma, but the effects of asthma on obesity are likely to be small.8,9
Body mass index (BMI) and waist circumference (WC) are respectively the most common indicators of general obesity and central obesity. BMI and WC are inversely related to lung function, which has been explored in previous studies.10,11 Compared with BMI, WC is considered to be more strongly associated with poor lung function as represented by lower forced expiratory volume in one second (FEV1) and the predicted percentage of forced vital capacity (FVC).12 A limitation of BMI is that it is difficult to distinguish the distribution of fat and lean mass, and abdominal fat accumulation is an important risk factor for most diseases.13,14 Waist-to-height ratio (WHtR) is considered a better predictor of central obesity, and more strongly predicts the relationship with cardiovascular disease than do BMI and WC, in that it is less affected by age and sex.15 However, WHtR has not been widely used in epidemiological studies of asthma or lung function.
To the best of our knowledge, the way in which the longitudinal relationship between obesity and reduced lung function differs between asthmatic and non-asthmatic participants has not been investigated yet. Clarifying the difference can be used as an important reference for policies of health management to improve the outcome of asthmatic groups and reduce the risk of incident asthma in non-asthmatic groups. In addition, exploring the relationship between obesity on the one hand as defined by different obesity indicators, and decreased lung function on the other in different groups will provide better asthma management.
This study aimed to elucidate the different associations of obesity and reduced pulmonary function among asthma and non-asthma participants in Taiwan.
Materials and Methods
Participants
Data were obtained from the MJ Health Management Institution, a membership-oriented private institute in Taiwan with four health check-up clinics located in Taipei, Taoyuan, Taichung, and Kaohsiung. A health questionnaire was completed by each participant, and clinical evaluation including anthropometric measurements, biochemical tests, and pulmonary function tests were performed. The health questionnaire included sociodemographic characteristics, personal and family medical history, and lifestyle such as tobacco exposure, alcohol consumption, physical activity (PA), and food habits. This standard health examination program is run by a private firm (MJ Health Management Institution, Taiwan), and all the procedures (http://www.mjhrf.org/file/en/report/MJHRF-TR-01MJ%20Health%20Database.pdf) were approved per ISO 9001 standards.
This study included a total of 471,669 MJ health check-up participants from 2000 to 2015. The visiting records were excluded if (1) persons were younger than age 20, (2) the data of asthma, asthma medication, forced vital capacity (FVC), forced expiratory volume in one second (FEV1), height, weight, or WC were unavailable, or (3) the ratio of FEV1 to FVC (FEV1/FVC ratio) was not within the normal range: FEV1/FVC <70% (and <65% in persons older than age 70)16 or FEV1/FVC >100%. The participants’ exclusion criteria were: (1) living on offshore islands and (2) participants with only one visit. Study participants were classified as asthmatic and non-asthmatic based on self-reported asthma and long-term asthma medication use. The flowchart of study participants is shown in Figure 1. A total of 160,609 participants (asthma 6,329; non-asthma 154,280) and 622,835 visits (asthma 25,616; non-asthma 597,219) were included in the analysis. Participants had a health check every 5.51 years on average.
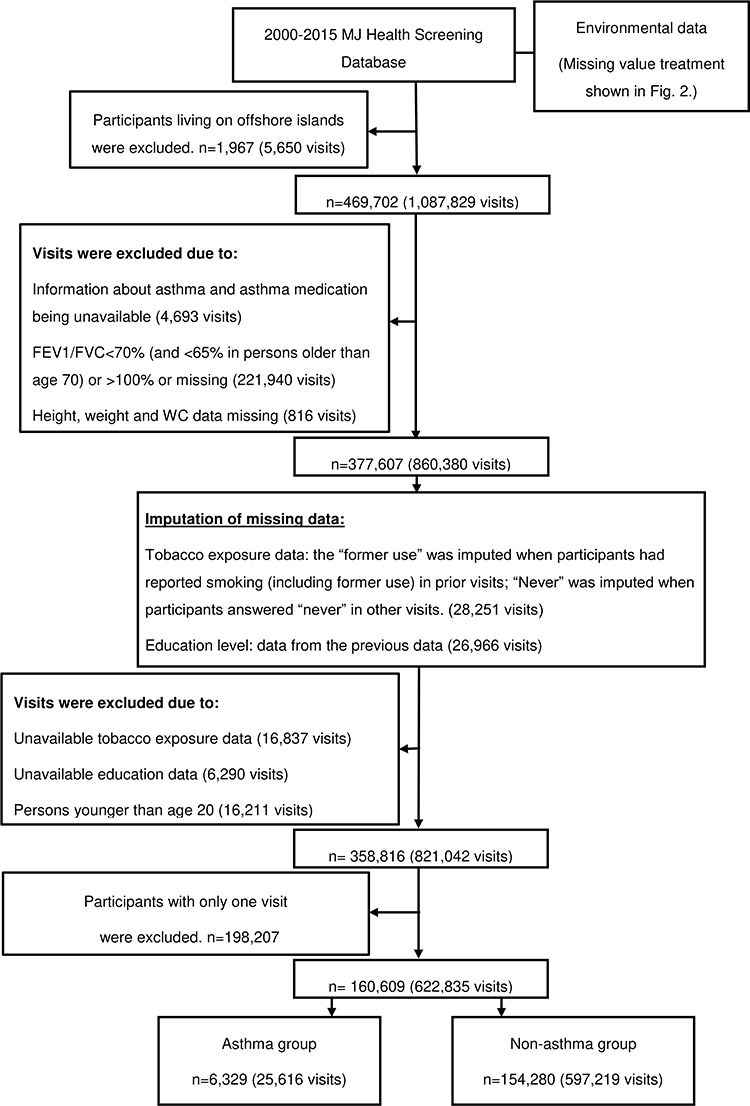 |
Figure 1 Participant flow chart. |
Pulmonary Function (Dependent Variable)
We used the FVC and FVC % as pulmonary function indicators in this study. FVC was measured using FUKUDA (MICROSPIRO HI-501/HI501/CHESTGRAH HI-701, Japan) and CHEST (HI-801, Japan) multifunctional spirometers. The equation for calculating the predicted value of FVC was developed by the Global Lung Function Initiative (GLI) in 2012.17 A restrictive spirometry pattern (RSP, FVC < 80% predicted and FEV1/FVC ≥0.7) was used to determine restrictive lung function, which was associated with adverse outcomes, including mortality.18,19 An FEV1/FVC ratio<0.70 (and <0.65 in persons older than age 70)16 was used to identify COPD, which was excluded during follow-up to avoid confounding the results of the study.
Obesity Indicators (Independent Variables)
We used three obesity indicators including BMI, WC, and WHtR as independent variables. Body height and weight measured by height-weight machine (CROWN HGM-200) and were respectively recorded to the nearest 0.1 cm and measured to the nearest 0.1 kg when participants were barefoot and wearing light indoor clothing.20 BMI was stratified into four categories: underweight (<18.5 kg/m2), normal (18.5 ≤BMI <24 kg/m2), overweight (24≤BMI <27 kg/m2), and obesity (≥27 kg/m2).21 WC (to the nearest mm) is measured with a cloth tape measure around the waist (middle distance between the last rib margin and iliac crest).20 Central obesity was defined as WC ≥ 80 cm for women and ≥90 cm for men.21 WHtR was defined as WC divided by height, and a cutoff of 0.5 was used to identify central obesity.22 ΔBMI/year, ΔWC/year, ΔWHtR/year and ΔFVC/year represent the annual change value of BMI, WC, WHtR and FVC, respectively.
Covariates
To determine the independent relationship between obesity and lung function, covariates including sociodemographic variables and protective or risk factors for reduced lung function found in published literature were included in the statistical model. Factors include: (1) the demographic variables of sex, age group (20–59, and ≥60 years old), and education status (“primary and below”, “junior/senior high school”, and “college and above”), (2) disease history such as hypertension (HTN)23 and diabetes mellitus (DM),24 (3) medication history such as psychiatric medication (PM),25 antihypertensive agent (AHTN),23 antihyperglycemic agent (AHG),24 and antihyperlipidemic agent (AHLD),26 (4) season,27 (5) environmental factors such as the pollutant standards index (PSI),28 and (6) health behaviors like physical activity and tobacco exposure.
The air pollution data were obtained from the Environment Protection Administration (EPA), Executive Yuan, Taiwan (https://erdb.epa.gov.tw/). Each participant was assigned the monthly mean concentrations of PSI of the nearest environmental pollution station within 30,000 meters for the month he/she visited, based on the location of the participant’s current home or workplace. If the distance between a participant and the environmental pollution station exceeded 30,000 meters or the nearest environmental station data were not available, the participant was assigned the average PSI of the region (north, middle, south and east), based on the participant’s location. Figure 2 shows the flowchart of cleaning the environment data by QGIS 3.12 (QGIS.org (2020), QGIS Geographic Information System, Open Source Geospatial Foundation Project, http://qgis.org). The distribution of air quality monitoring stations is shown in Figure S1.
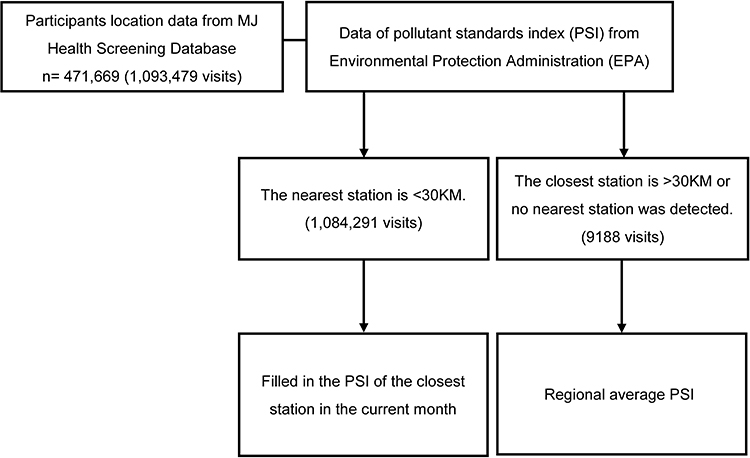 |
Figure 2 Environmental data cleaning flow chart. |
Intensity of PA is defined as the energy consumed by body movement compared to sitting at rest, which is commonly determined by metabolic equivalents (METs) and classified into four levels as follows: 2.5 METs for light activity such as sweeping or mopping the floor, 4.5 METs for moderate activity such as brisk walking, 6.5 METs for moderately vigorous activity such as jogging, and 8.5 METs for highly vigorous activity such as swimming.29 We calculated METs per week from self-reported exercise frequency, and followed the minimum recommendations from the American College of Sports Medicine and American Heart Association to classify METs into three levels: light intensity (<7.5 METs hours/week), moderate intensity (7.5 to 21 METs hours/week), and vigorous intensity (>21 METs hours/week).30
Statistical Analysis
Continuous variables are presented as mean ± SD, and groups (asthma and non-asthma) are compared by two-tailed t-tests. Categorical variables are expressed as a percentage, and groups are compared by chi-square tests. We used generalized estimating equations, GEE, and model (by “geepack” package in R software) with a normal distribution to model the change of FVC and with a binomial distribution to model the probability of RSP (by the logit link function) to determine the association between obesity and poor pulmonary function.31 Autocorrelation among the repeated measurements for the same participant was modeled with an exchangeable working correlation matrix. We selected common sociodemographic variables and risk factors for reduced lung function as covariates, and used the stepwise regression method (α=0.10 to enter and remove) to determine the covariates in the model of the asthmatic group. The GEE model was adjusted for season, sex, age group, education, HTN, DM/AHG, AHTN, PM, and PSI to model the change in FVC, and was adjusted for season, sex, age group, education, PM, PSI, and physical activity to model the change in FVC% and the probability of RSP. The same covariates were adjusted in the non-asthmatic group. All analyses were performed in R software version 3.6.3 (R Core Team, Vienna).32 A p-value less than 0.05 indicates statistical significance.
Ethics Statement
Each participant provided written informed consent to the MJ Health Management Institution for authorizing the use of the data. The authorization code for this study is MJHRF2017009A. The released data are all anonymized and the researchers cannot identify the participants. The Institutional Review Board (IRB) reviewed the participant’s consent form from the MJ Health Management Institution and the confidential data policy. The study was approved by the IRB on Biomedical Science Research, Academia Sinica (AS-IRB-BM-17044).
Results
A total of 6,329 (men: 52%; women: 48%) asthmatic and 154,280 (men: 49%; women: 51%) non-asthmatic participants were included in this longitudinal study. The baseline characteristics of asthmatic and non-asthmatic participants are presented in Table 1. In asthmatic participants, the mean FVC was 2.89 ± 0.92 L and FVC% was 80.7 ± 15.4%, and the proportion of restrictive lung function was 48.9%. The prevalence of obesity calculated by BMI, WC and WHtR was 15.0%, 20.0%, and 30.2%, respectively. In non-asthmatic participants, the average FVC and FVC % were respectively 2.91 ± 0.81 L and 82.9±13.3%, and the proportion of restrictive lung function was 44.0%. The prevalence of obesity calculated by BMI, WC and WHtR was 12.4%, 16.4%, and 26.3%, respectively.
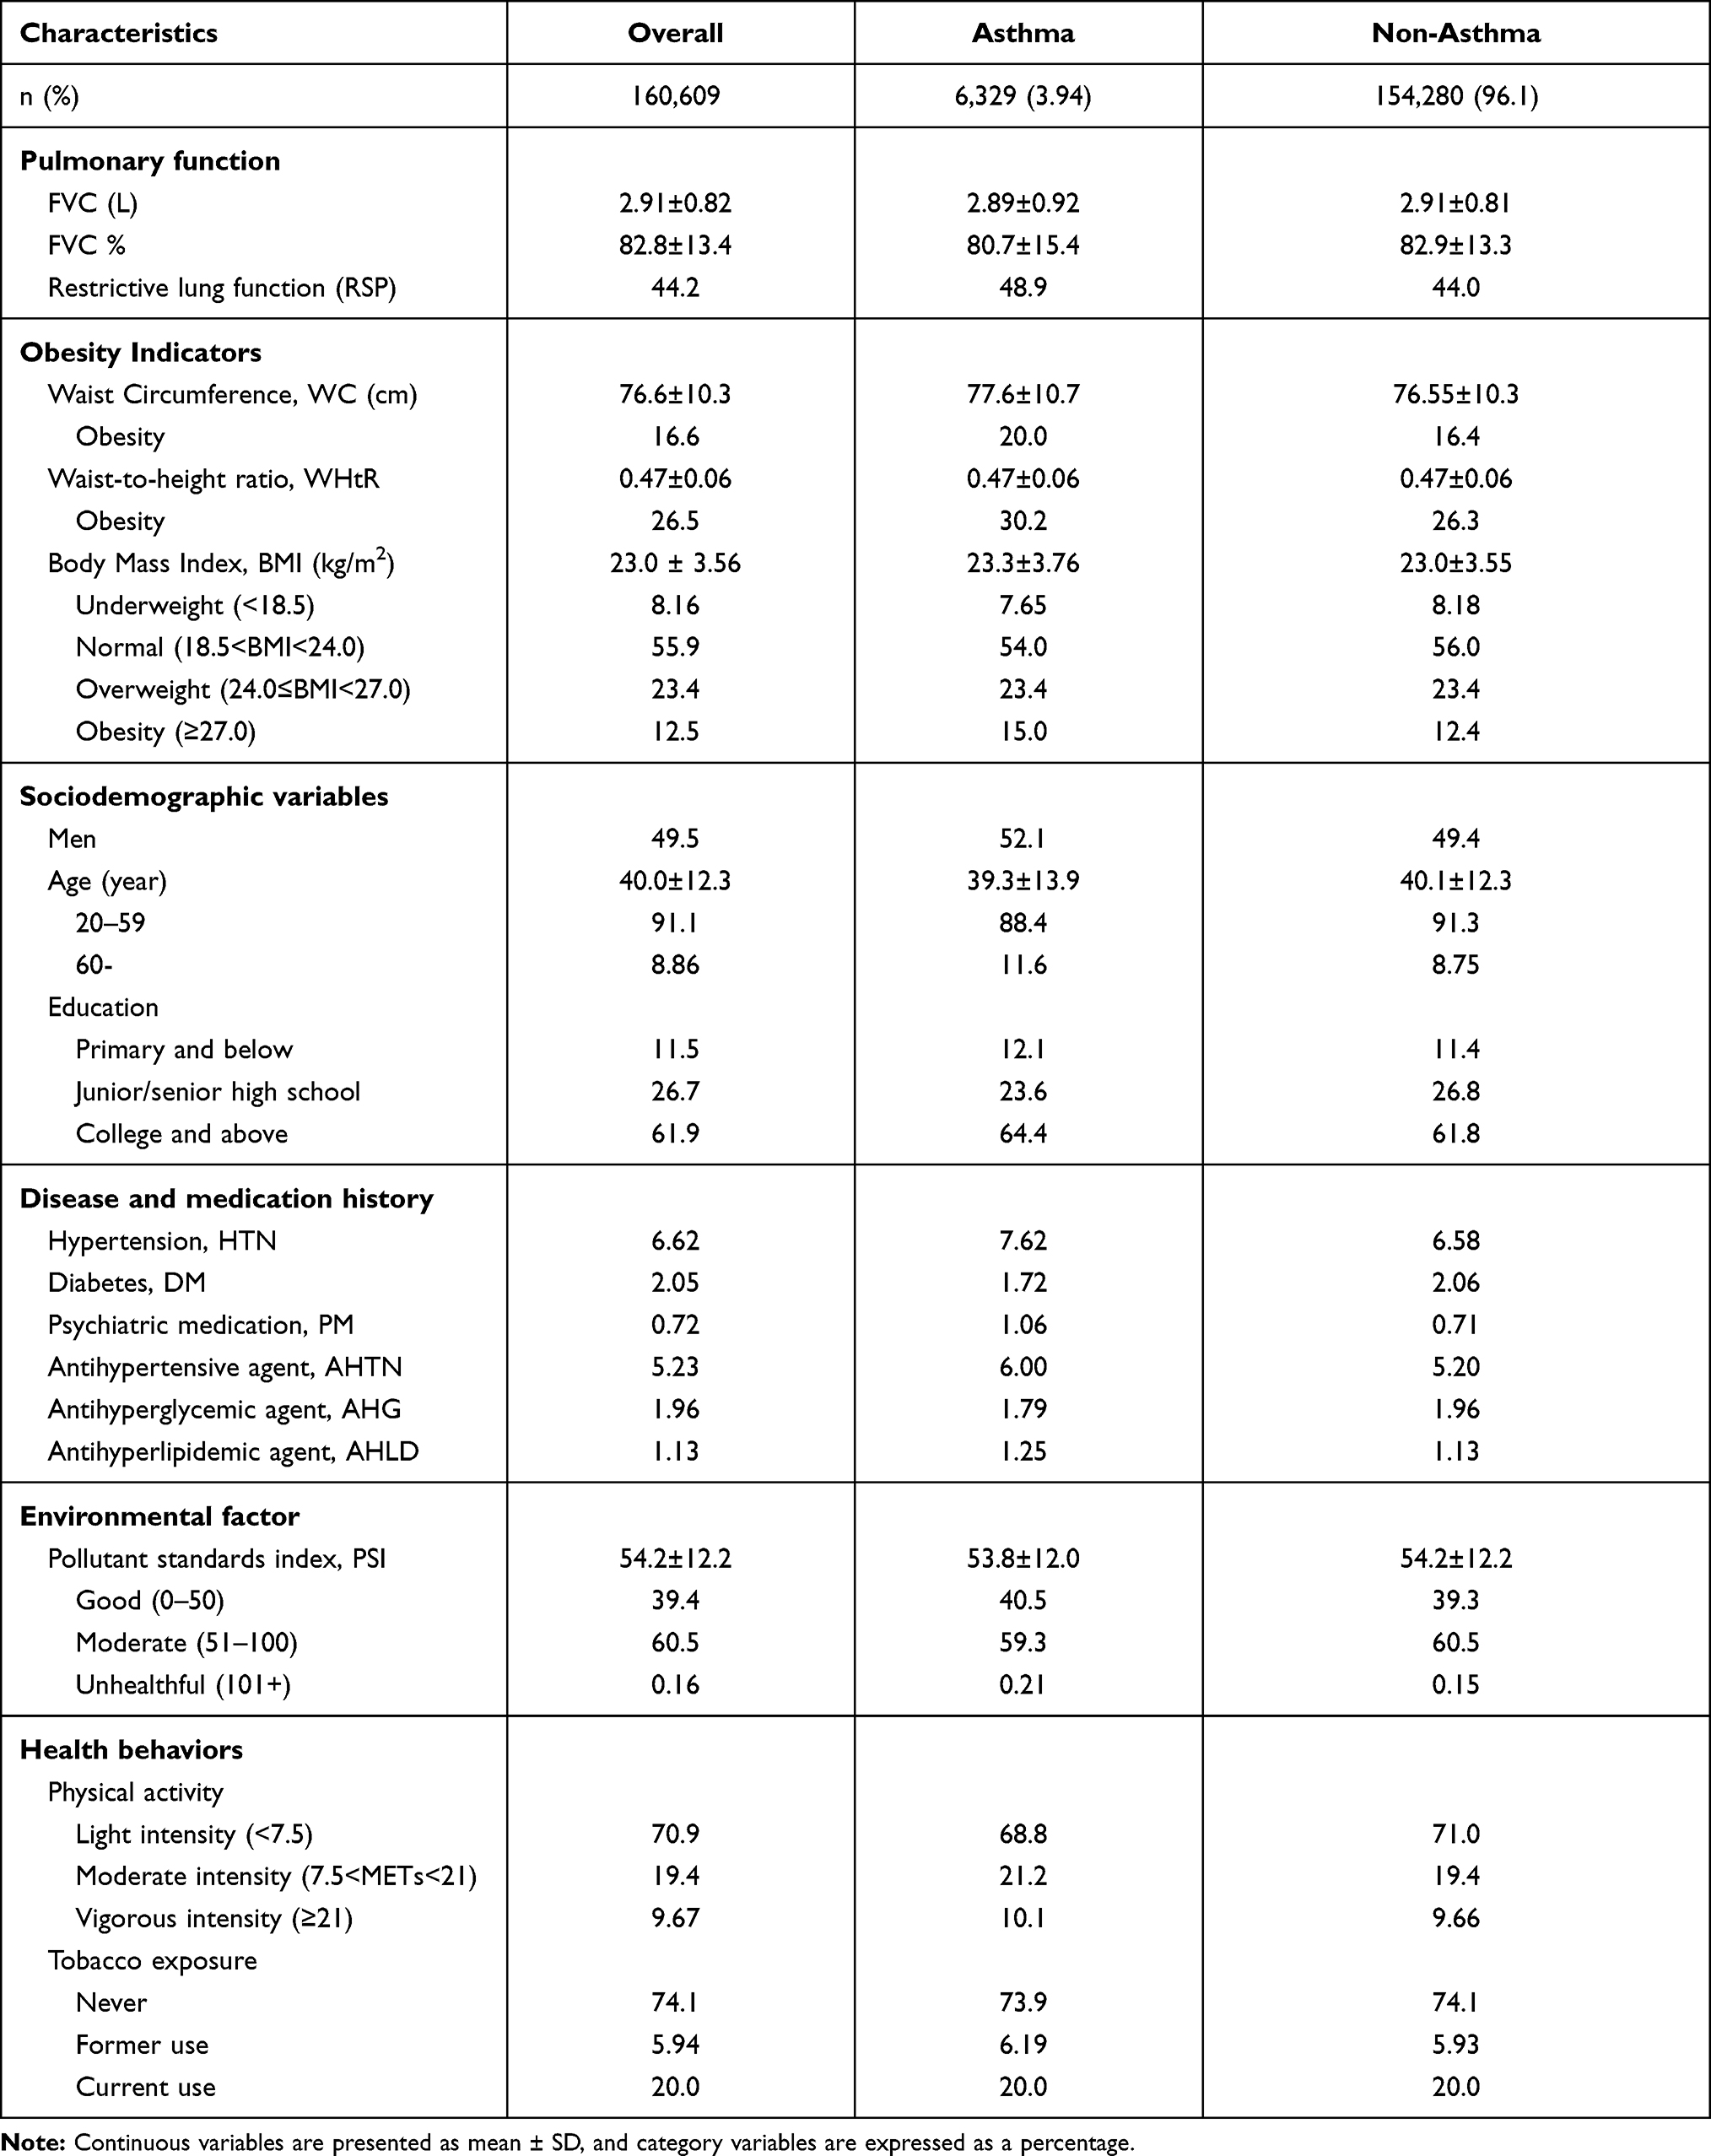 |
Table 1 Baseline Characteristics of Asthmatic and Non-Asthmatic Participants |
The association between pulmonary function and obesity in the asthma and non-asthma groups is shown in Figure 3. An adjusted multivariable GEE model showed that obesity and annual change in obesity indictors are independent risk factors for decreased FVC (Figure 3A) and FVC % (Figure 3B). Compared to the normal group, the FVC and FVC % of the participants with obesity classified using BMI significantly changed by- 0.11 L with a 95% CI of (-0.14, -0.08) and -1.91% (-2.64, -1.19) in asthmatic participants, respectively, and significantly changed by -0.08 L (-0.09, -0.08) and -1.48% (-1.63, -1.33) in non-asthmatic participants, respectively. A 1 kg/m2 increased from ΔBMI/year significantly changed FVC by -0.030 L (-0.048, -0.013) and FVC% by -0.603% (-1.063, -0.142) for asthmatics, and significantly changed FVC by -0.019 L (-0.022, -0.016) and FVC% by -0.304% (-0.393, -0.214) for non-asthmatics. The results of the central obesity indicators are similar to those of BMI. The obese group defined by WC compared with their counterparts had significantly decreased FVC and FVC%, respectively changed by -0.07 L (-0.09, -0.05) and -1.69% (-2.18, -1.19) in asthmatics, and by -0.04 L (-0.05, -0.04) and -1.25% (-1.35, -1.14) in non-asthmatics. A 1-cm increase from ΔWC/year respectively significantly changed FVC by -0.007 L (-0.011, -0.003) and FVC% by -0.149% (-0.264, -0.034) for asthmatics, and significantly changed FVC by -0.003L (-0.004, -0.002) and FVC% by -0.039% (-0.060, -0.019) for non-asthmatics. Compared with WHtR≤0.5, asthmatics with WHtR >0.5 had significantly changed FVC and FVC% by -0.11 L (-0.13, -0.10) and -1.41% (-1.89, -0.93), respectively; non-asthmatics with WHtR >0.5 had significantly changed FVC and FVC% by -0.09 L (-0.10, -0.09) and -0.95% (-1.04, -0.86), respectively. A 1% increase from ΔWHtR/year significantly changed FVC by -0.011 L (-0.018, -0.005) and FVC% by -0.213% (-0.402, -0.024) for asthmatics, and significantly changed FVC by -0.005 L (-0.006, -0.004) for non-asthmatics.
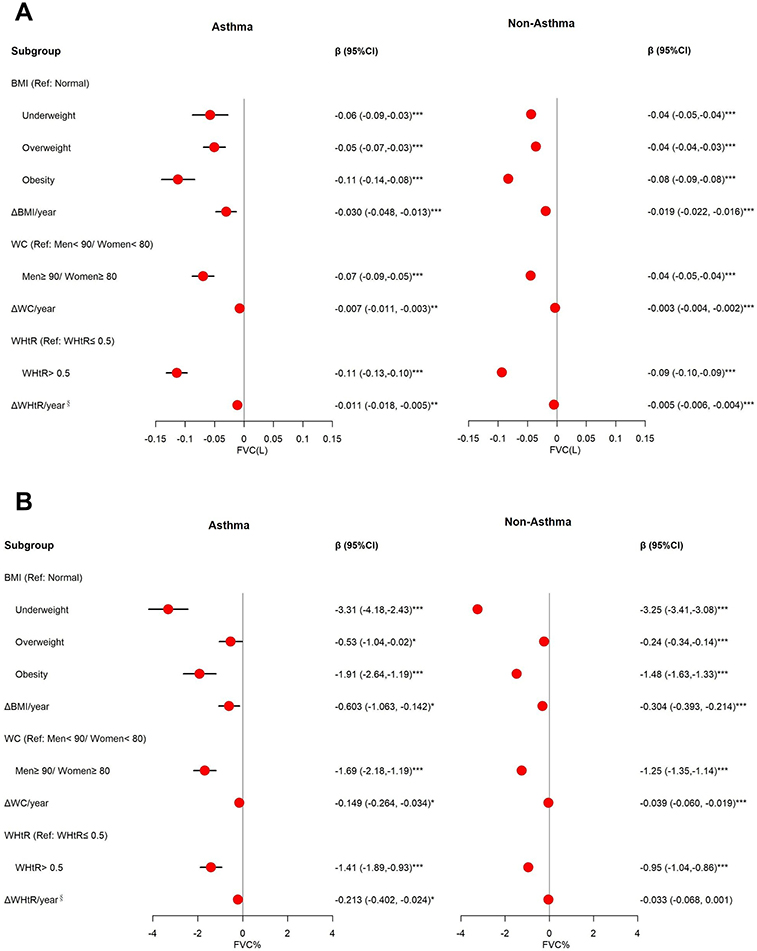 |
Figure 3 Effect of obesity indicators on FVC and FVC%. (A) The associations between obesity and FVC among asthma and non-asthma participants. Adjusted for season, sex, age group, education, HTN, DM†, AHTN†‡¶, AHG‡¶, psychiatric medication (PM)†‡¶, and pollutant standards index (PSI). (B) The associations between obesity and FVC% among asthma and non-asthma participants. Adjusted for season, sex, age group, education, PM, PSI, and physical activity. †, ‡, and ¶Means only adjustment in the BMI, WC, and WHtR, respectively. §Means per 1% increase. *p<0.05, **p<0.01, ***p<0.001. |
Figure 4 presents the ΔBMI/year (per 1-kg/m2 increase), ΔWC/year (per 1-cm increase), ΔWHtR/year (per 1% increase) and central obesity, which are all risk factors for accelerated lung function decline. Adjusted β (95% CI) of ΔBMI/year, ΔWC/year, and ΔWHtR/year are respectively -0.038 L (-0.054, -0.022), -0.006 L (-0.010, -0.002), and -0.009 L (-0.016, -0.003) of ΔFVC/year for individuals with asthma. Adjusted β (95% CI) of ΔBMI/year, ΔWC/year, and ΔWHtR/year are respectively -0.873% (-1.312, -0.435), -0.138% (-0.255, -0.021), and -0.194% (-0.387, -0.002) of ΔFVC%/year for individuals with asthma. The results are similar to those for persons without asthma.
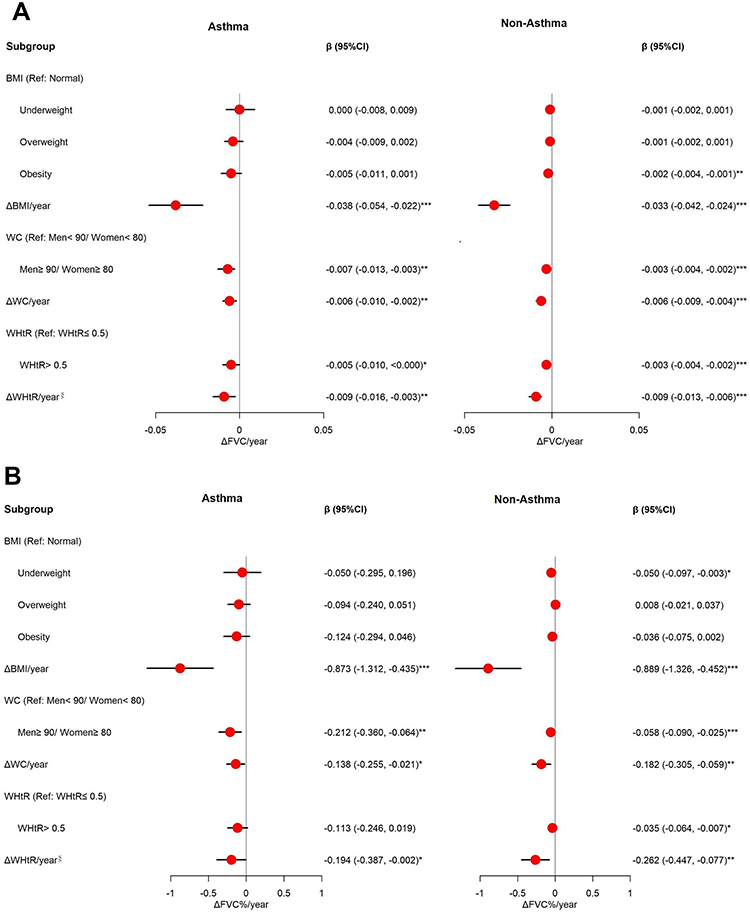 |
Figure 4 Effect of obesity indicators on ΔFVC/year and ΔFVC%/year. (A) The associations between obesity and ΔFVC/year among asthma and non-asthma participants. Adjusted for season, sex, age group, and education (B) The associations between obesity and ΔFVC%/year among asthma and non-asthma participants. Adjusted for season, sex, age, group, education, and PSI. §Means per 1% increase. *p<0.05, **p<0.01, ***p<0.001. |
All obesity indicators are associated with reduced lung function, and have a greater impact on asthmatics than non-asthmatics (Table 2).
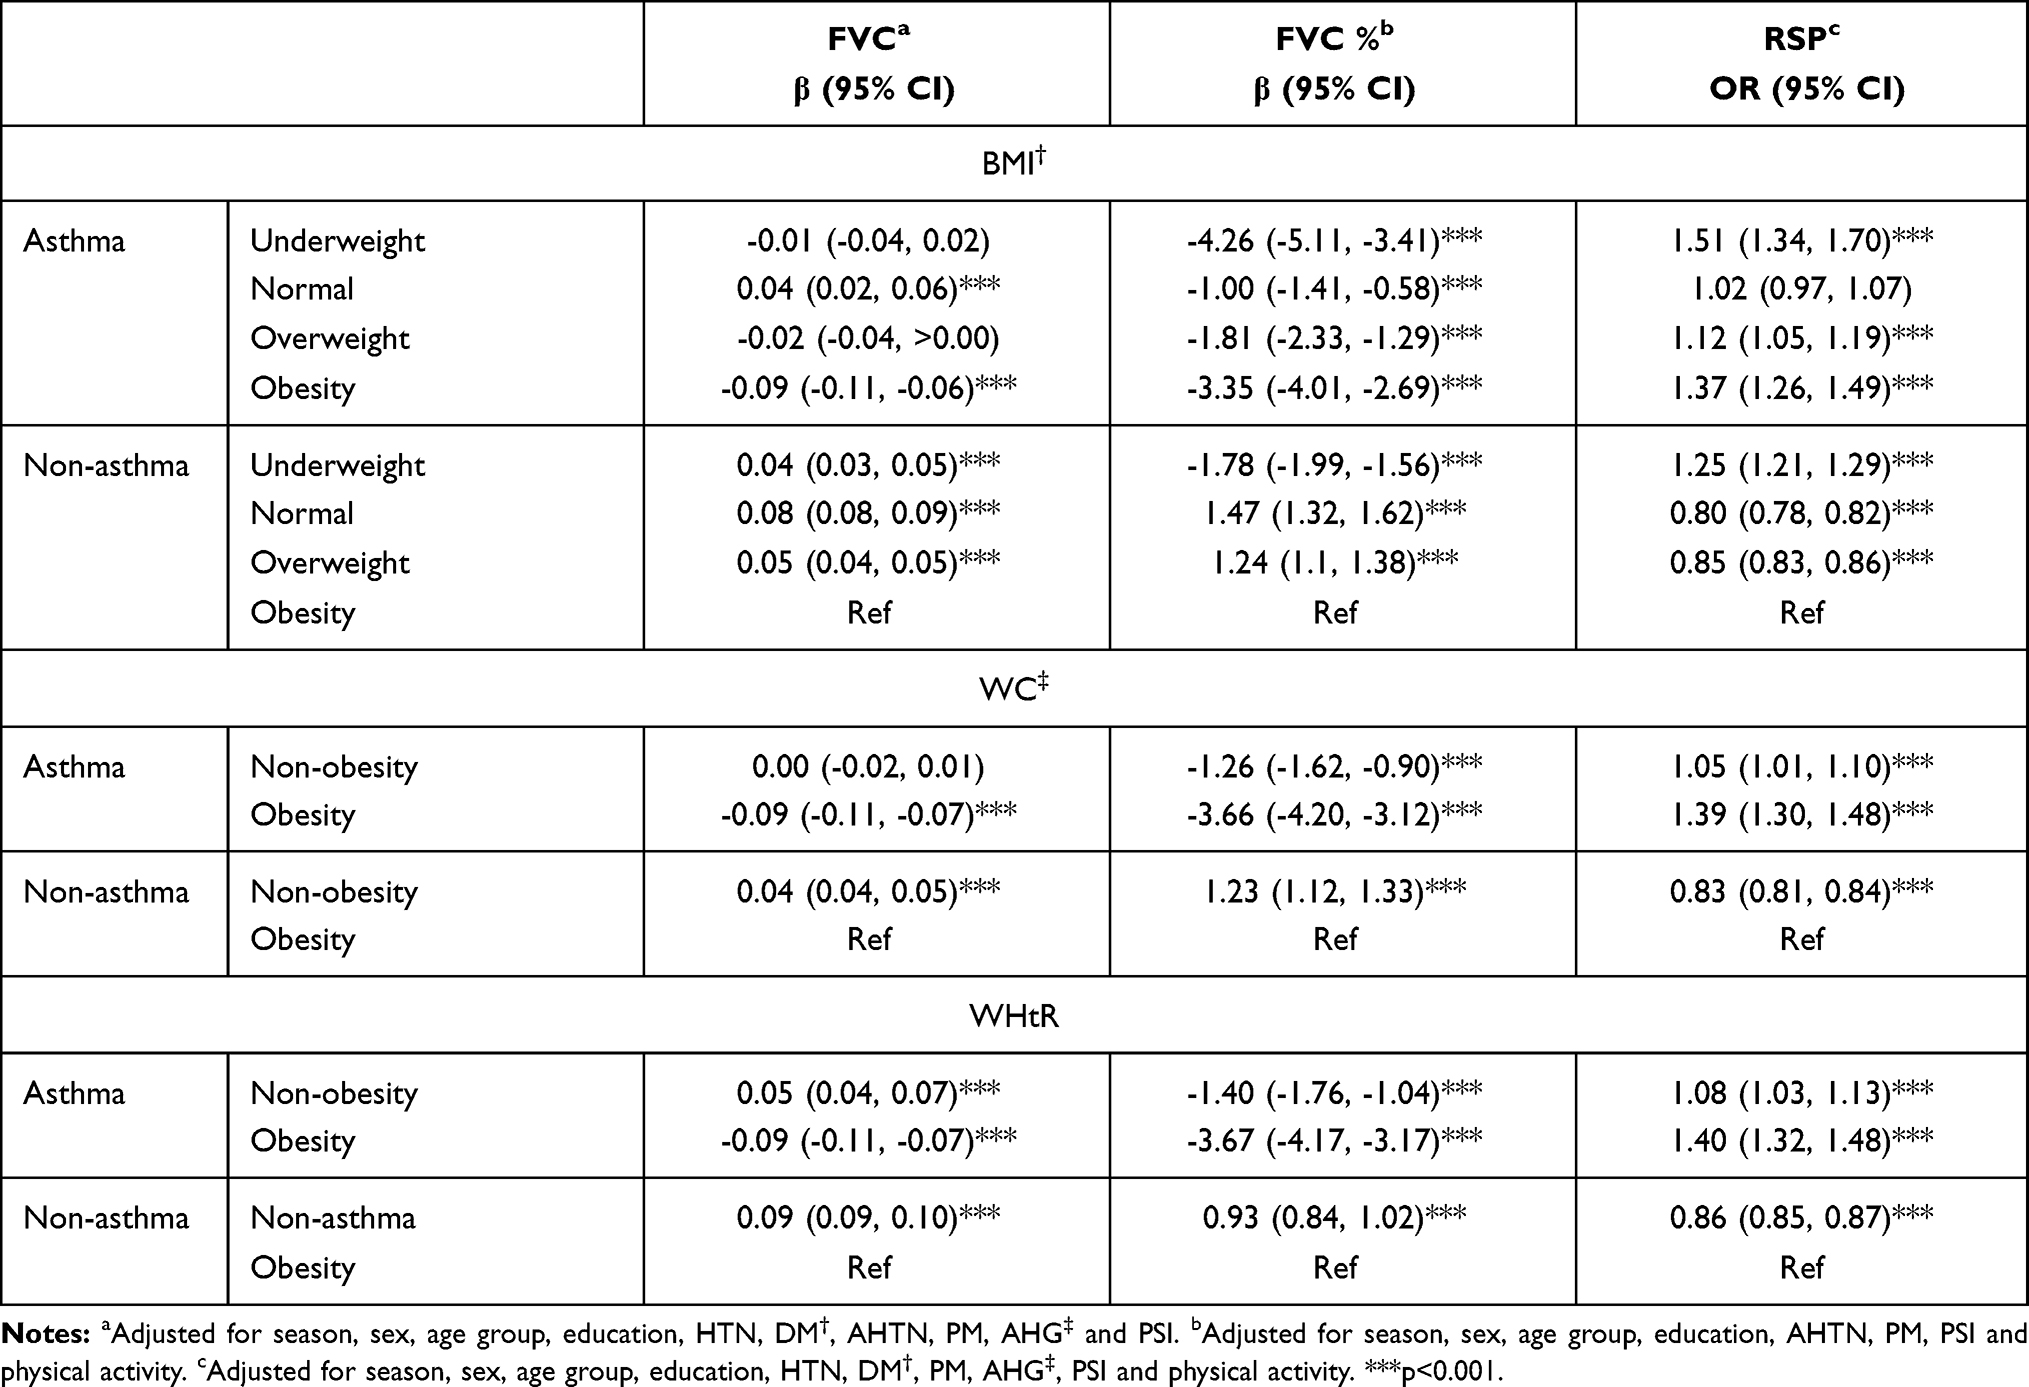 |
Table 2 Effect of Asthma Combined with Obesity on Lung Function |
The association between restrictive lung function and obesity in the asthma and non-asthma groups is shown in Figure 5. Obesity significantly increases the risk of restrictive lung function, and it is more prominent in the asthma group than in the non-asthma group. Compared with the normal group, individuals with obesity defined by BMI had significantly increased risk of RSP, with estimated odds ratios (OR) of 1.33 (1.21, 1.46) and 1.27 (1.24, 1.29) in asthmatic and non-asthmatic participants, respectively. The estimated OR of RSP for the obese group defined by WC is 1.25 (1.17, 1.34) higher in the asthma group and 1.22 (1.20, 1.24) higher in the non-asthma group compared to the non-obese group. When the obese group was defined by WHtR, the estimated OR of RSP is 1.20 (1.13, 1.29) higher than the non-obese group for asthmatic participants and 1.17 (1.16, 1.19) higher than the non-obese group for non-asthmatic participants.
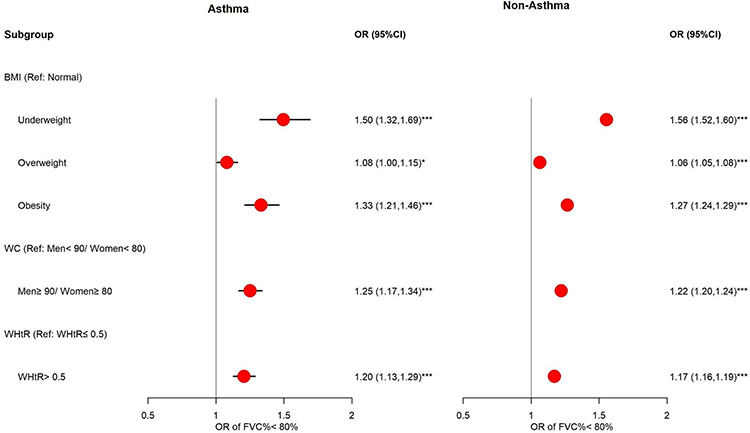 |
Figure 5 Effect of obesity indicators on restrictive lung function. The associations between obesity (defined by BMI, WC and WHtR) and restrictive lung function among asthma and non-asthma participants. Adjusted for season, sex, age group, education, psychiatric medication (PM), pollutant standards index (PSI), and physical activity. *p<0.05, ***p<0.001. |
In general, air pollution was negatively associated with lung function. Our multivariate models show that PSI was associated with decreased FVC (β (95% CI) = -0.02 (-0.03, -0.02)) and FVC% (-0.92 (-1.06, -0.77)), and a higher estimated OR of RSP (1.11 (1.09, 1.14)) in asthmatics. The results for non-asthmatics are similar to those for asthmatics (Tables S1–S3).
The effect of obesity indicators on FEV1, FEV1%, FEV1%<80%, and FEV1/FVC, and annual change of FEV1 and FEV1/FVC are shown in Table S4. Obesity is an independent risk factor for decreased FEV1 and FEV1%. Annual changes of obesity indictors are risk factors for accelerated FEV1 decline.
The role of disease and medication history in the relationship between obesity and lung function is complicated, and it may act as a confounder or a mediator due to timing differences. We excluded variables of disease and medication histories for sensitivity analysis, and the results were similar to the original results (Table S5).
Discussion
Previous studies have examined the impact of BMI and WC on lung function, but have rarely used WHtR as an indicator of obesity and analyzed the different association of obesity and lung function among asthmatic and non-asthmatic participants. To the best of our knowledge, this is the first study using longitudinal data to evaluate the obesity effect on lung function among asthmatic and non-asthmatic adults at the same time.
The main findings of the longitudinal study are that obesity is significantly and independently associated with decreased FVC, and is a more important determinant in asthmatics than in non-asthmatics. Additionally, we observe that among the three indicators of BMI, WC and WHtR, BMI is the best indicator to predict the decrease of FVC.
The association between obesity and lung function has been extensively studied, and several articles have provided opinions on the relationship between fat distribution and decreased lung function. Abdominal adipose tissue is more important as a determinant factor in impaired pulmonary function than other adiposity markers in the general population.12,33,34 Abdominal obesity and poor lung function are associated with excessive accumulation of adipose tissue in the thorax and abdomen and chronic low-grade systemic inflammation.35 However, we find that both WHtR and BMI are better predictors of a decrease in FVC than WC is.
Additionally, BMI but not WHtR and WC contributed to the best predictor of decrease in FVC % and RSP. This may be partly attributable to the fact that Asians tend to accumulate fat in the abdomen rather than the limbs.36,37 Our data found that participants’ baseline BMI was significantly positively correlated with WC and WHtR, and the partial correlation coefficients (adjusted for sex and age) were 0.86 and 0.87. In our additional analysis (Table S6), we found that participants who had both abnormal BMI (overweight and obesity) and also central obesity had substantially decreased lung function in both asthma and non-asthma groups. Furthermore, we still found that those with abnormal BMI in the non-obese group also had decreased lung function. Based on our findings, BMI is a more sensitive predictor of variation of lung function. The mechanism of airway closure mediating the relationship between obesity and bronchial hyperresponsiveness might be a possible explanation.38,39 The role of circulating leptin in pulmonary surfactant production, lung growth and development, and bronchial tone could impact airway hyperresponsiveness.38 Circulating leptin is considered more closely related to subcutaneous adipose tissue than visceral adipose tissue.40 This may explain why BMI rather than central obesity makes individuals prone to airway closure during bronchial stenosis.
We found that obesity has a higher risk of restrictive lung function, which is consistent with previous studies.41 The mechanism of restrictive lung disease is different from obstructive lung disease. Although we do not have more complete information (such as vital capacity, functional residual capacity, and total lung capacity) to accurately determine restrictive impairment, RSP can effectively exclude a restrictive disease.42 Additionally, restrictive lung function is a subtypes of asthma. The restrictive ventilatory impairment in asthma patients may reflect asthma severity and may be reversible after proper treatment.43,44 Based on the aforementioned two reasons, we excluded the persons who had PRS, and analyzed the relationship between obesity and FVC in asthmatic participants with normal lung function. We found that central obesity is more closely related to decreased lung function than general obesity, and WHtR is the best predictor of a decrease in lung function (Figure S2A and B). The results are similar to previous studies,45–47 and may support the idea that obesity affects the prognosis of asthma, especially central obesity. Additionally, WC is not a better predictor of decreased FVC, which may be attributed to not adjusting for height in the model. This speculation is supported by the results of Canoy et al33. However, ignoring the effect of height allows us to reflect more realistically the fact that WHtR is a better indicator. In short, fat distribution may be related to the pathogenesis of asthmatics with different subtypes. BMI is the most sensitive predictor of lower lung function. However, for asthma patients without RSP (normal lung function), WHtR is more sensitive than BMI.
Being underweight was more closely associated with lower FVC than obesity in our finding. A cross-sectional study of 282,135 healthy Korean adults by Do et al also reported that being underweight is associated with a significant decrease in FVC and an increased risk of FVC <80%. However, the effect of being underweight on lung function is no more prominent than that of obesity.48 This may be related to emphysema rather than an asthma-related decrease in lung function. Emphysema is defined by “abnormal, permanent enlargement of airspace distal to the terminal bronchiole, accompanied by the destruction of their walls, and without obvious fibrosis”49 It is well known that weight loss is a common symptom of patients with emphysema. And Guerra et al found that compared with normal participants, being underweight was significantly associated with emphysema (OR= 2.97; 95% CI= (1.33, 6.68)), but not significantly associated with asthma (OR= 1.31 (0.51, 3.41)) or chronic bronchitis (OR= 1.39 (0.77, 2.52)).50
The limitations of the present study come from the inherent disadvantages of self-reported and secondary data, as the former may involve recall limitations, while the latter have drawbacks such as the inability to obtain detailed information like more complete and accurate data on lung disease, clinical prognosis of asthma, and fat distribution. However, the use of secondary data still provides us with an opportunity to clarify the relationship between relevant factors and lay the foundation for further research. In addition, it is difficult to determine whether the restrictive pulmonary function effect of obesity in asthmatic patients is due to pseudo-restriction or an increased risk of asthma severity. However, we can be sure that obesity has a negative impact on lung function and is not conducive to the management of asthma.
Conclusion
Our results show a relationship between obesity and poor lung function in asthmatic and non-asthmatic participants. The results may support the hypothesis that obesity affects the prognosis in asthmatic participants, and is related to poorer lung function in non-asthmatic participants. Weight management is essential to prevent the deterioration of clinical symptoms of asthma patients, and BMI is the most sensitive indicator of FVC reduction.
Acknowledgments
All or part of the data used in this research were authorized by, and received from MJ Health Research Foundation (Authorization Code: MJHRF2017009A). Any interpretation or conclusion described in this paper does not represent the views of MJ Health Research Foundation.
Author Contributions
All authors made a significant contribution to the work reported, whether that is in the conception, study design, execution, acquisition of data, analysis and interpretation, or in all these areas; took part in drafting, revising or critically reviewing the article; gave final approval of the version to be published; have agreed on the journal to which the article has been submitted; and agreed to be accountable for all aspects of the work.
Funding
This research was supported by a grant titled “Obesity and asthma severity: interactions among health behaviors, genetic polymorphism, and environmental exposure” (grant number: AS-PH 109-01-2) from Academia Sinica. The funders had no role in study design, data collection and analysis, decision to publish, or preparation of the manuscript.
Disclosure
The authors declare that they have no conflicts of interest for this work.
References
1. Vos T, Abajobir AA, Abate KH, et al. Global, regional, and national incidence, prevalence, and years lived with disability for 328 diseases and injuries for 195 countries, 1990–2016: a systematic analysis for the Global Burden of Disease Study 2016. Lancet. 2017;390(10100):1211–1259.
2. World Health Organization (WHO). Asthma; 2020. Available from: https://www.who.int/news-room/fact-sheets/detail/asthma.
3. Taiwan Society of Pulmonary and Critical Care Medicine (TSPCCM), Cochrane Taiwan, Taiwan Health Promotion Administration (THPA). Asthma guideline; 2018 [
4. Global Initiative for Asthma (GINA). Global strategy for asthma management and prevention; 2020. Available from: https://ginasthma.org/wp-content/uploads/2020/06/GINA-2020-report_20_06_04-1-wms.pdf.
5. Taiwan Health Promotion Administration (THPA). Taiwan’s obesity prevention and management strategy; 2018. Available from: https://www.hpa.gov.tw/File/Attach/10299/File_11744.pdf.
6. Boulet LP. Asthma and obesity. Clin Exp Allergy. 2013;43(1):8–21. doi:10.1111/j.1365-2222.2012.04040.x
7. Peters U, Dixon AE, Forno E. Obesity and asthma. J Allergy Clin Immunol. 2018;141(4):1169–1179. doi:10.1016/j.jaci.2018.02.004
8. Chen Y-C, Fan H-Y, Huang Y-T, Huang S-Y, Liou T-H, Lee YL. Causal relationships between adiposity and childhood asthma: bi-directional Mendelian Randomization analysis. Int J Obes. 2019;43(1):73–81. doi:10.1038/s41366-018-0160-8
9. Xu S, Gilliland FD, Conti DV. Elucidation of causal direction between asthma and obesity: a bi-directional Mendelian randomization study. Int J Epidemiol. 2019;48(3):899–907. doi:10.1093/ije/dyz070
10. Peralta GP, Marcon A, Carsin A-E, et al. Body mass index and weight change are associated with adult lung function trajectories: the prospective ECRHS study. Thorax. 2020;75(4):313–320. doi:10.1136/thoraxjnl-2019-213880
11. Wehrmeister FC, Menezes AMB, Muniz LC, Martínez-Mesa J, Domingues MR, Horta BL. Waist circumference and pulmonary function: a systematic review and meta-analysis. Syst Rev. 2012;1(1):55. doi:10.1186/2046-4053-1-55
12. Ochs-Balcom HM, Grant BJ, Muti P, et al. Pulmonary function and abdominal adiposity in the general population. Chest. 2006;129(4):853–862. doi:10.1378/chest.129.4.853
13. Ross R, Neeland IJ, Yamashita S. et al. Waist circumference as a vital sign in clinical practice: a Consensus Statement from the IAS and ICCR Working Group on Visceral Obesity. Nat Rev Endocrinol;2020. 1–13. doi:10.1038/s41574-019-0289-0
14. Rothman KJ. BMI-related errors in the measurement of obesity. Int J Obes. 2008;32(3):S56–S59. doi:10.1038/ijo.2008.87
15. Ashwell M, Gunn P, Gibson S. Waist‐to‐height ratio is a better screening tool than waist circumference and BMI for adult cardiometabolic risk factors: systematic review and meta‐analysis. Obes Rev. 2012;13(3):275–286. doi:10.1111/j.1467-789X.2011.00952.x
16. Medbø A, Melbye H. Lung function testing in the elderly—can we still use FEV1/FVC< 70% as a criterion of COPD? Respir Med. 2007;101(6):1097–1105. doi:10.1016/j.rmed.2006.11.019
17. Quanjer PH, Stanojevic S, Cole TJ, et al. Multi-ethnic reference values for spirometry for the 3–95-yr age range: the global lung function 2012 equations. Eur Respir J. 2012;40(6):1324–1343. doi:10.1183/09031936.00080312
18. Godfrey MS, Jankowich MD. The vital capacity is vital: epidemiology and clinical significance of the restrictive spirometry pattern. Chest. 2016;149(1):238–251. doi:10.1378/chest.15-1045
19. Aaron SD, Dales RE, Cardinal P. How accurate is spirometry at predicting restrictive pulmonary impairment? Chest. 1999;115(3):869–873. doi:10.1378/chest.115.3.869
20. Wu X, Tsai SP, Tsao CK, et al. Cohort Profile: the Taiwan MJ Cohort: half a million Chinese with repeated health surveillance data. Int J Epidemiol. 2017;46(6):1744–1744g. doi:10.1093/ije/dyw282
21. Taiwan Health Promotion Administration (THPA). Evidences-based guideline on adult obesity prevention and management; 2018. Available from: https://www.hpa.gov.tw/File/Attach/10042/File_12271.pdf.
22. Browning LM, Hsieh SD, Ashwell M. A systematic review of waist-to-height ratio as a screening tool for the prediction of cardiovascular disease and diabetes: 0.5 could be a suitable global boundary value. Nutr Res Rev. 2010;23(2):247–269. doi:10.1017/S0954422410000144
23. Schnabel E, Karrasch S, Schulz H, et al. High blood pressure, antihypertensive medication and lung function in a general adult population. Respir Res. 2011;12(1):50. doi:10.1186/1465-9921-12-50
24. Rogliani P, Ora J, Di Daniele N, Lauro D. Pleiotropic effects of hypoglycemic agents: implications in asthma and COPD. Curr Opin Pharmacol. 2018;40:34–38. doi:10.1016/j.coph.2018.01.002
25. Partti K, Vasankari T, Kanervisto M, et al. Lung function and respiratory diseases in people with psychosis: population-based study. Br J Psychiatry. 2015;207(1):37–45. doi:10.1192/bjp.bp.113.141937
26. Bhattacharjee D, Chogtu B, Magazine R. Statins in asthma: potential beneficial effects and limitations. Pulm Med. 2015;2015:1–13. doi:10.1155/2015/835204
27. Teach SJ, Gergen PJ, Szefler SJ, et al. Seasonal risk factors for asthma exacerbations among inner-city children. J Allergy Clin Immunol. 2015;135(6):1465–1473. e1465.
28. To T, Shen S, Atenafu EG, et al. The air quality health index and asthma morbidity: a population-based study. Environ Health Perspect. 2013;121(1):46–52. doi:10.1289/ehp.1104816
29. Bridger R. A Guide to Active Working in the Modern Office: Homo Sedens in the 21st Century. CRC Press; 2019.
30. Lee I-M, Djoussé L, Sesso HD, Wang L, Buring JE. Physical activity and weight gain prevention. JAMA. 2010;303(12):1173–1179. doi:10.1001/jama.2010.312
31. Pan W. Akaike’s information criterion in generalized estimating equations. Biometrics. 2001;57(1):120–125. doi:10.1111/j.0006-341X.2001.00120.x
32. R Core Team. R: a language and environment for statistical computing. Vienna, Austria: R Foundation for Statistical Computing; 2020. Available from: https://www.R-project.org/.
33. Canoy D, Luben R, Welch A, et al. Abdominal obesity and respiratory function in men and women in the EPIC-Norfolk Study, United Kingdom. Am J Epidemiol. 2004;159(12):1140–1149. doi:10.1093/aje/kwh155
34. Svartengren M, Cai G-H, Malinovschi A, et al. The impact of body mass index, central obesity and physical activity on lung function: results of the EpiHealth study. ERJ Open Res. 2020;6(4):00214–2020. doi:10.1183/23120541.00214-2020
35. Mafort TT, Rufino R, Costa CH, Lopes AJ. Obesity: systemic and pulmonary complications, biochemical abnormalities, and impairment of lung function. Multidiscip Respir Med. 2016;11(1):1–11. doi:10.1186/s40248-016-0066-z
36. Rush EC, Freitas I, Plank LD. Body size, body composition and fat distribution: comparative analysis of European, Maori, Pacific Island and Asian Indian adults. Br J Nutr. 2009;102(4):632–641. doi:10.1017/S0007114508207221
37. Kohli S, Sniderman AD, Tchernof A, Lear SA. Ethnic‐specific differences in abdominal subcutaneous adipose tissue compartments. Obesity. 2010;18(11):2177–2183. doi:10.1038/oby.2010.94
38. Peters U, Subramanian M, Chapman DG, et al. BMI but not central obesity predisposes to airway closure during bronchoconstriction. Respirology. 2019;24(6):543–550. doi:10.1111/resp.13478
39. Burgess JA, Matheson MC, Diao F, et al. Bronchial hyperresponsiveness and obesity in middle age: insights from an Australian cohort. Eur Respir J. 2017;50(3):1602181. doi:10.1183/13993003.02181-2016
40. Tinggaard J, Hagen CP, Christensen AN, et al. Anthropometry, DXA, and leptin reflect subcutaneous but not visceral abdominal adipose tissue on MRI in 197 healthy adolescents. Pediatr Res. 2017;82(4):620–628. doi:10.1038/pr.2017.138
41. Kurth L, Hnizdo E. Change in prevalence of restrictive lung impairment in the US population and associated risk factors: the National Health and Nutrition Examination Survey (NHANES) 1988–1994 and 2007–2010. Multidiscip Respir Med. 2015;10(1):7. doi:10.1186/s40248-015-0003-6
42. Torén K, Schiöler L, Brisman J, et al. Restrictive spirometric pattern and true pulmonary restriction in a general population sample aged 50–64 years. BMC Pulm Med. 2020;20(1):1–7. doi:10.1186/s12890-020-1096-z
43. Miller A, Palecki A. Restrictive impairment in patients with asthma. Respir Med. 2007;101(2):272–276. doi:10.1016/j.rmed.2006.05.008
44. Rothe T. True restrictive ventilatory pattern in asthma. J Asthma. 2010;47(4):397–399. doi:10.3109/02770901003724000
45. Capelo A, Da Fonseca V, Peixoto M, et al. Visceral adiposity is associated with cytokines and decrease in lung function in women with persistent asthma. Rev Port Pneumol. 2016;22(5):255–261. doi:10.1016/j.rppnen.2016.02.005
46. Von Behren J, Lipsett M, Horn-Ross PL, et al. Obesity, waist size and prevalence of current asthma in the California Teachers Study cohort. Thorax. 2009;64(10):889–893. doi:10.1136/thx.2009.114579
47. Goudarzi H, Konno S, Kimura H, et al. Impact of abdominal visceral adiposity on adult asthma symptoms. J Allergy Clin Immunol Pract. 2019;7(4):1222–1229. e1225. doi:10.1016/j.jaip.2018.11.014
48. Do JG, Park C-H, Lee Y-T, Yoon KJ. Association between underweight and pulmonary function in 282,135 healthy adults: a cross-sectional study in Korean population. Sci Rep. 2019;9(1):1–10. doi:10.1038/s41598-019-50488-3
49. Snider GL, Kleinerman J, Thurlbeck WM, Bengali ZH. The definition of emphysema: report of a National Heart, Lung, and Blood Institute, Division of Lung Diseases workshop. Am Rev Respir Dis. 1985;132(1):182–185.
50. Guerra S, Sherrill DL, Bobadilla A, Martinez FD, Barbee RA. The relation of body mass index to asthma, chronic bronchitis, and emphysema. Chest. 2002;122(4):1256–1263. doi:10.1378/chest.122.4.1256
 © 2021 The Author(s). This work is published and licensed by Dove Medical Press Limited. The full terms of this license are available at https://www.dovepress.com/terms.php and incorporate the Creative Commons Attribution - Non Commercial (unported, v3.0) License.
By accessing the work you hereby accept the Terms. Non-commercial uses of the work are permitted without any further permission from Dove Medical Press Limited, provided the work is properly attributed. For permission for commercial use of this work, please see paragraphs 4.2 and 5 of our Terms.
© 2021 The Author(s). This work is published and licensed by Dove Medical Press Limited. The full terms of this license are available at https://www.dovepress.com/terms.php and incorporate the Creative Commons Attribution - Non Commercial (unported, v3.0) License.
By accessing the work you hereby accept the Terms. Non-commercial uses of the work are permitted without any further permission from Dove Medical Press Limited, provided the work is properly attributed. For permission for commercial use of this work, please see paragraphs 4.2 and 5 of our Terms.