")
Back to Journals » Therapeutics and Clinical Risk Management » Volume 14
The effects of AER and eGFR on outcomes of CVD in patients with T2DM in an urban community over 8 years of multifactorial treatment: the Beijing Communities Diabetes Study 18
Authors Zhang XL , Yuan MX , Wan G, Yang GR , Li D , Fu HJ, Zhu LX, Xie RR, Zhang JD, Lv YJ, Li YL, Du XP, Wang ZM, Cui XL, Liu DY, Gao Y, Cheng SY, Wang Q, Ji Y, Li GW, Yuan SY
Received 12 April 2018
Accepted for publication 15 July 2018
Published 31 August 2018 Volume 2018:14 Pages 1537—1545
DOI https://doi.org/10.2147/TCRM.S170915
Checked for plagiarism Yes
Review by Single anonymous peer review
Peer reviewer comments 2
Editor who approved publication: Dr Deyun Wang
Xue-Lian Zhang,1 Ming-Xia Yuan,1 Gang Wan,2 Guang-Ran Yang,1 Dong-Mei Li,3 Han-Jing Fu,1 Liang-Xiang Zhu,1 Rong-Rong Xie,1 Jian-Dong Zhang,4 Yu-Jie Lv,5 Yu-Ling Li,6 Xue-Ping Du,7 Zi-Ming Wang,8 Xue-Li Cui,9 De-Yuan Liu,10 Ying Gao,11 Shu-Yan Cheng,12 Qian Wang,13 Yu Ji,14 Guang-Wei Li,15,16 Shen-Yuan Yuan1
1Department of Endocrinology, Beijing Tongren Hospital, Capital Medical University, Beijing, People’s Republic of China; 2Medical Records and Statistics Department, Beijing Ditan Hospital, Capital Medical University, Beijing, People’s Republic of China; 3Clinical and Translational Science Institute, School of Medicine and Dentistry, University of Rochester, Rochester, NY, USA; 4Department of General Practice, Jinsong Community Health Service Center, Beijing, People’s Republic of China; 5Department of General Practice, Cuigezhuang Community Health Service Center, Beijing, People’s Republic of China; 6Department of General Practice, Xinjiekou Community Health Service Center, Beijing, People’s Republic of China; 7Department of General Practice, Yuetan Community Health Service Center of Fuxing Hospital, Capital Medical University, Beijing, People’s Republic of China; 8Department of General Practice, Jiangtai Community Health Service Center, Beijing, People’s Republic of China; 9Department of General Practice, Sanlitun Community Health Service Center, Beijing, People’s Republic of China; 10Department of General Practice, Zuojiazhuang Community Health Service Center, Beijing, People’s Republic of China; 11Department of General Practice, The First People’s Hospital of Chongwen District, Beijing, People’s Republic of China; 12Department of General Practice, Balizhuang Community Health Service Center, Beijing, People’s Republic of China; 13Department of General Practice, Majiapu Community Health Service Center, Beijing, People’s Republic of China; 14Department of Endocrinology, Beijing Aerospace General Hospital, Beijing, People’s Republic of China; 15Department of Endocrinology, China-Japan Friendship Hospital, Beijing, People’s Republic of China; 16Center of Endocrinology and Cardiovascular Disease, Department of Endocrinology, National Center of Cardiology and Fuwai Hospital, Beijing, People’s Republic of China
Objective: It is well known that diabetic kidney disease is a risk factor for cardiovascular diseases (CVD) in patients with type 2 diabetes mellitus (T2DM). In this study, the effects of urine albumin excretion rate (AER) and estimated glomerular filtration rate (eGFR) on CVD outcomes were analyzed in a population of T2DM.
Methods: The study was carried out using recorded information of a cohort study. A total of 1,914 patients with T2DM with no prevalent CVD were enrolled in an 8 years prospective study and received multifactorial intervention. The risk of CVD outcomes was assessed according to chronic kidney disease staging, which was categorized using AER (mg/d) and eGFR (mL/min/1.73 m2). The effects of AER and eGFR on risk of CVD onset were also analyzed.
Results: During the follow-up period (median 6.8 years), 71 CVD events occurred. At baseline, those with AER ≥300 mg/d and coexisting eGFR 60–89 mL/min/ 1.73 m2 or <60 mL/min/1.73 m2 showed increased risk for CVD outcomes when compared with “no chronic kidney disease” (AER <30 mg/d and eGFR ≥90 mL/min/1.73 m2). The increased CVD risk was observed in patients who progressed to AER ≥30 mg/d during the follow-up period, whereas patients who progressed to eGFR <90 mL/min/1.73 m2 alone showed no increased CVD risk. During the follow-up period, after multifactorial intervention, 8.7% patients with microalbuminuria and 1.8% patients with overt nephropathy reversed to normoalbuminuria or microalbuminuria.
Conclusion: AER is a more sensitive predictor than eGFR for CVD outcomes in T2DM patients. Overt nephropathy can be reversed after multifactorial intervention.
Keywords: albumin excretion rate, cardiovascular disease, chronic kidney disease, diabetic nephropathy, glomerular filtration rate
Introduction
Diabetic kidney disease (DKD) is one of the most common microvascular complications of diabetes which results in end-stage renal disease, as reported by 2015 USRDS Annual Data. It was estimated that 20%–40% of patients with type 2 diabetes mellitus (T2DM) will develop a moderate or severe impairment of renal function.1
DKD is characterized by albuminuria and reduced renal function. In normal healthy kidney, only a tiny amount of albumin is leaked into the urine, usually <30 mg/d. Elevated albuminuria is typically the first sign of DKD. Microalbuminuria is defined as urine albumin between 30 and 300 mg/d. Microalbuminuria is not only one of the first clinical signs of DKD, but also a marker of renal progression and a risk factor for all-cause and cardiovascular disease (CVD) mortality.2
A new classification for chronic kidney disease (CKD) categorized by the stages of estimated glomerular filtration rate (eGFR) and urine albumin excretion rate (AER) was proposed by Kidney Disease Improving Global Outcomes,3 which recommends all patients with diabetes should be screened using eGFR and AER.
In a cross-sectional study, 20% patients with advanced renal insufficiency had normoalbuminuria, and these patients also had a higher risk of CVD.4 On the contrary, another study showed that the outcomes of CVD were not significantly different between diabetic patients with macroalbuminuria and normoalbuminuria.5 As the abovementioned studies are cross-sectional in nature, prospective studies are needed to investigate the long-term prognosis of diabetic patients’ renal function and cardiovascular outcomes.
In this study, the effects of AER and eGFR on outcomes of CVD were analyzed in a population of T2DM patients after multifactorial intervention. We aimed to assess the predictive values of the AER and eGFR for cardiovascular outcomes in type 2 diabetes, using the data from a large-scale prospective cohort study – the Beijing Communities Diabetes Study (BCDS).
Methods
Initial study population
The details of the BCDS study have been published previously.6 For the present study, briefly, 1,914 T2DM patients with no prevalent CVD aged between 20 and 80 years were recruited from 23 community health centers in Beijing between August 2008 to July 2009 (Figure 1). Institutional review board and ethics committee approval was obtained from the Beijing Tongren Hospital Ethical Committee in accordance with the guidelines of the Declaration of Helsinki, and written informed consent was obtained from all participants. The exclusion criteria included the following: 1) patients without baseline data of urinary AER or serum Cr; 2) patients with AER detection only once or without centralization. 3) AER or eGFR detected only once.
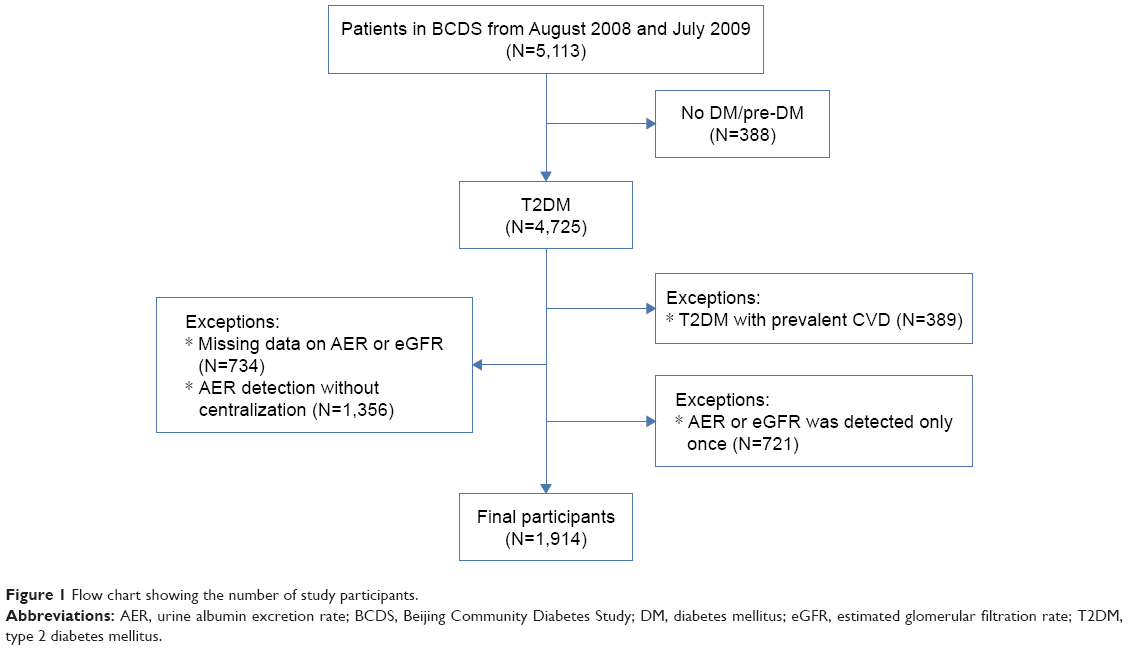 | Figure 1 Flow chart showing the number of study participants. |
Study protocol and clinical evaluation
T2DM was defined according to the criteria of the World Health Organization as positive finding from any 2 of the following tests on different days: symptoms of DM plus casual plasma glucose concentration 200 mg/dL (11.1 mmol/L) or fasting plasma glucose concentration 126 mg/dL (7.0 mmol/L) or a 2-hour posttest plasma glucose concentration of 200 mg/dL (11.1 mmol/L) after a 75 g oral glucose load. The study has been described in detail recently.7 Patients were considered hypertensive if they reported current use of antihypertensive medications and/or had a systolic blood pressure (BP) ≥140 mmHg and/or diastolic BP ≥90 mmHg.
Fasting blood samples were obtained for measurements of blood glucose, HbA1c, and serum concentrations of Cr and lipids, which were measured by a central endocrinology laboratory in Beijing Tongren Hospital. AER, which was performed via a centralized 8-hour overnight urine collection, and was measured by chemiluminescence assay (IMMULITE 1000, Siemens, Munich, Germany). To confirm the accuracy of the results in large cohort study, the detection methods for AER in this study are the same, and more than 2 tests were performed for each patient. All the instruments and inspections were unified. Data containing nonstandardized tests were removed.
After blood sampling, all patients underwent a resting 12-lead electrocardiogram. Angina pectoris and/or >0.1 mV ST segment deviation during a treadmill maximal exercise stress test were recorded. Nonstereoscopic photographs of the central fundus were taken for all eyes.
According to the new classification of CKD, the albuminuria category was classified using 2 of 3 samples at baseline being in the stages AER <30 mg/d (<30 mg/d, normo-albuminuria), AER ≥30 and <300 mg/d (≥30 and <300 mg/d, micro-albuminuria), and AER ≥300 mg/d (≥300 mg/d, overt nephropathy). eGFR was estimated using the modification of diet in renal disease (MDRD) formula developed by China’s eGFR cooperative group in 2006.8
The mean of 2 consecutive measures of eGFR was calculated at baseline for each patient. CKD stages were classified by 3 categories based on albuminuria and eGFR levels: AER <30, 30–<300 and ≥300 mg/d; and eGFR ≥90, 60–89, and <60 mL/min/1.73 m2. In this study, AER <30 mg/d and eGFR ≥90 mL/min/1.73 m2 was defined as “no CKD.”
Follow-up and outcomes
More than 200 general practitioners participated in this ongoing prospective study. Training courses were held before starting the intervention to standardize the protocol, methodology, and quality control. The patients were regularly monitored by their family doctors on a one-to-one basis during the follow-up period. The doctors in the community were systematically educated by professors of endocrinology that come from a top-tier hospital.
All the patients received multifactorial treatment: a stepwise implementation of diet control, behavior modification, and the optimum management strategy that targeted hyperglycemia, hypertension, and dyslipidemia. All the metabolic variables were detected, and the early detection and intervention of complications were carried out. A major focus on comprehensive cardiovascular risk reduction includes blood glucose, blood pressure, and lipid profiles. Monitoring approaches were as following: patients were examined at clinic visits every 3 months; HbA1c, AER, and serum lipid profile were measured every half a year; electrocardiogram and eye examination were done every 6–12 months. Treatment goals recommended by the Chinese guidelines for prevention and treatment of T2DM were HbA1c <7.0%, BP <140/80 mmHg, and low-density lipoprotein-cholesterol <2.6 mmol/L (100 mg/dL).
In this study, cardiovascular events were defined as first nonfatal or fatal cardiovascular events, including myocardial infarction, unstable angina pectoris, heart failure hospitalization, coronary bypass, percutaneous transluminal coronary angioplasty, and stent implantation. The occurrence of composite outcome including macrovascular complications (such as myocardial infarction, heart failure, cerebral infarction, and stroke), newly diagnosed microalbuminuria, aggravation of diabetic nephropathy (clinical grade proteinuria, a 2-fold increase in plasma creatinine, or renal replacement therapy), and malignant tumors were recorded.9 An independent endpoint adjudication committee assessed all potential endpoints and classified them. Especially, progression and regression of albuminuria and eGFR stage during the follow-up were recorded. Both AER and eGFR were measured twice a year.
Statistical analysis
The BCDS database was set up using EpiData 3.0 software (The EpiData Association, Odense, Denmark). Statistical analysis was performed using SAS® software (version 9.0, SAS Institute Inc., Cary, NC, USA). The results were expressed as means ± SD or medians and interquartile range (Q1, Q3). The analysis of variance and χ2 test were used to compare continuous and categorical variables, respectively. Kaplan–Meier estimates of the risk for the final clinical endpoints were made. Cox regression analyses were performed to estimate risk factors influenced events of CVD events and composite endpoints. All tests were 2-sided, and the level of significance was established as P<0.05.
Results
Baseline characteristics
The clinical and anthropometric characteristics of the study group stratified by albuminuria stage are shown in Table 1. In this study, the mean age and body mass index of all patients were 66.4±10.1 years and 25.5±3.5 kg/m2, respectively, and the duration of illness was 5.7–17.8 years. The proportion of hypertensive patients, smokers, and those taking rennin–angiotensin system (RAS) inhibitors were 71.11%, 16.84%, and 14%.
 | Table 1 Baseline anthropometric and clinical parameters according to the groups |
According to staging by albuminuria, patients with advanced stages showed increased age, fasting blood glucose, HbA1c, systolic BP, total cholesterol, triglyceride, and uric acid levels (Table 2). The proportion of those taking renin-angiotensin-aldosterone system (RAAS) blockade drugs in the normal albuminuria group, microalbuminuria group, and overt nephropathy group was 71.64%, 21.27%, and 7.09%, respectively. There were significant differences among the 3 groups (P<0.05).
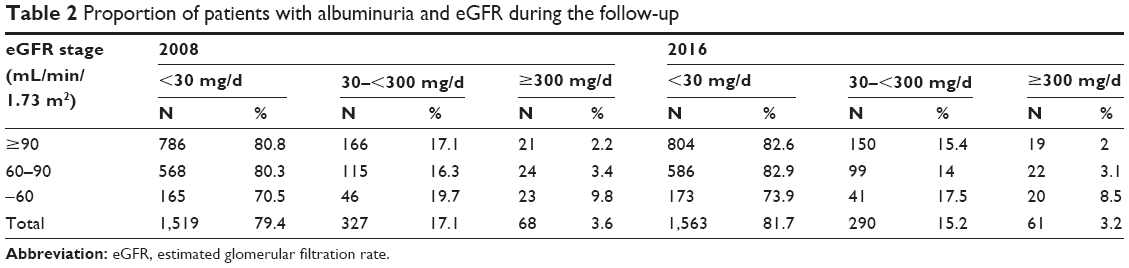 | Table 2 Proportion of patients with albuminuria and eGFR during the follow-up |
All-cause endpoint events after 96-months follow-up
During a median follow-up of 6.8 years, 327 events occurred, including 71 CVD events (3.7%) and 256 composite endpoints (13.4%). The incidence rates of CVD were 2.94%, 5.49%, and 12.86% in the normoalbuminuria group, microalbuminuria group, and overt nephropathy group, respectively. There were significant differences among the 3 groups (P<0.001). The incidence rates of CVD and composite endpoints increased with progression of albuminuria stage and eGFR stage. In particular, there was high incidence rates in those with albuminuria stages >300 mg/d plus coexisting eGFR of 60–89 or <60 mL/min/1.73 m2.
Correlation of cardiovascular events and metabolic variables stratified by CKD stage
In the multivariate Cox hazards model analysis, after adjustment for cardiovascular risk factor, smoking, and RAS inhibition, the risk for CVD and composite endpoints stratified by CKD stage was evaluated (Table 3). The hazard ratios (HRs) were significantly higher for patients with albuminuria >300 mg/d in both CVD events and composite endpoints (P<0.05). However, the HR was not affected by eGFR stages in both CVD events and composite endpoints (Figure 2). In this study, higher fasting blood glucose and HbA1c increased the risk of CKD and proteinuria, but did not increase the risk of CVD (Figure 3). There was no significant difference in the incidence rates of CVD between patients who took RAAS blockade drugs when compared with those who did not (P>0.05).
 | Table 3 Cox regression for factors influencing events of CVD stratified by different stages of CKD after adjustment for gender and age |
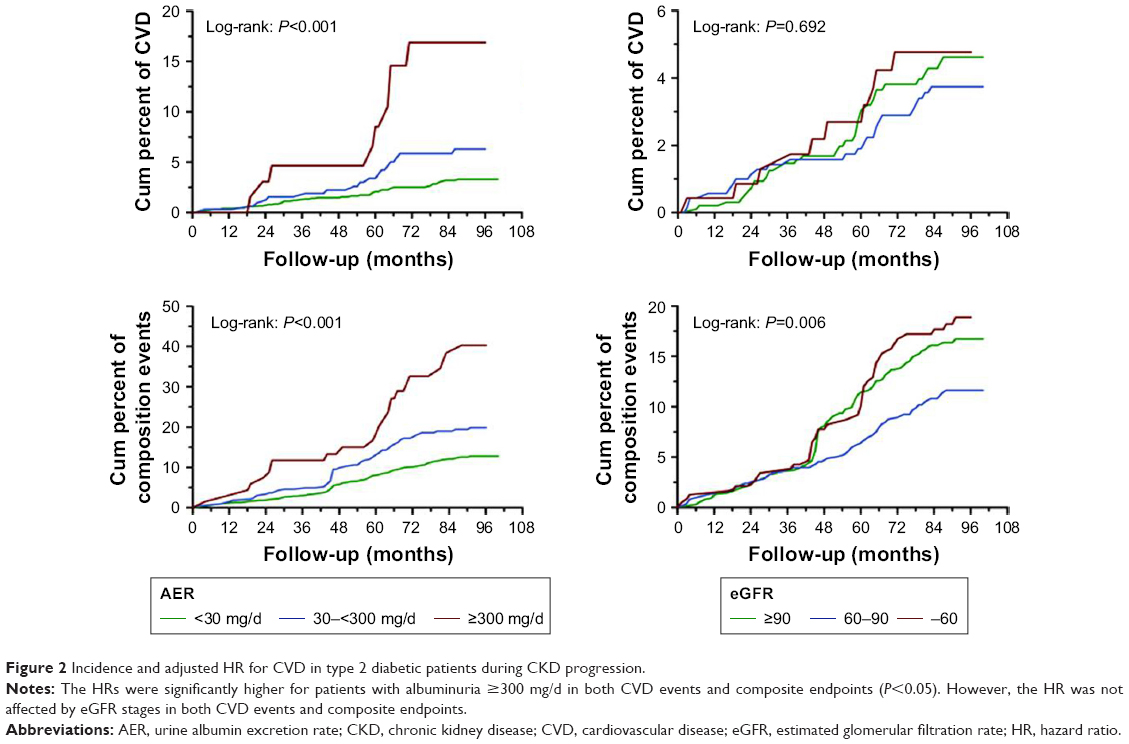 | Figure 2 Incidence and adjusted HR for CVD in type 2 diabetic patients during CKD progression. |
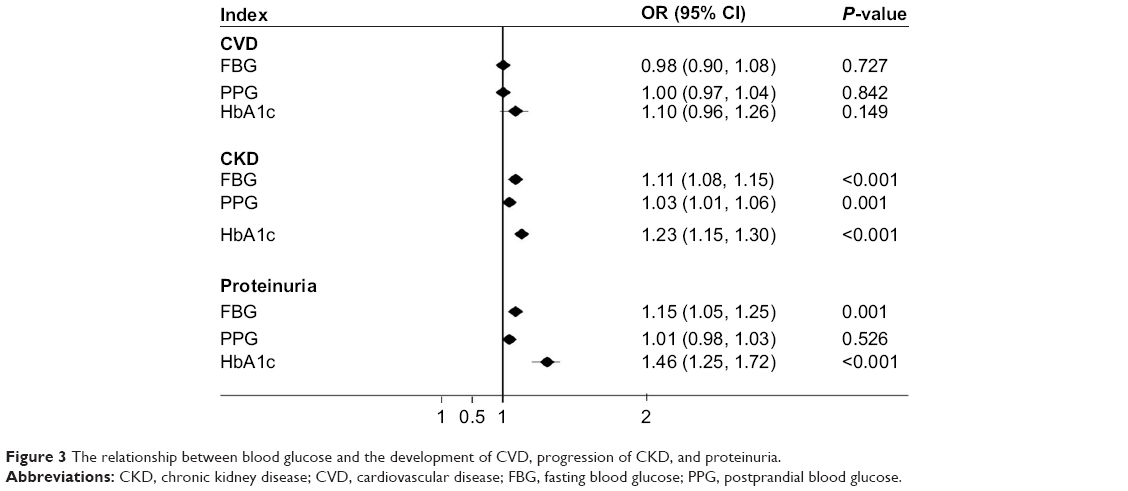 | Figure 3 The relationship between blood glucose and the development of CVD, progression of CKD, and proteinuria. |
The potential confounding factors for CKD progression
Patients who progressed to advanced albuminuria stages showed higher baseline values in fasting blood glucose and postprandial blood glucose (8.97±2.98 vs 8.11±2.70 mmol/L, 11.94±5.01 vs 10.43±3.72 mmol/L, P<0.05), compared with those who regressed to lower albuminuria stages. No differences were found in the outcomes of CVD events and composite endpoints among patients with and without changes in albuminuria stages.
Profile changes of the stages by albuminuria and eGFR
The proportions of patients during the follow-up are shown by the CKD categories in Table 2. During the follow-up, the mean levels of urinary albumin excretion at baseline were 10.7, 85.3 and 2,040 mg/d in patients who remained in the normoalbuminuria, microalbuminuria and overt nephropathy groups, respectively. With the increase of AER, the patients were more likely to progress to advanced DKD stage. Of note, 8.7% patients with microalbuminuria and 1.8% patients with overt nephropathy reversed to normoalbuminuria or microalbuminuria.
Discussion
CKD, defined by reduced GFR or presence of markers for kidney damage, has become a severe global health problem.10 The incidence of CKD is rapidly increasing due to the rising prevalence of T2DM and obesity.11
In patients with T2DM, well-documented risk factors for CKD include age, obesity, fasting glucose, and hypertension. In the present study, T2DM patients with CKD showed poor control of blood pressure, blood glucose, and lipids profiles, and were overweight. Higher fasting blood glucose and HbA1c increased the risk of CKD and proteinuria. In addition, most patients with CKD were more than 60 years old and had a history of smoking and hypertension. Hypertension is regarded as the leading risk factor for the development and progression of CKD in diabetic individuals.12 In this study, after adjustment, systolic BP, age, and duration of diabetes were shown to be the strongest risk factors of CKD during follow-up.
The kidney failure risk equations are widely used in electronic applications, with some initial validation in other countries and health care systems.13–15 The early sign of kidney damage was defined as increased level of urinary albumin excretion, and persistent albuminuria was identified as AER ≥30 mg/d lasting for more than 3 months.3 Recent studies demonstrated that renal prognosis is closely associated with reduced eGFR and increased AER.16,17
BCDS is an ongoing prospective investigation of the effects of multifactorial intervention on the development of disease complications in T2DM patients living in urban communities in Beijing. This is the first time AER and eGFR were compared for outcomes of CVD in T2DM in a large sample which has been followed up for such a long time in People’s Republic of China. As an index to evaluate kidney disease, urinary albumin-to-creatinine ratio (ACR) was always detected once in the urine. In this study, the albuminuria was detected by AER at baseline using 2 of 3 samples, and the stability was better than that of ACR.
The novelty of this study is that both AER and eGFR were used simultaneously to assess renal impairment indicators in BCDS. Theoretically, AER is a more direct marker for kidney damage, while eGFR may play an important role in screening.
The association of increased albuminuria with both all-cause mortality and cardiovascular mortality in the general population has been described in the analyses of the CKD Prognosis Consortium.16 But the nature of this link remains controversial and poorly understood. Its presence alone sometimes does not indicate established kidney disease.18 Meanwhile, the associations among microalbuminuria, eGFR, and CVD incidence need to be examined in prospective, population-based studies.19 Our results showed that CVD outcomes were highly correlated with stages of albuminuria even after adjustment of multiple factors, which was similar to the previous reports.20,21 In addition, the outcomes of CVD in our study were relatively lower than previously reported, which is possibly due to our multifactorial intervention approaches for CVD prevention.22,23
Unlike albuminuria, we found CVD outcomes were not totally parallel with eGFR. Patients with eGFR >90 mL/min/1.73 m2 had even higher CVD HR than those with GFR of 60–89 or <60 mL/min/1.73 m2. A possible explanation is that albuminuria is not only a marker of diabetic nephropathy but also reflects a generalized abnormality of vascular function.24,25 Therefore, albuminuria may have a cause and effect relationship with CVD, whereas eGFR has no direct effect on CVD and can be affected by other confounding variables in T2DM, eg, blood pressure and smoking. To support this hypothesis, a previous study showed that patients who developed CVD had higher levels of baseline AER, even within the normoalbuminuric range.26
As is well known, intensive multifactorial interventions are effective in reducing cardiovascular risk in patients with microalbuminuria and diabetes or hypertension.27 In this study, we did not find a clear connection between blood glucose and the risk of CVD, which partly reflects the effectiveness of the multifactorial intervention in this study.
So far, only a few studies have examined the transition in different stages of diabetic nephropathy.28 In the present study, all patients received multifactorial treatment and regular monitoring as mentioned. It has been suggested that diabetic nephropathy at early stage might be reversible. We found 8.7% patients with microalbuminuria (n=166) and 1.8% patients with overt nephropathy (n=34) reversing to normoalbuminuria or microalbuminuria. This cohort study provided clinically interesting evidence that reducing albuminuria is possible even in patients with eGFR <60 mL/min/1.73 m2. In BCDS, patients with diabetic nephropathy can be reversed in some degree by multifactorial management, which has a protective effect on kidney. Even if the patient progresses to overt nephropathy, it can also be reversed to microalbuminuria. There seems to be a certain reversion cut-off point in different populations, not only simply dependent on the classic staging criteria in diabetic nephropathy.
Taken together, this study led to 2 major findings. First, AER is a more sensitive predictor for CVD than eGFR in patients with diabetes. AER is a more direct marker for kidney damage, while eGFR may play an important role in screening. Second, diabetic nephropathy can be reversed even in advanced AER stage. Multifactorial intervention is very important for the prevention of CVD outcomes and DKD progression. AER as a sensitive indicator of CVD risk should be monitored once or twice a year for progression to macroalbuminuria and CKD development, even if blood pressure, plasma glucose, and lipids profiles are in target control.
Study limitations
This subanalysis has a few limitations in addition to those reported in the BCDS study. Because the present study was a subanalysis of the BCDS trial, the number of patients and number of events was lower than in the main study. Therefore, the present study is much more underpowered for observing the effects of DKD progression and CVD outcomes based on detection of AER or eGFR. In addition, the dropout rate was relatively high, which may produce bias. Because of the nature of making several subgroups, significant results should be interpreted with the caution of potential α error. As a study of specific populations, it can be seen as a pilot study of these particular ethnic groups. Research needs to be carried out in populations in other regions to support it.
Acknowledgments
Investigators for the Beijing Community Diabetes Study (BCDS) Group: we thank the participants and general practitioners who took part in the study. List of the BCDS Study Group Investigators: Su-Fang Pan (Department of Endocrinology, Beijing Tongren Hospital, Capital Medical University, Beijing, People’s Republic of China), Yue Li (Aerospace Central Hospital, Beijing, People’s Republic of China), Yu-jie Chen (Sijiqing Community Health Service Center, Beijing, People’s Republic of China), Li Zhou (School Hospital of Central University for Nationalities, Beijing, People’s Republic of China), Jie Miao (Dongfeng Community Health Service Center, Beijing, People’s Republic of China), Xiu-Juan Yang (Fatou Community Health Service Center, Beijing, People’s Republic of China), Shi-Qian Xu (Sanjianfang Community Health Service Center, Beijing, People’s Republic of China), Yong-Jin Li (Tuanjiehu Community Health Service Center, Beijing, People’s Republic of China), Nan Zhang (Anzhen Community Health Service Center, Beijing, People’s Republic of China), Guang-Ling Kan (Stadium Road Community Health Service Center, Beijing, People’s Republic of China), Hao Wu (Fangzhuang Community Health Service Center, Beijing, People’s Republic of China), Tie-Song Zhang (Yuyuantan Community Health Service Center, Beijing, People’s Republic of China), Jing Xu (Baizhifang Community Health Service Center, Beijing, People’s Republic of China), Zhi-Jun Zhang (Shiliuyuan Community Health Service Center, Beijing, People’s Republic of China), Ling Tian (Xiluoyuan Community Health Service Center, Beijing, People’s Republic of China). Zong-xue Lu, Shu-xian Ma, Shu-qin Yang, Wei Bai are thanked as members of the Supervisory committee. This project is supported by a Grant of Special Scientific Research on Capital Health Development (2016-1-2057, 2016-2-2054), Beijing Municipal Science & Technology Commission (Z151100004015021). BRIDGES Grant from the International Diabetes Federation. Dr Li is partly supported by the University of Rochester’s Clinical and Translational Science Award ([CTSA] number UL1 TR000042 and UL1 TR002001 from the National Center for Advancing Translational Sciences of the National Institutes of Health in USA).
Author contributions
X-LZ drafted the manuscript, researched the data, and contributed to standardization of the data. M-XY was responsible for data management. GW conducted the data analysis and interpretation. DL conducted some statistical analysis and revision of the thesis. H-JF and L-XZ researched the data and contributed to the discussion. R-RX, J-DZ, Y-JL, Y-LL, X-PD, Z-MW, X-LC, D-YL, YG, S-YC, QW, and YJ all researched the data. All authors contributed toward data analysis, drafting and critically revising the paper and agree to be accountable for all aspects of the work.
Disclosure
The authors report no conflicts of interest in this work.
References
Bailey CJ, Day C. Diabetes therapies in renal impairment. Br J Diabetes Vasc Dis. 2012;12(4):167–171. | ||
Fox CS, Matsushita K, Woodward M, et al; Chronic Kidney Disease Prognosis Consortium. Associations of kidney disease measures with mortality and end-stage renal disease in individuals with and without diabetes: a meta-analysis. Lancet. 2012;380(9854):1662–1673. | ||
Levey AS, de Jong PE, Coresh J, et al. The definition, classification, and prognosis of chronic kidney disease: a KDIGO Controversies Conference report. Kidney Int. 2011;80(1):17–28. | ||
Dwyer JP, Parving HH, Hunsicker LG, Ravid M, Remuzzi G, Lewis JB. Renal dysfunction in the presence of normoalbuminuria in type 2 diabetes: results from the DEMAND study. Cardiorenal Med. 2012;2(1):1–10. | ||
Pan CY, Ho LT, Soegondo S, et al. Prevalence of albuminuria and cardiovascular risk profile in a referred cohort of patients with type 2 diabetes: an Asian perspective. Diabetes Technol Ther. 2008;10(5):397–403. | ||
Xu J, Wei WB, Yuan MX, et al. Prevalence and risk factors for diabetic retinopathy: the Beijing Communities Diabetes Study 6. Retina. 2012;32(2):322–329. | ||
Yang GR, Yuan SY, Fu HJ, et al. Neck circumference positively related with central obesity, overweight, and metabolic syndrome in Chinese subjects with type 2 diabetes: Beijing Community Diabetes Study 4. Diabetes Care. 2010;33(11):2465–2467. | ||
Ma YC, Zuo L, Chen JH, et al. Modified glomerular filtration rate estimating equation for Chinese patients with chronic kidney disease. J Am Soc Nephrol. 2006;17(10):2937–2944. | ||
Yang GR, Yuan SY, Fu HJ, et al; Beijing Community Diabetes Study Group. Influence of educational attainments on long term glucose control and morbid events in patients with type 2 diabetes receiving integrated care from 15 China urban communities: The Beijing Community Diabetes Study 11. Prim Care Diabetes. 2015;9(6):473–481. | ||
Wen CP, Cheng TY, Tsai MK, et al. All-cause mortality attributable to chronic kidney disease: a prospective cohort study based on 462,293 adults in Taiwan. Lancet. 2008;371(9631):2173–2182. | ||
Gregg EW, Sattar N, Ali MK. The changing face of diabetes complications. Lancet Diabetes Endocrinol. 2016;4(6):537–547. | ||
Stenvinkel P. Chronic kidney disease: a public health priority and harbinger of premature cardiovascular disease. J Intern Med. 2010;268(5):456–467. | ||
Peeters MJ, van Zuilen AD, van den Brand JA, et al; MASTERPLAN Study Group. Validation of the kidney failure risk equation in European CKD patients. Nephrol Dial Transplant. 2013;28(7):1773–1779. | ||
Marks A, Fluck N, Prescott GJ, et al. Looking to the future: predicting renal replacement outcomes in a large community cohort with chronic kidney disease. Nephrol Dial Transplant. 2015;30(9):1507–1517. | ||
Elley CR, Robinson T, Moyes SA, et al. Derivation and validation of a renal risk score for people with type 2 diabetes. Diabetes Care. 2013;36(10):3113–3120. | ||
Matsushita K, van der Velde M, Astor BC, et al; Chronic Kidney Disease Prognosis Consortium. Association of estimated glomerular filtration rate and albuminuria with all-cause and cardiovascular mortality in general population cohorts: a collaborative meta-analysis. Lancet. 2010;375(9731):2073–2081. | ||
Eckardt KU, Berns JS, Rocco MV, Kasiske BL. Definition and classification of CKD: the debate should be about patient prognosis – a position statement from KDOQI and KDIGO. Am J Kidney Dis. 2009;53(6):915–920. | ||
Bakris GL, Molitch M. Microalbuminuria as a risk predictor in diabetes: the continuing saga. Diabetes Care. 2014;37(3):867–875. | ||
Stehouwer CD, Smulders YM. Microalbuminuria and risk for cardiovascular disease: analysis of potential mechanisms. J Am Soc Nephrol. 2006;17(8):2106–2111. | ||
Rigalleau V, Lasseur C, Raffaitin C, et al. Normoalbuminuric renal-insufficient diabetic patients: a lower-risk group. Diabetes Care. 2007;30(8):2034–2039. | ||
Brantsma AH, Bakker SJ, Hillege HL, et al; PREVEND Study Group. Cardiovascular and renal outcome in subjects with K/DOQI stage 1–3 chronic kidney disease: the importance of urinary albumin excretion. Nephrol Dial Transplant. 2008;23(12):3851–3858. | ||
Lutgers HL, Gerrits EG, Sluiter WJ, et al. Life expectancy in a large cohort of type 2 diabetes patients treated in primary care (ZODIAC-10). PLoS One. 2009;4(8):e6817. | ||
Oluwatowoju I, Abu E, Wild SH, Byrne CD. Improvements in glycaemic control and cholesterol concentrations associated with the Quality and Outcomes Framework: a regional 2-year audit of diabetes care in the UK. Diabet Med. 2010;27(3):354–359. | ||
Currie G, Delles C. Proteinuria and its relation to cardiovascular disease. Int J Nephrol Renov Dis. 2013;7:13–24. | ||
Cachofeiro V, Goicochea M, de Vinuesa SG, Oubiña P, Lahera V, Luño J. Oxidative stress and inflammation, a link between chronic kidney disease and cardiovascular disease. Kidney Int Suppl. 2008;111(111):S4–S9. | ||
Schmieder RE, Mann JF, Schumacher H, et al. Changes in albuminuria predict mortality and morbidity in patients with vascular disease. J Am Soc Nephrol. 2011;22(7):1353–1364. | ||
Yuyun MF, Adler AI, Wareham NJ. What is the evidence that microalbuminuria is a predictor of cardiovascular disease events? Curr Opin Nephrol Hypertens. 2005;14(3):271–276. | ||
Katayama S, Moriya T, Tanaka S, et al. Low transition rate from normo- and low microalbuminuria to proteinuria in Japanese type 2 diabetic individuals: the Japan Diabetes Complications Study (JDCS). Diabetologia. 2011;54(5):1025–1031. |
 © 2018 The Author(s). This work is published and licensed by Dove Medical Press Limited. The full terms of this license are available at https://www.dovepress.com/terms.php and incorporate the Creative Commons Attribution - Non Commercial (unported, v3.0) License.
By accessing the work you hereby accept the Terms. Non-commercial uses of the work are permitted without any further permission from Dove Medical Press Limited, provided the work is properly attributed. For permission for commercial use of this work, please see paragraphs 4.2 and 5 of our Terms.
© 2018 The Author(s). This work is published and licensed by Dove Medical Press Limited. The full terms of this license are available at https://www.dovepress.com/terms.php and incorporate the Creative Commons Attribution - Non Commercial (unported, v3.0) License.
By accessing the work you hereby accept the Terms. Non-commercial uses of the work are permitted without any further permission from Dove Medical Press Limited, provided the work is properly attributed. For permission for commercial use of this work, please see paragraphs 4.2 and 5 of our Terms.