")
Back to Journals » International Journal of Nanomedicine » Volume 11
The effect of ZnO nanoparticles on liver function in rats
Authors Tang H-Q , Xu M, Rong Q, Jin R-W, Liu Qi-Ji, Li Y
Received 23 March 2016
Accepted for publication 19 June 2016
Published 31 August 2016 Volume 2016:11 Pages 4275—4285
DOI https://doi.org/10.2147/IJN.S109031
Checked for plagiarism Yes
Review by Single anonymous peer review
Peer reviewer comments 2
Editor who approved publication: Professor Lei Yang
Hua-Qiao Tang, Min Xu, Qian Rong, Ru-Wen Jin, Qi-Ji Liu, Ying-Lun Li
Department of Pharmacy, Sichuan Agricultural University, Sichuan, Chengdu, People’s Republic of China
Abstract: Zinc oxide (ZnO) is widely incorporated as a food additive in animal diets. In order to optimize the beneficial effects of ZnO and minimize any resultant environmental pollution, ZnO nanoparticles are often used for delivery of the zinc. However, the possible toxic effects of ZnO nanoparticles, including effects on cytochrome P450 (CYP450) enzymes, have not been evaluated. In this study, we investigated the effect of ZnO nanoparticles, in doses used in animal feeds, on CYP450 enzymes, liver and intestinal enzymes, liver and kidney histopathology, and hematologic indices in rats. We found that liver and kidney injury occurred when the concentrations of ZnO nanoparticles in feed were 300–600 mg/kg. Also, liver mRNA expression for constitutive androstane receptor was suppressed and mRNA expression for pregnane X receptor was induced when feed containing ZnO nanoparticles was given at a concentration of 600 mg/kg. Although the expression of mRNA for CYP 2C11 and 3A2 enzymes was induced by ZnO nanoparticles, the activities of CYP 2C11 and 3A2 were suppressed. While liver CYP 1A2 mRNA expression was suppressed, CYP 1A2 activity remained unchanged at all ZnO nanoparticle doses. Therefore, it has been concluded that ZnO nanoparticles, in the doses customarily added to animal feed, changed the indices of hematology and blood chemistry, altered the expression and activity of hepatic CYP enzymes, and induced pathological changes in liver and kidney tissues of rats. These findings suggest that greater attention needs to be paid to the toxic effects of ZnO nanoparticles in animal feed, with the possibility that the doses of ZnO should be reduced.
Keywords: ZnO nanoparticles, liver injury, CYP450 enzymes
Introduction
Zinc is a necessary trace element for humans, animals, plants, and microbes, and in recent decades it has been extensively studied to determine its physiological and biochemical functions. Additionally, zinc is a component of more than 300 different enzymes, transcription factors, and cell-signaling proteins that maintain the body’s normal immune functions, adjust its protein metabolism, maintain cell-membrane integrity, and help regulate cell proliferation and differentiation.1 The early weaning period (2–5 weeks) of piglets produces stress that leads to wean-stress syndrome, which is characterized by poor food consumption and growth, as well as increased rates of diarrhea. Although in 1998, the America National Research recommended that weaned pigs be fed a diet containing 100 mg of zinc per kilogram of feed, Heugten et al2 confirmed that a diet containing 80 mg of zinc per kilogram of feed could satisfy the needs of weanling pigs. In contrast, several others3–6 have reported that diets containing zinc oxide (ZnO) at levels of 3,000–5,000 mg/kg increased food consumption and growth, and also decreased the incidence of diarrhea among weanling pigs. The growth-promoting effects of ZnO in pigs appear to correlate with the presence of anti-pathogenic microorganisms, anti-bacterial toxins, a strengthened immune response, and the promotion of intestinal development and digestive enzyme activity.7–12
However, supplementing a diet with ZnO causes concern about environmental pollution, as dietary ZnO is poorly absorbed in the gut and, therefore, is excreted into the environment via feces.13,14 Because of these concerns, encapsulated formulations of ZnO and ZnO nanoparticles have been created to reduce the total amount of ZnO added to a diet.15 Although these special formulations increase costs to the feed manufacturing industry, ZnO nanoparticles have been widely used in People’s Republic of China in order to reduce environmental pollution created by the manufacture and use of animal feeds. While greater attention should be given to environmental pollution caused by ZnO usage, the toxic effects of ZnO nanoparticles on animals and humans also remain unclear and should be more thoroughly investigated.
Studies have shown that ZnO nanoparticles produce cytotoxic effects in numerous kinds of cells, including osteoblast cancer cells, human bronchial epithelial cells, kidney cells, alveolar adenocarcinoma cells, hepatocytes, and embryonic kidney cells; furthermore, the nanoparticles’ effects may be related to particle size and dosage.16–21 While low doses of ZnO nanoparticles have not produced toxic effects in vivo, high concentrations can cause sudden death. Moreover, ZnO nanoparticles are one of the most toxic nanoparticles, with the lowest LD50 (median lethal dose) value, among the engineered metal oxide nanoparticles currently used in research.22–24 Studies have shown that the metal oxides display the following order of toxicity to catfish primary hepatocytes and human HepG2 cells: TiO2 < Co3O4 < ZnO < CuO.25 When tested in zebra fish, the LC50 values for TiO2 and ZnO nanoparticles were 124.5 and 4.92 mg/L, respectively.26 ZnO nanoparticles stimulate the formation of reactive oxygen species (ROS) that disrupt intracellular metabolic activities and the antioxidant system. These changes permit newly generated ROS to interact with and damage lipids, carbohydrates, proteins, and DNA.27,28 Similar to ROS, ZnO nanoparticles have antibacterial effects as a result of their oxidative properties.29,30 Furthermore, ZnO nanoparticles are highly soluble, which allows them to exist at concentrations high enough to produce cytotoxic effects, oxidative stress, and mitochondrial dysfunction.31,32 When administered as a single oral dose, ZnO nanoparticles are easily absorbed into the bloodstream via the gastrointestinal tract, and this property allows the liver, lung, and kidney to be target organs for their accumulation and toxic effects, which appear to be independent of particle size and animal gender.33,34 Oral administration of ZnO nanoparticles leads to the release of free Zn2+ ions in gastric acid; thus, Zn2+ is probably the main toxic material in vivo.
A previous study identified the liver as the main target organ of ZnO nanoparticles.35 Because the liver metabolizes drugs via its constitutive cytochrome P450 (CYP450) enzyme system, we speculated that a clinical dose of ZnO nanoparticles might produce adverse effects, as Zn accumulates in the liver and decreases the elimination rate of other drugs, leading to their accumulation and associated toxic side effects. As zinc nanoparticles come in direct contact with the intestines, the effects of nanoparticles on intestinal CYP450 enzymes also should be evaluated. In this study, various doses of ZnO nanoparticles were orally administered to Sprague Dawley rats, and their effects on the mRNA and activity of CYP450 enzymes were evaluated, with the aim of providing guidance regarding the proper dose of nanoparticles to be used in animals. CYP450 enzyme activity was evaluated using the “cocktail” method.36
Materials and methods
Preparation of nanoparticle diets
ZnO nanoparticles were purchased from Shijiazhuang Lumen Chemical Technology Co., Ltd (Hebei, People’s Republic of China) and examined for size and morphology with a Hitachi H–600IV transmission electron microscope (Hitachi, Tokyo, Japan). The resultant images revealed that the ZnO nanoparticles had sizes ranging from 10 to 100 nm (Figure 1).
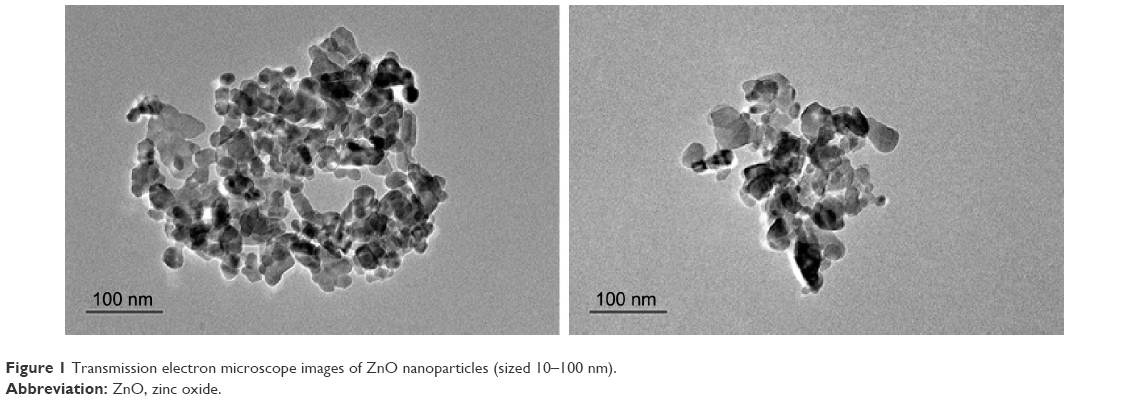 | Figure 1 Transmission electron microscope images of ZnO nanoparticles (sized 10–100 nm). |
The ZnO nanoparticles were diluted twofold with powdered rat feed. The feed containing ZnO nanoparticles was placed into a V-Mixer (Hunan Zhongcheng Pharmacy Machine Co., Ltd, Shanghai, People’ Republic of China) and mixed for 60 minutes to ensure the ZnO nanoparticles were well distributed. Next, the feed was moistened and prepared as pelleted formulations containing ZnO nanoparticles at concentrations of 100, 300, and 600, all of which are conventional levels used in diets.
Animals
Male Sprague Dawley rats (aged 4 weeks; 100–120 g) were purchased from Chengdu Dossy Biological Technology Co., Ltd, Chengu, People’s Republic of China. The animals were housed in plastic laboratory animal cages in a ventilated room maintained at 25°C±2°C and 70%±10% relative humidity, and with a 12-hour light/dark cycle. Food containing ZnO nanoparticles, as well as water, was available ad libitum. The animals were assigned to four groups, with eight in each group: a group that received regular rat feed and three other groups that received rat feed supplemented with ZnO nanoparticles at concentrations of 100, 300, and 600 mg/kg. The rats were allowed 7 days to adapt to their new environment prior to receiving an experimental feed; after that, they were fed the experimental feeds for 1 week. All animal-handling procedures were performed according to the Guide for the Care and Use of Laboratory Animals of the Chinese Association for Laboratory Animal Sciences and followed the guidelines of the Animal Welfare Act. All animal experiments were approved by the Experimental Animal Ethical Committee of Sichuan Agricultural University.
Sample collection
After an overnight 8-hour fasting period, all animals in the four groups were anesthetized with ether, and blood samples obtained by cardiac puncture were collected into heparinized and non-heparinized bottles for use in hematologic and biochemical investigations, respectively. Blood samples collected in non-heparinized bottles were allowed to clot, then centrifuged, and the serum fractions were separated from the clots and stored in clean bottles for subsequent biochemical analyses.
Liver and intestinal microsomes were prepared by differential centrifugation.37 Briefly, the liver and intestine of each rat were excised, rinsed with ice-cold saline (0.9% NaCl w/v), weighed, and homogenized in 0.05 mM Tris/KCl buffer (pH 7.4). The homogenate was centrifuged at 10,000× g at 4°C for 30 minutes, after which, the resultant supernatant fraction was centrifuged at 105,000 g at 4°C for 60 minutes. The pellet was suspended in 0.05 mM Tris/KCl buffer (pH 7.4) and stored at −80°C until use. The liver microsome protein concentrations were determined by Bradford protein assay kit (Tiangen Biotech Co Ltd, Beijing, People’s Republic of China). The liver microsomes were used to analyze the activity of CYP450 enzymes, while additional 1 g samples of liver tissue were homogenized with 10 mL of ice-cold saline (0.9% NaCl w/v) for analyses of cytokines and antioxidant levels. Also, about 2 g samples of liver tissue were snap-frozen in liquid nitrogen and stored at −80°C for later use in mRNA and gene expression analyses. The remaining samples of liver and kidney tissues were rinsed in physiological saline and fixed in 10% formalin for histologic examination.
Hematologic and biochemical analyses
White and red blood cell counts, mean cell volumes, mean corpuscular hemoglobin concentrations, and packed cell volumes were analyzed with an auto hematology analyzer (BC-2800; Shenzhen Mindray Bio-Medical Electronics Co., Ltd, Shenzhen, People’s Republic of China). Serum enzyme activities were measured by use of an automatic biochemical analyzer (BS-180; Shenzhen Mindray Bio-Medical Electronics Co., Ltd).
Measurements of cytokines and antioxidant ability
The homogenized liver tissues were centrifuged at 8,000× g for 10 minutes. The concentrations of interleukin-6 (IL-6), interferon-γ (IFN-γ), tumor necrosis factor-α (TNF-α), and methane dicarboxylic aldehyde, and activity of superoxide dismutase, total antioxidant capacity, and glutathione peroxidase in the supernatants were measured by kits (Nanjing Jiancheng Bioengineering Institute, Nanjing, People’s Republic of China), according to the manufacturer’s instructions. The data were recorded with a multifunctional microplate reader (Thermo Fisher Scientific Inc., Waltham, MA, USA).
RNA extraction and determination of gene expression in liver by real-time polymerase chain reaction
RNA extractions and analyses of liver tissue gene expression were performed as described.38 The quality and quantity of extracted mRNA were determined with UV spectroscopy (NanoDrop 2000 UV-Vis Spectrophotometer; Thermo Scientific). The following target genes were analyzed for their expression: constitutive androstane receptor (CAR), pregnane X receptor (PXR), CYP450 1A2, CYP450 2C11, and CYP450 3A2. GAPDH was used as a housekeeping gene for data normalization (Table 1). The Ct values were normalized using the mean value of the housekeeping gene, and arbitrary values were calculated and used for statistical comparisons. Melting curves and polymerase chain reaction (PCR) efficiency served as standard quality criteria for each reverse transcription-PCR run.
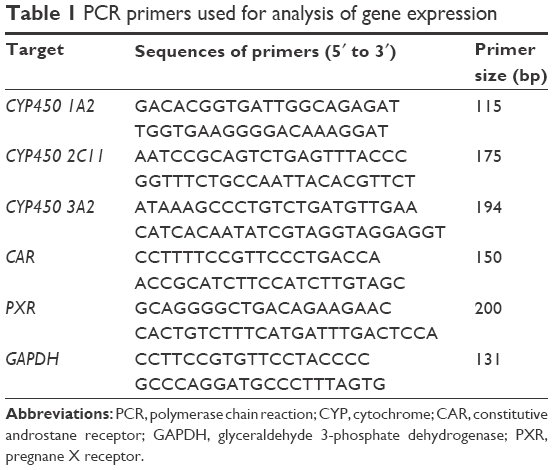 | Table 1 PCR primers used for analysis of gene expression |
Measurements of CYP 1A2, 2C11, and 3A2 activity
CYP450 1A2, CYP450 2C11, and CYP450 3A2 activity were assessed as described.39–41 All microsomal incubations were conducted for 60 minutes at 37°C in a final volume of 500 μL. Each incubation mixture contained pooled microsomes (1.0 mg protein/mL) and an nicotinamide adenine dinucleotide phosphate-regenerating system consisting of MgCl2 (10 mM), glucose 6-phosphate (10 mM), NADP+ (1.0 mM), and 6-phosphate dehydrogenase (2.0 U/mL). A 10 μL volume of acetonitrile stock solution was added to each microsomal incubation vessel, which contained three probe substrates for three specific CYP450 enzymes. The activities of the three different CYP450 enzymes were evaluated based on the reduction of the following three substrates: phenacetin for CYP450 1A2, tolbutamide for CYP450 2C11, and testosterone for CYP450 3A2. The concentrations of phenacetin, tolbutamide, and testosterone in the incubation mixtures were 100, 100, and 800 μg/mL, respectively. All incubations were terminated by adding 500 μL of ice-cold acetonitrile containing 20 ng/mL tinidazole (internal standard), after which, the solutions were thoroughly mixed and centrifuged (18,000× g at 4°C for 10 minutes) to obtain the supernatant fractions, of which 10 μL was used for the cocktail high-performance liquid chromatographic (HPLC) analysis.
Phenacetin, tolbutamide, testosterone, and tinidazole (IS) were analyzed by 1260 series HPLC instrument (Agilent Technologies, Santa Clara, CA, USA) capable of diode array detector at 230 nm. HPLC was performed at room temperature with an Agilent revere-phase C18 column (Zorbax SB-C18, 4.6×250 mm, 5 μm) equipped with a C18 guard column. The mobile phase consisted of acetonitrile and water (0.01 M acetic acid) and the flow rate was 1.0 mL/min. Elutions occurred when the liquid phase consisted of 40% acetonitrile–60% water (0.01 M acetic acid), at which time, phenacetin, tolbutamide, testosterone, and tinidazole (IS) eluted at 6.11, 4.54, 16.35, and 4.25 minutes, respectively.
The regression equations and lower limit of quantitation concentrations for the analytes are shown in Table 2.
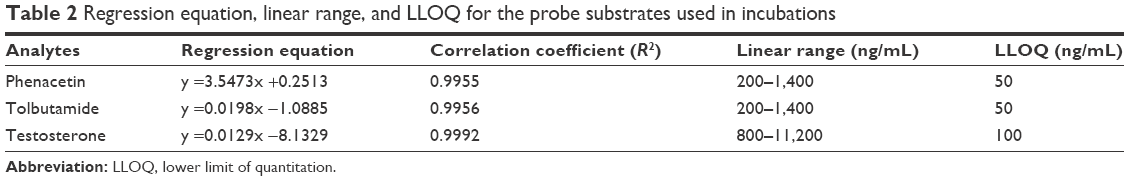 | Table 2 Regression equation, linear range, and LLOQ for the probe substrates used in incubations |
Analyses of histopathologic changes
The livers and kidneys removed from the experimental rats were fixed in 10% buffered formalin and processed for histological examination. Tissues embedded in paraffin wax were sectioned (5 mm thickness), stained with hematoxylin and eosin, mounted on glass slides, and examined under a standard light microscope.
Statistical analysis
All statistical results were expressed as the mean ± standard deviation (n=8), and all experimental values were compared with their corresponding control values. Differences between mean values were analyzed with one-way ANOVA, and values with different superscripts are significantly different (P<0.05 or 0.01).
Results
Hematology and blood chemistry
The effects of ZnO nanoparticles on hematologic parameters and blood chemistry are shown in Figure 2. The numbers of white blood cells were significantly increased (P<0.01), whereas the numbers and percentages of lymphocytes were significantly decreased (P<0.05 and P<0.05, respectively) in the high-dose group. The increase in white blood cells was mainly due to increased numbers of monocytes (P<0.01 or P<0.05) and granulocyte neutrophils (P<0.01). Hemoglobin levels were decreased (P<0.01) in rats fed with high dose of ZnO nanoparticles, and red blood cell counts were decreased (P<0.01) at all dose levels.
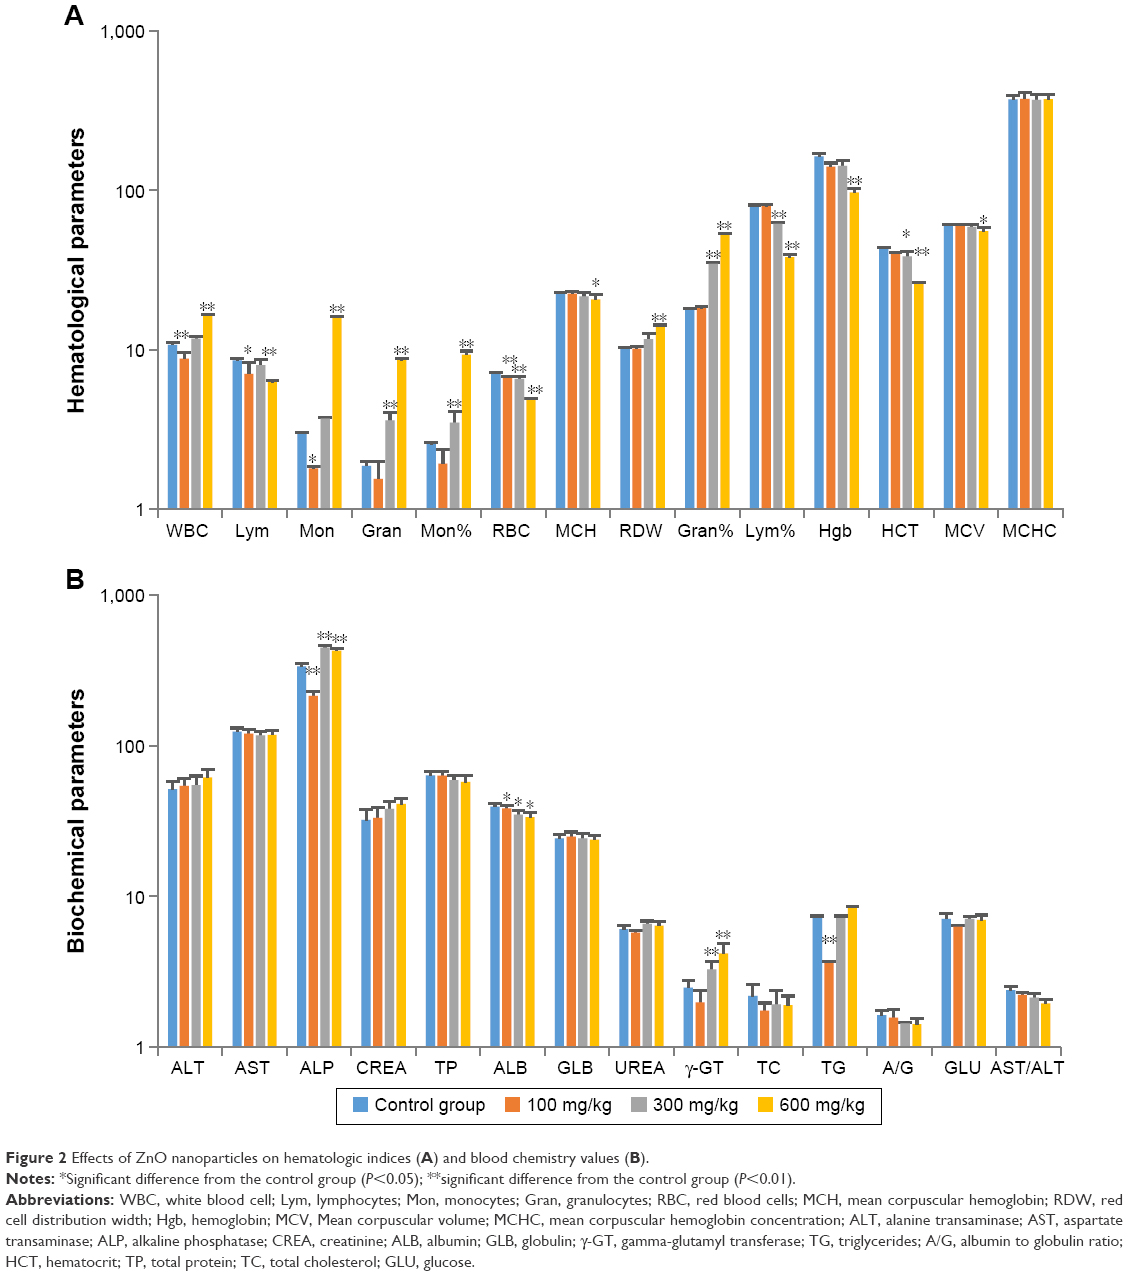 | Figure 2 Effects of ZnO nanoparticles on hematologic indices (A) and blood chemistry values (B). |
Other biochemical tests revealed that levels of alkaline phosphatase and gamma-glutamyl transferase were significantly increased (P<0.01) in the medium- and high-dose groups, possibly as a result of liver injury.
Cytokines concentration and antioxidant ability
The effects of ZnO nanoparticles on liver cytokines concentration and antioxidant ability are shown in Figures 3 and 4. The concentrations of IL-6, IFN-γ, and TNF-α of liver were induced by the presence of ZnO nanoparticles in a dose-dependent manner (P<0.05 or P<0.01). The activities of superoxide dismutase and total antioxidant capacity of liver were suppressed by the presence of ZnO nanoparticles in a dose-dependent manner (P<0.05 or P<0.01), but the activity of glutathione peroxidase in liver was significantly suppressed by those nanoparticles given at a dose of 600 mg/kg (P<0.01). The concentration of liver malondialdehyde was induced significantly by three doses.
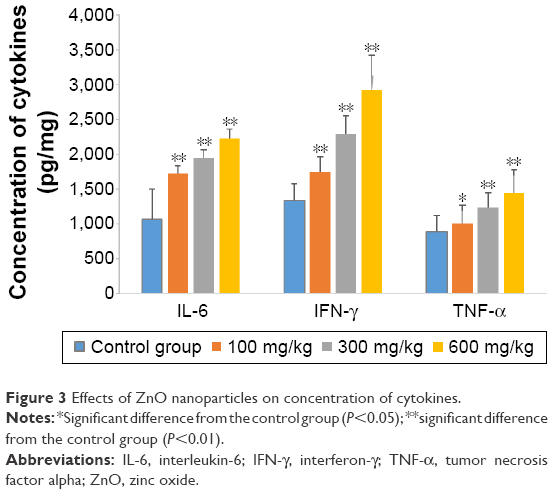 | Figure 3 Effects of ZnO nanoparticles on concentration of cytokines. |
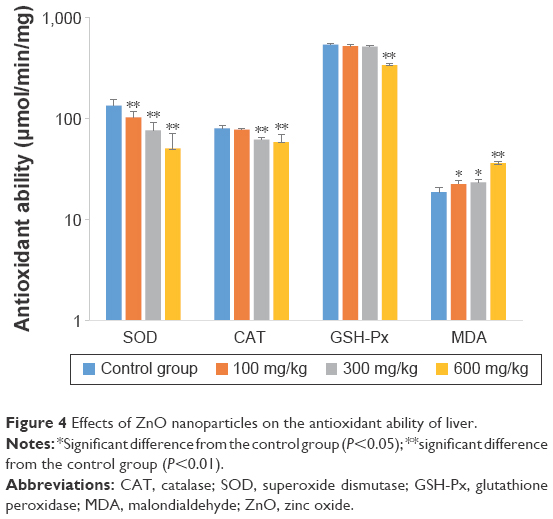 | Figure 4 Effects of ZnO nanoparticles on the antioxidant ability of liver. |
Expression of nuclear receptors and CYP enzymes
As shown in Figure 5, the levels of mRNA for nuclear receptor of CAR were suppressed by the presence of ZnO nanoparticles in a dose-dependent manner (P<0.05 or P<0.01); however, the mRNA for PXR was induced by ZnO nanoparticles (P<0.05 or P<0.01). The levels of mRNA for CYP 2C11 were increased approximately tenfold (P<0.01) by ZnO nanoparticles, and the levels of mRNA for CYP 3A2 were also significantly increased (P<0.01 or P<0.05) in a dose-dependent manner. However, the levels of CYP 1A2 mRNA were significantly reduced in the medium- and high-dose groups (P<0.05).
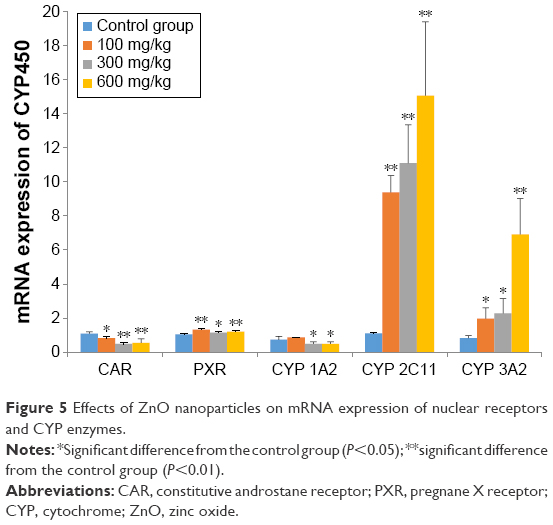 | Figure 5 Effects of ZnO nanoparticles on mRNA expression of nuclear receptors and CYP enzymes. |
CYP enzyme activities
As shown in Figure 6, the activity of liver CYP 3A2 was significantly lower in animals that received ZnO nanoparticles than in control animals (P<0.01). The activity of liver CYP 2C11 was also significantly suppressed by ZnO nanoparticles (P<0.05), and the activity of liver CYP 1A2 was not increased. Although the intestines came in direct contact with ZnO nanoparticles, intestinal CYP 2C11 activity was not induced. While all doses of ZnO nanoparticles induced intestinal CYP 1A1 activity (P<0.05), only the highest dose of ZnO nanoparticles induced CYP 3A2 activity (P<0.01). Liver CYP 1A2 and intestinal CYP 1A1 are the same enzyme but have different names, reflecting their different tissue distribution, as is the case also for CYP 3A2 and CYP 3A4.
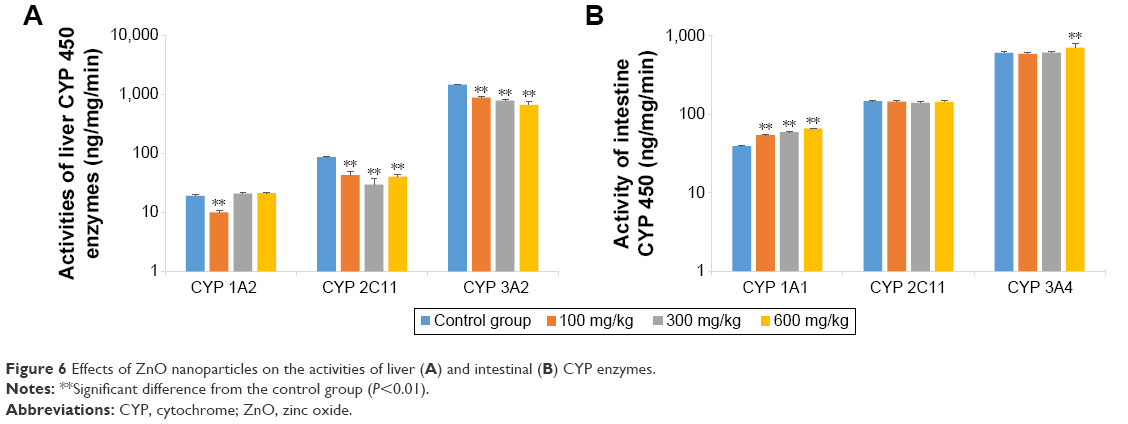 | Figure 6 Effects of ZnO nanoparticles on the activities of liver (A) and intestinal (B) CYP enzymes. |
Histopathological analysis
Representative images from histopathological examinations are shown in Figure 7. Figure 7A shows the liver (left) and kidney (right) tissues of a rat in the control group. Figure 7B shows the liver (left) and kidney (right) tissue of a rat in the group fed with 100 mg/kg ZnO nanoparticles. The findings shown in Figure 7B are similar to those in 7A, in that the cellular structures remain clearly defined and appear to be normal. Figure 7C shows liver (left) and kidney (right) tissue from a rat in the group fed with 300 mg/kg ZnO nanoparticles. In this image, the liver cells are slightly swollen. Figure 7D shows liver (left) and kidney (right) tissue from a rat in the group fed with 600 mg/kg. The liver and kidney cells show vacuolization and significant swelling. The liver cell gap shows evidence of minor hemorrhage, while the glomerular and renal tubular epithelial cells show severe hemorrhage.
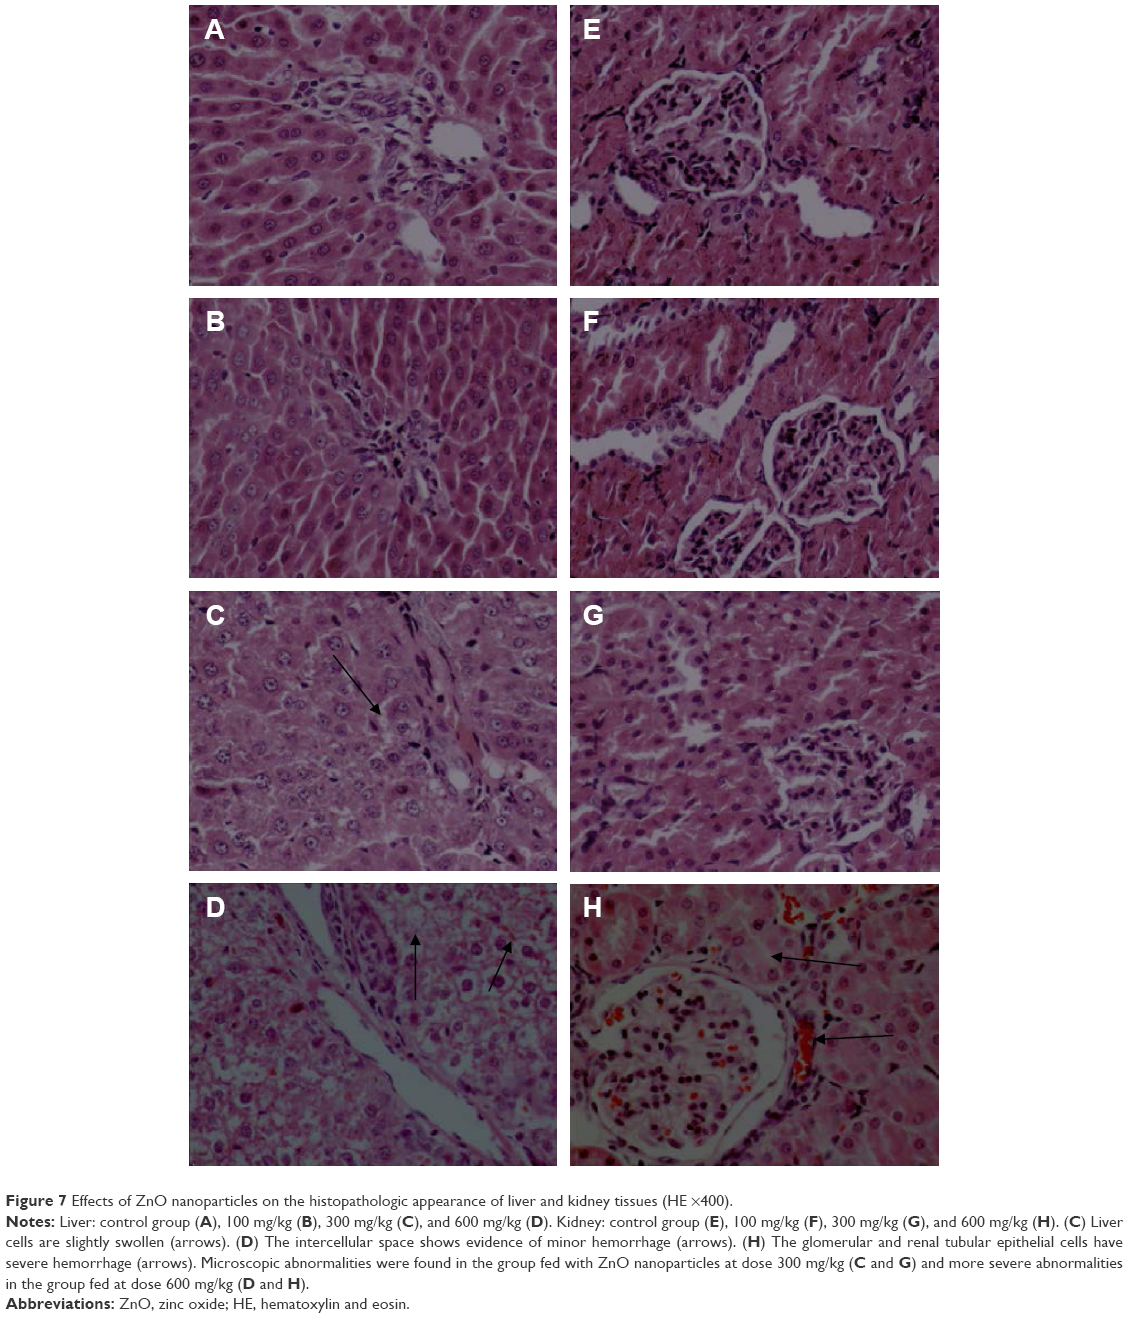 | Figure 7 Effects of ZnO nanoparticles on the histopathologic appearance of liver and kidney tissues (HE ×400). |
Discussion
In this research we defined several effects of ZnO nanoparticles fed to rats. Our major findings are as follows: the ZnO nanoparticles changed the indices of hematology and blood chemistry, altered the expression and activity of hepatic CYP enzymes, and induced pathological changes in liver and kidney tissues. We evaluated the toxicity of clinical dose of ZnO nanoparticles and have attempted to explain the reason for the altered activity of CYP enzymes.
Although bulk micron-sized ZnO is recognized as a safe substance by the US Food and Drug Administration, whether ZnO nanoparticles are safe for consumption by animals has not been determined. Numerous studies have reported that excess oral administration of zinc salt and zinc powder can lead to liver damage and liver dysfunction, with increased values of serum enzymes such as glutamic–pyruvic transaminase/glutamic–oxaloacetic transaminase and alkaline phosphatase.42 In the present work with ZnO nanoparticles, animals that received 300 or 600 mg/kg had significantly increased levels of alkaline phosphatase and γ-glutamyl transferase, which we believe were most likely due to liver injury produced by the nanoparticles. This is supported by the histopathologic evidence of liver injury, observed in the group fed with 300 mg/kg nanoparticles and more severely in the group fed with 600 mg/kg nanoparticles. We also propose that the increased white blood cell, neutrophil, and granulocyte counts reflect an inflammatory reaction, and the decreased numbers of lymphocyte may be indicative of immune dysfunction.
CYP450 enzymes are produced by a super-gene family and play key roles in the metabolism of drugs, xenobiotics, and endogenous compounds found in animals and humans. Members of the CYP1A, CYP2C, and CYP3A isoform families are the most important and abundant CYP enzymes involved in drug metabolism.43 Induction or inhibition of the CYP enzymes following exposure to certain drugs and chemicals can result in drug-induced toxicities and drug–drug interactions which lead to treatment failure.44 Metals have been shown to modify CYP450 expression and function.45–47 Numerous articles have mentioned that CY450 enzymes are downregulated during a generalized inflammatory process and that various inflammatory cytokines have some degree of selectivity for specific CYP isoforms.48–50 CAR and PXR serve as master transcriptional regulators of CYP450 isozymes.51,52 In our study, rats fed with a diet containing 300 or 600 mg/kg of ZnO nanoparticles showed liver inflammation and injury. While CAR mRNA expression was suppressed and PXR mRNA expression was induced by ZnO nanoparticles, these changes did not have a dose–response relationship. Expressions of CYP 2C11 and CYP 3A2 mRNA were significantly induced by ZnO nanoparticles, and this effect may have been related to PXR induction. In contrast, CYP 1A was suppressed by ZnO nanoparticles. While this change is consistent with the trend shown by CAR mRNA expression, it is not certain that it was induced by CAR because nuclear receptors such as peroxisome proliferator-activated receptor alpha, retinoid X receptor alpha, liver X receptor alpha, farnesol X receptor, aryl hydrocarbon receptor, and glucocorticoid receptor can also function as key regulators of CYP450 expression. Furthermore, upon binding of a foreign chemical inducer, endogenous hormone, growth factor, or cytokine, the cross talk between CAR and PXR, as well as between the two nuclear receptors and other cell signaling pathways, also has a regulatory effect.53,54 Our data indicate that although their mRNA expression levels were increased, the activities of liver CYP 2C11 and CYP 3A2 were decreased when ZnO nanoparticles were added to diets, a result which we speculate may have been due to misfolding or less translation of proteins, or the proteins being modified by reactive oxygen species or inflammatory cytokines.38 Another mechanism of ZnO nanoparticles’ toxicity involves the generation of ROS, and monocytes produce the highest levels of ROS.55,56 The degree of cytotoxicity produced by ZnO nanoparticles depends on the extent of their interaction with cellular membranes.57 ZnO nanoparticles may induce the formation of highly reactive oxygen species, including hydrogen peroxide, hydroxyl radicals, and superoxide anions, all of which can cause oxidative damage to animal cells.58 Furthermore, ZnO nanoparticles have been shown to increase the levels of cytokines IFN-γ, TNF-α, and IL-12, all of which are involved in the inflammatory responses and the immune-cell differentiation process. These increased cytokines are at least partially mediated by induction of NF-κB transcription factor.59,60 Cytokines IFN-γ, TNF-α, and IL-12 are induced by nanoparticles in peripheral blood mononuclear cells.59 Our data demonstrated the changes in liver oxidative stress and cytokine – increased oxidative stress and cytokine levels also being the reason for alteration in the activity of CYP450 enzymes.61,62 Although the activity of intestinal CYP450 enzymes appeared to be unaffected by ZnO nanoparticles, the kidney lesions found in the high-dose group might impair drug elimination. The differences in the activities of CYP450 enzymes in liver and intestines indicate that the change of the CYP450 activity is not a direct contact reaction but an indirect effect caused by ZnO nanoparticles.
Our findings suggest that ZnO nanoparticles have complex effects on CYP450 enzymes, and the nature of these effects may be related to the liver inflammation reactions, oxidative stress, and immune dysfunction that they induce. Thus, the change in the activity of CYP450 enzymes may be the result of multiple factors, and their mechanism of activity deserves intensive study.
Conclusion
ZnO nanoparticles added to the animal feed, in the doses studied, showed adverse effects on hematologic parameters, cytokines, oxidative stress, cytochrome enzymes, liver enzymes, and histologic parameters of rat liver. These observations are considered to be evidences that the doses of zinc added to animal feeds are too high and need to be reconsidered, and the drug withdrawal period for animals fed with ZnO nanoparticles should be longer than the period that is currently followed.
Acknowledgments
Hua-Qiao Tang and Min Xu are co-first authors. The authors are very thankful to the Sichuan Agricultural University for providing the apparatus and chemicals used. The authors would also like to thank William R Brown, MD, for his help in critically analyzing the manuscript for language.
Disclosure
The authors report no conflicts of interest in this work.
References
Beyersmann D. Homeostasis and cellular functions of zinc. Materwiss Werksttech. 2002;33(12):764–769. | ||
Van Heugten E, Spears JW, Kegley EB, Ward JD, Qureshi MA. Effects of organic forms of zinc on growth performance, tissue zinc distribution, and immune response of weanling pigs. J Anim Sci. 2003;81(8):2063–2071. | ||
Carlson MS, Boren CA, Wu C, Huntington CE, Bollinger DW, Veum TL. Evaluation of various inclusion rates of organic zinc either as a polysaccharide or proteinate complex on the growth performance, plasma, and excretion of nursery pigs. J Anim Sci. 2004;82(5):1359–1366. | ||
Hill GM, Cromwell GL, Crenshaw TD, et al. Growth promotion effects and plasma changes from feeding high dietary concentrations of zinc and copper to weanling pigs (regional study). J Anim Sci. 2000;78(4):1010–1016. | ||
Li X, Yin J, Li D, Chen X, Zang J, Zhou X. Dietary supplementation with zinc oxide increases IGF-I and IGF-I receptor gene expression in the small intestine of weanling piglets. J Nutr. 2006;136(7):1786–1791. | ||
Wang Y, Tang JW, Ma WQ, Feng J, Feng J. Dietary zinc glycine chelate on growth performance, tissue mineral concentrations, and serum enzyme activity in weanling piglets. Bio Trace Elem Res. 2010;133(3):325–334. | ||
Xie Y, He Y, Irwin PL, Jin T, Shi X. Antibacterial activity and mechanism of action of zinc oxide nanoparticles against Campylobacter jejuni. Appl Environ Microbiol. 2011;77(7):2325–2331. | ||
Crane JK, Byrd IW, Boedeker EC. Virulence inhibition by zinc in shiga-toxigenic Escherichia coli. Infect Immun. 2011;79(4):1696–1705. | ||
Mehmood S, Rehman MA, Ismail H, Mirza B, Bhatti AS. Significance of postgrowth processing of ZnO nanostructures on antibacterial activity against gram-positive and gram-negative bacteria. Int J Nanomedicine. 2015;10:4521–4533. | ||
Wang Z, Burwinkel M, Chai W, et al. Dietary Enterococcus faecium NCIMB 10415 and zinc oxide stimulate immune reactions to trivalent influenza vaccination in pigs but do not affect virological response upon challenge infection. PLoS One. 2014;9(1):e87007. | ||
Liu P, Pieper R, Rieger J, et al. Effect of dietary zinc oxide on morphological characteristics, mucin composition and gene expression in the colon of weaned piglets. PLoS One. 2014;9(3):e91091. | ||
Højberg O, Canibe N, Poulsen HD, Hedemann MS, Jensen BB. Influence of dietary zinc oxide and copper sulfate on the gastrointestinal ecosystem in newly weaned piglets. Appl Environ Microbiol. 2005;71(5):2267–2277. | ||
Poulsen HD, Larsen T. Zinc excretion and retention in growing pigs fed increasing levels of zinc oxide. Livest Prod Sci. 1995;43(3):235–242. | ||
Jondreville C, Revy PS, Dourmad JY. Dietary means to better control the environmental impact of copper and zinc by pigs from weaning to slaughter. Livest Prod Sci. 2003;84(2):147–156. | ||
Jang I, Kwon CH, Ha DM, et al. Effects of a lipid-encapsulated zinc oxide supplement on growth performance and intestinal morphology and digestive enzyme activities in weanling pigs. J Anim Sci Technol. 2014;56:29. | ||
Nair S, Sasidharan A, Divya Rani VV, et al. Role of size scale of ZnO nanoparticles and microparticles on toxicity toward bacteria and osteoblast cancer cells. J Mater Sci Mater Med. 2009;20(Suppl 1):S235–S241. | ||
Heng BC, Zhao X, Xiong S, Ng KW, Boey FY, Loo JS. Cytotoxicity of zinc oxide (ZnO) nanoparticles is influenced by cell density and culture format. Arch Toxicol. 2011;85(6):695–704. | ||
Pujalte I, Passagne I, Brouillaud B, et al. Cytotoxicity and oxidative stress induced by different metallic nanoparticles on human kidney cells. Part Fibre Toxicol. 2011;8:10. | ||
Ahamed M, Akhtar MJ, Raja M, et al. ZnO nanorod-induced apoptosis in human alveolar adenocarcinoma cells via p53, survivin and bax/bcl-2 pathways: role of oxidative stress. Nanomedicine. 2011;7(6):904–913. | ||
Guan R, Kang T, Lu F, Zhang Z, Shen H, Liu M. Cytotoxicity, oxidative stress, and genotoxicity in human hepatocyte and embryonic kidney cells exposed to ZnO nanoparticles. Nanoscale Res Lett. 2012;7(1):602. | ||
Kang T, Guan R, Chen X, Song Y, Jiang H, Zhao J. In vitro toxicity of different-sized ZnO nanoparticles in Caco-2 cells. Nanoscale Res Lett. 2013;8(1):496. | ||
De Angelis I, Barone F, Zijno A, et al. Comparative study of ZnO and TiO(2) nanoparticles: physicochemical characterisation and toxicological effects on human colon carcinoma cells. Nanotoxicology. 2013;7(8):1361–1372. | ||
Li K, Chen Y, Zhang W, Pu Z, Jiang L, Chen Y. Surface interactions affect the toxicity of engineered metal oxide nanoparticles toward paramecium. Chem Res Toxicol. 2012;25(8):1675–1681. | ||
Yin H, Casey PS, McCall MJ, Fenech M. Effects of surface chemistry on cytotoxicity, genotoxicity, and the generation of reactive oxygen species induced by ZnO nanoparticles. Langmuir. 2010;26(19):15399–15408. | ||
Wang Y, Aker WG, Hwang HM, Yedjou CG, Yu H, Tchounwou PB. A study of the mechanism of in vitro cytotoxicity of metal oxide nanoparticles using catfish primary hepatocytes and human HepG2 cells. Sci Total Environ. 2011;409(22):4753–4762. | ||
Xiong D, Fang T, Yu L, Sima X, Zhu W. Effects of nano-scale TiO2, ZnO and their bulk counterparts on zebrafish: acute toxicity, oxidative stress and oxidative damage. Sci Total Environ. 2011;409(8):1444–1452. | ||
Yin H, Casey PS, McCall MJ. Surface modifications of ZnO nanoparticles and their cytotoxicity. J Nanosci Nanotechnol. 2010;10(11):7565–7570. | ||
Kelly KA, Havrilla CM, Brady TC, Abramo KH, Levin ED. Oxidative stress in toxicology: established mammalian and emerging piscine model systems. Environ Health Perspect. 1998;106(7):375–384. | ||
Applerot G, Lipovsky A, Dror R, et al. Enhanced antibacterial activity of nanocrystalline ZnO due to increased ROS-mediated cell injury. Adv Funct Mater. 2009;19(6):842–852. | ||
Lipovsky A, Nitzan Y, Gedanken A, Lubart R. Antifungal activity of ZnO nanoparticles – the role of ROS mediated cell injury. Nanotechnology. 2011;22(10):105101. | ||
Aruoja V, Dubourguier HC, Kasemets K, Kahru A. Toxicity of nanoparticles of CuO, ZnO and TiO2 to microalgae Pseudokirchneriella subcapitata. Sci Total Environ. 2009;407(4):1461–1468. | ||
Franklin NM, Rogers NJ, Apte SC, Batley GE, Gadd GE, Casey PS. Comparative toxicity of nanoparticulate ZnO, bulk ZnO, and ZnCl2 to a freshwater microalga (Pseudokirchneriella subcapitata): the importance of particle solubility. Environ Sci Technol. 2007;41(24):8484–8490. | ||
Baek M, Chung HE, Yu J, et al. Pharmacokinetics, tissue distribution, and excretion of zinc oxide nanoparticles. Int J Nanomedicine. 2012;7:3081–3097. | ||
Cho WS, Kang BC, Lee JK, Jeong J, Che JH, Seok SH. Comparative absorption, distribution, and excretion of titanium dioxide and zinc oxide nanoparticles after repeated oral administration. Part Fibre Toxicol. 2013;10:9. | ||
He LS, Yan XS, Wu DC. Age-dependent variation of zinc-65 metabolism in LACA mice. Int J Radiat Biol. 1991;60(6):907–916. | ||
Spaggiari D, Geiser L, Daali Y, Rudaz S. A cocktail approach for assessing the in vitro activity of human cytochrome P450s: an overview of current methodologies. J Pharm Biomed Anal. 2014;101:221–237. | ||
Goossens J, De Bock L, Osselaere A, et al. The mycotoxin T-2 inhibits hepatic cytochrome P4503A activity in pigs. Food Chem Toxicol. 2013;57:54–56. | ||
Iovu MO, Héroux L, Vergés J, Montell E, Paiement J, du Souich P. Effect of chondroitin sulfate on turpentine-induced down-regulation of CYP1A2 and CYP3A6. Carbohydr Res. 2012;355:63–68. | ||
Zhu WJ, Zhang ZW, Wang XS, Xu SW, Li M, Li S. Effects of avermectin on microsomal cytochrome P450 enzymes in the liver and kidneys of pigeons. Environ Toxicol Pharmacol. 2014;38(2):562–569. | ||
Peng Y, Wu H, Zhang X, et al. A comprehensive assay for nine major cytochrome P450 enzymes activities with 16 probe reactions on human liver microsomes by a single LC/MS/MS run to support reliable in vitro inhibitory drug-drug interaction evaluation. Xenobiotica. 2015;45(11):961–977. | ||
Rao MN, Biju B, Ansar AK, Mujeeb S, Ramesh M, Srinivas NR. ‘Open access’ generic method for continuous determination of major human CYP450 probe substrates/metabolites and its application in drug metabolism studies. Xenobiotica. 2003;33(12):1233–1245. | ||
Esmaeillou M, Moharamnejad M, Hsankhani R, Tehrani AA, Maadi H. Toxicity of ZnO nanoparticles in healthy adult mice. Environ Toxicol Pharmacol. 2013;35(1):67–71. | ||
Nebert DW, Russell DW. Clinical importance of the cytochromes P450. Lancet. 2002;360(9340):1155–1162. | ||
Sun M, Tang Y, Ding T, Liu M, Wang X. Inhibitory effects of celastrol on rat liver cytochrome P450 1A2, 2C11, 2D6, 2E1 and 3A2 activity. Fitoterapia. 2014;92:1–8. | ||
Vincent R, Goegan P, Johnson G, et al. Regulation of promoter-CAT stress genes in HepG2 cells by suspensions of particles from ambient air. Fundam Appl Toxicol. 1997;39(1):18–32. | ||
Maier A, Dalton TP, Puga A. Disruption of dioxin-inducible phase I and phase II gene expression patterns by cadmium, chromium, and arsenic. Mol Carcinog. 2000;28(4):225–235. | ||
Elbekai RH, El-Kadi AO. Modulation of aryl hydrocarbon receptor-regulated gene expression by arsenite, cadmium, and chromium. Toxicology. 2004;202(3):249–269. | ||
Morgan ET. Regulation of cytochromes P450 during inflammation and infection. Drug Metab Rev. 1997;29(4):1129–1188. | ||
Morgan ET. Regulation of cytochrome p450 by inflammatory mediators: why and how? Drug Metab Dispos. 2001;29(3):207–212. | ||
Aitken AE, Morgan ET. Gene-specific effects of inflammatory cytokines on cytochrome P4502C, 2B6 and 3A4 mRNA levels in human hepatocytes. Drug Metab Dispos. 2007;35(9):1687–1693. | ||
Kawamoto T, Kakizaki S, Yoshinari K, Negishi M. Estrogen activation of the nuclear orphan receptor CAR (constitutive active receptor) in induction of the mouse Cyp2b10 gene. Mol Endocrinol. 2000;14(11):1897–1905. | ||
Wassmur B, Gräns J, Kling P, Celander MC. Interactions of pharmaceuticals and other xenobiotics on hepatic pregnane X receptor and cytochrome P450 3A signaling pathway in rainbow trout (Oncorhynchus mykiss). Aquat Toxicol. 2010;100(1):91–100. | ||
Yang X, Zhang B, Molony C, et al. Systematic genetic and genomic analysis of cytochrome P450 enzyme activities in human liver. Genome Res. 2010;20(8):1020–1036. | ||
Smutny T, Mani S, Pavek P. Post-translational and post-transcriptional modifications of pregnane X receptor (PXR) in regulation of the cytochrome P450 superfamily. Curr Drug Metab. 2013;14(10):1059–1069. | ||
Mannering GJ, Deloria LB, Abbott V. Role of xanthine oxidase in the interferon mediated depression of cytochrome P450 system in mice. Cancer Res. 1988;48(8):2107–2112. | ||
Xia T, Kovochich M, Liong M, et al. Comparison of the mechanism of toxicity of zinc oxide and cerium oxide nanoparticles based on dissolution and oxidative stress properties. ACS Nano. 2008;2(10):2121–2134. | ||
Vandebriel RJ, De Jong WH. A review of mammalian toxicity of ZnO nanoparticles. Nanotechnol Sci Appl. 2012;5:61–71. | ||
Sharma V, Anderson D, Dhawan A. Zinc oxide nanoparticles induce oxidative DNA damage and ROS-triggered mitochondria mediated apoptosis in human liver cells (HepG2). Apoptosis. 2012;17(8): 852–870. | ||
Hanley C, Thurber A, Hanna C, Punnoose A, Zhang J, Wingett DG. The influences of cell type and ZnO nanoparticle size on immune cell cytotoxicity and cytokine induction. Nanoscale Res Lett. 2009;4(12):1409–1420. | ||
Federico A, Morgillo F, Tuccillo C, Ciardiello F, Loguercio C. Chronic inflammation and oxidative stress in human carcinogenesis. Int J Cancer. 2007;121(11):2381–2386. | ||
Morel Y, Barouki R. Down-regulation of cytochrome P450 1A1 gene promoter by oxidative stress. Critical contribution of nuclear factor 1. J Biol Chem. 1998;273(41):26969–26976. | ||
Renton KW, Knickle LC. Regulation of hepatic cytochrome P450 during infectious disease. Can J Physiol Pharmacol. 1990;68(6):777–781. |
 © 2016 The Author(s). This work is published and licensed by Dove Medical Press Limited. The full terms of this license are available at https://www.dovepress.com/terms.php and incorporate the Creative Commons Attribution - Non Commercial (unported, v3.0) License.
By accessing the work you hereby accept the Terms. Non-commercial uses of the work are permitted without any further permission from Dove Medical Press Limited, provided the work is properly attributed. For permission for commercial use of this work, please see paragraphs 4.2 and 5 of our Terms.
© 2016 The Author(s). This work is published and licensed by Dove Medical Press Limited. The full terms of this license are available at https://www.dovepress.com/terms.php and incorporate the Creative Commons Attribution - Non Commercial (unported, v3.0) License.
By accessing the work you hereby accept the Terms. Non-commercial uses of the work are permitted without any further permission from Dove Medical Press Limited, provided the work is properly attributed. For permission for commercial use of this work, please see paragraphs 4.2 and 5 of our Terms.