")
Back to Journals » Pharmacogenomics and Personalized Medicine » Volume 13
The Effect of UGT1A9, CYP2B6 and CYP2C9 Genes Polymorphism on Propofol Pharmacokinetics in Children
Authors Pavlovic D , Budic I , Jevtovic Stoimenov T, Stokanovic D , Marjanovic V , Stevic M , Slavkovic M, Simic D
Received 17 September 2019
Accepted for publication 5 December 2019
Published 17 January 2020 Volume 2020:13 Pages 13—27
DOI https://doi.org/10.2147/PGPM.S231329
Checked for plagiarism Yes
Review by Single anonymous peer review
Peer reviewer comments 2
Editor who approved publication: Dr Martin Bluth
Dimitrije Pavlovic, 1 Ivana Budic, 2, 3 Tatjana Jevtovic Stoimenov, 4 Dragana Stokanovic, 5 Vesna Marjanovic, 2, 3 Marija Stevic, 6, 7 Milan Slavkovic, 8 Dusica Simic 6, 7
1Clinic for Plastic and Reconstructive Surgery, Clinical Centre Nis, Nis, Serbia; 2Department of Surgery and Anesthesiology, Faculty of Medicine, University of Nis, Nis, Serbia; 3Clinic for Anesthesia and Intensive Therapy, Clinical Centre Nis, Nis, Serbia; 4Institute of Biochemistry, Faculty of Medicine, University of Nis, Nis, Serbia; 5Department of Pharmacology and Toxicology, Faculty of Medicine, University of Nis, Nis, Serbia; 6Department of Surgery and Anesthesiology, Faculty of Medicine, University of Belgrade, Belgrade, Serbia; 7Department of Anesthesiology and Intensive Therapy, University Children’s Hospital, Belgrade, Serbia; 8Department of Pediatric Surgery, University Children’s Hospital, Belgrade, Serbia
Correspondence: Ivana Budic
Department of Surgery and Anesthesiology, Faculty of Medicine, Zorana Djindjica Blvd. 48, Nis 18000, Serbia
Tel +381 63 477380
Fax +381 18 4530514
Email [email protected]
Purpose: This study was conducted to determine the effect of UGT1A9 98T>C, CYP2B6 516G>T and CYP2C9 430C>T genetic polymorphisms on the pharmacokinetics of propofol in children of different sexes and ages who undergone total intravenous anesthesia (ТIVA) and deep sedation during diagnostic and therapeutic procedures.
Patients and Methods: The prospective study included 94 children, ASA I-II status, 1 to 17 years of age, who undergone standard anesthetic protocol for TIVA, which implied the continuous use of propofol. Before the administration of propofol, venous blood was sampled to determine the presence of genetic variations in UGT1A9, CYP2B6 and CYP2C9 gene using a polymerase chain reaction-restriction fragment length polymorphism (PCR-RFLP). From each patient included in the study blood samples were taken: 10 mins after the induction of anesthesia, immediately before the discontinuation of the propofol infusion, 10 mins after discontinuation of the propofol infusion and 20 mins after discontinuation of the propofol infusion to determine the pharmacokinetics of the drug in the plasma of the subjects The plasma propofol concentration was determined by HPLC analytical technique.
Results: UGT1A9 genotype is an independent predictor of the propofol concentration in children immediately after the end of the continuous infusion and 10 mins afterwards. In the carriers of the polymorphic UGT1A9 C allele, the propofol distribution constant was higher. The carriers of the polymorphic CYP2B6 T allele received a significantly lower overall and initial dose of propofol. Unlike polymorphism of the UGT1A9 gene, the tested CYP2C9 and CYP2B6 gene polymorphisms are not independent predictors of the pharmacokinetics of propofol.
Conclusion: Further investigations of UGT1A9, CYP2B6 and CYP2C9 and other genes that participate in propofol metabolism as well as detailed analyses of the general conditions, administered therapies and associated diseases could explain the large interindividual variability of propofol metabolism in children.
Keywords: polymorphism, gene, propofol, metabolism, children
Introduction
Propofol (2,6 di-isopropylphenol) is the most commonly used intravenous anesthetic in modern medicine and is used for inducing and maintaining of anesthesia, as well as for procedural sedation during diagnostic and therapeutic procedures. It gained wide application primarily due to a favorable induction in anesthesia and rapid clearance. However, there are data on the individual variations of its pharmacokinetics potentially imposing the need for the application of different doses of anesthetics to achieve effective general anesthesia.1 Most likely, these variables are the result of differences in the kinetics of its metabolism and the inactivation processes under the action of the corresponding enzymes, and due to the existence of their various genetically conditioned isoforms.
Propofol is mainly metabolized by hepatic and extrahepatic cytochrome P450 2B6 (CYP2B6) and cytochrome P450 2C9 (CYP2C9),2 as well as by UDP-glucuronosulfotransferase 1A9 (UGT1A9). UDP-glucuronosulfotransferase 1A9 (UGT1A9) catalyzes the formation of propofol glucuronide.3 The cytochrome P450 enzymes (CYP2B6 and CYP2C9) are responsible for the formation of a hydroxyl derivative of propofol-4-hydroxypropophol, which can further be transformed into 4-hydroxypropophol-1-ObD-glucuronide (Q1G) and 4-hydroxypropophol-4-ObD-glucuronide (Q4G).4,5 About 70 to 90% of propofol is eliminated by urine in the form of the glucuronide metabolite.3,4 It is postulated that the polymorphism of single nucleotide polymorphisms in the genes encoding these enzymes can be responsible for the formation of individual variables of the metabolic products of propofol in infant age, which may result in unpredictable effects of the usual doses of anesthetics as well as prolonged waking time (recovery) from anesthesia.
The objective of this study was to determine the effect of genetic polymorphisms CYP2C9 430C>T, CYP2B6 516G>T and UGT1A9 98T>C on the pharmacokinetics of propofol in children of different sexes and ages who undergo total intravenous anesthesia and deep sedation during diagnostic and therapeutic procedures.
Patients and Methods
Patients
The study included ninety-four children (N = 94), 1 to 17 years old, who underwent total intravenous anesthesia (TIVA) and sedation for diagnostic and therapeutic procedures in plastic, abdominal surgery, orthopedics, urology and gastroenterology. The material used for the research was collected at the Department of Anesthesia and Reanimation of the Clinic for Anesthesia and Reanimation at the Clinic for Children’s Surgery and Orthopedics at the Clinical Center in Nis and at the University Children’s Hospital, Faculty of Medicine, University of Belgrade. The parents were informed about the objectives of the research and gave their consent to the use of the taken material and data by signing an informed consent. The whole study was approved by the Ethics Committee of the Medical Faculty in Nis, no. 12-8765/9 as well as by the Ethics Committee of the University Children’s Hospital in Belgrade, no. 26/340 and the Ethics Committee of the Clinical Center in Nis, no. 27771/11. The clinical study was conducted in accordance with the ethical principles of Good Clinical and Laboratory Practices and the Helsinki Declaration.6 The study did not include children with allergies to propofol, soybeans, peanuts, eggs; for which anamnestic data on the consumption of tobacco, psychoactive substances and alcohol had been obtained; which had a hemoglobin values of less than 7 g/dl.
Anesthesia Protocol
After premedication with atropine (0.01 mg/kg) and midazolam (0.1 mg/kg), anesthesia was induced by bolus dose of propofol (1% Fresenius Kabi) from 2.5 to 3.5 mg/kg body weight, and after was maintained by continuous infusion of propofol using infusion pump (3–15 mg/kg/h). For analgesia, fentanyl was administered at a dose of 1–2 mcg/kg during the induction, and, if needed, it was added at the dose of 0.5 to 1 mcg/kg during anesthesia. Muscle relaxation was provided by rocuronium bromide in a bolus dose of 0.6–1 mg/kg, followed by 0.2 to 0.3 mg/kg every 20 mins. Atropine 0.02 mg/kg and prostigmine 0.05 mg/kg were given for the reversal of the neuromuscular block. Patients are ventilated by oxygen and air (35: 65%; 50: 50%) or oxygen and nitrous oxide (35: 65%). During anesthesia, vital parameters were monitored (systolic and diastolic pressure, heart rate, oxygen saturation, end-tidal carbon dioxide), and, in individual patients, the depth of sedation and anesthesia was measured by analyzing the value of the bispectral index (BIS).
Methods
Material Sampling
From each patient included in the study, five blood samples were taken:
- 2mL of blood before propofol administration to determine the presence of gene mutations in enzymes that participate in propofol metabolism
- 1mL (max 2mL) of blood:
- 10 mins after the induction of anesthesia
- immediately before the discontinuation of the propofol infusion
- 10 mins after discontinuation of the propofol infusion
- 20 mins after discontinuation of the propofol infusion
to determine the pharmacokinetics of the drug in the plasma of the subjects.
Venous blood was taken from a previously placed intravenous cannula in an amount corresponding to previously established ethical standards.6
All blood samples were taken with EDTA as an anticoagulant. The first full blood sample was used for DNA isolation and gene testing. The second, third, fourth and fifth samples were taken at pre-defined intervals - these samples were centrifuged at 3000 rpm after which plasma was extracted for the determination of propofol pharmacokinetics.
Full blood as well as plasma samples were stored at −80°C until DNA isolation, or until the concentration of propofol was determined.
Drug clearance was calculated using the following formula: Cl=Ro/C2Cl clearance; Ro propofol infusion rate; C2 propofol concentration at the end of infusion
Isolation of DNA and Examination of Gene Polymorphisms
All genetic tests were carried out at the Laboratory for Functional Genomics and Proteomics of the Scientific Research Center for Biomedicine, Faculty of Medicine, University of Nis, Serbia.
The genomic DNA was isolated from full blood previously sampled with EDTA, using the commercial QIAamp DNA Blood Mini Kit (Quiagen GmbH, Hilden, Germany).
Detection of gene polymorphism assay CYP2C9*2, UGT1A9 98T>C and CYP2B6 516G>T was performed using DNA chain replication reactions followed by polymorphisms analysis of restriction fragment length (polymerase chain reaction-restriction fragment length polymorphism, PCR-RFLP).
Amplification of the DNA segment by polymerase chain reaction was carried out in a reaction mixture of 25 μL to which 50ng/μL DNA was added using an appropriate primer set. The primer sequence and the temperature response profile are shown in Table 1.
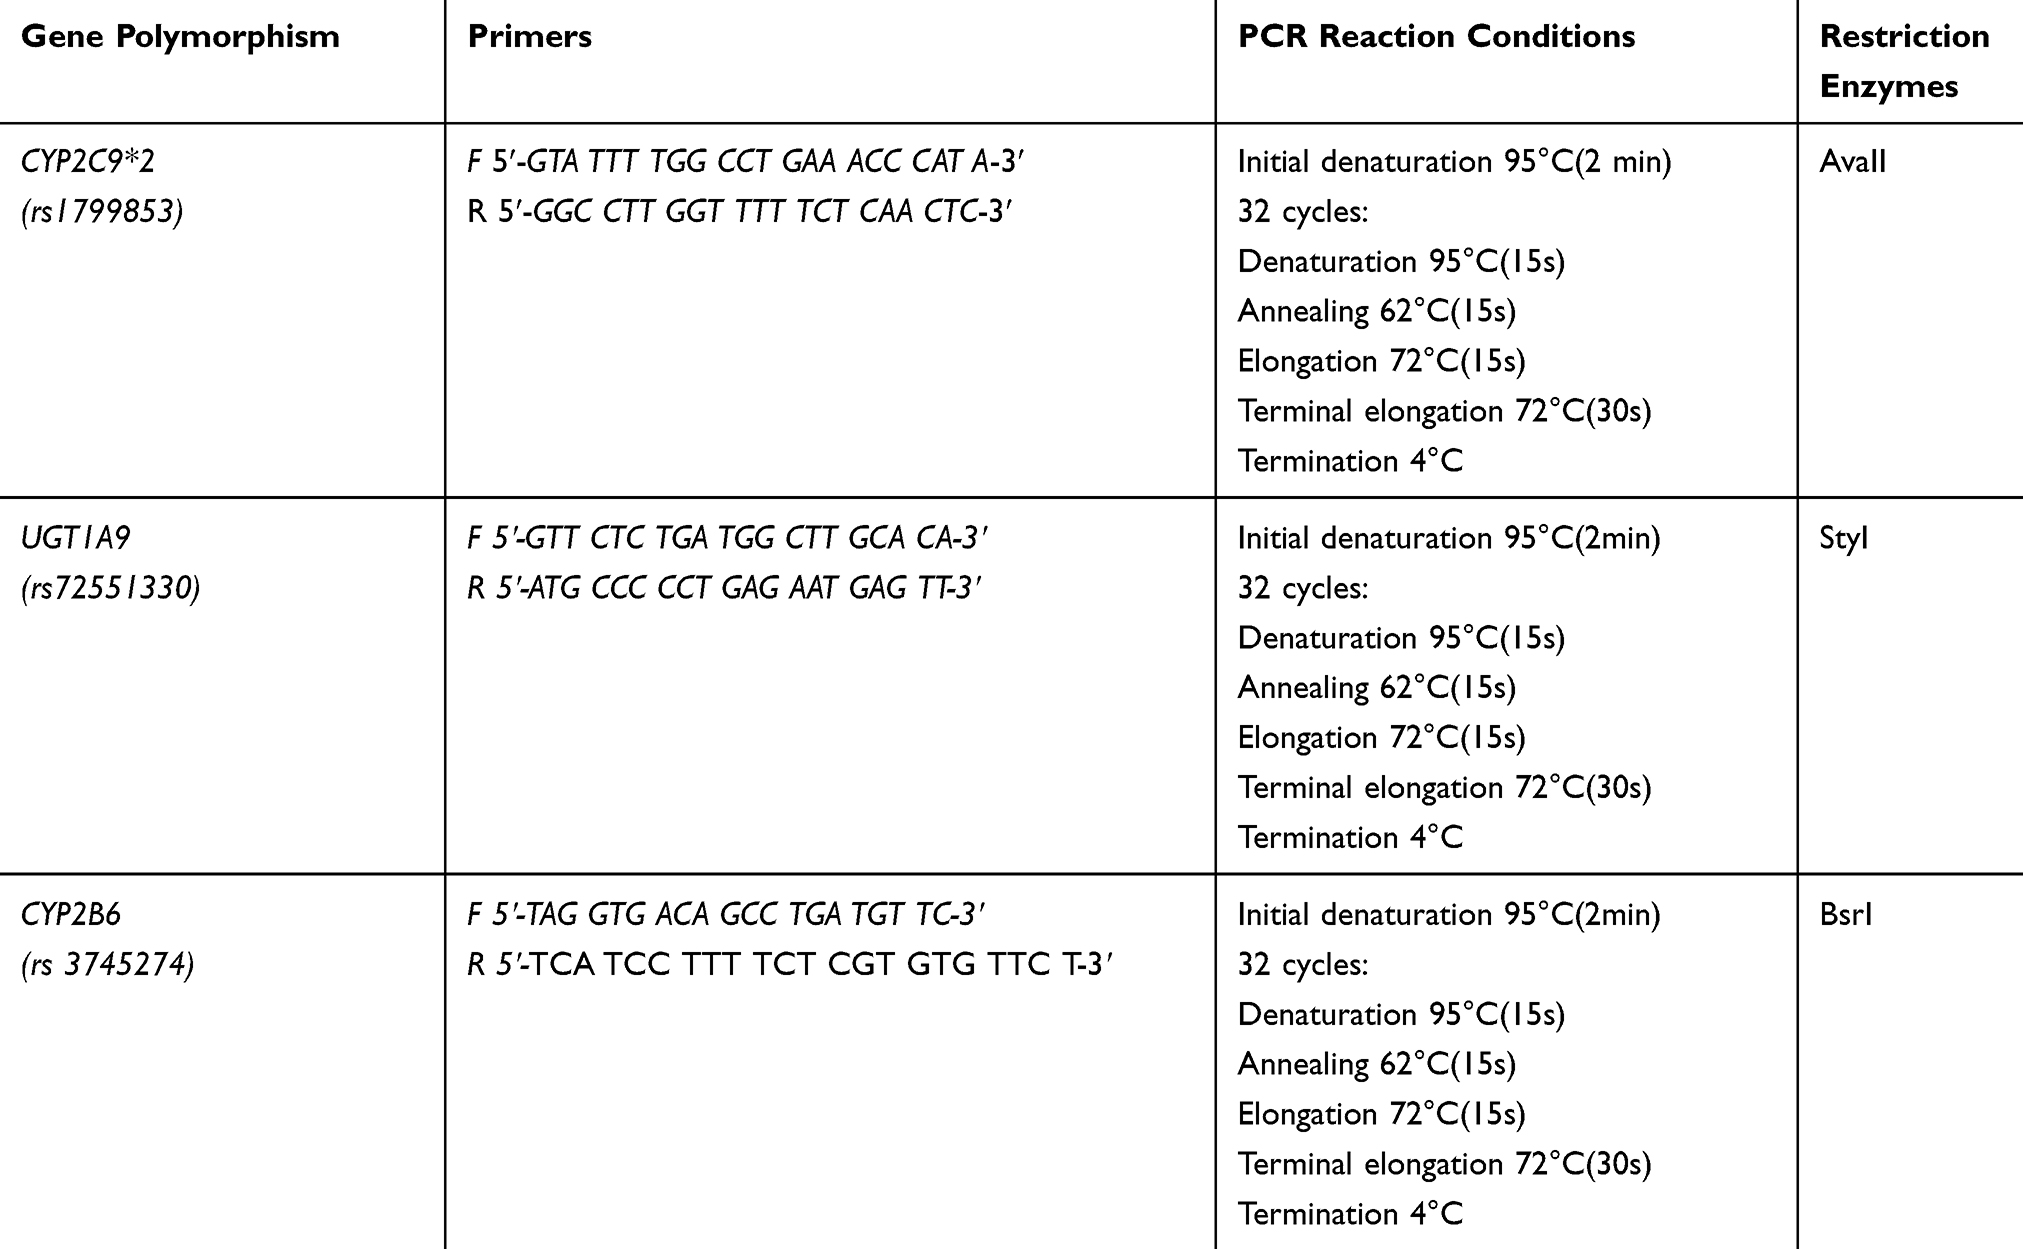 |
Table 1 Sequences of the Primer and Temperature Profile of the Chain-Replication Reaction for CYP2C9 * 2 Polymorphism, UGT1A9 98T>C and CYP2B6 516G>T |
(rs1799853) After verification of the PCR product size 454bp on horizontal electrophoresis using 2% agarose gel, restriction digestion with AvaII restriction enzyme was performed at a temperature of 37°C. The obtained digestion was performed on a 8% polyacrylamide gel, and the obtained results were interpreted as follows: the presence of the restriction site (*1/*1) on both alleles yielded fragments of size 397 and 57bp, while the absence of a restriction site (*2/*2) gives a fragment of size 454bp. The heterozygous *1/*2 genotype is characterized by the presence of three fragments of size 454, 397 and 57bp (Figure 1).
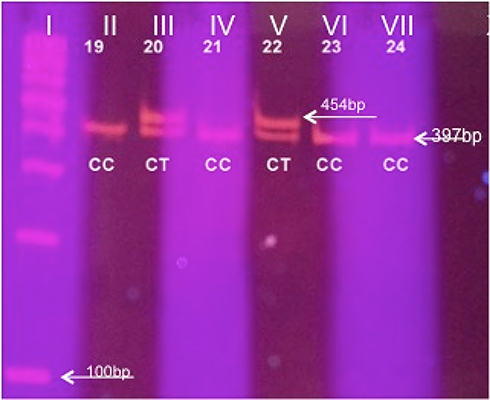 |
Figure 1 Results of restrictive digestion using 8% acrylamide gel for the CYP2C9 gene. Column I DNA standard (ladder) of 100bp. Columns II, IV, VI and VII, C/C (wild type) (397 + 57bp); Column III, V C/T, Arginine/Cysteine - heterozygote (454 + 397 + 57bp). |
(rs72551330) After verification of the 167 bp PCR product on horizontal electrophoresis using 2% agarose gel, restriction digestion with StyI restriction enzyme was performed at a temperature of 37 ° C. The obtained digestion was performed on 8% polyacrylamide gel, and the obtained results were interpreted as follows: two fragments of size 113 and 54bp were obtained in wild type, three fragments of 167, 113 and 54bp in heterozygote and 167bp for polymorphic homozygote (Figure 2).
 |
Figure 2 Results of restrictive digestion using 8% acrylamide gel for UGT1A9 gene. Column II DNA standard of 100 bp. Column I, III, IV, VI, VII, VII, IX, X T/T (wild type) (113 + 54 bp); Column V C/T - heterozygote (167 + 113 + 54bp). |
(rs3745274) After verification of PCR product size 526bp on horizontal electrophoresis using 2% agarose gel, restriction digestion was carried out using BsrI restriction enzyme at a temperature of 60 °C. The assay of digestion obtained was carried out on 8% polyacrylamide gel, and the obtained results were interpreted as follows: three fragments of size 241, 268 and 17bp were obtained in wild type, 509 and 17bp in polymorphic homozygotes (Figure 3).
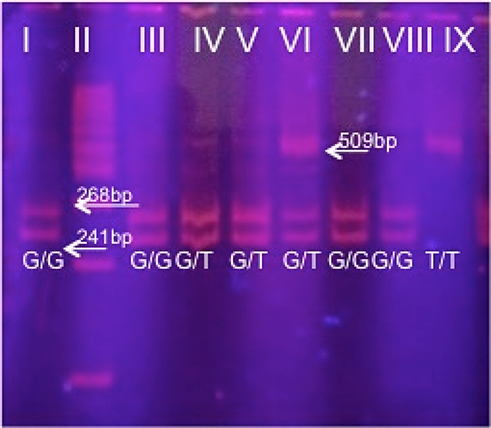 |
Figure 3 Results of restrictive digestion using 8% acrylamide gel for the CYP2B6 gene. Column II DNA standard (ladder) of 100bp. Column I, III, VII, VIII G/G (wild type) (268 + 241 bp); Column IV, V, VI G/T - heterozygote (509 + 268 + 241 bp); Column IX, T/T (509 bp). |
Determination of the Concentration of Propofol in Plasma by HPLC Analytical Technique
All chemicals used were HPLC purity. The standard of propofol was procured from Sigma Aldrich (USA). The manufacturer of acetonitrile was J.T.Baker (Netherlands), and trifluoroacetic acid Merck (Germany). Deionized water was obtained by the MicroPure Ultra Thin Water System (Thermo Scientific, Germany).
HPLC analytical techniques were applied to measure the content of propofol in plasma, based on the methods described by Moghaddam et al7 and Mikstacki et al.2
For analysis, 200 μL of plasma was used, which was first deproteined with 200 μL of trifluoroacetic acid (TFA) solution in acetonitrile (0.3%). After a short vortex, centrifugation was followed at 12,000 rpm for 10 min at 4 °C. Subsequently, the supernatant was isolated, of which 20 μL was injected onto the HPLC instrument Agilent 1200 (Agilent, USA), equipped with DAD and fluorescence detectors. For the chromatographic analysis, the analytical reverse-phase column Pursuit C18, 150 x 3 mm particle size of 3 micrometers (Agilent, USA), was maintained at 30 °C. The mobile phase consisted of a 0.1% aqueous trifluoroacetic acid solution (component A) and acetonitrile (component B). A gradient analysis system for the flow rate of 1 mL/min was used. From the initial 40% B share of the component B it grew to 100% to 10 mins, in order to return to the initial value for the next 1.5 mins and stay on it for up to 14 mins, which ended the analysis. With an additional 3 mins of equilibrium, the total duration of the analysis was 17 mins.
For the detection of propofol, two detectors were used: DAD which monitored changes in the UV-Vis region at 275nm and FLD whose excitation and emission wavelength were adjusted to 276nm and 310nm, respectively. The identification of propofol in the test samples was done by comparison with the standard solution of propofol. Using known concentrations of propofol standards, standard curves in UV-Vis and the fluorescent region were made, by which the concentration of propofol in the samples was calculated. The precision of the assay was 8.7%.
Statistical Analysis
Statistical analysis of the obtained results was performed using a software package for statistical data processing (SPSS, v.21). The obtained results were presented in the form of a mean value with standard deviation, or a median with an interquartile difference in the case of linear variables, while the category variables are represented by an absolute number with the corresponding percentage share. In order to determine the statistically significant relationship between the variables, the parametric (Student’s t-test) and non-parametric test (Mann–Whitney U-test) were used depending on the data distribution normality. The method of linear regression analysis, univariate and multivariate, was used to identify predictors of dependent variables, doses, concentrations and clearance of propofol, and then to obtain a statistically significant prediction model. Statistical significance was determined at p <0.05.
Results
The study included 94 children aged 1 to 17 years (average age 9.13 ± 5.32 years old), of which 53 were male (56.4%) and 41 females (43.6%). The characteristics of the examined group are given in Table 2. The highest number of patients had normal nutritional status (47.9%). In 33 cases (35.1%) anatomic malformations were noted; in 20 (21.3%) comorbidities were present, most of which were respiratory tract infections (45.0%) and epilepsy (30.0%). The majority of interventions were from the domain of plastic surgery (54.3%). The average duration of anesthesia was 58 mins. The average total dose of propofol was 278 mg, an initial dose 85 mg and a maintenance dose 160 mg.
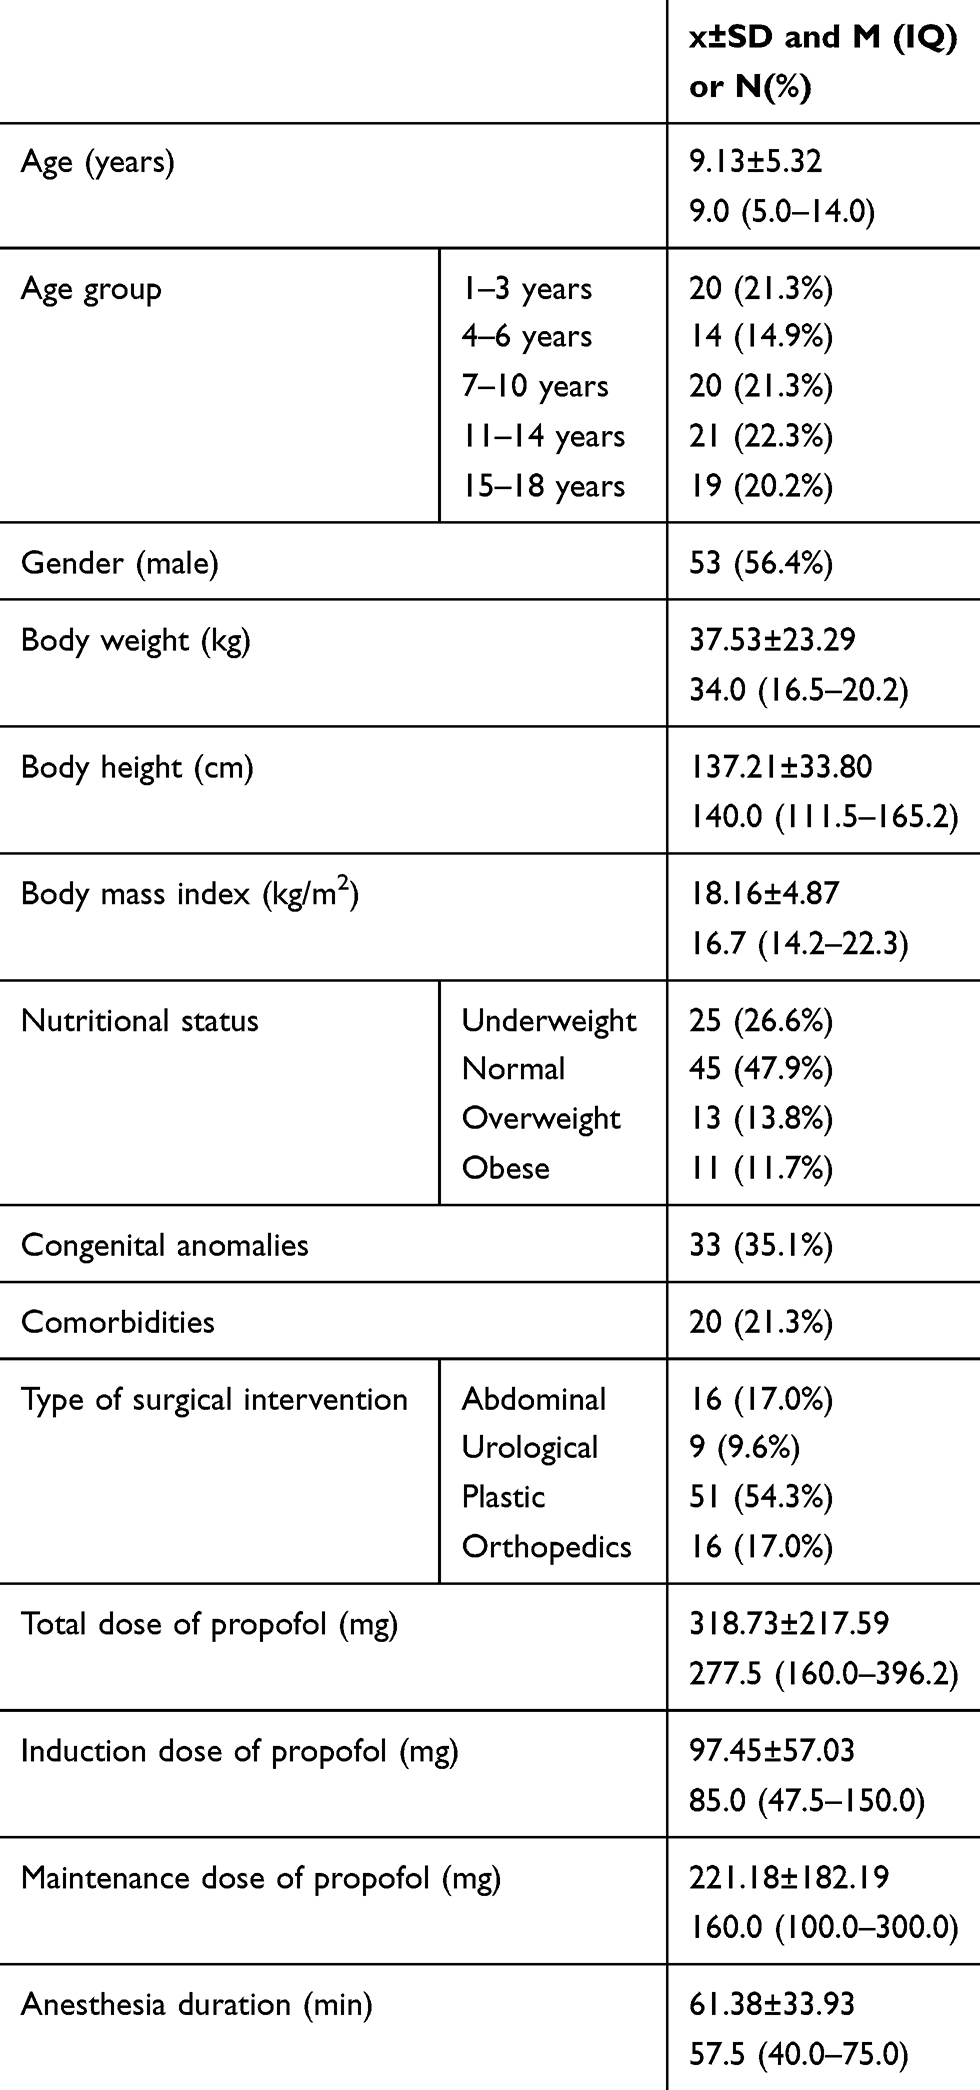 |
Table 2 Demographic Data of Patients Included in the Study |
Gene Variations - UGT1A9, CYP2C9 and CYP2B6
All 94 patients were tested for polymorphisms for UGT1A9, CYP2C9 and CYP2B6 enzymes that participate in the metabolism of propofol. The frequency of different genotypes is given in Table 3. The allele and genotypic frequencies of the studied polymorphisms were similar in cases and controls and followed the Hardy-Weinberg equilibrium
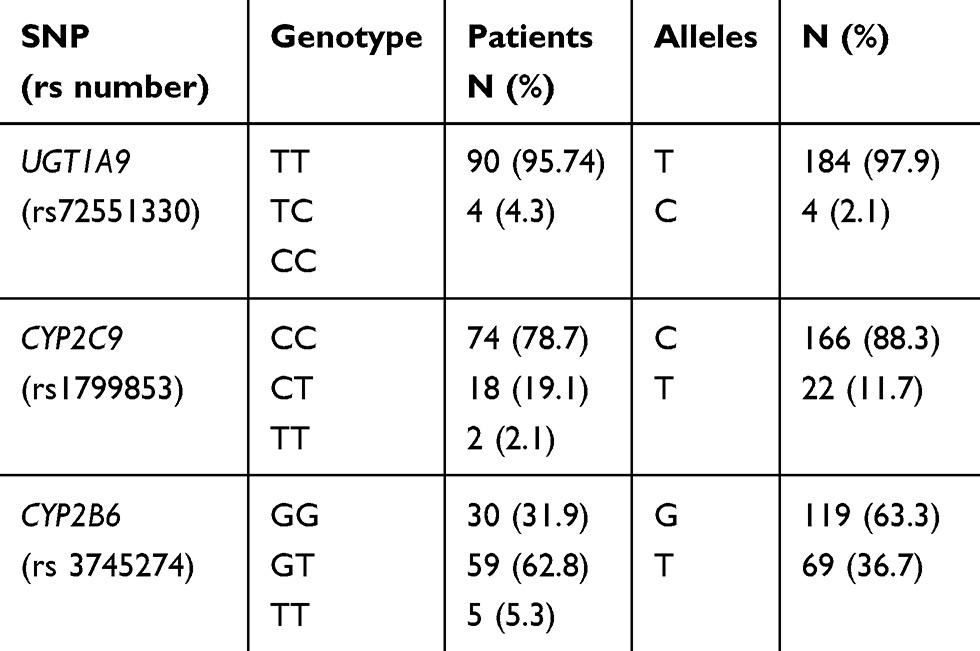 |
Table 3 Distribution of Genotypes UGT1A9 (98T>C), CYP2C9 (430C>T) and CYP2B6 (516G>T) in Patients Anesthetized with Propofol |
Due to a small number of samples with a polymorphic UGT1A9 allele, it was not possible to determine all the differences in the characteristics of patients with different genotypes. However, all four carriers of the polymorphic allele belonged to younger age groups, therefore they had less body weight (p<0.001) and height (p<0.01), but also a lower body mass index (p <0.05), with the trend of poorer nutrition (p=0.060). When it comes to CYP2C9*2 polymorphism, there were no statistically significant differences between the two groups of patients. Carriers of CYP 2B6 GG genotypes were older (p<0.01), had higher body weight (p <0.01) and height (p <0.05).
Propofol Dose
The average total administered dose of propofol was 318.73±217.59 mg, with an initial dose of 97.45±57.03 mg and a maintenance dose 221.18±182.19mg. Considering the large variations in the body weight of patients, as well as the duration of anesthesia, the total dose corrected by body weight (9.18±4.68 mg/kg) and a dose of propofol administered as a continuous infusion (6.63 ± 2.62 mg/kg/h) were calculated.
Carriers of polymorphic UGT1A9 C allele received significantly lower overall (p<0.05) and initial dose of propofol (p <0.05), with a lower maintenance trend (p=0.051). There was also a statistically significant difference in the dose of propofol administered as a continuous infusion (p <0.05). None of the propofol doses was statistically significant in relation to CYP2C9*2 polymorphism. The induction dose of propofol (p <0.05), as well as the total dose (p <0.01) were higher in the CYP2B6 GG genotype (Table 4).
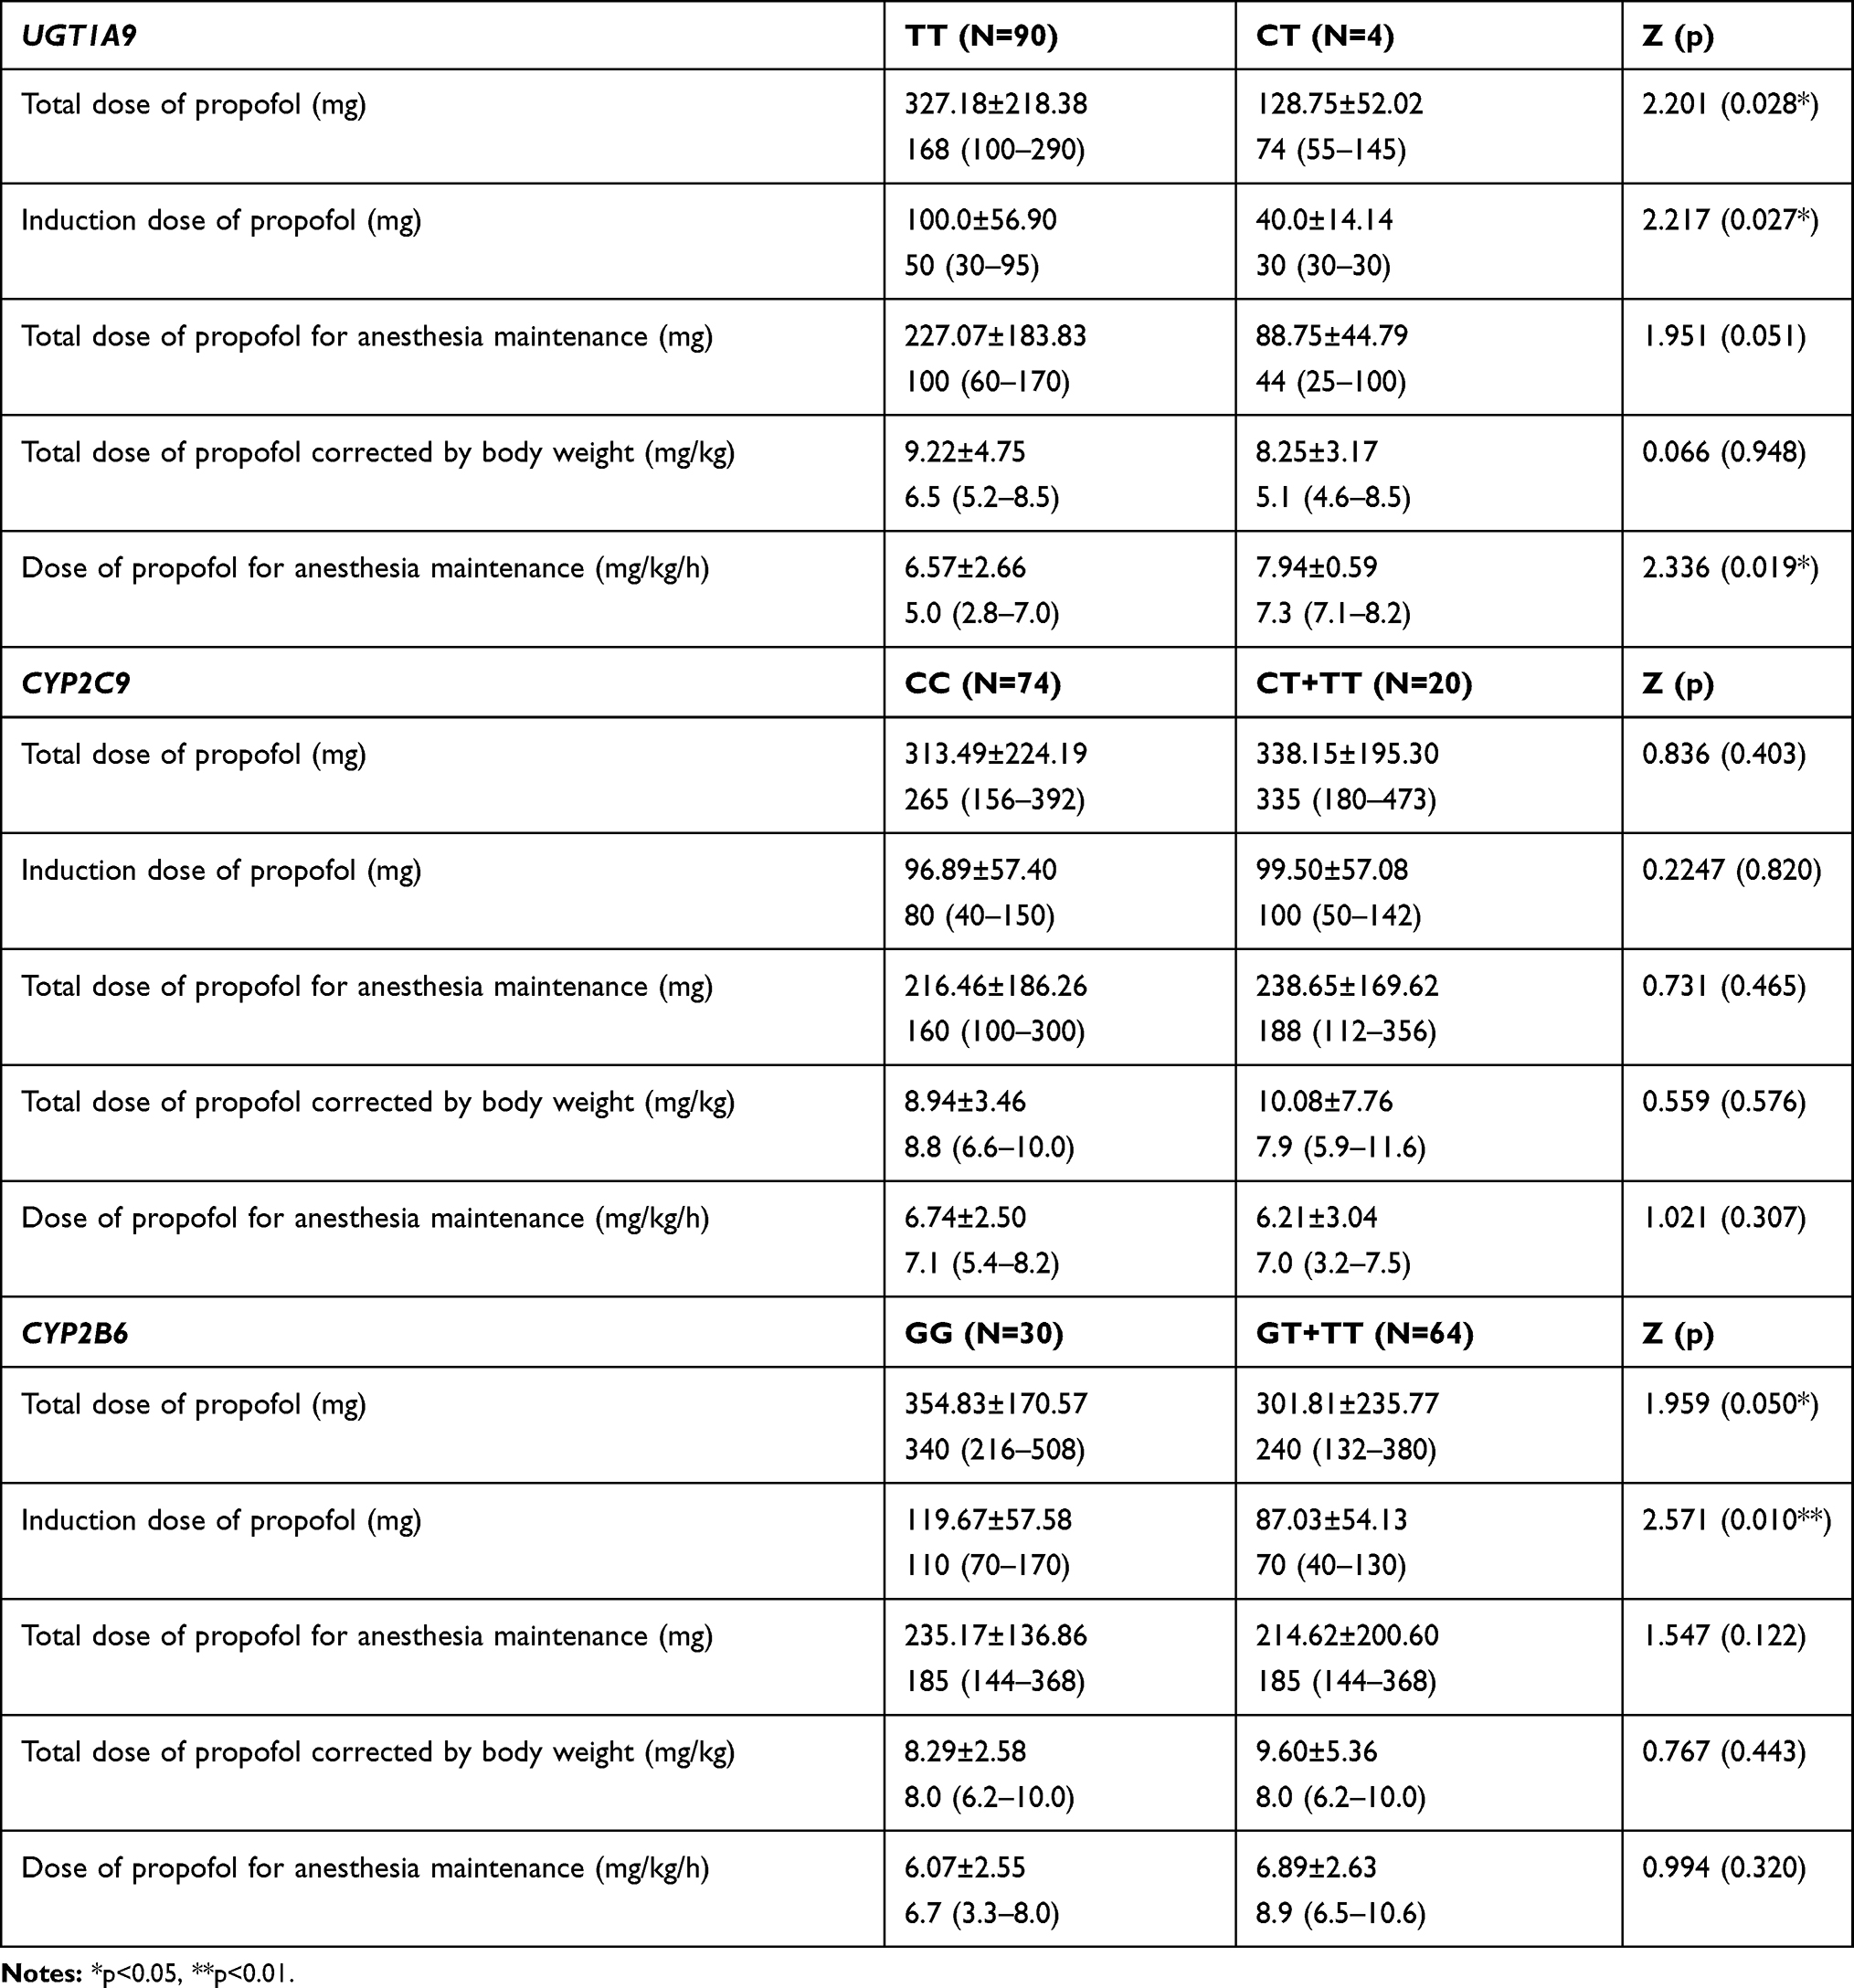 |
Table 4 Propofol Dose Dependent on Genotype UGT1A9, CYP2C9 and CYP2B6 |
Linear regression analysis of the total dose of propofol per kilogram of body weight as well as linear regression analysis of propofol dose in the form of continuous infusion (mg/kg/h) are presented in Tables 5 and 6.
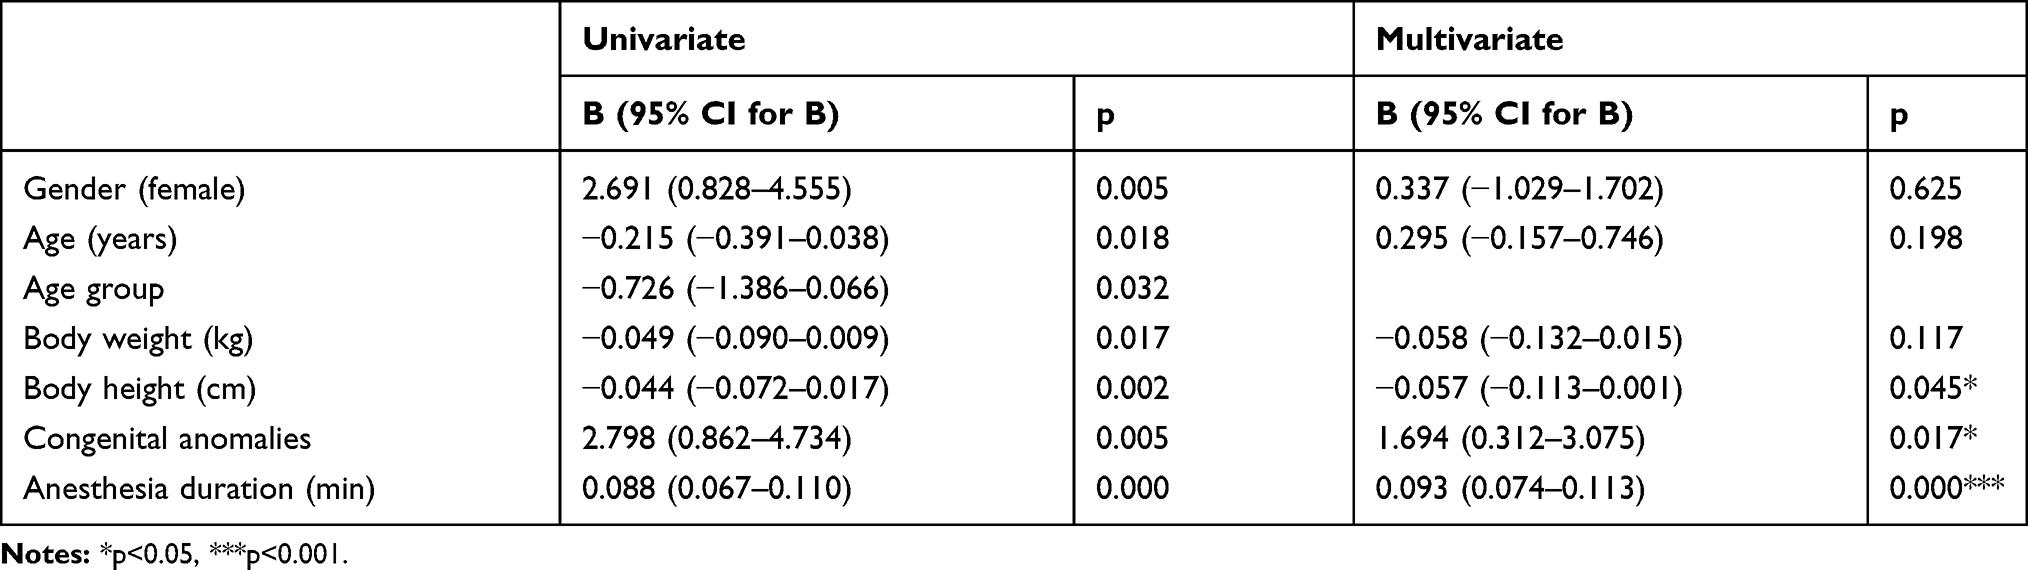 |
Table 5 Linear Regression Analysis of the Total Dose of Propofol per Kilogram of Body Weight |
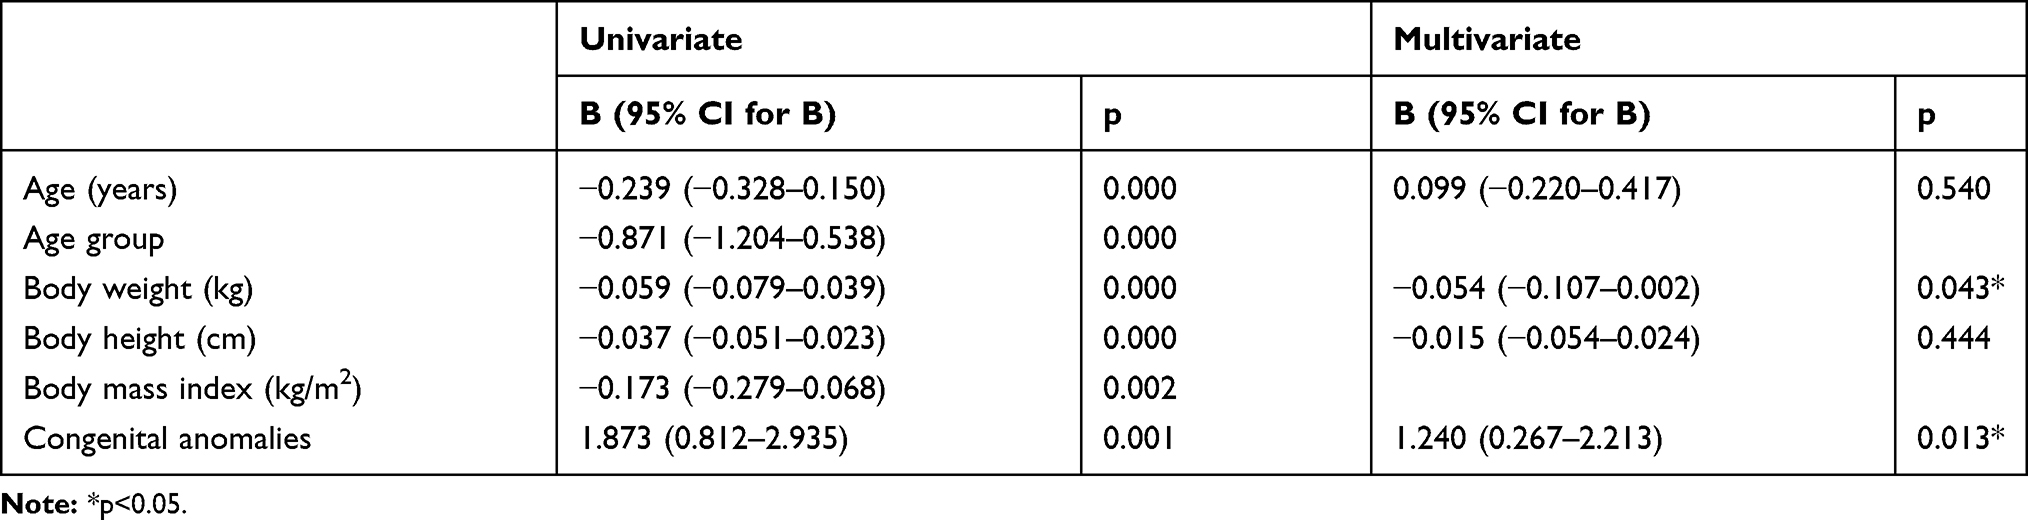 |
Table 6 Linear Regression Analysis of Propofol Dose in the Form of Continuous Infusion (Mg/Kg/h) |
Concentration of Propofol
Concentration of propofol was measured at 4 different times: 10 mins after introduction into anesthesia, at the end of infusion of propofol, as well as 10 and 20 mins after the completion of the propofol infusion. The mean measured values were: 35.19±54.72 mg/L, 44.82±82.84mg/L, 3.33±4.96 mg/L and 1.77±3.90 mg/L, respectively. The propofol concentration dropped by 70% after 10 mins from the completion of the propofol infusion, and by an additional 7% in the next 10 mins.
A statistically significant difference was found in the measured propofol concentrations corrected with the total given dose in 3rd (p<0.05) and 4th time (p<0.05). In addition, there was a trend of significantly higher concentrations of propofol in all 4 times in patients with UGT1A9 polymorphism, however a trend of faster elimination of propofol in the first 20 mins in these patients was noticed (Table 7). None of the propofol doses was statistically significant in relation to CYP2C9*2 polymorphism. None of the propofol doses was statistically significant in relation to the polymorphism of the CYP2B6 gene, but there was a trend of a higher percentage reduction in the concentration of propofol between 10 and 20 mins after cessation of the infusion (p = 0.072).
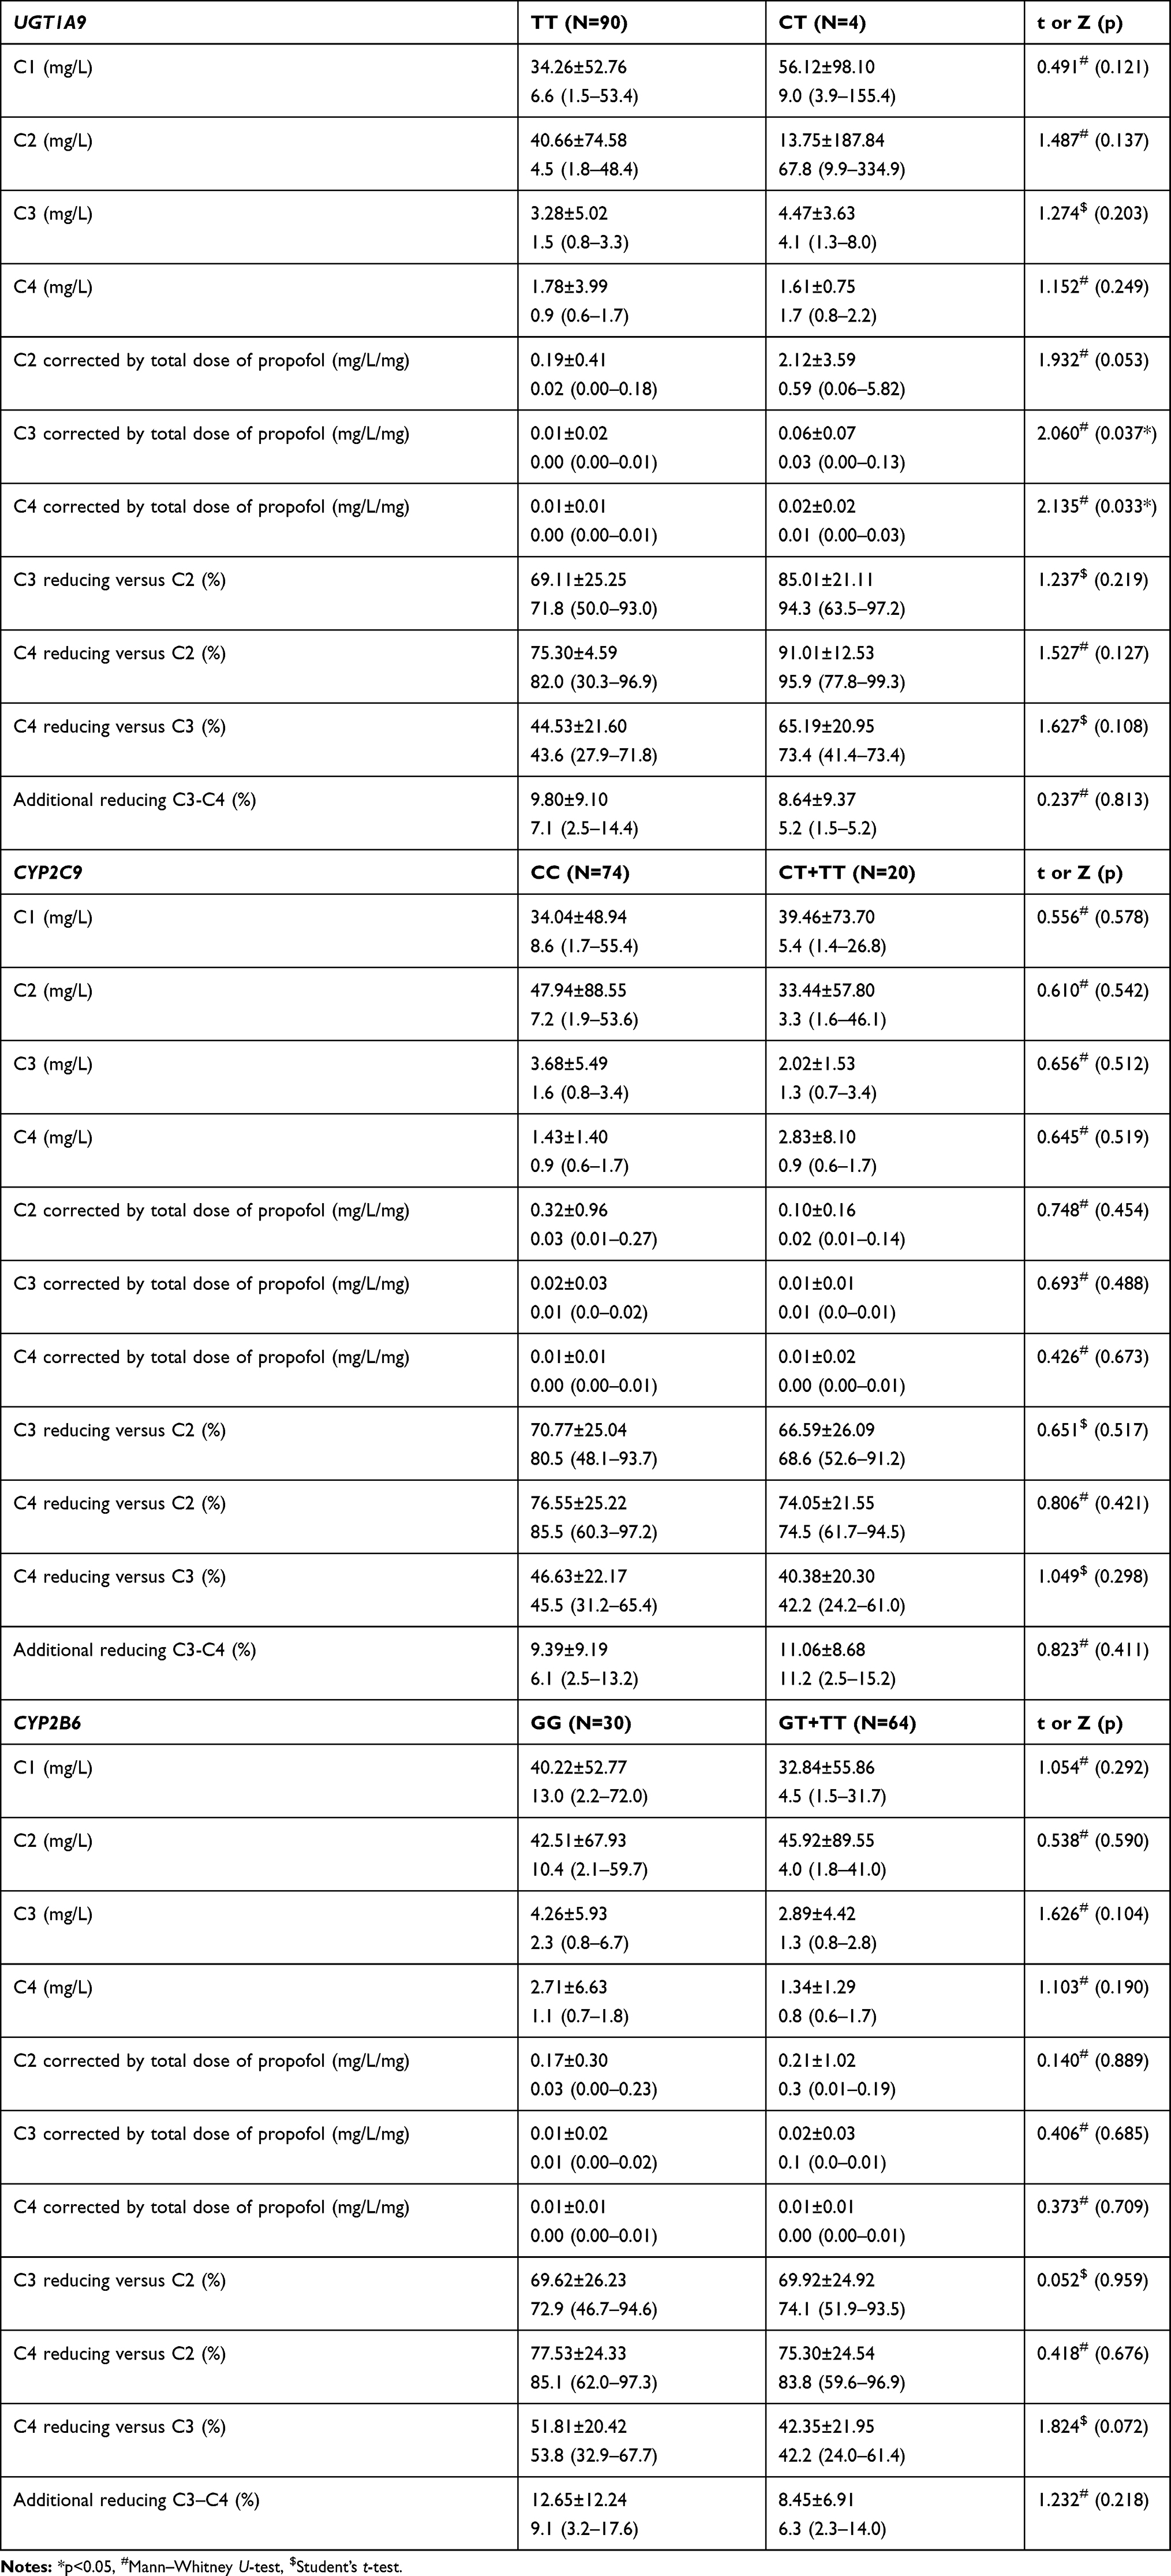 |
Table 7 Concentrations of Propofol in Four Times, Depending on the Genotype UGT1A9, CYP2C9 and CYP2B6 |
By the method of univariate linear regression, predictors of propofol concentration in blood immediately after the discontinuation of the propofol infusion were identified: UGT1A9 gene polymorphism and propofol dose administered as a continuous infusion. A statistically significant model of multivariate linear regression was obtained (F=4.951, p <0.01), which predicted 7.9% of the variance of the dependent variable, whereby, as independent predictors, they participated with 4.9% (p <0.05) and 4.2% (p <0.05), respectively.
By the method of univariate linear regression, predictors of a percentage reduction in propofol blood concentrations were identified for 10th minute after completion of the infusion: body mass index, nutrition status, dose of propofol administered as a continuous infusion, and appropriate concentrations measured in blood samples at 4 time points. A statistically significant model of multivariate linear regression (F = 16.904, p <0.001) was obtained which predicted 42.0% of the variation of the dependent variable. Independent predictors of a decrease in concentration in the first 10 mins were: body mass index, as well as initial concentrations of propofol (in the first two measurements). Patients with a lower body mass index showed a higher percentage of concentration reduction in the first 10 mins (partial R2=10.6%, p <0.01). Also, higher initial concentrations (after 10 mins of infusion and at the end of the infusion of propofol) predicted a greater reduction in the first 10 mins (partial R2=9.5%, p <0.01, partial R2=22.4%, p<0.001; respectively) (Table 8).
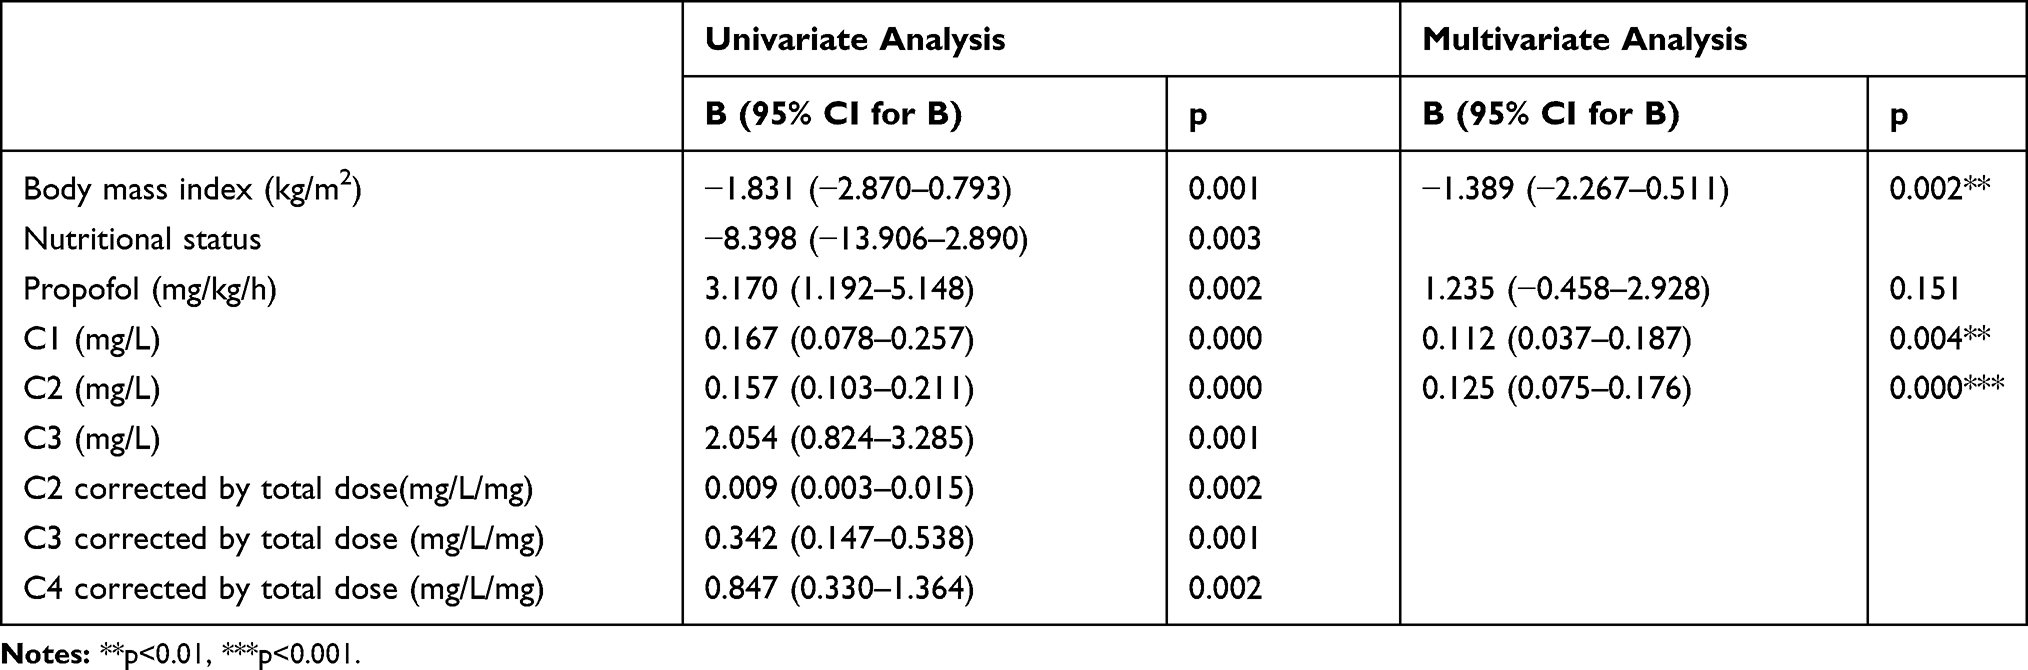 |
Table 8 Linear Regression Analysis of the Reduction in the Concentration of Propofol in Percentage 10 mins After Completion of the Infusion |
By the method of univariate linear regression, predictors of propofol concentrations reduction in percentage were identified for 20th minute after the infusion was complete: body mass index, nutrition status, propofol dose administered as a continuous infusion, and corresponding concentrations in the first 3 times. A statistically significant model of multivariate linear regression (F=12.894, p <0.001) was obtained, which predicted 34.8% of the variation of the dependent variable. Independent predictors of a decrease in concentration in the first 20 mins were: the dose of propofol administered as a continuous infusion, as well as the initial propofol concentrations (in the first two times). Patients who received a higher corrected dose of propofol showed a higher percentage of concentration reduction in the first 20 mins (partial R2 = 4.5%, p <0.05). Also, higher initial concentrations (after 10 mins of infusion and at the end of infusion of propofol) predicted a greater reduction in the first 20 mins (partial R2=10.7%, p <0.01, partial R2=14.7%, p<0.001; respectively) (Table 9).
 |
Table 9 Linear Regression Analysis of the Reduction in the Concentration of Propofol in Percentage 20 mins After Completion of the Infusion |
The average distribution constant of the drug was 7.39±4.68/h. It was higher in carriers of the polymorphic UGT1A9C allele. There was no difference in relation to the CYP2C9 genotype, nor the CYP2B6 genotype.
The average clearance of the drug was 742.6 mL/min. Drug clearance was lower in polymorphic UGT1A9 C allele (p=0.088) carriers, while there was no difference in relation to CYP2C9 *2 and CYP2B6 genotype (Table 10). Propofol concentrations in association with UGT1A9 98T>C, CYP2C9*2 and CYP2B6 516G>T polymorphisms are presented in Figures 4–6. By the method of univariate linear regression, the predictors of propofol clearance had been identified after cessation of infusion: age and age group, body weight, body mass index, nutritional status, and the presence of malformations (Table 11). A statistically significant model of multivariate linear regression was obtained (F=6.500, p<0.001), which predicted 15.2% of variation of dependent variables. The only independent predictor was the body mass index ie increase of BMI increased the propofol clearance (partial R2 = 8.8%, p <0.01).
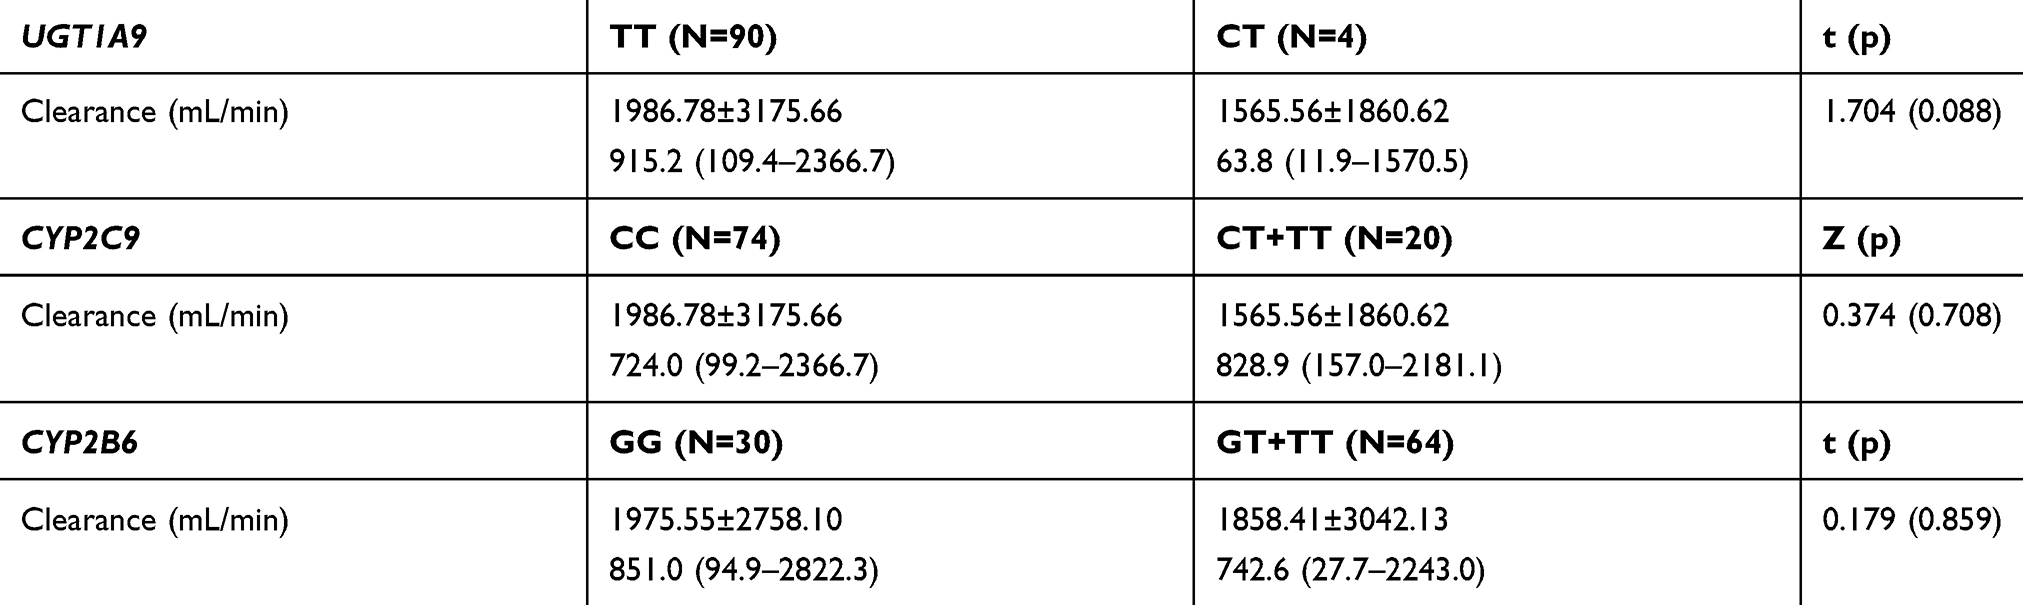 |
Table 10 The Effect of Gene Variation for UGT1A9, CYP2C9 and CYP2B6 on the Average Drug Clearance Value |
 |
Table 11 The Predictors of Propofol Clearance After Cessation of Infusion |
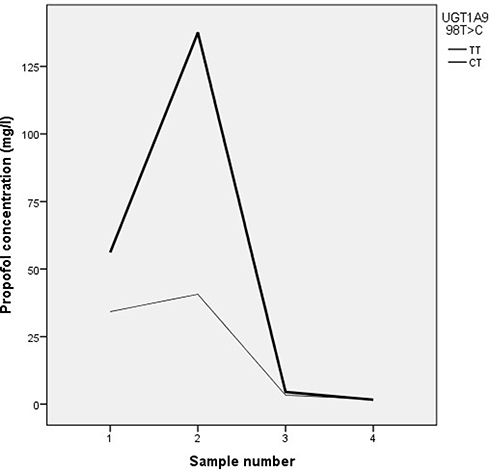 |
Figure 4 Propofol concentrations in association with UGT1A9 98T>C polymorphism. |
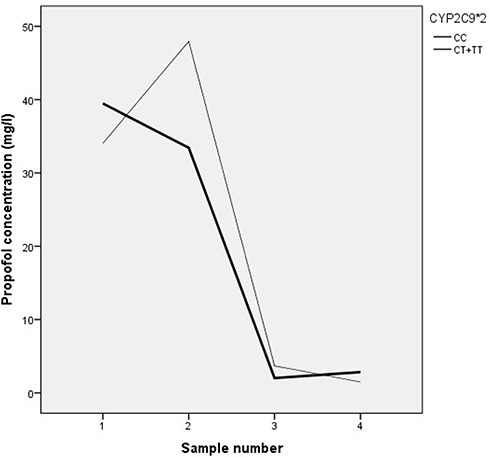 |
Figure 5 Propofol concentrations in association with CYP2C9*2 polymorphism. |
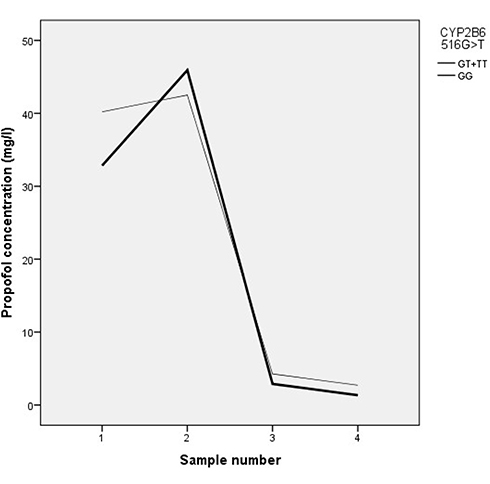 |
Figure 6 Propofol concentrations in association with CYP2B6 516G>T polymorphism. |
Discussion
Genetic variation can affect drug response in multiple ways, although it remains unclear how rare genetic variants affect drug response8 and to what extent they are clinically relevant. To improve pharmacogenetic utility and human health, researches are conducted to identify variants that provide cost-effective targets for pharmacogenetic testing in future.9 It is assumed that the etiology of individual variability in the response to anesthetics may also be influenced by genetic polymorphisms in metabolic and functional pathways.
Propofol is the most popular intravenous anesthetic used in children. As is commonly known, children are not “small adults”, and in that regard, it should be noted that numerous developmental changes, particularly in neonates and infants, affect the metabolism and pharmacokinetics of propofol.10,11 EC50 in children was found to be 3.71–3.85μg/mL12 in contrast to adults in which 2.19 to 3.07μg/mL was found.13 The half-life of propofol is not reliably established in children, and the interaction of propofol with opioids during TIVA and TCI (target controlled infusion) makes the prediction of recovery even more complicated.14 The loss of consciousness occurs at a concentration of 2±0,9μg/mL, until the return of consciousness and awakening from anesthesia can occur at concentrations of 1.8±0.7μg/mL. According to studies published in the literature there is no difference between children and adults.14,15
In the available literature that presented pharmacogenetic testing and the examination of the gene polymorphism influence on the metabolism of propofol, three genes are most often listed. Based on our findings, this is the first study in our country to investigate the effect of CYP2C9*2, CYP2B6 516G>T and UGT1A9 98C>T genetic polymorphisms on the pharmacokinetics of propofol in children of different sexes and ages who undergo total intravenous anesthesia and deep sedation during diagnostic and therapeutic procedures. CYP2C9 and CYP2B6 participate in the first stage of biotransformation of many clinically significant drugs, including anesthetic propofol, catalyzing hydroxylation of propofol in humans.
For the CYP2C9 gene, over 65 haplotypes are described, which result from insertion, deletion, and replacement of individual base pairs. In several studies,16,17 two non-synonymous changes of individual nucleotides (SNPs) p.R144C (c.430C>T, rs1799853, CYP2C9*2) and p.I359L (c.1075A>C, rs1057910, CYP2C9*3), which are responsible for slower substrate metabolism in certain phenotypes are being analyzed intensively. The effect of these polymorphisms is, first of all, examined on examples of warfarin and non-steroidal antiinflammatory drugs. Both allele with reduced function, *2 and *3, pose a significant risk factor for warfarin-induced hemorrhage, or bleeding in the upper parts of the gastrointestinal tract after the administration of non-steroidal anti-inflammatory drugs.18 Homozygotes for *3 allele show only 25% of the activity, while in heterozygotes this is between 40% and 75%, depending on the substrate.19,20 The allele frequency *2 (rs1799853, 430C>T) is about 6.8%. In our study, the representation of this heterozygous CYP2C9*2 (C/T) allele in children was (19.1%), while the representation of homozygous form (T/T) was 2.1%. No single dose of propofol that was used in pediatric patients in the course of this clinical study in relation to body weight and duration of anesthesia was not statistically significant in relation to polymorphism CYP2C9*2. As found in the Mikstacki et al2 study, the obtained results of our study indicate that the polymorphism of the CYP2C9 gene did not affect the pharmacokinetic profile of propofol.
The average relative contribution of CYP2B6, which participates in the first phase of biotransformation of xenobiotics, in relation to the total proportion of the liver cytochrome P450 family (CYP), ranges from 2 to 10%. The CYP2B6 gene is one of the most polymorphic CYP superfamily genes in humans, with more than 100 known variants of DNA.21 However, the most widely analyzed variant in pharmacogenetic studies are c.516G>T (rs3745274, Gln172His) polymorphism, found on various CYP2B6 haplotypes. This variation causes the emergence of an alternative splicing on iRNA which results in loss of exons from 4 to 6, which leads to a serious reduction in the activity of the protein and the enzyme CYP2B6.22
The effect of CYP2B6 c.516 G>T on the pharmacokinetic profile of propofol in the available studies has not been fully clarified.1,23,24 However, CYP2B6 plays an important role in the process of biotransforming this anesthetic through hydroxylation. A recent study conducted by Mourao et al1 on 108 adult patients during TIVA, however, suggests that the present variant of the c.516G>T CYP2B6 gene allele reduces the required dose of propofol versus body weight and length of anesthesia by about 7%, due to slower metabolism of propofol. As no statistically significant correlation were found in our study between the amount of propofol and the variation of the CYP2B6 c.516G>T gene, the possible difference in the obtained results may be due to the low frequency of c.516G>T variants of the CYP2B6 gene.
Since UGT1A9 plays a major role in the metabolism of propofol, it can be considered that all polymorphisms in this gene have a high significance and impact on the metabolism of propofol. Apart from the liver, super families of this enzyme (UGT1, UGT2, UGT3, UGT8) are present in the kidneys, colon, ovary, and testis,5 where they participate in the second phase of biotransformation and elimination of propofol but also in biotransformation and elimination of other important drugs, such as some anti- medicines (irinotecan, sorafenib, epirubicin).25 Among the most basic variants of the UGT1A9 gene, which leads to decreased enzyme activity, are three known amino acid changes: p.M33T, p.D256N and p.I242Ks. The variations of sequences in codon 33 (c.98T>C, rs72551330, UGT1A9*3) affect the pharmacokinetics of the propofol by changing or decreasing the affinity of the UGT1A9*3 for binding substrate, which makes this gene variant as a factor that determines persons as poor metabolizers.26 These variants of the genes may be responsible for a lower degree of inactivation of propofol by the glucuronidation process, and its slower urinary clearance, as well as hepatotoxic effects that can lead to liver failure in patients on irinotecan chemotherapy.27 In our study, 4 polymorphic variants of this gene were found in the form of heterozygote (CT), which makes 4.3%. Although this is a relatively small proportion of this polymorphism in the examined population of children, the obtained results indicate that carriers of the polymorphic UGT1A9 C allele received significantly lower total (p <0.05) and the initial dose of propofol (p <0.05), with a lower maintenance dose (p = 0.051). In addition, there is a trend of significantly higher concentrations of propofol in all 4 times in UGT1A9 polymorphism carriers.
The average clearance of the drug was 742.6 mL/min. There was a lower clearance curve for polymorphic UGT1A9 C allele (p = 0.088) carriers, while there was no difference in the CYP2C9*2 genotype and CYP2B6 genotype. In the available literature there is a small number of papers related to the effects of the variant of the c.98T>C, rs72551330, UGT1A9*3 genes on the metabolism of propofol and the clinical evaluation of the effects of anesthesia and analgesia. Recently, a group of Chinese researchers in their study examined the effects of this gene polymorphism in the induced abortion procedure using propofol in 156 women. No significant differences were observed in patients with −440C/T, −1818T/C and −1887T/G regarding the onset of nausea, vomiting and/or respiratory depression, and it was concluded that the polymorphisms of these UGT super families do not affect metabolic rate and not potentiate adverse effects of propofol.28 However, Fukuda et al29 found significant reduction in the process of glucuronidation of mycophenolic acid used in suppressive therapy in kidney transplantation in children, for which metabolism was found to be responsible the UDP-glucuronosulfotransferase enzyme 1A9 (UGT1A9).
Limitations
The sample size was relatively small and only three polymorphisms were analyzed so additional studies are required with a larger number of patients whereby more genes would be analyzed.
Conclusion
This study showed that UGT1A9 genotype is an independent predictor of the propofol concentration in children immediately after the end of the continuous infusion and 10 mins afterwards. In the carriers of the polymorphic UGT1A9C allele, the propofol distribution constant was higher. The carriers of the polymorphic CYP2B6 T allele received a significantly lower overall and initial dose of propofol. Unlike polymorphism of the UGT1A9 gene, the tested CYP2C9 and CYP2B6 gene polymorphisms are not independent predictors of the pharmacokinetics of propofol. As independent predictors of the achieved concentrations of propofol in children, in addition to the UGT1A9 polymorphism examined, the following are distinguished: the duration of anesthesia, the induction dose of propofol and the administered dose of propofol in the form of a continuous infusion. As an independent predictor of the decrease in propofol concentration in children, in addition to the UGT1A9 polymorphism examined, the following are distinguished: body mass index, propofol dose administered in the form of continuous infusion, as well as drug concentration in all four measured times.
Abbreviations
ASA, American Society of Anesthesiologists; ТIVA, total intravenous anesthesia; BIS, bispectral index; PCR-RFLP, polymerase chain reaction-restriction fragment length polymorphism; HPLC, high performance liquid chromatography; DAD, diode-array detection; FLD, fluorescence detection; BMI, body mass index.
Acknowledgments
This research was supported by the Ministry of Education, Science and Technological Development of the Republic Serbia during activities on projects III41018. We wish to thank our colleagues: Slavoljub Zivanovic, Jasen Kundalic, Jadranka Mitrovic and Ana Spasic for technical assistance during laboratory work.
Disclosure
Dragana Stokanovic reports grants from Ministry of Education, Science and Technological Development, Serbia, during the conduct of the study. The authors declare that there are no other conflicts of interest to disclose.
References
1. Mourao AL, de Abreu FG, Fiegenbaum M. Impact of the cytochrome P450 2B6 (CYP2B6) gene polymorphism c.516G>T (rs3745274) on propofol dose variability. Eur J Drug Metab Pharmacokinet. 2016;41:511–515.
2. Mikstacki A, Zakerska-Banaszak O, Skrzypczak-Zielinska M, et al. The effect of UGT1A9, CYP2B6 and CYP2C9 genes polymorphism on individual differences in propofol pharmacokinetics among polish patients undergoing general anaesthesia. J Appl Genet. 2017;58:213–220. doi:10.1007/s13353-016-0373-2
3. Mukai M, Tanaka S, Yamamoto K, et al. In vitro glucuronidation of propofol in microsomal fractions from human liver, intestine and kidney: tissue distribution and physiological role of UGT1A9. Pharmazie. 2014;69(11):829–832.
4. Court MH, Duan SX, Hesse LM, Venkatakrishnan K, Greenblatt DJ. Cytochrome P-450 2B6 is responsible for interindividual variability of propofol hydroxylation by human liver microsomes. Anesthesiology. 2001;94:110–119. doi:10.1097/00000542-200101000-00021
5. Restrepo JG, Garcia-Martin E, Martinez C, Agundez JA. Polymorphic drug metabolism in anaesthesia. Curr Drug Metab. 2009;10:236–246. doi:10.2174/138920009787846305
6. Howie SR. Blood sample volumes in child health research: review of safe limits. Bull World Health Organ. 2011;89(1):46–53. doi:10.2471/BLT.10.080010
7. Moghaddam PT, Pipelzadeh MR, Nesioonpour S, Saki N, Rezaee S. High-performance liquid chromatographic determination of propofol in human plasma: comparison of different heteroscedastic calibration curve models. Adv Pharm Bull. 2014;4(4):351–358. doi:10.5681/apb.2014.051
8. Bush WS, Crosslin DR, Owusu-Obeng A, et al. Genetic variation among 82 pharmacogenes: the PGRNseq data from the eMERGE network. Clin Pharmacol Ther. 2016;100(2):160–169. doi:10.1002/cpt.350
9. Kozyra M, Ingelman-Sundberg M, Lauschke VM. Rare genetic variants in cellular transporters, metabolic enzymes, and nuclear receptors can be important determinants of interindividual differences in drug response. Genet Med. 2017;19(1):20–29. doi:10.1038/gim.2016.33
10. Chidambaran V, Costandi A, D’Mello A. Propofol: a review of its role in pediatric anesthesia and sedation. CNS Drugs. 2015;29(7):543–563. doi:10.1007/s40263-015-0259-6
11. Lu H, Rosenbaum S. Developmental pharmacokinetics in pediatric populations. J Pediatr Pharmacol Ther. 2014;19(4):262–276. doi:10.5863/1551-6776-19.4.262
12. Rigouzzo A, Servin F, Constant I. Pharmacokinetic-pharmacodynamic modeling of propofol in children. Anesthesiology. 2010;113(2):343–352. doi:10.1097/ALN.0b013e3181e4f4ca
13. Wiczling P, Bienert A, Sobczynski P, et al. Pharmacokinetics and pharmacodynamics of propofol in patients undergoing abdominal aortic surgery. Pharmacol Rep. 2012;64(1):113–122. doi:10.1016/S1734-1140(12)70737-5
14. McCormack J, Mehta D, Peiris K, et al. The effect of a target controlled infusion of propofol on predictability of recovery from anesthesia in children. Paediatr Anaesth. 2010;20(1):56–62. doi:10.1111/pan.2009.20.issue-1
15. Iwakiri H, Nishihara N, Nagata O, Matsukawa T, Ozaki M, Sessler DI. Individual effect-site concentrations of propofol are similar at loss of consciousness and at awakening. Anesth Analg. 2005;100(1):107–110. doi:10.1213/01.ANE.0000139358.15909.EA
16. Lee CR, Goldstein JA, Pieper JA. Cytochrome P450 2C9 polymorphisms: a comprehensive review of the in-vitro and human data. Pharmacogenetics. 2002;12:251–263. doi:10.1097/00008571-200204000-00010
17. Tabib A, Najibi B, Dalili M, Baghaei R, Poopak B. Enzyme polymorphism in warfarin dose management after pediatric cardiac surgery. Res Cardiovasc Med. 2015;4(3):e27963.
18. Milius EM, Papademetrious TR, Heitlinger LA. Retrospective review of propofol dosing for procedural sedation in pediatric patients. J Pediatr Pharmacol Ther. 2012;17(3):246–251. doi:10.5863/1551-6776-17.3.246
19. Kirchheiner J, Brockmöller J. Clinical consequences of cytochrome P450 2C9 polymorphisms. Clin Pharmacol Ther. 2005;77(1):1–16. doi:10.1016/j.clpt.2004.08.009
20. Varshney E, Saha N, Tandon M, Shrivastava V, Ali S. Genotype-phenotype correlation of cytochrome P450 2C9 polymorphism in Indian National Capital Region. Eur J Drug Metab Pharmacokinet. 2013;38(4):275–282. doi:10.1007/s13318-013-0124-2
21. Zanger UM, Klein K, Saussele T, Blievernicht J, Hofmann MH, Schwab M. Polymorphic CYP2B6: molecular mechanisms and emerging clinical significance. Pharmacogenomics. 2007;8:743–759. doi:10.2217/14622416.8.7.743
22. Hofmann MH, Blievernicht JK, Klein K, et al. Aberrant splicing caused by single nucleotide polymorphism c.516G>T [Q172H], a marker of CYP2B6*6, is responsible for decreased expression and activity of CYP2B6 in liver. J Pharmacol Exp Ther. 2008;325:284–292. doi:10.1124/jpet.107.133306
23. Loryan I, Lindqvist M, Johansson I, et al. Influence of sex on propofol metabolism, a pilot study: implications for propofol anesthesia. Eur J Clin Pharmacol. 2012;68:397–406. doi:10.1007/s00228-011-1132-2
24. Choong E, Loryan I, Lindqvist M, et al. Sex difference in formation of propofol metabolites: a replication study. Basic Clin Pharmacol Toxicol. 2013;113:126–131. doi:10.1111/bcpt.2013.113.issue-2
25. Lu L, Zhou J, Shi J, et al. Drug-metabolizing activity, protein and gene expression of UDP-glucuronosyltransferases are significantly altered in hepatocellular carcinoma patients. PLoS One. 2015;10(5):e0127524. doi:10.1371/journal.pone.0127524
26. Korprasertthaworn P, Rowland A, Lewis BC, Mackenzie PI, Yoovathaworn K, Miners JO. Effects of amino acid substitutions at positions 33 and 37 on UDP-glucuronosyltransferase 1A9 (UGT1A9) activity and substrate selectivity. Biochem Pharmacol. 2012;84(11):1511–1521. doi:10.1016/j.bcp.2012.08.026
27. Villeneuve L, Girard H, Fortier LC, Gagné JF, Guillemette C. Novel functional polymorphisms in the UGT1A7 and UGT1A9 glucuronidating enzymes in Caucasian and African-American subjects and their impact on the metabolism of 7-ethyl-10- hydroxycamptothecin and flavopiridol anticancer drugs. J Pharmacol Exp Ther. 2003;307(1):117–128. doi:10.1124/jpet.103.054072
28. Wang Y-B, Zhang R-Z, Huang S-H, Wang S-B, Xie J-Q. Relationship between UGT1A9 gene polymorphisms, efficacy, and safety of propofol in induced abortion amongst Chinese population: a population-based study. Biosci Rep. 2017;37(5):BSR20170722. doi:10.1042/BSR20170722
29. Fukuda T, Goebel J, Cox S, et al. UGT1A9, UGT2B7, and MRP2 genotypes can predict mycophenolic acid pharmacokinetic variability in pediatric kidney transplant recipients. Ther Drug Monit. 2012;34(6):671–679. doi:10.1097/FTD.0b013e3182708f84
 © 2020 The Author(s). This work is published and licensed by Dove Medical Press Limited. The full terms of this license are available at https://www.dovepress.com/terms.php and incorporate the Creative Commons Attribution - Non Commercial (unported, v3.0) License.
By accessing the work you hereby accept the Terms. Non-commercial uses of the work are permitted without any further permission from Dove Medical Press Limited, provided the work is properly attributed. For permission for commercial use of this work, please see paragraphs 4.2 and 5 of our Terms.
© 2020 The Author(s). This work is published and licensed by Dove Medical Press Limited. The full terms of this license are available at https://www.dovepress.com/terms.php and incorporate the Creative Commons Attribution - Non Commercial (unported, v3.0) License.
By accessing the work you hereby accept the Terms. Non-commercial uses of the work are permitted without any further permission from Dove Medical Press Limited, provided the work is properly attributed. For permission for commercial use of this work, please see paragraphs 4.2 and 5 of our Terms.