")
Back to Journals » International Journal of Nanomedicine » Volume 11
The effect of red-allotrope selenium nanoparticles on head and neck squamous cell viability and growth
Received 27 January 2016
Accepted for publication 25 April 2016
Published 1 August 2016 Volume 2016:11 Pages 3641—3654
DOI https://doi.org/10.2147/IJN.S105173
Checked for plagiarism Yes
Review by Single anonymous peer review
Peer reviewer comments 3
Editor who approved publication: Professor Carlos Rinaldi
Christopher E Hassan,1 Thomas J Webster1,2
1Department of Chemical Engineering, Northeastern University, Boston, MA, USA; 2Center of Excellence for Advanced Materials Research, King Abdulaziz University, Jeddah, Saudi Arabia
Abstract: Given their low toxicity and natural presence in the human diet, selenium nanoparticles have been established as potential candidates for the treatment of numerous cancers. Red-allotrope selenium nanoparticles (rSeNPs) were synthesized and characterized in this study. Head and neck squamous cell carcinoma (HNSCC) and human dermal fibroblast (HDF) cells were cultured and exposed to rSeNPs at concentrations ranging from 0.01 to 100 µg rSeNP/mL media for 1–3 days. The toxicity of rSeNP toward HNSCC and HDFs was analyzed. Results indicated that the particles were approximately four times as cytotoxic toward HNSCC compared to HDFs, with their respective IC50 values at 19.22 and 59.61 µg rSeNP/mL media. Using statistical analysis, an effective dosage range for killing HNSCC cells while simultaneously minimizing damage to HDFs over a 3-day incubation period was established at 20–55 µg rSeNP/mL media. Observations showed that doses of rSeNP <5 µg rSeNP/mL media resulted in cell proliferation. Transmission electron microscopy images of HNSCC and HDF cells, both treated with rSeNPs, revealed that the rSeNPs became localized in the cytoplasm near the lysosomes and mitochondria. Analysis of cell morphology showed that the rSeNPs primarily induced HNSCC apoptosis. Collectively, these results indicated that rSeNPs are a promising option for treating HNSCC without adversely affecting healthy cells and without resorting to the use of harmful chemotherapeutics.
Keywords: selenium, nanotechnology, biomaterials, head and neck squamous cell carcinoma, human dermal fibroblasts, cancer
Introduction
With ~540,000 new cases occurring annually worldwide and a mortality rate of 50%, head and neck squamous cell carcinoma (HNSCC) continues to be an extremely difficult cancer to treat, let alone cure.1 Although patients in the US tend to receive the best forms of HNSCC treatment available, survival rates remain low at <5 years,2 with locoregional reoccurrence following surgical removal of primary tumors or radiation therapy being quite common.3–5 The disease is most commonly found in middle-aged men who have histories of heavy smoking or tobacco usage and excessive alcohol consumption.6,7 However, recent studies have shown that it has an unusually high rate of occurrence in young women, many of whom have had no obvious risk factors. However, a possible causal link between HNSCC and human papillomavirus has been observed.8–11 One of the primary mutations that leads to the disease is the loss of chromosomal region 9p21, which encodes transcripts p14ARF and p16, both of which regulate the cell growth cycle and mediate the degradation of p53 proteins.12 Wild-type p53 is responsible for regulating cell proliferation via the induction of apoptosis when cell stresses are too high.13–16 Should the protein mutate, its conformation will change, significantly extending its half-life while simultaneously neglecting the wild-type protein’s primary function.17,18 Adenoviral vectors have been attempted but have been found to be immunogenic, often inducing an inflammatory response capable of potentially causing significant airway obstruction.19–21 Metastasis is often a complicating factor, frequently occurring in the lymph nodes in the immediate vicinity of the primary tumor.22,23 It is clear that new approaches are needed to treat HNSCC.
In recent years, nanotechnology, or engineering of particles at an atomic scale, has gained popularity in the medical field for use in disease imaging, diagnosis, and treatment.24,25 In particular, selenium nanoparticles have caught the community’s attention, in part due to their ability to inhibit the growth of bacteria and certain forms of cancers.26–29 In the form of nanoparticles, selenium has been found to have low toxicity toward healthy, noncancerous cells, such as osteoblasts and human dermal fibroblasts (HDFs), at a maximum chronic dose of 2,400 μg/day.30–32 In addition, recent studies have found that selenium nanoparticles, functionalized with polyethylene glycol to prevent agglomeration, are able to cause apoptosis in drug-resistant hepatocellular carcinoma cells by destabilizing their mitochondrial membranes.33 In vitro tests on prostate cancer tissue cultures have found that selenium nanoparticles inhibit cell growth through apoptosis by downregulating mRNA for androgen receptors and increasing phosphorylation of Akt kinase.34 Selenium is most often found within the selenoenzymes glutathione peroxidase and thioredoxin reductase, antioxidants which are responsible for reducing hydroperoxides and oxidized thioredoxin, respectively.35 However, at high concentrations, selenium compounds become pro-oxidants, often reacting with thiols to produce superoxide anions and hydrogen peroxide.36 Compared with other selenium compounds such as selenomethionine and Se-methylselenocysteine, selenium nanoparticles introduced into mice have been found to induce toxicity to a lesser extent while simultaneously increasing selenoenzyme activity to a higher degree.35,37
The one key trick with using selenium nanoparticles is dealing with the possibility of an allotrope shift. At 31°C, selenium nanoparticles nucleate, forming amorphous red-allotrope nanoparticles. At higher temperatures, they undergo an allotrope shift, forming trigonal, micron-scale, gray-allotrope crystals.38 With an average length of 6 μm, these crystals would easily be filtered from the bloodstream by the reticuloendothelial system, a component of the immune system that removes foreign entities from the body, significantly reducing their circulation time and effectiveness. Once caught in the system, the particles often wind up in the liver, where they can potentially build to toxic levels over time if chronically introduced into the body.39–41 Fortunately, empirical experimental experience has shown that significant dilution (<100 μg Se/mL media) of the nanoparticle suspension while at temperatures <31°C is sufficient to minimize this shift. At the human body’s temperature of 37°C, this dilution was found to be sufficient to minimize an allotrope shift for the in vitro time frame in which this study was conducted.
The objective of this in vitro study was to quantify the relative cytotoxic effect of red-allotrope selenium nanoparticles (rSeNPs) on HNSCC, using HDFs as a control for comparison. Results of the cell viability assays showed significant promise for the use of rSeNPs as a novel treatment of HNSCC, without resorting to harmful chemotherapeutics. Cell density calculations revealed that rSeNPs reduced HNSCC cell viability and proliferation at higher doses and long incubation times. Transmission electron microscopy (TEM) revealed the localization of the nanoparticles within the cytoplasm near the lysosomes and mitochondria, and provided evidence, which needs further verification, that rSeNP-treated HNSCC cells underwent apoptosis while HDFs underwent occasional necrosis at concentrations significantly higher than those needed to kill HNSCC.
Materials and methods
Materials
Dulbecco’s Modified Eagle’s Medium (DMEM), a 1:1 mixture of DMEM and Ham’s F-12 nutrient mixture (1:1 DMEM:F-12), fetal bovine serum (FBS), phosphate-buffered saline (PBS), sodium selenite (Na2SeO3), and sodium hydroxide (NaOH) were purchased from Sigma-Aldrich (St Louis, MO, USA). Antibiotic–antimycotic and trypsin were obtained from Thermo Fisher Scientific (Waltham, MA, USA). Glutathione (GSH) was bought from Alfa Aesar (Haverhill, MA, USA). (3-(4,5-Dimethylthiazol-2-yl)-5-(3-carboxymethoxyphenyl)-2-(4-sulfophenyl)-2-tetrazolium), otherwise known as MTS, was obtained from Promega Corporation (Fitchburg, WI, USA). Hydrocortisone was bought from MP Biomedicals (Santa Ana, CA, USA). All water used in the experiments was from a Millipore Milli-Q purifier (EMD Millipore, Billerica, MA, USA). This water was also autoclaved before use to ensure its sterility.
rSeNP preparation and characterization
Following procedures previously used, rSeNPs were generated by mixing together a 4:1 molar ratio of GSH and Na2SeO3 in microcentrifuge tubes obtained from Bio Plas (San Rafael, CA, USA). NaOH was added to the mixture to initiate the reaction, specifically in a 5:3 molar ratio of NaOH to GSH. In the most widely accepted mechanism of this procedure, the mixture of GSH and Na2SeO3 formed selenodiglutathione, which was in equilibrium with glutathione disulfide (GSSG) and elemental selenium. The addition of the NaOH pushed this equilibrium toward elemental selenium nucleation.30,32 The products were then centrifuged in a microcentrifuge (Thermo Fisher Scientific) for 5 minutes at 6,000 rpm, and the supernatant was subsequently pipetted and replaced with deionized water. The solutions in the Eppendorf tubes were then transferred to a conical tube and lyophilized using a Labconco FreeZone 2.5 Plus (Labconco Corporation, Kansas City, MO, USA). Using mass measurements of the conical tube taken when it was originally empty, and the mass of the conical tube and the particles after lyophilization, the mass of the selenium nanoparticles was calculated, from which the volume of autoclaved, deionized water required for the desired dilution was determined. The desired suspension concentration was 1,000 μg rSeNP/mL H2O.
Scanning electron microscopy (SEM) images of the nanoparticles were generated using a Hitachi S-4800 field emission scanning electron microscope (Hitachi Ltd., Tokyo, Japan). Zeta potential analysis was performed using a Brookhaven Instruments Corporation 90Plus PALS Particle Size Analyzer (Brookhaven Instruments Corporation, Holtsville, NY, USA). In preparation for this analysis, a small amount of the rSeNP suspension was aliquoted and diluted to one-third of its original concentration using PBS, resulting in a solution concentration of 333.3 μg rSeNP/mL H2O. This dilution was necessary in order to add ions into the suspension, specifically Na+, K+, Cl−, and PO43−, which become either attracted to or repulsed by the nanoparticles, allowing for an accurate potential reading to be obtained. The sample was analyzed five times. A K-Alpha X-ray photoelectron spectrometer (Thermo Fisher Scientific) was used to determine the chemical composition and bonding states of the nanoparticles.
Cell culture
A HNSCC cell line (SCC-9) was purchased from American Type Culture Collection (ATCC) (CRL-1629; Manassas, VA, USA). The cells used in this study were transformed cells and, thus, review board approval was not required. HDFs were acquired from Lonza (CC-2509; Basel, Switzerland). Cell passage numbers used were between 3 and 12. HDF cells were cultured in DMEM supplemented with 10% (v/v) FBS and a 1% (v/v) antibiotic–antimycotic solution. HNSCC cells were cultured in 1:1 DMEM:F-12 supplemented with 10% (v/v) FBS, 1% (v/v) antibiotic–antimycotic solution, and 400 ng/mL of hydrocortisone. Each cell line was cultured in T75 flasks from Sigma-Aldrich and incubated at 37°C in a humidified atmosphere of 95% air and 5% carbon dioxide.
Cell viability assay with rSeNP treatment
Once confluence was achieved in a T75 flask, cultures were trypsinized to relocate them into conical tubes. After adding media to neutralize the trypsin, they were centrifuged at 160× g for 5 minutes. Using a cell hemocytometer, media was used to produce a cell concentration of 50,000 cells/mL. The solution was then transferred to three tissue-culture 96-well plates at 100 μL/well, 5,000 cells/well, with one eight-well column of each plate left empty as a negative control, and incubated for 1 day. After 24 hours of incubation, dilutions of the selenium nanoparticle suspension in the respective cell culture media were prepared. Nine concentrations were made, ranging from 0.01 to 100 μg rSeNP/mL media. After aspirating the previous day’s media from the plate, each dilution was added to eight wells, 100 μL/well, with the remaining 16 wells containing cells were left untreated as a positive control. Each 96-well plate was then incubated for different lengths of time, ranging from 24 to 72 hours.
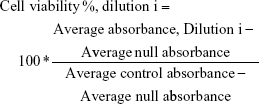
At the appropriate time, the rSeNP–media mixture was pipetted and replaced with 100 μL/well of a 5:1 volume ratio mixture of respective media and the MTS assay solution. This media–MTS mixture was added to all 96 wells of the plate. The plate was then incubated for 2 hours and 30 minutes to allow the MTS to react with live cells, producing a change in the solution’s color. Afterward, the wells were subjected to absorption spectroscopy, measured via a Molecular Devices SpectraMax M3 (Molecular Devices LLC, Sunnyvale, CA, USA), at an absorbance of 490 nm. From the absorbance data obtained, the cell viability was calculated using the following equation:
|
|
Cell number calibration and calculation
A cell number assay, repeated three times, was used to determine whether the selenium nanoparticles were killing the cells or merely slowing down or halting their proliferation. While the viability assays could give data on cell survival relative to the untreated positive control, they do not provide an absolute value for the number of viable cells present. This is necessary to know if cells are continuing to proliferate exponentially between time frames. Similar to what was done for the cell viability assays, the cell suspension was concentrated, and the cell concentration was determined via hemocytometry. The suspension was then diluted to 50,000 cells/mL media. Using this concentration as the starting point, a series of dilutions were made, ranging from 5 to 50,000 cells/mL media. The suspensions were then transferred to a 96-well plate at 100 μL/well. Each individual cell suspension dilution was alloted eight wells. One hundred microliters of the cells’ respective media was then added to the eight empty wells, creating a negative control. Maintaining the 5:1 volumetric ratio mixture of respective media and the MTS assay solution from the cell viability assays, 20 μL of MTS was then added to each of the occupied wells. The well plate was then incubated for 2 hours and 30 minutes. The wells were then subjected to absorption spectroscopy, measured via a Molecular Devices SpectraMax M3, at an absorbance of 490 nm.
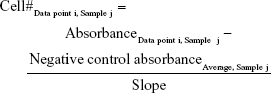
Calculating the average of the absorbance for a particular cell concentration for all three samples, absorbance was plotted as a function of cell concentration, producing a standard curve. Using a trend line in Microsoft Excel, the slope of the curve was determined by using the average absorbance of the negative control as the intercept. This value had the units of mL media/cells. This slope was then incorporated into the cell viability absorbance data as the divisor of the following equation, with the quotient having the units of cells/mL:
|
|
TEM fixation, thin-sectioning, and cell visualization
TEM was used to visualize the localization of the selenium nanoparticles in both the cell lines. In order to prepare the cells for imaging, each cell line was seeded into two wells of a 24-well plate, all of which had coverslips in them that the cells would attach to. After allowing 1 day for the cells to attach to the coverslips and proliferate, one well of each cell line was given a 100 μg/mL media dose of rSeNP, while the other well received fresh media. The well plate was allowed to incubate for 3 days. This choice of dosage and exposure time was meant to reflect the difference between untreated cells in their exponential growth phases and cells that were treated with the maximum dosage for the longest exposure time.
As a means of fixation, the coverslips and their deposited cells were removed from the wells and transferred to wells containing a solution of 0.1 M sodium cacodylate buffer (pH 7.2) and 2.5% (v/v) glutaraldehyde. These coverslips were stored in these wells at 4°C for 1 hour. They were then rinsed with 0.1 M sodium cacodylate at 4°C for 45 minutes, with the solution changed every 15 minutes. The coverslips were then subjected to postfixation, in which they were kept at room temperature in a solution of 0.1 M sodium cacodylate and 1.0% (v/v) osmium tetroxide for 1 hour. They were then rinsed via the method previously described.
With fixation of the cells complete, they were then dehydrated. The coverslips were stored at room temperature for 10 minutes in 30% (v/v) ethanol, after which they were transferred to 70% (v/v) ethanol for the same amount of time. This process continued systematically with 85% (v/v) and 95% (v/v) ethanol. Finally, they were kept in 100% (v/v) ethanol for 45 minutes, with the ethanol being replaced every 15 minutes.
The next step in the preparation involved infiltrating, embedding, and polymerizing the coverslips in resin. To that end, the coverslips were stored in a 1:1 mixture of Spurrs/Quetol resin and 100% ethanol for 30 minutes. They were then transferred to pure Spurrs/Quetol resin for 30 minutes. Finally, the coverslips were placed in fresh Spurrs/Quetol resin and stored in a polymerization oven for 24 hours. After allowing the samples to cure for another 24 hours, the samples were thin-sectioned and placed onto TEM grids. TEM images of the thin-sectioned cells were generated using a JEOL JEM-1010 microscope (JEOL Ltd, Tokyo, Japan).
During the imaging of the cells, it was necessary to stain the untreated cells to better visualize their organelles, particularly their mitochondria. Therefore, several grids for each cell line, treated and untreated, were stained using lead citrate ((C6H5O7)2Pb3·3H2O) and uranyl acetate (UO2(CH3COO)2·2H2O).
Statistical analysis
All viability and cell density assays were performed in triplicate, with the results expressed as the average ± standard error of the mean (StErM). Statistical analysis was performed using JMP statistical software (SAS Institute, Cary, NC, USA). Differences between two dosages or two incubation times were evaluated using two-tailed Student’s t-tests that assumed unequal variances. Differences at P<0.001 were considered statistically significant.
Results
rSeNP preparation and characterization
In this study, rSeNPs were successfully produced and characterized via microscopic and electrokinetic analysis. For a basis of comparison between allotropes, photographs were taken of samples of selenium nanoparticles at 1,000 μg/mL, both the as-synthesized red allotrope and after exposure to 50°C for 10 minutes (Figure 1). SEM images showed that the rSeNPs were relatively monodispersed (Figure 2A), with an average diameter of 123.5±33.6 nm (Figure 2B).
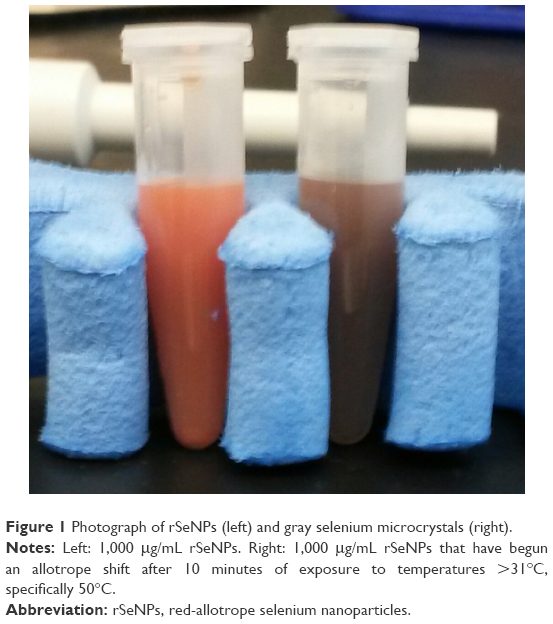 | Figure 1 Photograph of rSeNPs (left) and gray selenium microcrystals (right). |
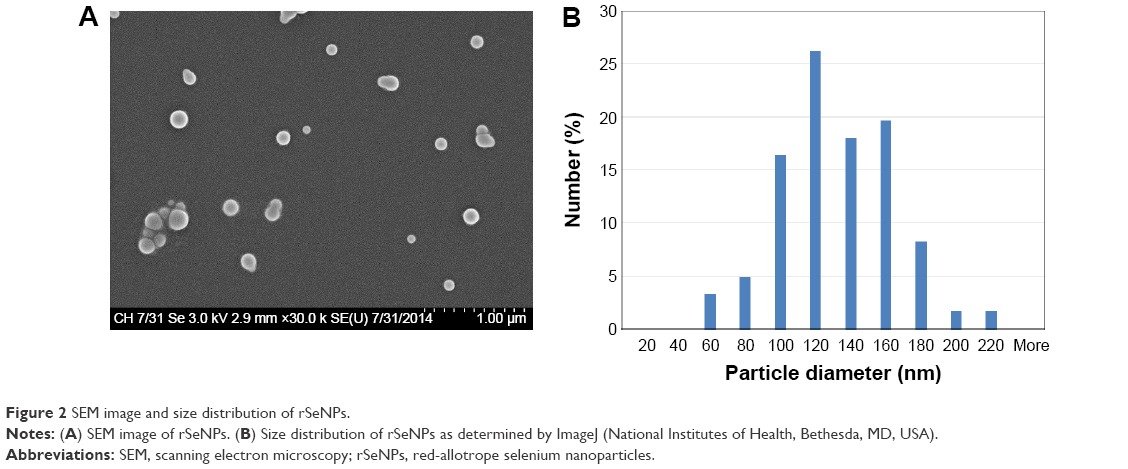 | Figure 2 SEM image and size distribution of rSeNPs. |
The zeta potential of the rSeNPs was determined to be −22.05±2.23 mV (StErM) (Figure 3). The magnitude of a suspension’s zeta potential is directly related to its colloidal stability, or the strength of the repulsion experienced between similarly charged particles within proximity of each other. The values obtained coincided with data found in previous studies regarding rSeNPs’ electrokinetic potential, which indicated that the suspension was relatively stable.42 In addition, as a means of cross-reference, casual observation of the suspension, undisturbed for a week, showed that few particles fell out of suspension, with such activity typically only occurring after half a month.
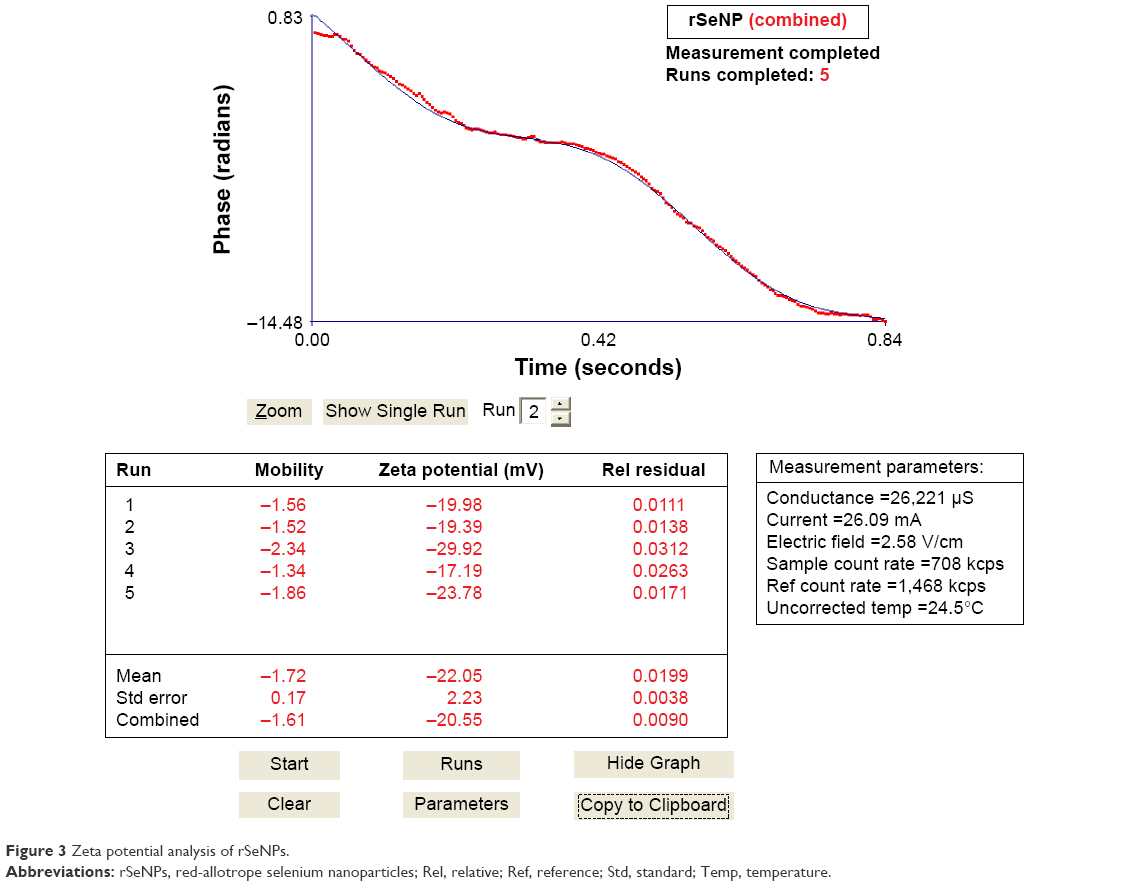 | Figure 3 Zeta potential analysis of rSeNPs. |
In preparation for characterization of the rSeNPs using X-ray photoelectron spectrometry (XPS), droplets of the suspension were deposited onto carbon tape and were allowed to dry. This was repeated multiple times to maximize coverage of the carbon tape, providing a large sample area. Results obtained (Figure 4A) indicated that there was elemental selenium present in the sample, at an atomic percentage (atoms of oxygen)/(total atoms) of 1.79. Closer examination of the selenium spike (Figure 4B) showed that it was well-defined against the background noise. The large carbon spike in the data can be ignored, as this is the background noise attributed to the carbon tape upon which the nanoparticles were deposited.
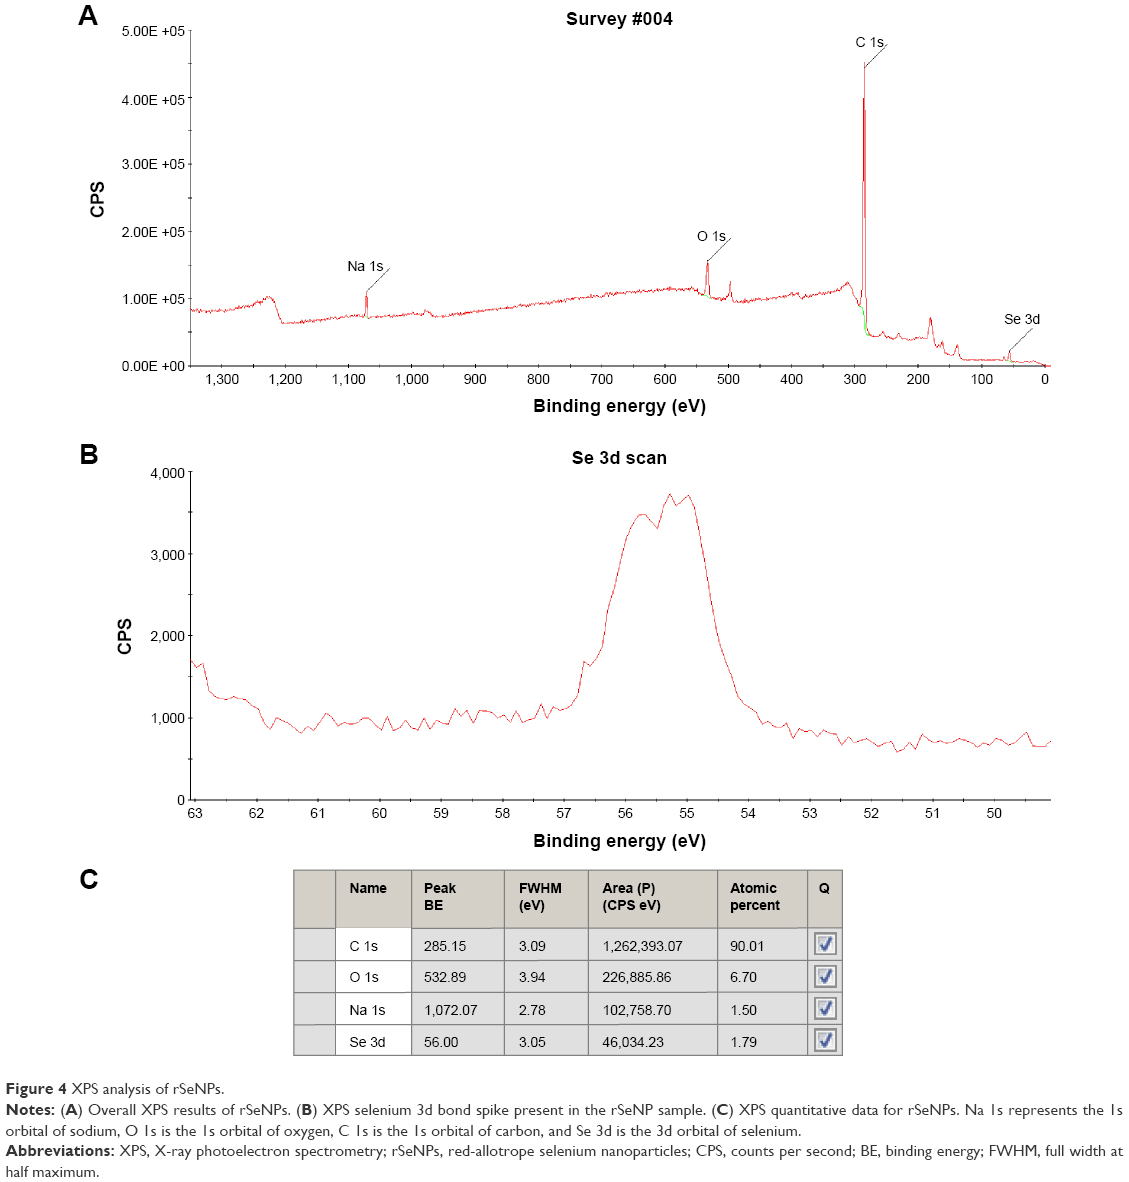 | Figure 4 XPS analysis of rSeNPs. |
What is of particular concern is the noticeable spike in sodium which, according to the computational data for the atomic percentages (Figure 4C), is almost equal to the selenium in terms of atoms present. Coupled with the relatively large oxygen spike, it is reasonable to assume that there was residual Na2SeO3 present in the suspension’s aqueous phase. This is indicative of Na2SeO3 being in excess during the nanoparticle nucleation reaction, as the lack of a sulfur spike indicates that there is no residual GSH present. These anomalies seem to indicate that additional studies to purify rSeNPs are necessary to maximize purity.
This does not, however, account for the oxygen atomic percentage, 6.7%, being so high in comparison to that of sodium, 1.5%. Na2SeO3 has two sodium atoms for every three oxygen atoms, so an oxygen atomic percentage of 2.25 would be enough for the remaining sodium to be present in the form of Na2SeO3. The likely cause for this anomaly may be environmental contamination from ambient water vapor in the air, as it was quite humid on the day that the sample was transported for XPS analysis. Future experiments will be needed under more controlled conditions to confirm this assumption.
In vitro anticancer effect of rSeNPs
The in vitro anticancer activity of rSeNP against HNSCC was evaluated through the utilization of MTS assays. Any possible absorbance interference from the rSeNPs was considered negligible, as the majority of the suspension was pipetted out of the wells in preparation for the MTS incubation stage. The results indicated that rSeNP inhibited the growth of the cancer cells which was dependent on both dosage and exposure time (Figure 5A). For exposure times as high as 2 days, cell viability remained relatively high except at the maximum dosage of 100 μg rSeNP/mL media. Using linear regression of the data points for the three highest dosages for a 2-day incubation period, the inhibitory concentration (IC50) for a 2-day incubation period was calculated to be 91.60 μg rSeNP/mL media. However, for a 3-day exposure to the selenium nanoparticles, a noticeable drop in cell viability occurred even at moderate dosages, while the maximum dosage caused only 13.70% of the cells to remain viable. A logarithmic regression of the data points for the five highest dosages was performed, determining that the IC50 value for a 3-day exposure was 19.22 μg rSeNP/mL media.
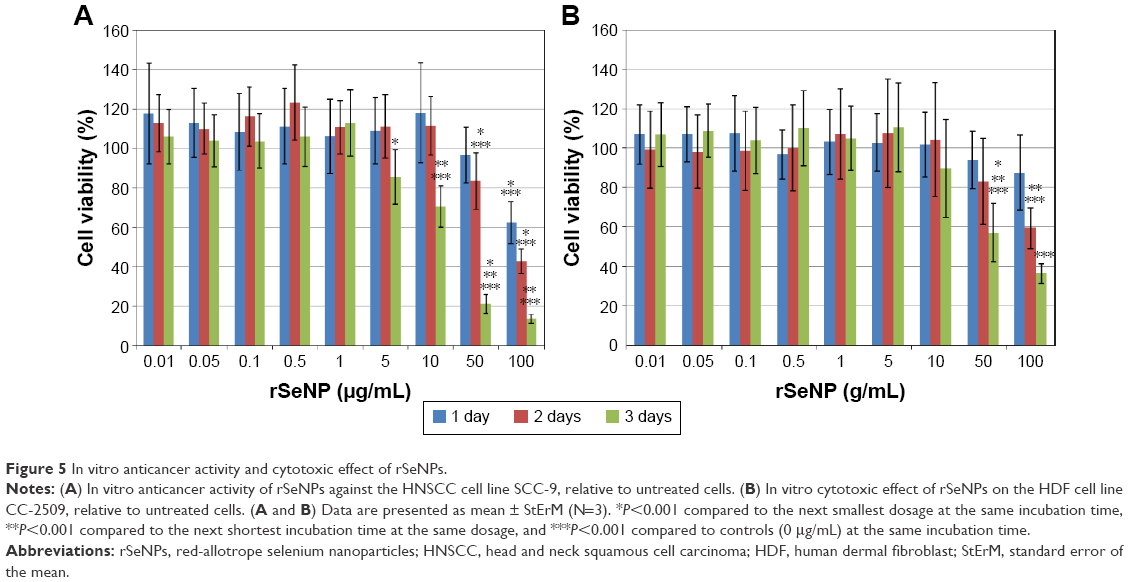 | Figure 5 In vitro anticancer activity and cytotoxic effect of rSeNPs. |
The effect of selenium nanoparticles on HDF viability was tested in the exact same manner as HNSCC (Figure 5B). For 1- and 2-day incubation periods, at no dosage did the cell viability fall <50%. For a 3-day incubation period, a logarithmic regression of the data points for the four highest dosages showed that the IC50 value was 59.61 μg rSeNP/mL media. The fact that this value is considerably higher than that of its cancer cell counterpart indicates that rSeNP had a cytotoxic effect on HNSCC approximately three times stronger than on HDFs.
An analysis of the cell number data for HNSCC (Figure 6A) showed that during the first 2 days of incubation, at least some portion of the cells continued to replicate. By the third day, however, the replication rate decelerated due to scarce nutrients in the media. Additionally, at concentrations >1 μg rSeNP/mL media, the nanoparticles began to induce a cytotoxic effect. This is indicated by dropping cell numbers, both between the second and third days and for subsequently greater rSeNP doses. It should be noted that for doses <5 μg rSeNP/mL media, the presence of rSeNP appeared to promote cell proliferation in comparison to the positive control. A similar phenomenon can be observed with the cell number data for HDFs (Figure 6B), although the concentration at which the nanoparticles went from being beneficial to cytotoxic was significantly higher, between 5 and 10 μg rSeNP/mL media. Additionally, the magnitude of the decrease in cell density from the positive control to the maximum dosage was less significant.
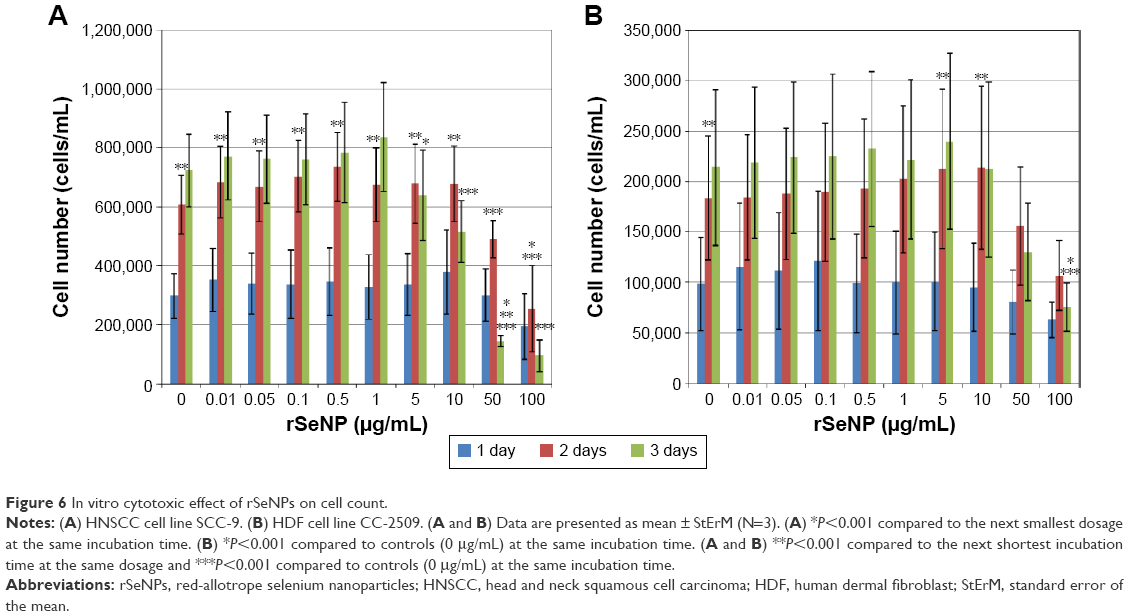 | Figure 6 In vitro cytotoxic effect of rSeNPs on cell count. |
rSeNP localization
For the TEM imaging of the cells, it was found that the rSeNPs were significantly more noticeable on the unstained grids, while those that were stained offered greater contrast of the organelles within the cells. Because of this, it should be noted that for the images (Figure 7A–D) provided in this paper, those showing untreated cells have been stained, while those with cells that were exposed to rSeNP have not been stained. In Figure 7A, which shows an enlarged image of untreated HNSCC organelles, numerous mitochondria can be seen, often appearing as dark, highly elongated ovals with fine stripes, although their shapes can vary significantly depending on their orientation and position relative to the location and angle at which the sample was thin-sectioned. Also present in significant quantity are lysosomes, appearing as black circles in the TEM image. When compared with the image of an HNSCC cell that had been treated for 3 days with 100 μg/mL media of rSeNP (Figure 7B), the most noticeable difference appeared to be the presence of bright white dots in Figure 7B, each on the order of 10–50 nm in diameter. These white dots appeared to be unevenly dispersed throughout the cytoplasm, typically congregating around the lysosomes and mitochondria in the cell. Similar results can be seen in the TEM images of untreated and treated HDF cells (Figure 7C and D, respectively). In particular, white dots can clearly be seen in the cytoplasm of the treated HDF cells, as well as in a residual body on the order of a micron in diameter, which is approximately the size of a lysosome. In previous studies, fluorescent microscopy images of selenium nanoparticles functionalized with polyethylene glycol in hepatocellular carcinoma cells revealed that they were initially taken up by lysosomes.33 If this is also the case for the HNSCC and HDF cells, then the lysosomal acidic environment could degrade the selenium nanoparticles, causing a decrease in their size. TEM images of isolated selenium nanoparticles will be necessary to determine if these white dots are what they appear to be. Should this assumption concerning white dots serving as selenium nanoparticles be correct, their positioning within the cells could explain this decrease in size.
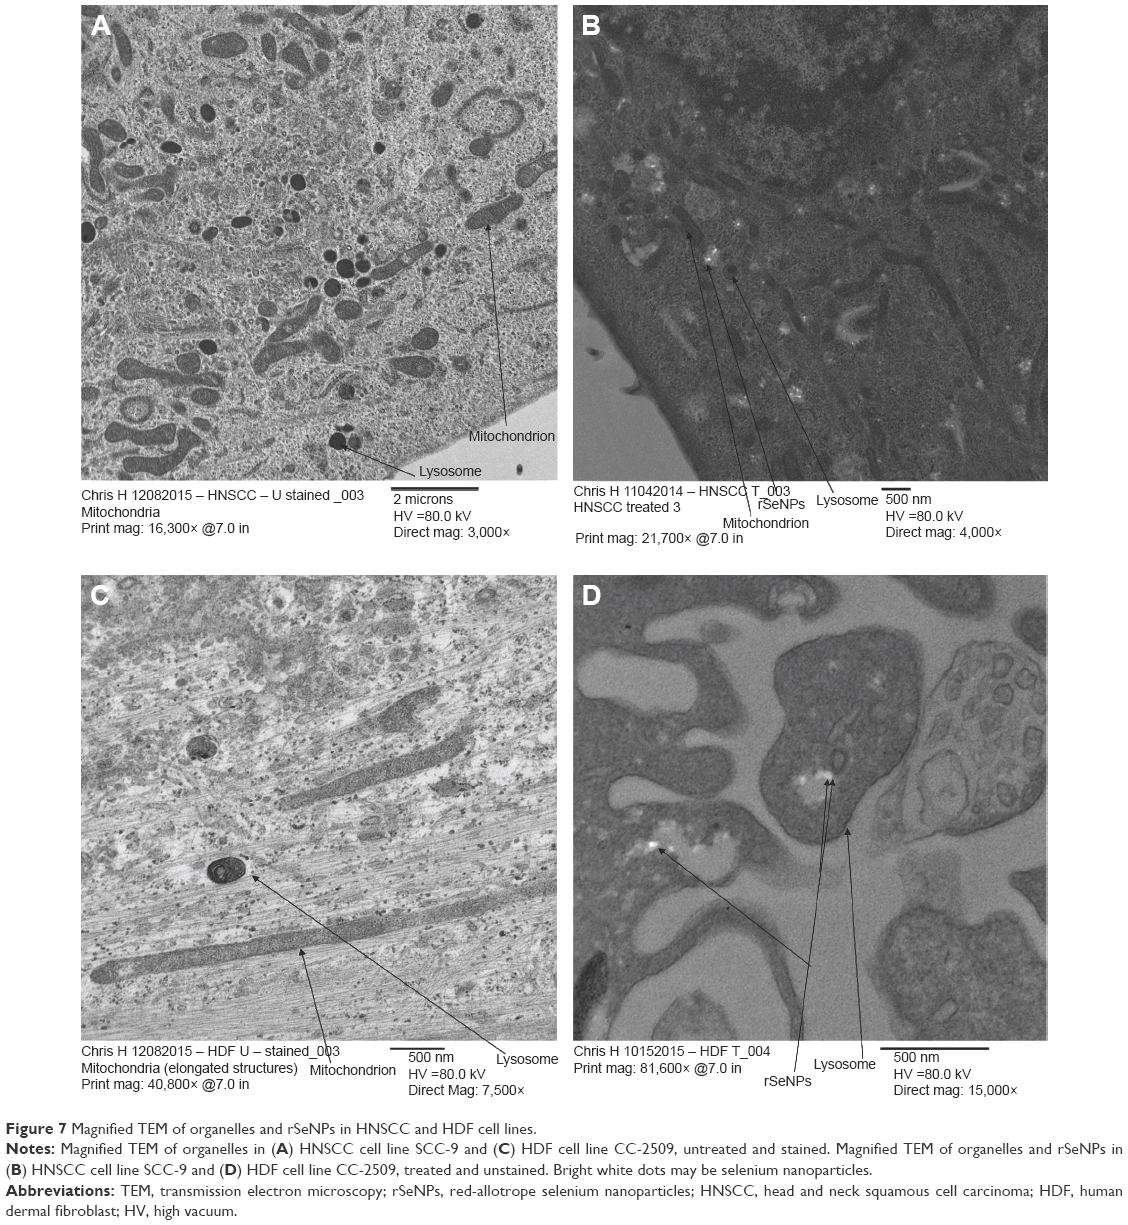 | Figure 7 Magnified TEM of organelles and rSeNPs in HNSCC and HDF cell lines. |
Additionally, less-magnified images for each of the four categories were recorded to showcase the overall structure of the cells (Figure 8A–D). Comparing Figure 8A and B, it is clear that the HNSCC cell in Figure 8B exhibited several of the signs of apoptosis: significant condensation of the nuclear material and the formation of residual bodies. As for Figure 8C and D, it would appear that the HDF cell in Figure 8D was undergoing apoptosis when it suddenly underwent necrosis. It has numerous residual bodies, several of which were enlarged in Figure 7D, but there is a readily noticeable rupture of its cell membrane, a key indicator of necrosis. Of course, more studies would be needed to verify these different modes of cell death.
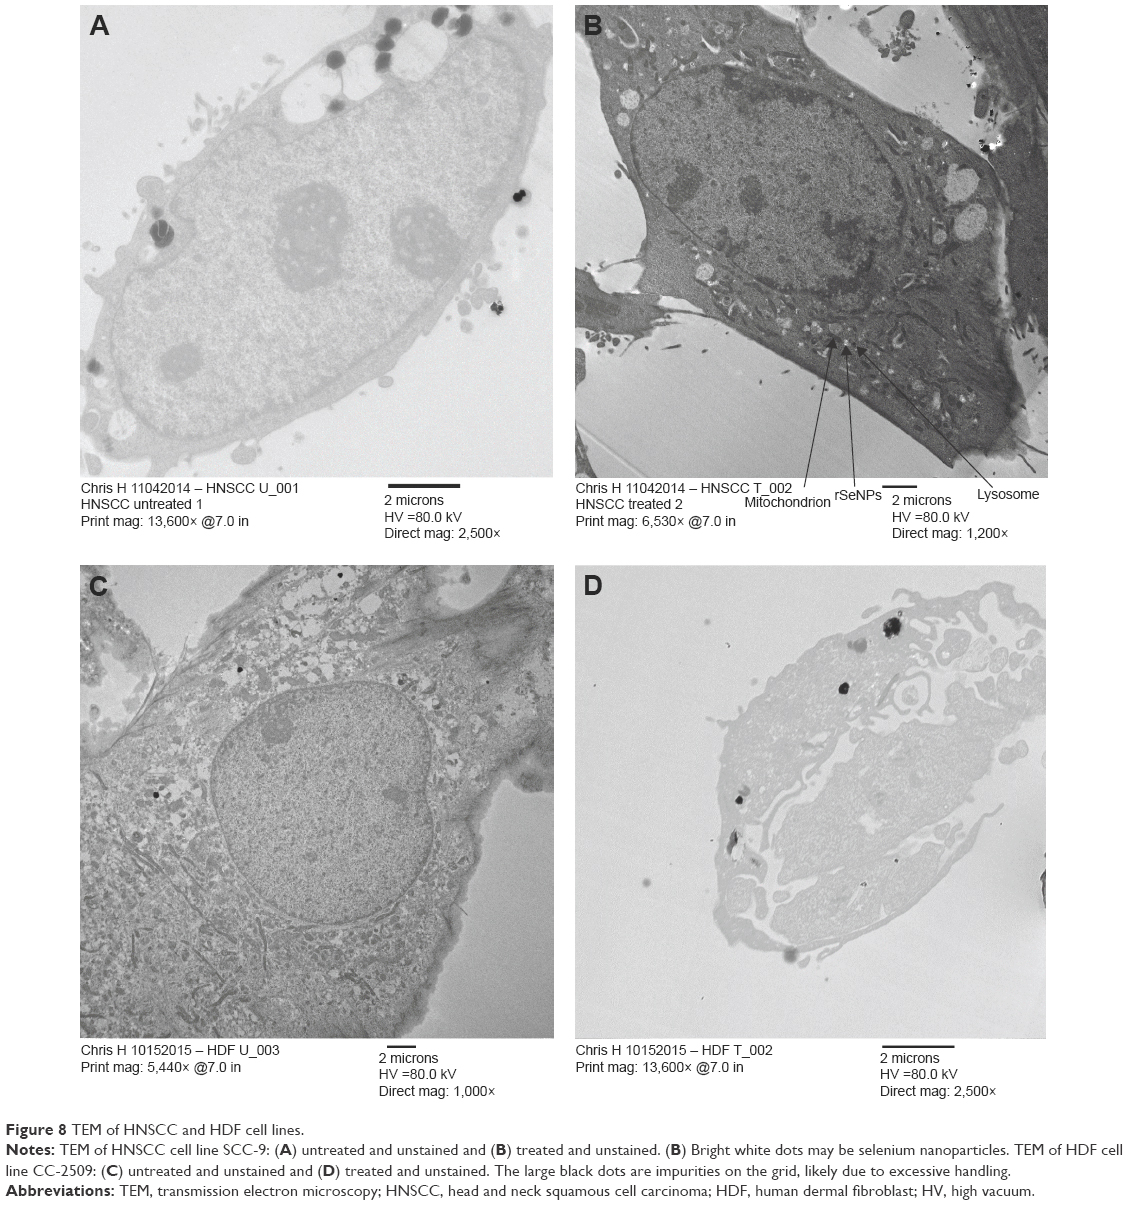 | Figure 8 TEM of HNSCC and HDF cell lines. |
Discussion
The MTS assays established for the first time in this study that rSeNPs were able to preferentially kill HNSCC cells versus control healthy fibroblasts. It was therefore necessary to determine a dosage range over which the nanoparticles could treat cancer cells and leave the surrounding healthy fibroblasts relatively unharmed. Considering the 3-day incubation IC50 values for HNSCC and HDFs, it is logical to assume that the optimal dosage for treating a mixture of both cancerous squamous and healthy fibroblast cells is between 20 and 55 μg rSeNP/mL media. In order to cross-reference the results of the MTS viability and cell density assays, additional experiments should be performed using alternative reagents. Confocal microscopy should be used to analyze the cells’ morphology and cytoskeleton, both before and after exposure to rSeNPs, to determine the health of the cells. Live/dead assays should be used to differentiate living and dead cells.
A cell number analysis of the absorption data from the viability assays corroborates with the evidence found in the viability assay results that, at concentrations <5 μg rSeNP/mL media, the rSeNPs provide a beneficial effect to both cell lines. This may be a cause of concern in terms of the nanoparticles’ future applicability as a treatment method for HNSCC. As they are gradually filtered out of the body by the reticuloendothelial system, the concentration of rSeNPs in the body would eventually fall to a point where they may begin to promote cell proliferation. If there are still cancer cells alive in the tumor, this could lead to an adverse rise in their numbers. Further analysis of cell viability at these lower concentrations will be needed to analyze this possible setback.
The rather significant presence of Na2SeO3 in the rSeNP suspension, while an indicator that further purification would be required in batches of rSeNP produced in the future, may have contributed to the cytotoxic effect of the treatment. HNSCCs have increased production of GSH, which is capable of neutralizing reactive oxygen species via conversion to GSSG. The cells then replenish their supply of GSH via a redox reaction of GSSG with nicotinamide adenine dinucleotide phosphate (NADPH), catalyzed by GSH reductase.43 In studies conducted on ovarian cancer, GSH depletion was found to increase the drug sensitivity in cells.44 The addition of Na2SeO3 to the cells would likely cause a reaction to occur with the GSH present, forming the previously described equilibrium system. If the slightly alkaline environment of the cell cytosol (pH 7.2) is enough to push the equilibrium toward nanoparticle nucleation,45 this could possibly lead to an increase in the amount of GSSG present in the cells. This would mean additional NADPH would be needed to convert it back to GSH so as to continue neutralizing the reactive oxygen species resulting from normal metabolic operations. Additionally, thioredoxin, another antioxidant, is also present in increased concentrations in HNSCC cells.43 Studies have shown that elemental selenium can lead to an increase in the activity of thioredoxin reductase, further inhibiting antioxidant activity.46 Thus, the presence of Na2SeO3 in the rSeNP suspension could potentially lead to increased elemental selenium concentration and metabolic regulatory strain on the cell. As for the HDFs, studies have shown that drops in intracellular GSH concentration can increase their susceptibility to atmospheric oxygen tension, leading to oxidative stress. This can lead to aging of the cell, possibly even cell death.47
Comparing the TEM images that were recorded for untreated and treated HNSCC and HDF cell lines, it would appear that the nanoparticles are taken up by the treated cells. It is hypothesized that these nanoparticles are the small white dots in Figure 7B and D. These small white dots, after 3 days of incubation, end up localized in the cytoplasm near mitochondria and lysosomes. Additionally, Figure 7D shows that these white dots may, at some point, actually enter the lysosomes. Using fluorescence microscopy, Zheng et al determined that the nanoparticles are initially localized in the lysosomes of hepatocellular carcinoma cells before diffusing into the cellular cytoplasm.33 In order to confirm that this is also the case for HNSCC, as well as to cross-reference the TEM images that were obtained in this study, similar methods will be needed in the future to simultaneously mark the locations of both the lysosomes and the rSeNPs during the initial uptake of the particles, likely 1 hour after introducing the selenium nanoparticles to the cells. The possibility that the white dots are actually cytoskeletal filaments, which tend to have diameters between 8 and 25 nm, will also need to be considered in future experiments.
Previous studies have found that selenium nanoparticles, when functionalized with polyethylene glycol, induce apoptosis in liver cancer cells by disrupting the mitochondrial membrane potential (ΔΨm).33 This destabilization results in the release of apoptogenic factors.48 Once these signals have been released, apoptosis soon occurs, during which the cell shrinks, the cytoplasm and nucleus condense, and the DNA in the cell fragments. It is theorized that this same mechanism occurs in HNSCC cells that are exposed to rSeNPs. Further research will be needed to determine if this study’s theory is accurate. Methods similar to what was used by Zheng et al to determine the mechanism by which selenium nanoparticles functionalized with polyethylene glycol induce apoptosis in hepatocellular carcinoma need to be conducted. Using laser scanning cytometry, it will be possible to measure the proportions of the stages of the cell cycle so as to determine whether apoptosis or necrosis is occurring among the populations, and if both are present, in what ratio. Measurements will be taken to determine the superoxide anion concentrations in the cells, as an increase is a primary indicator of apoptosis. If apoptosis is found to be occurring, the mitochondrial membrane potential of the cells will also be analyzed to cross-reference data from the localization of the particles.33 In order to test for the presence of, and rSeNP influence on, androgen receptors on HNSCC cells, polymerase chain reaction analyses will be performed, along with luciferase assays.34
There also exists the possibility that the localization of the rSeNPs near the lysosomes and mitochondria may be signs of autophagy. In the TEM images that were taken of the treated cells, it has already been noted that the rSeNPs were endocytosed and localized near the lysosomes. These are potential indicators of autophagy. Autophagy is a process by which lysosomes break down and consume defective organelles and proteins. This is done by engulfing them in autophagosomes, which are double-membraned vesicles that are transported to the lysosomes.49 These autophagosomes often contain parts of mitochondria.50 Once there, an autophagosome fuses with the lysosome, forming an autolysosome, in which the contents and inner membrane of the autophagosome are degraded. This process typically occurs in low levels, while the cell is in normal, nutrient-rich environments. It is only during high-stress scenarios that this activity increases dramatically. This can often result in an accumulation of autophagosomes.49 Should this process last for extended periods of time, cell death due to overwhelming turnover of proteins and organelles may result.51
Studies with gold, iron oxide, and rare-earth oxide nanoparticles have already shown that cellular uptake, vacuolization, and subsequent autophagosome accumulation can be affected by nanoparticle size and dispersity. The trend that has been found is that larger, less-dispersed nanoparticles are more rapidly endocytosed and vacuolized.49,50,52 With the relatively large size and low dispersity of the rSeNPs, along with the markedly increased cytotoxicity after 3 days of incubation, autophagy is a process that should be analyzed as a possible mechanism of selenium-induced cell death in future studies. One common way of analyzing this is through the use of Western blot analysis, specifically for microtubule-associated light chain 3 (LC3) and its autophagy-induced conjugated form, phosphatidylethanolamine-conjugated LC3 (LC3-II). During autophagy, LC3 is conjugated into LC3-II, and then incorporated into the autophagosome membrane.49
Nonetheless, this present study provides significant promise for the use of selenium for HNSCC treatment and its continued study.
Conclusion
In the current study, monodispersed rSeNPs were successfully fabricated and used in cell viability tests on HNSCC and HDF cell lines. Results indicated for the first time that rSeNPs may be a potential candidate for treating HNSCC. The IC50 values of HNSCC and HDFs were determined to be 19.22 and 59.61 μg rSeNP/mL media, respectively. This difference creates an effective range of concentrations over which it may be possible to treat HNSCC. Cell density analysis showed that the rSeNPs promote the proliferation of HNSCC at concentrations <5 μg rSeNP/mL. Conversely, the nanoparticles have their greatest cytotoxic effect when present in the cells for 3 days at concentrations of at least 50 μg rSeNP/mL. Images that were produced via TEM indicated that selenium nanoparticles are localized in the cellular cytoplasm near the lysosomes and mitochondria. The end result of a cytotoxic dose to the cells was found to be the induction of apoptosis for HNSCC, occasionally accompanied with necrosis for HDFs.
Acknowledgments
This research was funded by Northeastern University. Special considerations are given to Michelle Stolzoff of Northeastern University’s Nanomedicine Lab for her guidance in laboratory procedures, Nicole Bassous of Northeastern University’s Nanomedicine Lab for her assistance in completing labor-intensive viability assays, Dr Greg Lin of Harvard University’s Center for Nanoscale Systems for access to his X-ray photoelectron spectrometer, William Fowle of Northeastern University’s Biology Department for his expertise with SEM and TEM, and Blair Germain of the New England College of Optometry for providing the JMP statistical software.
Disclosure
The authors report no conflicts of interest in this work.
References
Stewart BW, Kleihues P. World Cancer Report. Lyon: International Agency for Research on Cancer; 2003:232–236. | ||
Carvalho AP, Nishimoto IN, Califano JA, Kowalski KP. Trend in incidence and prognosis for head and neck cancer in the United States: a site-specific analysis of the SEER database. Int J Cancer. 2004;114:806–816. | ||
Koch WM, Brennan JA, Marianna Zahurak, et al. p53 mutation and locoregional treatment failure in head and neck squamous cell carcinoma. J Natl Cancer Inst. 1996;88(21):1580–1586. | ||
Shrotriya S, Agarwal R, Sclafani RA. Biological basis of alcohol-induced cancer – a perspective on chemoprevention by resveratrol in head and neck squamous cell carcinoma. Adv Exp Med Biol. 2015;815:333–348. | ||
Yoo GH, Moon J, LeBlanc M, et al. A Phase 2 Trial of Surgery with Perioperative INGN 201 (Ad5CMV-p53) Gene Therapy Followed by Chemoradiotherapy for Advanced, Resectable Squamous Cell Carcinoma of the Oral Cavity, Oropharynx, Hypopharynx, and Larynx. Arch Otolaryngol Head Neck Surg. 2009;135(9):869–874. | ||
Forastiere A, Koch W, Trotti A, Sidransky D. Head and neck cancer. N Engl J Med. 2001;345:1890–1900. | ||
Williams HK. Molecular pathogenesis of oral squamous carcinoma. Mol Pathol. 2000;53(4):165–172. | ||
Herrero R. Human papillomavirus and cancer of the upper aerodigestive tract. J Natl Cancer Inst Monogr. 2003;(31):47–51. | ||
Mork J, Lie K, Glattre E, et al. Human papillomavirus infection as a risk factor for squamous-cell carcinoma of the head and neck. N Engl J Med. 2001;344(15):1125–1131. | ||
Gillison ML, Koch WM, Capone RB, et al. Evidence for a causal association between human papillomavirus and a subset of head and neck cancers. J Natl Cancer Inst. 2000;92(9):709–720. | ||
Perez-Ordonez B, Beauchemin M, Jordan RCK. Molecular biology of squamous cell carcinoma of the head and neck. J Clin Pathol. 2006;59:445–453. | ||
Reed AL, Califano J, Cairns P, et al. High frequency of p16 (CDKN2/MTS-1/INK4A) inactivation in head and neck squamous cell carcinoma. Cancer Res. 1996;56:3630–3633. | ||
Clarke AR, Purdie CA, Harrison DJ, et al. Thymocyte apoptosis induced by p53-dependent and independent pathways. Nature. 1993;362:849–852. | ||
Yonish-Rouach E, Resnftzky D, Lotem J, Sachs L, Kimchi A, Oren M. Wild-type p53 induces apoptosis of myeloid leukaemic cells that is inhibited by interleukin-6. Nature. 1991;352:345–347. | ||
Lowe SW, Bodie S, McClatchey A, et al. p53 status and the efficacy of cancer therapy in vivo. Science. 1994;266(5186):807–810. | ||
Lee JM, Bernstein A. p53 mutations increase resistance to ionizing radiation. Proc Natl Acad Sci U S A. 1993;90:5742–5746. | ||
Wynford-Thomas D. p53 in tumor pathology: can we trust immunocytochemistry? J Pathol. 1992;166(4):329–330. | ||
Hall PA, Lane DP. p53 in tumor pathology: can we trust immunocytochemistry? – revisited! J Pathol. 1994;172(1):1–4. | ||
Smith TAG, Mehaffey MG, Kayda DB, et al. Adenovirus mediated expression of therapeutic plasma levels of human factor IX in mice. Nat Genet. 1993;5:397–402. | ||
Setoguchi Y, Jaffe HA, Chu CS, Crystal RG. Intraperitoneal in vivo gene therapy to deliver alpha 1-antitrypsin to the systemic circulation. Am J Respir Cell Mol Biol. 1994;10(4):369–377. | ||
Pirollo KF, Hao Z, Rait A, et al. p53 mediated sensitization of squamous cell carcinoma of the head and neck to radiotherapy. Oncogene. 1997;14:1735–1746. | ||
O’Donnell RK, Kupferman M, Wei SJ, et al. Gene expression signature predicts lymphatic metastasis in squamous cell carcinoma of the oral cavity. Oncogene. 2005;24:1244–1251. | ||
Roepman P, Wessels LFA, Kettelarij N, et al. An expression profile for diagnosis of lymph node metastases from primary head and neck squamous cell carcinomas. Nat Genet. 2005;37:182–186. | ||
Shuming N, Xing Y, Kim GJ, Simons JW. Nanotechnology applications in cancer. Annu Rev Biomed Eng. 2007;9:257–288. | ||
Zheng JS, Zheng SY, Zhang YB, et al. Sialic acid surface decoration enhances cellular uptake and apoptosis-inducing activity of selenium nanoparticles. Colloids Surf B Biointerfaces. 2011;83(1):183–187. | ||
Wang Q, Webster TJ. Short communication: inhibiting biofilm formation on paper towels through the use of selenium nanoparticles coatings. Int J Nanomedicine. 2013;8:407–411. | ||
Tran PA, Webster TJ. Selenium nanoparticles inhibit Staphylococcus aureus growth. Int J Nanomedicine. 2011;6:1553–1558. | ||
Nel A, Xia T, Madler L, Li N. Toxic potential of materials at the nanolevel. Science. 2006;311(5761):622–627. | ||
Sinha R, El-Bayoumy K. Apoptosis is a critical cellular event in cancer chemoprevention and chemotherapy by selenium compounds. Curr Cancer Drug Targets. 2004;4(1):13–28. | ||
Ramos JF, Webster TJ. Cytotoxicity of selenium nanoparticles in rat dermal fibroblasts. Int J Nanomedicine. 2012;7:3907–3914. | ||
Navarro-Alarcon M, Cabrera-Vique C. Selenium in food and the human body: a review. Sci Total Environ. 2008;400:115–141. | ||
Tran PA, Sarin L, Hurt RH, Webster TJ. Differential effects of nanoselenium doping on health and cancerous osteoblasts in coculture on titanium. Int J Nanomedicine. 2010;5:351–358. | ||
Zheng S, Li X, Zhang Y, et al. PEG-nanolized ultrasmall selenium nanoparticles overcome drug resistance in hepatocellular carcinoma HepG2 cells through induction of mitochondria dysfunction. Int J Nanomedicine. 2012;7:3939–3949. | ||
Kong L, Yuan Q, Zhu H, et al. The suppression of prostate LNCaP cancer cells growth by selenium nanoparticles through Akt/Mdm2/AR controlled apoptosis. Biomaterials. 2011;32:6515–6522. | ||
Wang H, Zhang J, Yu H. Elemental selenium at nano size possesses lower toxicity without compromising the fundamental effect on selenoenzymes: comparison with selenomethionine in mice. Free Radic Biol Med. 2007;42:1524–1533. | ||
Zhang JS, Gao XY, Zhang LD, Bao YP. Biological effects of a nano red elemental selenium. Biofactors. 2001;15:27–38. | ||
Zhang J, Wang X, Xu T. Elemental selenium at nano size (nano-Se) as a potential chemopreventive agent with reduced risk of selenium toxicity: comparison with Se-methylselenocysteine in mice. Toxicol Sci. 2008;101(1):22–31. | ||
Dong H, Quintilla A, Cemernjak M, et al. Colloidally stable selenium@copper selenide core@shell nanoparticles as selenium source for manufacturing of copper-indium-selenide solar cells. J Colloid Interface Sci. 2014;415:103–110. | ||
Knop K, Hoogenboom R, Fischer D, Schubert US. Poly(ethylene glycol) in drug delivery: pros and cons as well as potential alternatives. Angew Chem Int Ed. 2010;49:6288–6308. | ||
Saba TM. Physiology and physiopathology of the reticuloendothelial system. Arch Intern Med. 1970;126(6):1031–1052. | ||
Jokerst JV, Lobovkina T, Zare RN, Gambhir SS. Nanoparticle PEGylation for imaging and therapy. Nanomedicine (Lond). 2011;6(4):715–728. | ||
Yu B, Zhang Y, Zheng W, Fan C, Chen T. Positive surface charge enhances selective cellular uptake and anticancer efficacy of selenium nanoparticles. Inorg Chem. 2012;51:8956–8963. | ||
Sobhakumari A, Love-Homan L, Fletcher EVM, et al. Susceptibility of human head and neck cancer cells to combined inhibition of glutathione and thioredoxin metabolism. PLoS One. 2012;7(10):e48175–e48184. | ||
Caffrey P, Frenkel G. Selenite cytotoxicity in drug resistant and nonresistant human ovarian tumor cells. Cancer Res. 1992;52:4812–4816. | ||
Orij R, Postmus J, Beek A, et al. In vivo measurement of cytosolic and mitochondrial pH using a pH-sensitive GFP derivative in Saccharomyces cerevisiae reveals a relation between intracellular pH and growth. Microbiology. 2009;155:268–278. | ||
Powis G, Gasdaska JR, Gasdaska PY, et al. Selenium and the thioredoxin redox system: effects on cell growth and death. Oncol Res. 1997;9(6–7):303–312. | ||
Alaluf S, Muir-Howie H, Hu HL, et al. Atmospheric oxygen accelerates the induction of a post-mitotic phenotype in human dermal fibroblasts: the key protective role of glutathione. Differentiation. 2000;66:147–155. | ||
Kim R. Recent advances in understanding the cell death pathways activated by anticancer therapy. Cancer. 2005;103(8):1551–1560. | ||
Ma X, Wu Y, Jin S, et al. Gold nanoparticles induce autophagosome accumulation through size-dependent nanoparticle uptake and lysosome impairment. ACS Nano. 2011;5(11):8629–8639. | ||
Zhang Y, Yu C, Huang G, et al. Nano rare-earth oxides induced size-dependent vacuolization: an independent pathway from autophagy. Int J Nanomedicine. 2010;5:601–609. | ||
Yang ZJ, Chee CE, Huang S, Sinicrope FA. The role of autophagy in cancer: therapeutic implications. Mol Cancer Ther. 2011;10(9):1533–1541. | ||
Huang D, Zhou H, Gao J. Nanoparticles modulate autophagic effect in a dispersity-dependent manner. Sci Rep. 2015;5:14361. |
 © 2016 The Author(s). This work is published and licensed by Dove Medical Press Limited. The full terms of this license are available at https://www.dovepress.com/terms.php and incorporate the Creative Commons Attribution - Non Commercial (unported, v3.0) License.
By accessing the work you hereby accept the Terms. Non-commercial uses of the work are permitted without any further permission from Dove Medical Press Limited, provided the work is properly attributed. For permission for commercial use of this work, please see paragraphs 4.2 and 5 of our Terms.
© 2016 The Author(s). This work is published and licensed by Dove Medical Press Limited. The full terms of this license are available at https://www.dovepress.com/terms.php and incorporate the Creative Commons Attribution - Non Commercial (unported, v3.0) License.
By accessing the work you hereby accept the Terms. Non-commercial uses of the work are permitted without any further permission from Dove Medical Press Limited, provided the work is properly attributed. For permission for commercial use of this work, please see paragraphs 4.2 and 5 of our Terms.