")
Back to Journals » Psychology Research and Behavior Management » Volume 15
The Effect of Presentation Characteristics of “Quantified Self” Data on Consumers’ Continuance Participation Intention: An Empirical Study Based on Health-Related Apps
Received 8 July 2022
Accepted for publication 21 September 2022
Published 4 October 2022 Volume 2022:15 Pages 2859—2877
DOI https://doi.org/10.2147/PRBM.S381705
Checked for plagiarism Yes
Review by Single anonymous peer review
Peer reviewer comments 2
Editor who approved publication: Dr Igor Elman
Xiaowei Fan, Jun Fan, Jianglu Li
School of Business Administration, Zhejiang Gongshang University, Hangzhou, People’s Republic of China
Correspondence: Jun Fan, School of Business Administration, Zhejiang Gongshang University, 18 Xuezheng Street, Xiasha Higher Education District, Hangzhou, 310018, People’s Republic of China, Email [email protected]
Purpose: The COVID-19 pandemic has greatly influenced the health and lifestyles of individuals. Increasing numbers of consumers now participate in quantified self (QS) process to learn more about their health-related behaviors. Understanding how to increase consumers’ QS continuance participation intention is critical. Drawing on Social Cognitive Theory and Self-Construal Theory, this study investigates how the presentation characteristics of QS data and consumers’ self-construal can influence their continuance participation intention during QS process.
Methods: Three between-subjects scenario simulation experiments were conducted to examine the influence mechanisms of the presentation mode and type of QS data and self-construal on consumers’ continuance participation intention.
Results: The study found: (1) the presentation mode (horizontal comparison vs vertical comparison) and type (descriptive vs analytic) of QS data had significant interaction effects on consumers’ continuance participation intention; (2) consumers’ self-construal (interdependent vs independent) and the presentation mode of QS data had obvious interaction effects on their continuance participation intention; and (3) consumers’ self-construal and the presentation type of QS data had interaction influences on their continuance participation intention.
Conclusion: This research combined Social Cognitive Theory and Self-Construal Theory to analyze the influence mechanisms of the presentation characteristics of QS data and consumers’ self-construal on their continuance participation intention. These findings not only expand the research field and the scope of application of Social Cognitive Theory, but also provide new insights for the study of consumers’ QS problems. They have reference value for the optimization of the presentation features of QS data, and for improving the match between QS data presentation and consumers’ self-construal types, to motivate continued participation in QS process.
Keywords: continuance participation intention, data presentation, quantified self, self-construal
Introduction
The COVID-19 pandemic has threatened individuals’ physical and psychological health, and brought significant lifestyle changes throughout the world.1 Participating in quantified self (QS) process has become a global trend that has changed how consumers understand themselves. QS refers to a process in which consumers track and measure their activity and health data, and use it to form personalized knowledge and habits.2 As a result, a variety of QS tools represented by health and fitness apps are emerging and developing rapidly. These apps can generate a large amount of QS data about consumer behaviors (by tracking parameters like fitness, food intake and sleep), as they contain QS functions that track health and activity levels.3 This helps consumers to better know, predict, and manage the state of their health, which provides them with a convenient and efficient healthcare monitoring mechanism.3 The QS data gathered by health and fitness apps is of great value to consumers and app developers. From it, consumers can analyze, intervene in and recognize their own behaviors, and companies can design and optimize products (services), segment customers, and market specifically to them.4,5 The full scope of QS’ positive utility, however, depends on consumers’ long-term and continued participation.6,7 Many consumers stop using health and fitness apps and continuously collecting QS data after a short time, and for various reasons. As a result, it is difficult for consumers to obtain the positive effects of QS, and app developers are unable to achieve their marketing goals. Pinpointing how to guide consumers to a sustained, long-term engagement with QS process through health and fitness apps is therefore a significant challenge for developers.
Because QS is a new research field, the literature to date has focused on theoretical analysis, such as the definition and connotations of QS, the selection and usage of QS tools, and QS’ application scenarios and technical support. Studies that examine the factors that affect continuous participation in QS process analyze them mainly from the consumer’s perspective. Lazar et al8 believe that three factors prevent consumers from continuing to participate in health-related QS activities: an unfit self-concept, invalid data collection, and difficult operation analysis. Zhang and Lowry9 studied users of running apps, and found out that the main reasons they failed to engage with QS process over a longer period included: the lack of motivation for constant participation; the conflict between a consumer’s resources (including time, energy, habits, etc.) and QS activities; and the restriction of certain technical skills by QS devices and applications. Shen et al7 revised and extended the expectation-disconfirmation model to investigate the factors that affected users’ continuous engagement with QS process. Li and Zhang10 used Achievement Goal Orientation Theory as a basis to examine the internal mechanism with which a consumer’s sustained willingness to participate in QS process is formed, as well as factors and mechanisms that hinder this participation. Jin et al11 demonstrated that immersive QS experiences promoted consumers’ continuous participation intention. Shi and Chen12 demonstrated that QS could increase continuance intention in the pursuit of goals. In QS process, app developers present consumers with personal behavioral data, which can help them optimize their actions. The presentation characteristics of QS data inevitably affect consumers’ self-cognition, and consequently affect their intention to participate sustainably in QS process, but this is largely neglected in present research.
Based on Social Cognitive Theory and Self-Construal Theory, we design three between-subjects experiments. These experiments examined the influence mechanisms of the presentation mode (horizontal vs vertical comparison), the presentation type (descriptive vs analytic) of QS data, and consumers’ self-construal (interdependent vs independent) on their continuance participation intention during QS process. This study used the presentation features of QS data to enrich related research by discussing consumers’ willingness to remain engaged with QS. It also has practical significance for developers of health and fitness apps, and provides them with valuable information on how to encourage continuous participation in QS process, which can help them maximize their marketing strategies.
In the following chapters, we first review Social Cognitive Theory, Self-Construal Theory and the presentation characteristics of QS data. Second, we discuss how the presentation characteristics of QS data and consumers’ self-construal affect continuance participation intention, and then develop the main hypotheses in this study. Third, in the experiment section, we conduct three between-subjects experiments, including materials, pretesting, participants, variable measurement, formal experiment and results. Finally, we present the discussion, theoretical and practical implications, discuss the limitations and future research, and draw conclusions from this study.
Literature Review
Social Cognitive Theory
According to Social Cognitive Theory, individual behavior is subject to the joint influences of social environment and self-cognition.13 The social environment affects individual cognition, and the behavior of other individuals in the same situation is part of this social environment, which also influences individual behavior.13 The core of Social Cognitive Theory is triadic reciprocal determinism: ie, the reciprocal and dynamic interactions between individual behavior, individual cognition and the social environment.14 Self-efficacy and self-regulation are important concepts in Social Cognitive Theory, and they play a determining role in individual behavior, target selection and involvement, and degree of persistence.15,16 Because it has a strong ability to predict and explain individual and group behaviors, the application range of Social Cognitive Theory has extended from entity organizations to online situations and virtual organizations, such as social media,17 live-streamed games,18 telemedicine,19 online health communities,20 and wearable tracking devices.21–23 Brinson24 indicates that the factors that influence consumers’ willingness to use QS tools, and their behavior while doing so, are based on many aspects, including cognitive overload, internal and external participation motivation, self-efficacy, self-regulation and outcome expectancy (positive or negative). Self-efficacy and self-regulation are two important concepts in Social Cognitive Theory, and play a decisive role in individual behavior, goal selection and investment, and persistence.15,16 It can be seen that Social Cognitive Theory is appropriate to the research context of this paper. Then, consumers receive information from the surrounding environment in the process of participating in QS activities. Combined with the research context of this paper, the presentation characteristics of QS data, as an important situational variable, affect consumers’ cognition, and stimulate internal and external motivation to adjust their behavior in order to achieve the goal, thus consumers’ QS continuance participation intention is enhanced. Social Cognitive Theory therefore provides a valuable theoretical perspective for the study of the influence mechanism of presentation characteristics of QS data on consumers’ continuance participation intention.
Self-Construal Theory
Self-construal refers to a collection of ideas, feelings and actions that relate to the connections or differences between the self and others.25 Markus and Kitayama26 and Liu27 divide self-construal into types, determined by the extent to which an individual thinks (s)he is related to or separated from others; accordingly, they identify the interdependent and independent types. When interdependent consumers define the self, they rely on their social environment and their relationships with others, including concepts such as status, role and interaction. These are external public attributes. Conversely, independent consumers think the self is independent of the social situation in which they live and define it according to inner private attributes, like ability, thought and feeling. This research applies the definition and classification of self-construal used by Singelis25 and Markus and Kitayama.26 Kim et al28 suggest that self-construal has a significant impact on Internet users’ motivations and behaviors. Rooksby et al29 demonstrate that QS is not limited to consumers themselves, and individuals are often interrelated, which establishes that the self in “quantified self” can also be group and social. Martinko et al30 found that situational variables affected individual cognitive processing and then affect individual behavior. They also asserted that individual cognitive processing was affected by individual differences. Consumers with different types of self-construal have different perceptions, cognitive processing, and behavioral reactions to the presentation characteristics of QS data. It is therefore useful to design customized and personalized interfaces to meet the needs of individual users.31 Social Cognitive Theory shows that an individual’s motivation and behavior are impacted by both the social environment and self-cognition,13,24 and Franque et al32 assert that it can be integrated with other theories in the information systems continuance intention context. Integrating Social Cognitive Theory and Self-Construal Theory can therefore better explain the influence mechanism of the presentation characteristics of QS data and self-construction on consumers’ QS continuance participation intention.
The Presentation Characteristics of QS Data
An effective human-computer interface is essential for the further development of QS activities, and should enable consumers to obtain descriptive objective information and actionable advice from their QS data.33 Understanding data is key to consumer participation in QS activities.34 Almalki et al2 and Li and Guo31 explain that although health-related QS data is rich and easy to generate, obtaining useful health-related results from it presents significant management and analysis challenges. Although previous studies recognize the importance of interface design to data presentation characteristics, they have not fully explored how this data should be presented to enhance consumers’ continuance participation intention.
In this study, the main presentation characteristics of QS data are presentation mode and presentation type. Pirzadeh et al35 and Cho et al36 classify the presentation mode of QS data in two categories: comparative and non-comparative. They define “comparison” as the contrast of an individual’s achievements and abilities with his/her own past or with the achievements and abilities of other individuals. Petkov et al37 believe that comparison can be either personal (compared to an individual’s own past) or social (compared to others). In this study, the presentation mode of QS data is categorized into horizontal and vertical comparison. The former compares the quantitative data of consumers’ own behaviors with that of others: eg, a fitness management app that regularly presents consumers with the specific ranking of their fitness data, and compares it to that of their friends. Vertical comparison refers to the contrast between the current quantitative data of consumers’ behaviors and that of their own past: eg, a fitness management app that delivers consumers their own past fitness levels in the form of weekly reports.
Fawcett,38 in referring to the presentation type of QS data, states that since most consumers are not satisfied with simple self-descriptive data presentation, QS tools should deeply mine the hidden information behind the data and provide specific feasible suggestions to consumers. This study divides the presentation type of QS data into descriptive and analytic types. The former is the quantitative data that objectively reflects an individual’s personal behavior, and offers the original data from each quantitative node: eg, a sleep management app records consumers’ deep sleep, light sleep and sleep duration, and displays the data in the form of numbers or charts. The latter is the quantitative data of consumers’ personal behavior that is obtained after comprehensive analysis by quantitative tools. This makes it possible to present consumers with analysis results that are based on quantitative data, and then to provide corresponding suggestions that will improve their behavior: eg, a sleep management app analyzes consumers’ sleep needs and tracks changes to their heart rate after they fall asleep. Based on this data, it will suggest corrective actions: eg, “You need to sleep 8 hours and 45 minutes tonight to compensate for your lack of sleep yesterday”.
Hypotheses Development
The Interaction Effects of the Presentation Mode and Presentation Type of QS Data on Consumers’ Continuance Participation Intention
The QS refers to the process in which consumers reflect on and optimize their behavior by collecting, analyzing and sharing self-data.10 Previous studies have shown that data presented in the comparative mode can promote consumers’ internal and external motivations and enhance their intention to change their behavior; this applies to a greater extent than in the non-comparative mode.35,36,39 Accordingly, QS data is generally delivered to consumers in a comparative format (horizontal or vertical). According to Social Cognitive Theory, when QS data is offered to consumers through horizontal comparison, other consumers who use the same QS tool will become part of the social environment, and with consumer self-cognition, exert influence on their behaviors.15,24 When this occurs, presenting descriptive QS data (as opposed to analytic QS data) to consumers can make them more clearly and intuitively identify the objective gap between themselves and others (especially top-ranking consumers). This demonstration effect enables consumers to generate a stronger external motivation and form clear future action goals, which in turn enhances their willingness to continue to participate in QS process.
When QS data is shown to consumers through vertical comparison, they see their own behavioral data and trends for a certain period in the past. By contrasting this with previously set targets, they can form a concrete sense of their goal achievement. On the basis of Social Cognitive Theory, consumers can produce inner motivation to adjust their behavior, and this enables them to further improve themselves and achieve their goals.15,24 In this environment, delivering analytic QS data rather than descriptive QS data to consumers can provide them with information on how to achieve their aims in the future, through specific operational suggestions and adjustments to their behavior in a particular direction. This generates stronger self-efficacy and a more positive future outcome expectancy, and encourages a willingness to keep investing and persisting to achieve goals.3,15,16 As a result, a consumer’s intention to maintain engagement with QS can also be enhanced. The following hypotheses are proposed accordingly:
H1. The presentation mode and presentation type of QS data have interaction effects on consumers’ continuance participation intention.
H1a. When QS data is presented in horizontal comparison, the descriptive data presentation is more effective at enhancing consumers’ QS continuance participation intention than the analytic data presentation.
H1b. When QS data is presented in vertical comparison, the analytic data presentation is more effective at enhancing consumers’ QS continuance participation intention than the descriptive data presentation.
The Interaction Influences of Consumers’ Self-Construal and the Presentation Mode of QS Data on Their QS Continuance Participation Intention
Self-construal affects all aspects of individual and social activities, and the consumers with different self-construal types vary greatly in their social tasks, motivations and goals.27,40 Markus and Kitayama26 and Yao et al41 demonstrate that consumers who belong to the interdependent self-construal category mostly have collectively, interpersonally and socially oriented motivations, while independent self-construal consumers are largely motivated by self-performance and self-value realization. While QS tools help consumers accurately intervene in their own behaviors, they also disclose the QS data of consumers within a certain range, so that QS activities can have group and social attributes.4,29 Social Cognitive Theory establishes that an individual’s motivation and behavior are impacted by both the social environment and self-cognition.13,24 A consumer’s self-construal, as a perception of the relationship between the self and others, is a critical part of individual self-cognition.25 For consumers with different self-construal types, the presentation mode of QS data can consequently have different effects on their willingness to be sustainable participants.
When consumers who engage in QS process are of the interdependent self-construal type, they define themselves from the perspective of the relationship between individuals and others, and pay more attention to external public attributes, such as status and rank. When this is the case, presenting QS data to consumers in the horizontal rather than vertical comparative mode can enable them to see the overall situation of the group and their own position and rank. This clarifies what consumers’ future goals should be, and enhances their QS continuance participation driven by external motivation. When consumers who take part in QS process are of the independent self-construal type, they define themselves independently of their social environment, and pay more attention to internal privatization attributes, such as ability and value.42 In this case, providing QS data to consumers in a vertical rather than horizontal comparative mode can meet their need for deep self-understanding, and generate an inner motivation to further improve. This strengthens the intention of consumers to continue engaging in QS process. The following hypotheses can therefore be stated:
H2. Consumers’ self-construal and the presentation mode of QS data have interaction impacts on their QS continuance participation intention.
H2a. When consumers are of the interdependent self-construal type, presenting QS data in horizontal comparison can strengthen their QS continuance participation intention more effectively than if data were presented in vertical comparison.
H2b. When consumers are of the independent self-construal type, presenting QS data in vertical comparison can strengthen their QS continuance participation intention more effectively than if data were presented in horizontal comparison.
The Interaction Impacts of Consumers’ Self-Construal and the Presentation Type of QS Data on Their QS Continuance Participation Intention
An individual’s cognitive style can be directly affected by self-construal.43 Cognitive style refers to a preferred habitual attitude, and the way an individual behaves with regard to memory, perception and thought process.44,45 Generally, individuals of interdependent self-construal exhibit a more field-dependent cognitive style: ie, they have a stronger dependence on external references in the cognitive process, and are unwilling to make decisions independently of their external environment. Conversely, individuals who independently self-construe generally display a field-independent cognitive style: ie, their cognitive process are relatively independent of their external environment. These individuals prefer to make decisions alone, without external interference.46–48 Consumers of different self-construal types also adopt different cognitive styles when they participate in QS process.
When consumers who participate in QS process are of the interdependent self-construal type, they exhibit a stronger field-dependent cognitive style, and their behavioral decisions are more dependent on the external environment. When this is the case, delivering analytic rather than descriptive QS data to consumers can significantly reduce the burden of cognition and decision-making, and consumers tend to accept the suggestions and solutions for improvement that QS tools offer. This enhances their desire to continue to engage with QS. When consumers participating in QS process are of the independent self-construal type, they show a stronger field-independent cognitive style, and their behavioral decisions are relatively more independent; consequently, they do not easily accept the improvement suggestions that QS tools provide. In this case, presenting descriptive rather than analytic QS data to consumers can meet their autonomous decision-making demands and allow them to make self-regulation decisions based on the cognitive processing of original data. This strengthens their willingness to continue participating in QS process. The following hypotheses are proposed accordingly:
H3. Consumers’ self-construal and the presentation type of QS data have interaction impacts on their QS continuance participation intention.
H3a. When consumers are of the interdependent self-construal type, analytic data presentation is more effective at enhancing their QS continuance participation intention than descriptive data presentation.
H3b. When consumers are of the independent self-construal type, descriptive data presentation is more effective at enhancing their QS continuance participation intention than analytic data presentation.
Based on the preceding elaboration, an analysis framework of consumers’ intention to continue participating in QS process is developed, as shown in Figure 1.
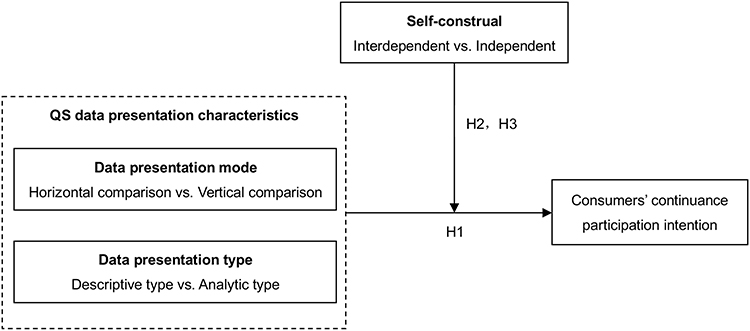 |
Figure 1 Research model. |
Experiment 1
Experiment 1 was designed to test the interaction effects of the presentation mode (horizontal comparison vs vertical comparison) and type (descriptive vs analytic) of QS data on consumers’ continuance participation intention (H1).
Materials
This study created the virtual scenario of a sleep management app, and shot four (between-subjects) short videos that corresponded to the combinations of the presentation mode (horizontal comparison vs vertical comparison) and type (descriptive vs analytic) of QS data. In the videos, the horizontal comparison mode was primarily demonstrated by the ranking of QS data. The vertical comparison mode was mainly shown through line charts of QS data from the previous week. The descriptive type was principally exhibited by the objective presentation of each node’s QS data. The analytic type was mainly displayed through the corresponding improvement suggestions and solutions put forward by the app after it analyzed consumers’ QS data.
Pretesting
The aim of the pretesting was to determine whether the manipulation of the presentation mode and type of QS data was successful. The present study referenced the manipulation check of the ways of delivering health information in Shin and Biocca3 and Cho et al,36 and adjusted it in accordance with the research context to manipulate the presentation mode and type of QS data. A total of 120 college students from a higher education park in Hangzhou were invited to take part in the pretest. They were randomly divided into 4 groups, and all participants were briefed about the experiment scenario of engaging with sleep QS activity: “One morning, when you wake up, you turn on your phone as usual, and open the sleep management app to see your sleep status.” Then, each group watched a different short video separately.
In the horizontal comparison–descriptive type condition, participants were given the previous night’s sleep data:
The sleep management app showed that your sleep score was 72 last night. You ranked 331,185 of more than 193,555 users. The app recorded your bedtime, sleep duration, sleep age, and the distribution of deep and light sleep.
In the horizontal comparison–analytic type condition, participants were told:
The sleep management app showed you that last night’s sleep score was 83. This placed you higher than 65% of users. The sleep quality analysis showed that you fell asleep late, had insufficient sleep, and woke up easily. The sleep management app suggested that you should go to bed early, sleep for 7 to 9 hours, reduce working hours and stress, and have a cup of hot milk before going to bed.
In the vertical comparison–descriptive type group, subjects received information about their previous week’s sleep:
The sleep management app showed the distribution of your sleep last week (including your daily sleep duration, sleep score, sleep age, bedtime, and wake-up time) in graphic form. Your average bedtime last week was 23:25, and your average sleep duration was 8 hours, with a total score of 88 points.
In the vertical comparison–analytic type group, participants were given their past sleep data:
The sleep management app presented your daily sleep efficiency and sleep duration in the past in a line chart. The analysis showed that your sleep efficiency was high, but you had too little deep sleep. The app suggested that you do aerobic exercise at least three times a week, and keep your bedroom well ventilated.
After watching the video, each participant was asked to judge the presentation mode and presentation type of QS data in the video from 1 to 5, where 1 = full vertical comparison or full analytic, and 5 = full horizontal comparison or full descriptive.
Formal Experiment
In Experiment 1, the study employed a between-subjects design of 2 (presentation mode: horizontal comparison vs vertical comparison) × 2 (presentation type: descriptive vs analytic).
Participants
Drawing on Shin and Biocca3 and Cho et al,36 200 college student volunteers aged 18 to 30 years from a higher education park in Hangzhou were recruited to participate in the experiment. These subjects were right-handed, had normal or corrected-to-normal vision and no mental or cognitive impairment. All participants were randomly assigned to four groups. Each group watched a corresponding short video (which was validated in the pretesting) separately, and then completed a two-part questionnaire. The first part recorded the subjects’ age, education level, and gender, and the second measured their QS continuance participation intention after they watched the video. Considering that individual’s experience and overall propensity and familiarity to use technology, especially mobile apps and fitness apps, have influence on users’ continuance participation intention, we asked special questions at the beginning of the questionnaire to conduct a rigorous and reasonable screening of subjects. The responses of participants who had used health-related QS apps were considered invalid. A total of 163 valid questionnaires were collected in Experiment 1, and an effectiveness rate of 81.5% was recorded. Of these respondents, 41 were in the horizontal comparison–descriptive type group; 39 were in the horizontal comparison–analytic type group; 42 were in the vertical comparison–descriptive type group; 41 were in the vertical comparison–analytic type group; 73 were male (44.79%); and 90 were female (55.21%).
Variable Measurement
Consumers’ continuance participation intention was measured using the scale of Shin and Biocca.3 With the Cronbach’s α of 0.89, the composite reliability (CR) of 0.79 and the average variance extracted (AVE) of 0.67, the scale developed by Shin and Biocca3 has good reliability and validity. Based on the scale of Shin and Biocca,3 we adapted it in accordance with the research context. The adapted scale consisted of three items scored on a five-point Likert scale ranging from 1 (completely disagree) to 5 (completely agree). In this study, SPSS and Mplus software were used to test reliability and validity, and the results are shown in Table 1. The Cronbach’s α coefficient was 0.795, which was greater than the acceptable level of 0.7, indicating that the scale had good reliability. The standardized factor loading value of each item was greater than 0.5, the CR value was greater than 0.7, and the AVE value was greater than 0.5, indicating that it had good convergent validity.
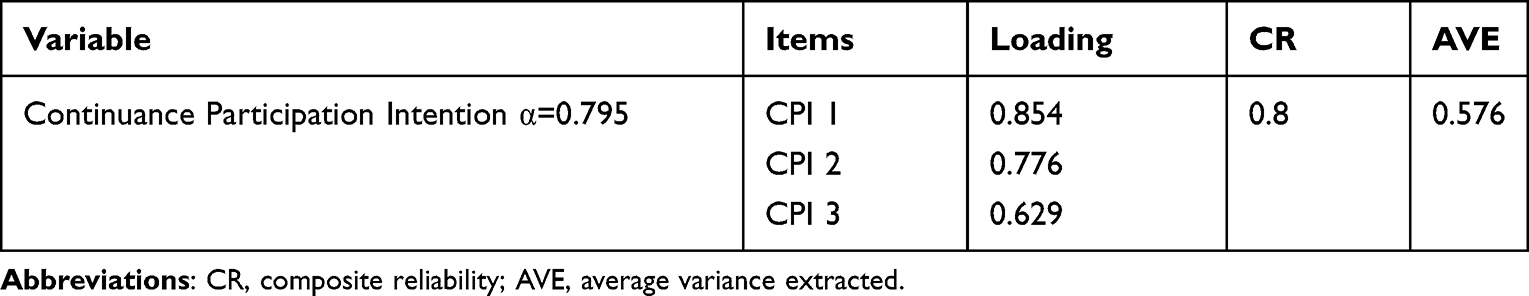 |
Table 1 Reliability and Validity Results of Experiment 1 |
Results
Manipulation Check Results
An independent-samples t test was conducted based on the data obtained, and four groups of subjects that obviously differed in their perceptions of the presentation mode and presentation type of QS data (MHorizontal Comparison = 3.47, MVertical Comparison = 2.30, p < 0.001; MDescriptive Type = 3.97, MAnalytic Type = 2.70, p < 0.001) were produced. From this it can be seen that the manipulation of the presentation mode and presentation type of QS data was successful.
Formal Results
The data acquired in Experiment 1 produced a two-way analysis of variance (ANOVA) of 2 (presentation mode: horizontal comparison vs vertical comparison) × 2 (presentation type: descriptive vs analytic). As Table 2 shows, the presentation mode did not significantly affect consumers’ QS continuance participation intention (p = 0.838), and neither did the presentation type (p = 0.270). But the interaction effects of the presentation mode and presentation type of QS data on consumers’ QS continuance participation intention were significant (F = 122.091, p < 0.001), so Hypothesis H1 was accepted. As Figure 2 shows, when QS data was presented in horizontal comparison, the descriptive data presentation was more effective than the analytic data presentation at enhancing consumers’ QS continuance participation intention (MDescriptive Type = 4.236 vs MAnalytic Type = 3.496, p<0.001), so Hypothesis H1a was accepted. When QS data was delivered in vertical comparison, the analytic data presentation was more effective than the descriptive data presentation at enhancing consumers’ QS continuance participation intention (MDescriptive Type = 3.429 vs MAnalytical Type = 4.333, p < 0.001), so Hypothesis H1b was accepted.
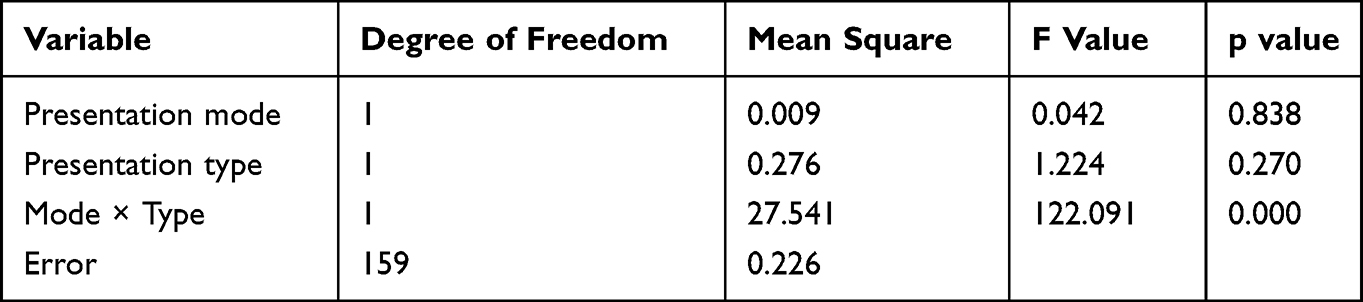 |
Table 2 Testing the Interaction Effects of Data Presentation Mode and Presentation Type on Consumers’ Continuance Participation Intention |
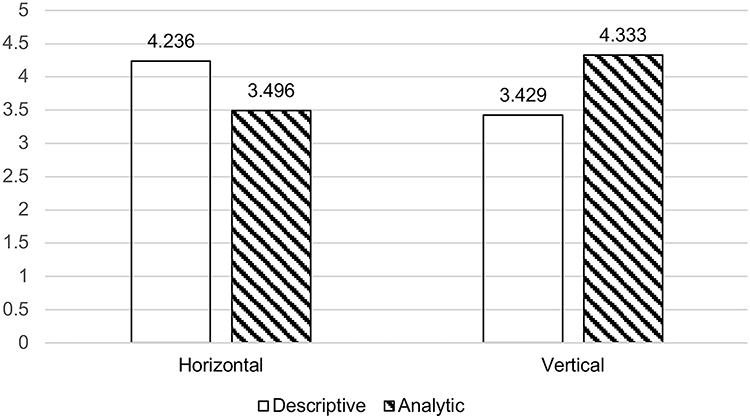 |
Figure 2 Effects of presentation types on continuance participation intention in different data presentation modes. |
Experiment 2
The purpose of Experiment 2 was to examine the interaction effects of consumers’ self-construal (interdependent vs independent) and the presentation mode (horizontal comparison vs vertical comparison) of QS data on consumers’ QS continuance participation intention (H2).
Materials
A virtual scenario of a fitness management app was designed, and two short videos were shot that corresponded with the different presentation modes (horizontal comparison vs vertical comparison) of QS data. In the videos, the horizontal comparison mode was mostly reflected by the ranking of QS data, and the vertical comparison mode was primarily reflected by the weekly QS data reports from a period in the past.
Pretesting
This pretesting aimed to test whether the manipulation of the presentation mode of QS data was successful. The manipulation check of the presentation mode of QS data in Experiment 2 was similar to that in Experiment 1. A total of 60 college students were recruited from a higher education park in Hangzhou to participate in the pretest. They were randomly assigned to two groups, and all participants were given the information about the experiment scenario of engaging with fitness QS activity: “One day, when you finish working out, you turn on your phone as usual, and open the fitness management app to learn about your exercise status.” Then, each watched a different short video.
In the horizontal comparison condition, participants were given the previous week’s exercise data:
The fitness management app showed that you only exercised one day last week, for 26 minutes, ranking 4th among your friends.
In the vertical comparison condition, participants were given exercise data for the previous few weeks:
The fitness management app measured your exercises every week, including the number of exercise days, the cumulative steps after each exercise, the number of stretches and planks, the calories burned, and the duration of each exercise.
After watching the video, each participant judged the presentation mode of QS data in the video on a scale from 1 to 5, where 1 = full vertical comparison, and 5 = full horizontal comparison.
Formal Experiment
Experiment 2 employed a between-subjects design of 2 (presentation mode: horizontal comparison vs vertical comparison) × 2 (self-construal: interdependent vs independent).
Participants
Drawing on Shin and Biocca3 and Cho et al,36 180 college student volunteers aged 18 to 30 years from a higher education park in Hangzhou were invited to participate in the experiment. These subjects were right-handed, had normal or corrected-to-normal vision and no mental or cognitive impairment. All participants were randomly assigned to two groups (horizontal comparison and vertical comparison) to watch a corresponding short video, which was verified in the pretesting, and answer a questionnaire. The questionnaire had three parts: the first measured subjects’ age, education level and gender; the second measured their self-construal type; and the third measured their continued willingness to participate in QS process after watching the video. Considering that individual’s experience and overall propensity and familiarity to use technology, especially mobile apps and fitness apps, have influence on users’ continuance participation intention, we asked special questions at the beginning of the questionnaire to conduct a rigorous and reasonable screening of subjects. The responses of participants who had used health-related QS apps were considered invalid. A total of 155 valid questionnaires were collected, and an effectiveness rate of 86.11% was recorded. In the horizontal comparison group, 39 were of the interdependent type, and 36 were independent. In the vertical comparison condition, 41 were of the interdependent type, and 39 were independent. Of the 155 respondents, 77 were male (49.68%) and 78 were female (50.32%).
Variable Measurement
The measurement of consumers’ continuance participation intention was similar to that in Experiment 1. The measurement of consumers’ self-construal primarily referenced Xiong’s research.49 Interdependent self-construal consisted of six items, with the Cronbach’s α of 0.809 and the AVE value of 0.708. Independent self-construal consisted of five items, with the Cronbach’s α of 0.721and the AVE value of 0.773. The scale from Xiong49 has good reliability and validity. All the scales adopted a five-point Likert scale ranging from 1 (completely disagree) to 5 (completely agree), and were adapted on the basis of the research context. In this study, SPSS and Mplus software were used to test reliability and validity, and the results are shown in Table 3. The Cronbach’s α coefficient of consumers’ continuance participation intention was 0.801. The Cronbach’s α coefficient of interdependent self-construal was 0.861, and the Cronbach’s α coefficient of independent self-construal was 0.850. The Cronbach’s α coefficients of all variables were greater than the acceptable level of 0.7, indicating that the scales had good reliability. The standardized factor loading value of each item was greater than 0.5, the CR value was greater than 0.7, and the AVE value was greater than 0.5, indicating that it had good convergent validity. In accordance with Yao et al’s41 classification method of consumers’ self-construal, the mean value of the respective items of interdependent type and independent type was taken as the score of this variable; each group was then, in accordance with positive and negative score difference, divided in two. Subjects with positive difference were interdependently self-construing, and those with negative difference were independently self-construing (MInterdependent Type = 0.767, SDInterdependent Type = 0.377, MIndependent Type = −0.834, SDIndependent Type = 0.450, t. = 24.058, p < 0.001).
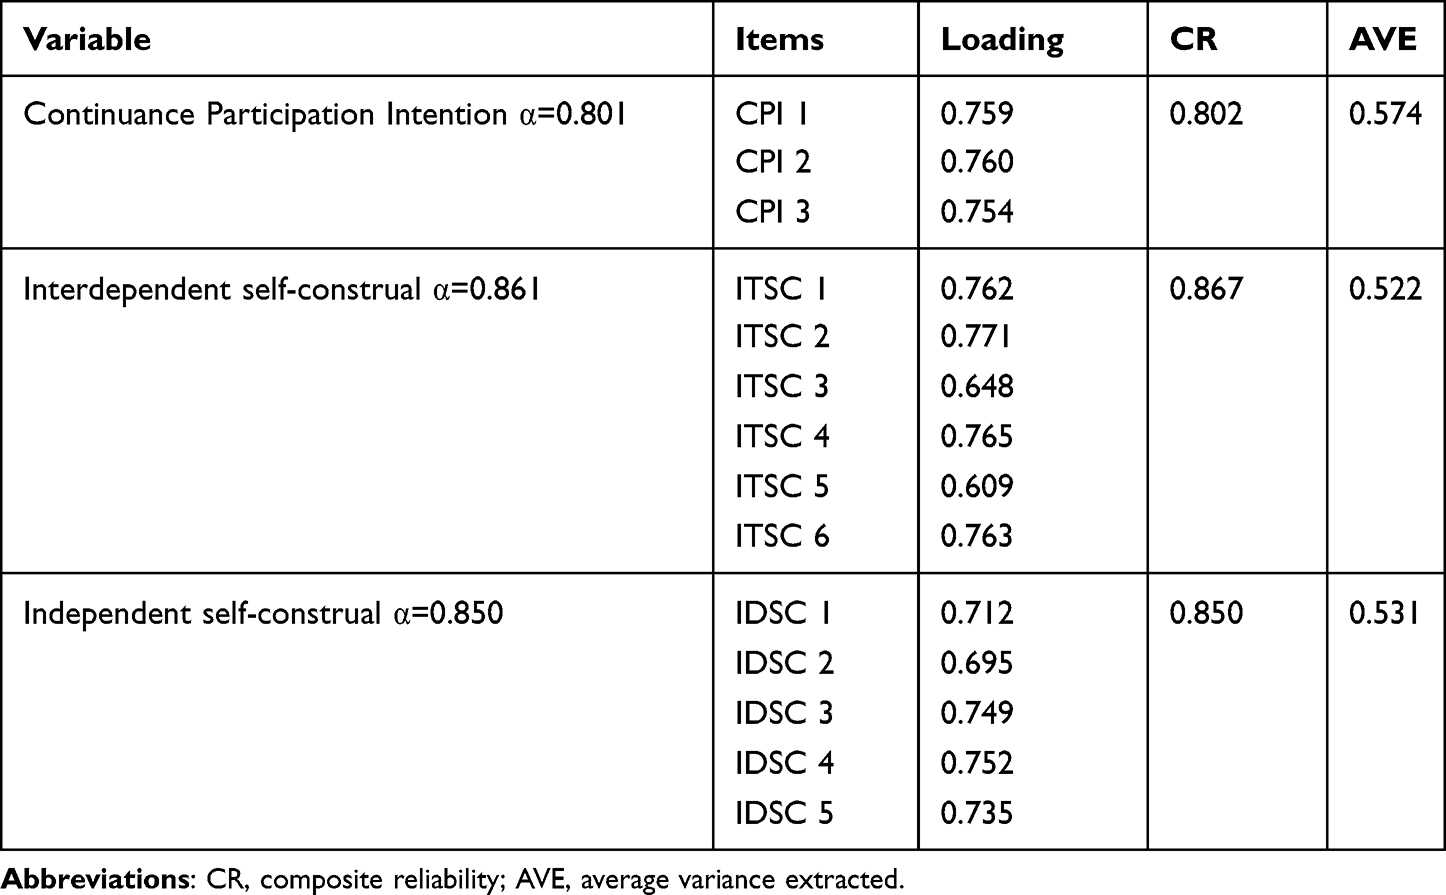 |
Table 3 Reliability and Validity Results of Experiment 2 |
Results
Manipulation Check Results
The results of the independent-samples t test showed that the two groups perceived the presentation mode of QS data very differently (MHorizontal Comparison = 3.63, MVertical Comparison = 2.10, p < 0.001). This demonstrated that the experiment was successful in manipulating the presentation mode of QS data.
Formal Results
Data attained in Experiment 2 produced a two-way ANOVA of 2 (presentation mode: horizontal comparison vs vertical comparison) × 2 (self-construal: interdependent vs independent). As Table 4 shows, the main effect of consumers’ self-construal on their QS continuance participation intention was not significant (p = 0.572). The presentation mode of QS data also did not significantly affect consumers’ QS continuance participation intention (p = 0.142). But because the interaction effects of consumers’ self-construal and the presentation mode of QS data on their QS continuance participation intention were obvious (F = 107.854, p < 0.001), Hypothesis H2 was accepted. As Figure 3 shows, when consumers were interdependently self-construing, the data presentation mode in the horizontal comparison was more effective at strengthening consumers’ QS continuance participation intention than in the vertical comparison (MHorizontal Comparison = 4.231 vs MVertical Comparison = 3.561, p < 0.001), and Hypothesis H2a was accepted on this basis. When consumers were independently self-construing, the data presentation mode in the vertical comparison was more effective at strengthening their QS continuance participation intention than that in the horizontal comparison (MHorizontal Comparison = 3.407 vs MVertical Comparison = 4.299, p < 0.001); accordingly, Hypothesis H2b was accepted.
 |
Table 4 Testing the Interaction Effects of Self-Construal and Data Presentation Modes on Consumers’ Continuance Participation Intention |
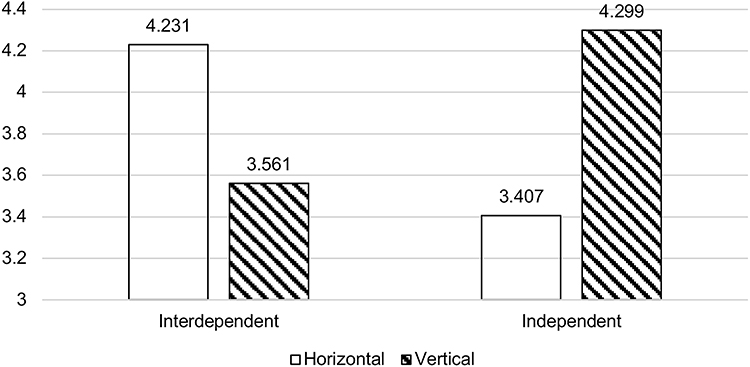 |
Figure 3 Effects of data presentation mode on continuance participation intention in different self-construal. |
Experiment 3
Experiment 3 aimed to test the interaction effects of consumers’ self-construal (interdependent vs independent) and the presentation type (descriptive vs analytic) of QS data on their QS continuance participation intention (H3).
Materials
A virtual scenario of a diet management app was created, and two short videos were shot that corresponded to the descriptive and analytic presentation types of QS data. In the videos, descriptive presentation was primarily shown in the objective presentation of each node’s QS data, while analytic presentation was mainly presented as the corresponding suggestions and solutions the app offered after it analyzed consumers’ QS data.
Pretesting
The purpose of this pretesting was to test that whether the manipulation of the presentation type of QS data was successful. The manipulation check of the presentation type of QS data in Experiment 3 was similar to that in Experiment 1. Sixty college students from a higher education park in Hangzhou were invited to attend the pretest. They were randomly distributed into two groups, and all participants were given information about the experiment scenario of engaging with diet QS activity: “One day, after you have eaten a big dinner, you turn on your phone as usual, and open the diet management app to learn about your diet today.” Then, each group watched a different short video.
In the descriptive experiment group, subjects were given information about their diet that day:
The diet management app showed that you had an intake of 1864 kilocalories today, 558 kilocalories more than you planned. It also recorded the calorie intake of each meal, and each type of food you ate.
In the analytic experiment group, subjects were given personalized dietary information:
The diet management app rated your diet as average. A nutritional analysis was made based on your diet, including calorie, nutrient and food type analysis. The results showed that you have had a high calorie and fat intake today, and ate too many snacks and not enough fresh vegetables. The app gave you targeted suggestions for each meal.
After watching the video, each subject judged the presentation type of QS data in the video on a 1 to 5 scale, where 1 = full analytic type, and 5 = full descriptive type.
Formal Experiment
Experiment 3 employed a between-subjects design of 2 (presentation type: descriptive vs analytical) × 2 (self-construal: interdependent vs independent).
Participants
Drawing on Shin and Biocca3 and Cho et al,36 180 college student volunteers aged 18 to 30 years from a higher education park in Hangzhou were invited to participate in the experiment. These subjects were right-handed, had normal or corrected-to-normal vision and no mental or cognitive impairment. All participants were randomly assigned to two groups (descriptive and analytic). They then watched a corresponding short video (which was confirmed in the pretesting) separately, and completed a three-part questionnaire. The first part ascertained participants’ age, education level, and gender; the second measured their type of self-construal; and the third measured their willingness to continue participating in QS process after watching the video. Considering that individual’s experience and overall propensity and familiarity to use technology, especially mobile apps and fitness apps, have influence on users’ continuance participation intention, we asked special questions at the beginning of the questionnaire to conduct a rigorous and reasonable screening of subjects. The responses of participants who had used health-related QS apps were considered invalid. A total of 161 valid questionnaires were collected and an effectiveness rate of 89.44% was recorded. In the descriptive experiment group 41 were interdependent and 40 were independent; in the analytic experiment group 41 were interdependent, and 39 were independent. Of the 161 respondents, 76 were male (47.20%), and 85 were female (52.80%).
Variable Measurement
The measurement of consumers’ continuance participation intention was similar to that in Experiment 1, and the measurement of consumers’ self-construal was similar to that in Experiment 2. In this study, SPSS and Mplus software were used to test reliability and validity, and the results are shown in Table 5. The Cronbach’s α coefficient of consumers’ continuance participation intention was 0.754. The Cronbach’s α coefficient of Interdependent self-construal was 0.863, and the Cronbach’s α coefficient of Independent self-construal was 0.853. The Cronbach’s α coefficients of all variables were greater than the acceptable level of 0.7, indicating that the scales had good reliability. The standardized factor loading value of each item was greater than 0.5, the CR value was greater than 0.7, and the AVE value was greater than 0.5, indicating that it had good convergent validity. In accordance with Yao et al’s41 classification method of consumers’ self-construal, the mean value of the respective items of interdependent and independent type was taken as the score of this variable; each group was then divided in two according to positive and negative score difference. Subjects with positive difference were interdependently self-construing, and those with negative difference were independently self-construing (MInterdependent Type = 0.638, SDDependent Type = 0.501, MIndependent Type = −0.590, SDIndependent Type = 0.421, t = 16.797, p < 0.001).
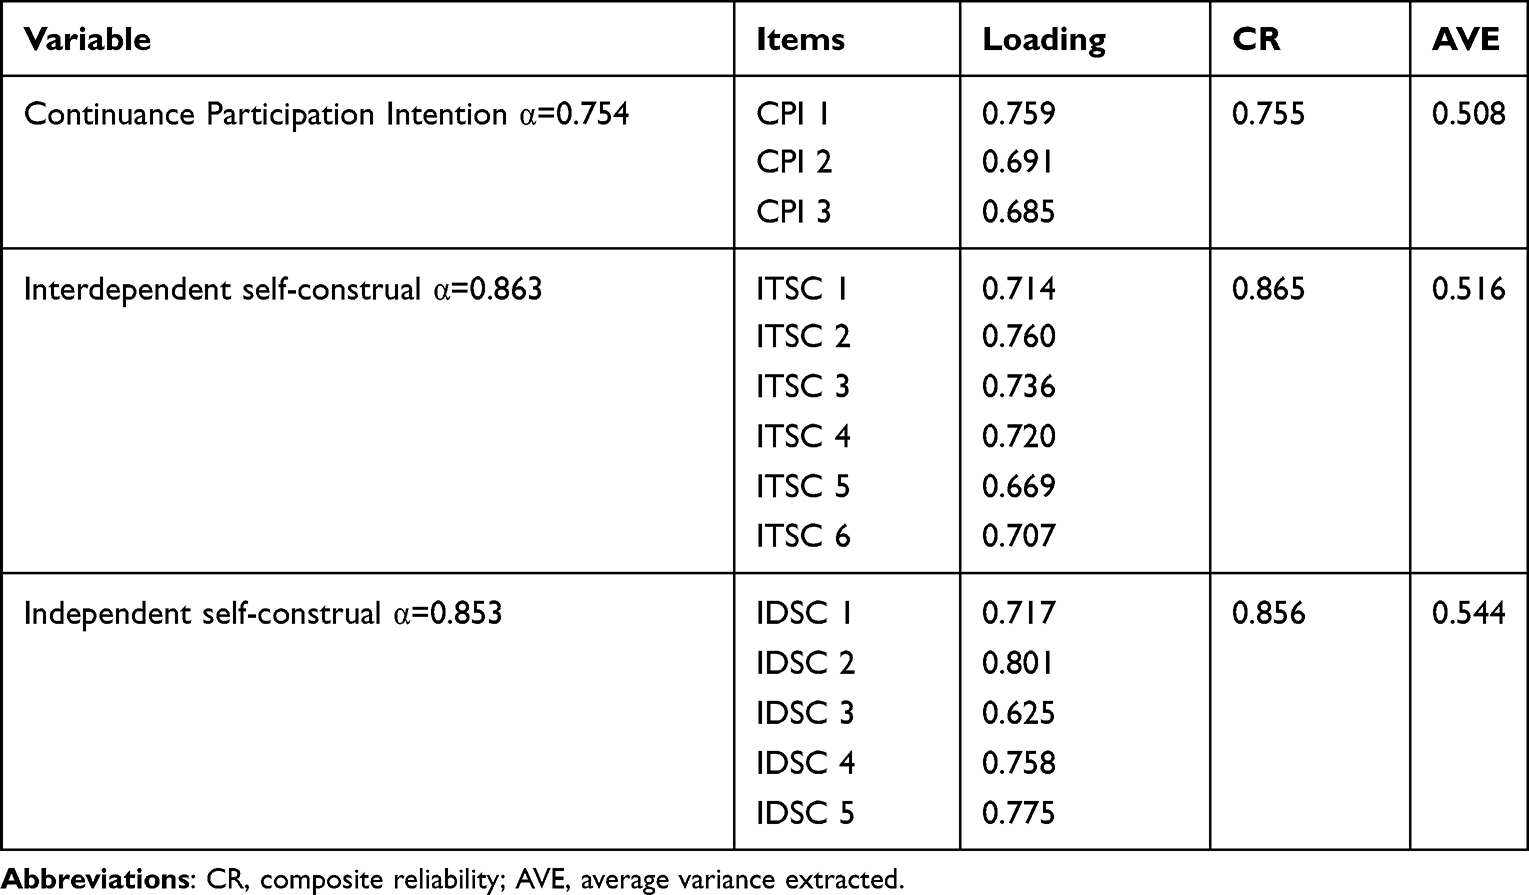 |
Table 5 Reliability and Validity Results of Experiment 3 |
Results
Manipulation Check Results
An independent-samples t test was applied to the data obtained, and the results showed the two groups differed significantly in their perception of the presentation type of QS data (MDescriptive Type = 3.93, MAnalytic Type = 2.10, p < 0.001). This clarified that the manipulation of the presentation type of QS data was successful.
Formal Results
The data obtained in Experiment 3 made it possible to perform a two-way ANOVA of 2 (presentation type: descriptive vs analytic) × 2 (self-construal: interdependent vs independent). As Table 6 shows, the main effect of consumers’ self-construal on their QS continuance participation intention was not significant (p = 0.724), and neither was the presentation type of QS data (p = 0.206). The interaction effects of self-construal and the presentation type of QS data did, however, significantly affect consumers’ QS continuance participation intention (F = 102.538, p < 0.001), and Hypothesis H3 was accepted on this basis. As Figure 4 shows, when consumers were interdependently self-construing, the analytic data presentation was more effective than the descriptive data presentation at reinforcing their QS continuance participation intention (MAnalytic Type=4.203 vs MDescriptive Type=3.585, p<0.001), and Hypothesis H3a was accepted. When consumers were independently self-construing, the descriptive data presentation type was more effective at strengthening their QS continuance participation intention than the analytic data presentation type (MAnalytic Type=3.521 vs MDescriptive Type=4.317, p<0.001), and Hypothesis H3b was therefore accepted.
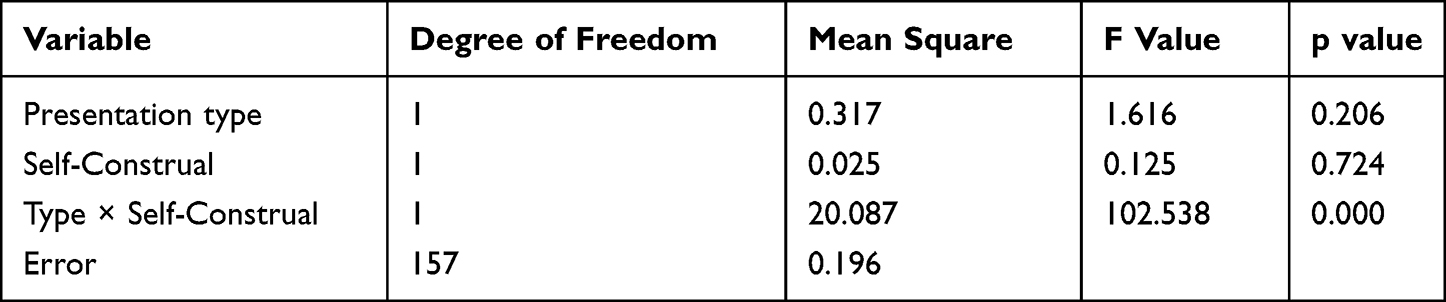 |
Table 6 Testing the Interaction Effects of Data Presentation Type and Self-Construal on Consumers’ Continuance Participation Intention |
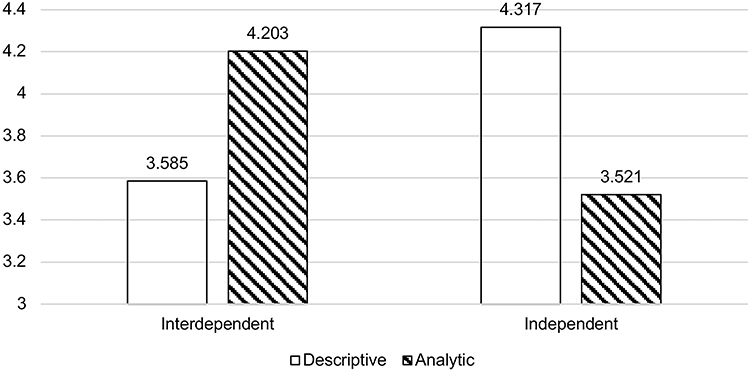 |
Figure 4 Effects of data presentation type on continuance participation intention in different self-construal types. |
Discussion
This study used the health-related QS apps as a research object and drew on Social Cognitive Theory and Self-Construal Theory to analyze the influence mechanisms of the presentation characteristics of QS data on consumers’ continuance participation intention during QS process. This extends the research and application scope of both theories in the information systems field. The results of the three experiments answer the research questions asked at the beginning of the study.
First, this study showed that the presentation mode and presentation type of QS data had obvious interaction effects on consumers’ continuance participation intention. This implies that when data is presented in horizontal comparison, descriptive data presentation is more effective than the analytic type at enhancing consumers’ QS continuance participation intention. When data is delivered in vertical comparison, analytic data presentation is more effective than descriptive data presentation at enhancing consumers’ QS continuance participation intention. Shin and Biocca3 suggest that the interaction between feedback type and presentation mode has practical implications, and the results indicated that comparative feedback elicited a higher tendency for health preservation than non-comparative feedback in participants who received messages in text format.3 This is likely because comparison with others motivates users to change their behavior positively,37 and textual information is typically informative and analytic.50 The current study enriches research on the presentation characteristics of QS data by documenting the interaction effects of the presentation mode (horizontal comparison vs vertical comparison) and presentation type (descriptive vs analytical) on consumers’ QS continuance participation intention.
Second, the study demonstrated that consumers’ self-construal and the presentation mode of QS data had significant interaction effects on consumers’ continuance participation intention. This implies that information system practitioners should consider individual differences when presenting QS data to consumers. When consumers are of the interdependent self-construal type, presenting data in horizontal comparison is more effective at strengthening their continuance participation intention than when it is presented in vertical comparison. When consumers are of the independent self-construal type, presenting data in vertical comparison can enhance their continuous participation intention more effectively than when it is presented in horizontal comparison.
Third, the study showed that consumers’ self-construal and the presentation type of QS data have significant interaction effects on consumers’ continuance participation intention. This has practical implications: when consumers are of the interdependent self-construal type, analytic data presentation can enhance their QS continuance participation intention more than the descriptive type do; conversely, when consumers are of the independent self-construal type, descriptive data presentation can enhance their QS continuance participation intention more than analytic data presentation do.
Theoretical Contributions and Managerial Implications
Theoretical Contributions
This study provides several theoretical contributions. First, it enriches the antecedents of consumers’ QS continuance intention from the perspective of QS data itself. Although previous research offers valuable insights into the factors that influence consumers’ QS continuance participation intention,8–10,51 most scholars approach the subject from the consumer’s perspective. The current study examines the impact of interface design (QS data presentation characteristics in information systems) on consumer perception from the perspective of consumer psychology, so as to strengthen consumers’ willingness to continue participating. It examines an understudied influence factor of consumers’ QS continuance participation intention—namely, the effect of presentation characteristics of QS data on consumers’ continuance participation intention. This enriches the research on human-computer interaction in information systems.
Second, previous studies mainly used Expectation Confirmation Theory, TAM and UTAUT to analyze the influence mechanism of information system continuance intention.32 The findings from the current study examine the specific impact(s) of psychological factors—such as internal and external motivation, outcome expectancy and self-efficacy—on the relationship between data presentation characteristics and consumers’ continuance participation intention. It uses Social Cognitive Theory to expand earlier research into the influencing factors on consumers’ willingness to use QS tools, including cognitive overload, internal and external participation motivation, self-efficacy, self-regulation and outcome expectancy (positive or negative). The current study analyzes the specific mechanism by drawing on Social Cognitive Theory and the joint influence of the social environment and self-cognition on a consumer’s willingness and behavior. This extends the research and application of the theory in the field of information systems, and shows that it provides a valuable theoretical perspective on the study of consumers’ participation in QS process.
Third, the study provides insights that will benefit the in-depth investigation of consumers’ QS problems, by integrating Self-Construal Theory with Social Cognitive Theory to discuss the interaction effects of consumers’ self-construal (interdependent vs independent) and data presentation characteristics on QS continuance participation intention. It does so from the perspectives of individual differences, motivational goals and cognitive style.
Managerial Implications
First, the current research highlights the importance of consumers’ continuance participation in QS process. QS tools, in the form of various health and fitness apps, are currently being used by consumers. The positive effects of QS, such as behavior optimization and improved health, can only be revealed through continual consumer participation. However, for a variety of reasons (including deficient privacy protection, inadequate personalized services, insufficient HCI, low self-efficacy, non-ideal outcome expectancy, poor data presentation, scant consumer resources (such as time and energy), unfriendly interface design and weak motivation) consumers often do not persist in QS process over time. Health and fitness app developers should therefore actively employ diversified management and technical methods that motivate and guide consumers to continue their QS activities. This will benefit consumers and developers and enable a mutually satisfactory outcome.
Second, the study shows that developers can constantly optimize the presentation features of QS data. QS is a long-term process that enables consumers to recognize, reflect on and optimize their behaviors, based on the personal behavioral data that QS tools such as health and fitness apps deliver. The effective presentation of QS data plays a key role in encouraging consumers to continue to participate, and it also helps drive behavioral improvements. Health and fitness app developers should pay attention to, and continuously optimize, the presentation characteristics of QS data, as this will help reinforce consumers’ continuance participation intention. Developers should present consumers with various types of QS data in as many ways as possible, including horizontal and vertical comparison presentation modes, and descriptive and analytic data types. They should also understand the relationship between the presentation mode and type of QS data. For example, when data is displayed in horizontal comparison, the consumers’ objective original data should be presented to them; when data is delivered in vertical comparison, data analysis results and behavioral improvement recommendations should be provided.
Another useful insight that can be derived from the current study is that app developers should improve the match between QS data presentation and consumers’ self-construal types. Self-construal varies greatly between consumers, but can generally be divided into interdependent and independent types. These types have different preferences regarding the presentation mode and type of QS data, and this affects their continuance participation intention. Health and fitness app developers should make full use of the consumer behavior data they have, and competently analyze and identify the self-construal types of their users. Targeted management should be performed on the basis of these differences in cognitive style. Personalized interfaces and autonomous tool options would enable dynamically matched the presentation mode and presentation type of QS data, and consumer self-construal types. This would provide a long-term enhancement of consumers’ QS continuance participation intention.
Limitations and Future Directions
First, using only students (a relatively uniform group) as experimental subjects may not adequately represent users of health-related QS apps, and this affects the universality of the study’s conclusions. Future research should consider the influence of individual heterogeneity factors such as age, occupation and experience of using QS tools on consumers’ QS continuance participation intention, so as to address this issue. Second, the presentation of virtual health app scenarios in the form of short videos lacked design authenticity. Future research should consider using more realistic experiment scenarios. If conditions permit, for example, a real and available health-related QS app will be developed and made available. Participants will be invited to use it for a period of time, record their use and perception, and measure their continuance participation intention in health-related QS activities. Third, this study only examined the impact of the data presentation characteristics of health-related QS apps on consumers’ continuance participation intention, and did not discuss other kinds of QS app, to which the results may not be applicable. Future research should explore other QS apps, to expand the generalizability of results. Finally, there may be three interaction effects between the presentation mode and presentation type of QS data and consumers’ self-construal, into which future research should conduct an in-depth and systematic analysis.
Conclusion
Drawing on Social Cognitive Theory and Self-Construal Theory, this study explored the influence mechanisms of the presentation mode and type, and consumers’ self-construal on their continuance participation intention. The first experiment’s findings verified that the presentation mode and presentation type of QS data had interaction effects on consumers’ continuance participation intention; the second experiment showed that consumers’ self-construal and the presentation mode of QS data had interaction effects on their QS continuance participation intention; and the third experiment found that consumers’ self-construal and the presentation type of QS data have interaction influences on their continuance participation intention. The study provides a new perspective for our understanding of consumers’ QS problems and extends the research field and application scope of Social Cognitive Theory in the field of information systems. It also gives direct guidance for the optimization of presentation features of QS data and the matching between QS data presentation and consumers’ self-construal types.
Abbreviations
QS, quantified self; CR, composite reliability; AVE, average variance extracted.
Data Sharing Statement
The datasets supporting the conclusions of this study are available upon request to the corresponding author.
Ethics Approval and Informed Consent
The study was conducted according to the guidelines of the Declaration of Helsinki, and approved by the Institutional Review Board of Zhejiang Gongshang University. Informed consent was obtained from all subjects involved in the study.
Consent for Publication
All authors agreed with the publication of this manuscript.
Acknowledgments
The authors would like to thank all the participants and volunteers who provided support for this study.
Funding
This research was supported by the key project of National Social Science Foundation of China [grant number: 20AGL019].
Disclosure
The authors declare no conflicts of interest in this work.
References
1. Faraci P, Bottaro R, Valenti GD, Craparo G. Psychological well-being during the second wave of COVID-19 pandemic: the mediation role of generalized anxiety. Psychol Res Behav Manag. 2022;15:695–709. doi:10.2147/PRBM.S354083
2. Almalki M, Gray K, Martin-Sanchez F. Activity theory as a theoretical framework for health self-quantification: a systematic review of empirical studies. J Med Internet Res. 2016;18(5):131–148. doi:10.2196/jmir.5000
3. Shin DH, Biocca F. Health experience model of personal informatics: the case of a Quantified Self. Comput Human Behav. 2017;69:62–74. doi:10.1016/j.chb.2016.12.019
4. Crawford K, Lingel J, Karppi T. Our metrics, ourselves: a hundred years of self-tracking from the weight scale to the wrist wearable device. Eur J Cult Stud. 2015;18(4–5):479–496. doi:10.1177/1367549415584857
5. Zhang YD, Li DJ. Research on obstructive factors and the influencing mechanism of consumers’ involvement in Quantified-Self. Chin J Manage. 2018;15(1):74–83.
6. Van Berkel N, Luo C, Ferreira D, Goncalves J, Kostakos V, editors. The curse of Quantified-Self: an endless quest for answers.
7. Shen XL, Li YJ, Sun YQ. Wearable health information systems intermittent discontinuance: a revised expectation disconfirmation model. Ind Manage Data Syst. 2018;118(3):506–523. doi:10.1108/IMDS-05-2017-0222
8. Lazar A, Koehler C, Tanenbaum J, Nguyen DH, editors. Why we use and abandon smart Devices.
9. Zhang J, Lowry PB, editors. Designing Quantified-Self 2.0 running platform to ensure physical activity maintenance: the role of achievement goals and achievement motivational affordance.
10. Li DJ, Zhang YD. Why consumers give up: the mechanism underlying the formation of willingness to continue participating in Quantified Self. Nankai Bus Rev. 2018;21(1):118–131.
11. Jin H, Yan JY, Zhang YD, Zhang HL. Research on the influence mechanism of users’ quantified-self immersive experience: on the convergence of mobile intelligence and wearable computing. Pers Ubiquitous Comput. 2020;3:1–12.
12. Shi HJ, Chen R. Goal specificity or ambiguity? Effects of self-quantification on persistence intentions. J Res Interact Mark. 2021. doi:10.1108/JRIM-07-2021-0181
13. Bandura A. Human agency in social cognitive theory. Am Psychol. 1989;44(9):1175–1184. doi:10.1037/0003-066X.44.9.1175
14. Zhu Z, Zhao J. The decision-making behavior of e-business adoption in organizational level: an empirical study from social cognitive theory. Nankai Bus Rev. 2011;14(3):151–160.
15. Bandura A. The explanatory and predictive scope of self-efficacy theory. J Soc Clin Psychol. 1986;4(3):359–373. doi:10.1521/jscp.1986.4.3.359
16. Locke EA. Social foundations of thought and action: a social-cognitive view. Acad Manage Rev. 1987;12(1):169–171.
17. Lin HC, Chang CM. What motivates health information exchange in social media? The roles of the social cognitive theory and perceived interactivity. Inform Manage. 2018;55(6):771–780. doi:10.1016/j.im.2018.03.006
18. Lim JS, Choe MJ, Zhang J, Noh GY. The role of wishful identification, emotional engagement, and parasocial relationships in repeated viewing of live-streaming games: a social cognitive theory perspective. Comput Human Behav. 2020;108:1–10. doi:10.1016/j.chb.2020.106327
19. Wu D, Gu H, Gu SY, You H. Individual motivation and social influence: a study of telemedicine adoption in China based on social cognitive theory. Health Policy Technol. 2021;10(3):1–10. doi:10.1016/j.hlpt.2021.100525
20. Zhou JJ, Fan TT. Understanding the factors influencing patient e-health literacy in online health communities (OHCs): a social cognitive theory perspective. Int J Environ Res Public Health. 2019;16(14) :1–12.
21. Voskuil VR, Robbins LB. Youth physical activity self-efficacy: a concept analysis. J Adv Nurs. 2015;71(9):2002–2019. doi:10.1111/jan.12658
22. Zhao Y, Ni Q, Zhou RX. What factors influence the mobile health service adoption? A meta-analysis and the moderating role of age. Int J Inf Manage. 2018;43:342–350. doi:10.1016/j.ijinfomgt.2017.08.006
23. Stiglbauer B, Weber S, Batinic B. Does your health really benefit from using a self-tracking device? Evidence from a longitudinal randomized control trial. Comput Human Behav. 2019;94:131–139. doi:10.1016/j.chb.2019.01.018
24. Brinson NH. Fit or Fail? Examining the Impact of Quantified Self Health and Fitness Tracking Technologies and Data Collection on College Youth [dissertation]. Asutin: The University of Texas; 2017.
25. Singelis TM. The measurement of independent and interdependent self-construals. Pers Soc Psychol Bull. 1994;20(5):580–591. doi:10.1177/0146167294205014
26. Markus HR, Kitayama S. Culture and the self: implications for cognition, emotion, and motivation. Psychol Rev. 1991;98(2):224–253. doi:10.1037/0033-295X.98.2.224
27. Liu J. Internet-Based Knowledge Sharing Services: Investigations of Self-Construal and Sharing Behavior [dissertation]. Beijing: Tsinghua University; 2014.
28. Kim JH, Kim MS, Nam Y. An analysis of self-construals, motivations, facebook use, and user Satisfaction. Int J Hum-Comput Int. 2010;26(11–12):1077–1099. doi:10.1080/10447318.2010.516726
29. Rooksby J, Rost M, Morrison A, Chalmers M, editors. Personal tracking as lived informatics.
30. Martinko MJ, Gundlach MJ, Douglas SC. Toward an integrative theory of counterproductive workplace behavior: a causal reasoning perspective. Int J Select Assess. 2002;10(1/2):36–50. doi:10.1111/1468-2389.00192
31. Li Y, Guo YK. Wiki-health: from quantified self to self-understanding. Future Gener Comp Sy. 2016;56:333–359. doi:10.1016/j.future.2015.08.008
32. Franque FB, Oliveira T, Tam C, Santini FD. A meta-analysis of the quantitative studies in continuance intention to use an information system. Internet Res. 2020;31(1):123–158. doi:10.1108/INTR-03-2019-0103
33. Swan M. The quantified self: fundamental disruption in big data science and biological discovery. Big Data. 2013;1(2):85–99. doi:10.1089/big.2012.0002
34. Choe EK, Lee NB, Lee B, Pratt W, Kientz JA, editors. Understanding quantified-selfers’ practices in collecting and exploring personal data.
35. Pirzadeh A, He L, Stolterman E, editors. Personal informatics and reflection: a critical examination of the nature of reflection.
36. Cho H, Yoon H, Kim KJ, Shin DH, editors. Wearable health information: effects of comparative feedback and presentation model.
37. Petkov P, Köbler F, Foth M, Krcmar H, editors. Motivating domestic energy conservation through comparative, community-based feedback in mobile and social media.
38. Fawcett T. Mining the quantified self: personal knowledge discovery as a challenge for data science. Big Data. 2015;3(4):249–266. doi:10.1089/big.2015.0049
39. Consolvo S, Everitt K, Smith I, Landay JA, editors. Design requirements for technologies that encourage physical activity.
40. Cross SE, Hardin EE, GercekSwing B. The what, how, why, and where of self-construal. Pers Soc Psychol Rev. 2011;15(2):142–179. doi:10.1177/1088868310373752
41. Yao Q, Chen R, Zhao P. The influence of self-construals on the imagery advertising strategy. Acta Psychol Sin. 2011;43(6):674–683.
42. Afsar B, Badir YF, Saeed BB. Transformational leadership and innovative work behavior. Ind Manage Data Syst. 2014;114(8):1270–1300. doi:10.1108/IMDS-05-2014-0152
43. Liu Y. Self-construal: review and prospect. Adv Psychol Sci. 2011;19(3):427–439.
44. Konrath S, Bushman BJ, Grove T. Seeing my world in a million little pieces: narcissism, self-construal, and cognitive-perceptual style. J Pers. 2009;77(4):1197–1228. doi:10.1111/j.1467-6494.2009.00579.x
45. Kang C, Zhou AB. The effect of the representational mode of information and learners’ cognitive style on learning in the multimedia environment. Psychol Sci. 2010;33(6):1397–1400.
46. Kühnen U, Hannover B, Schubert B. The semantic-procedural interface model of the self: the role of self-knowledge for context-dependent versus context-independent modes of thinking. J Pers Soc Psychol. 2001;80(3):397–409. doi:10.1037/0022-3514.80.3.397
47. Kühnen U, Oyserman D. Thinking about the self influences thinking in general: cognitive consequences of salient self-concept. J Exp Soc Psychol. 2002;38(5):492–499. doi:10.1016/S0022-1031(02)00011-2
48. Krishna A, Zhou RR, Zhang S. The effect of self-construal on spatial judgments. J Consum Res. 2008;35(2):337–348. doi:10.1086/588686
49. Xiong SH. A Impulse Buying Study Based on Personality Trait: The Roles of Regulatory Focus & Self-Contrual [dissertation]. Wuhan: Huazhong University of Science & Technology; 2009 .
50. Kim Y, Sundar SS. Visualizing ideal self vs. actual self through avatars: impact on preventive health outcomes. Comput Human Behav. 2012;28(4):1356–1364. doi:10.1016/j.chb.2012.02.021
51. Guo L. Quantified-self 2.0: using context-aware services for promoting gradual behaviour change. Working Papers of Computers Society; 2016:1–18. Available from: https://arxiv.org/abs/1610.00460.
 © 2022 The Author(s). This work is published and licensed by Dove Medical Press Limited. The full terms of this license are available at https://www.dovepress.com/terms.php and incorporate the Creative Commons Attribution - Non Commercial (unported, v3.0) License.
By accessing the work you hereby accept the Terms. Non-commercial uses of the work are permitted without any further permission from Dove Medical Press Limited, provided the work is properly attributed. For permission for commercial use of this work, please see paragraphs 4.2 and 5 of our Terms.
© 2022 The Author(s). This work is published and licensed by Dove Medical Press Limited. The full terms of this license are available at https://www.dovepress.com/terms.php and incorporate the Creative Commons Attribution - Non Commercial (unported, v3.0) License.
By accessing the work you hereby accept the Terms. Non-commercial uses of the work are permitted without any further permission from Dove Medical Press Limited, provided the work is properly attributed. For permission for commercial use of this work, please see paragraphs 4.2 and 5 of our Terms.