")
Back to Journals » International Journal of Nanomedicine » Volume 17
The Effect of Particle Size on the Absorption of Cyclosporin A Nanosuspensions
Authors Sun W, Gao J , Fan R, Zhang T, Tian Y, Wang Z , Zhang H, Zheng A
Received 8 January 2022
Accepted for publication 4 April 2022
Published 19 April 2022 Volume 2022:17 Pages 1741—1755
DOI https://doi.org/10.2147/IJN.S357541
Checked for plagiarism Yes
Review by Single anonymous peer review
Peer reviewer comments 6
Editor who approved publication: Dr Phong A Tran
Wenjun Sun,1 Jing Gao,1 Ranran Fan,2 Ting Zhang,3 Yang Tian,1 Zengming Wang,1 Hui Zhang,1 Aiping Zheng1
1Department of Pharmaceutics, Institute of Pharmacology and Toxicology, Academy of Military Medical Sciences, Beijing, People’s Republic of China; 2Bengbu Medical College, Bengbu, People’s Republic of China; 3School of Basic Medical Sciences, Zhengzhou University, Zhengzhou, People’s Republic of China
Correspondence: Hui Zhang; Aiping Zheng, Department of Pharmaceutics, Institute of Pharmacology and Toxicology, Academy of Military Medical Sciences, Beijing, People’s Republic of China, Tel +86 10 66931694, Email [email protected]; [email protected]
Background: Cyclosporin A (CsA) is a hydrophobic drug widely used as an immunosuppressant and anti-rejection drug in solid organ transplantation. On the market, there are two oral CsA formulations available containing polyoxyethylene castor oil, which can cause serious allergic reactions and nephrotoxicity. In order to eliminate polyoxyethylene castor oil, CsA was formulated into a nanosuspension. This study aimed to design an oral cyclosporin A nanosuspensions (CsA-NSs) and investigate the effect of particle size on absorption of CsA-NSs.
Methods: CsA-NSs were prepared using a wet bead milling method. Particle size, morphology and crystallinity state of CsA-NSs were characterized. The in vitro dissolution, the intestinal absorption properties and pharmacokinetic study of CsA-NSs were investigated.
Results: CsA-NSs with sizes of 280 nm, 522 nm and 2967 nm were prepared. The shape of CsA-NSs with smaller size was similar to that of spheres. The crystallinity of CsA in nanocrystals was reduced. The dissolution rate of CsA-NSs (280 nm) was greater than that of CsA-NSs (522 nm) and CsA-NSs (2967 nm). CsA-NSs (280 nm) showed higher absorption rate constants (Kα) and effective permeability coefficients (Peff) of different intestinal segments compared with that of CsA-NSs (522 nm) and CsA-NSs (2967 nm). AUC0-48h of 280 nm CsA-NSs was about 1.12-fold of that of 522 nm CsA-NSs, and about 1.51-fold of that of 2967 nm CsA-NSs. In particular, the particle size of CsA-NSs was nanoscale, and their bioavailability was bioequivalent with marked self-microemulsion (Sandimmun Neoral®).
Conclusion: It is feasible to prepare CsA-NSs. The dissolution rate, gastrointestinal transport properties and the oral absorption of CsA-NSs were promoted by reducing size. Considering the cost, efficiency and energy consumption, there should be an optimal particle size range in industrial production.
Keywords: wet bead milling, in vitro dissolution, in situ single-pass intestinal perfusion, pharmacokinetics
Introduction
Cyclosporin A (CsA) is a lipophilic polypeptide of 11 amino acids with a molecular weight of 1202.61 g/mol, which is widely used as an immunosuppressant and anti-rejection drug in solid organ transplantation.1 CsA is classified as BCS IV drugs (low solubility/low permeability) according to the biopharmaceutics classification system. Due to the poor aqueous solubility (6.6 µg/mL) and poor intestinal permeability (p-glycoprotein substrates),1,2 it is difficult to produce an oral formulation for CsA. Two oral self-microemulsion formulations of CsA are available, marketed as Sandimmune® and Neoral®, composed of a high concentration of polyoxyethylated castor oil (Cremophor® EL, up to 38 w/w%).3 In particular, Neoral® shows relatively high therapeutic oral bioavailability with reduced variability. However, Cremophor® EL has been identified as an unsafe oil composition that produces hypersensitivity, nephrotoxic and other adverse effects in vivo. Therefore, different strategies have been designed to develop an effective and safe oral formulation of CsA.
According to the Noyes-Whitney and Ostwald-Freundlich equations, reduction of particle size of drugs from micrometer to submicron or nanometer is one successful approach for improving solubility and enhancing dissolution rate of poorly soluble drugs.4,5 Formulating poorly soluble drugs into nanosuspensions is an effective method to improve oral bioavailability of insoluble drugs. Drug nanosuspensions consist of pure drug particles with sizes with particle sizes ranging from dozens to hundreds of nanometers, and small amount of stabilizers.6,7 The particle size is one of the great important properties of nanoparticles. It has been reported that the size of nanosuspensions can affect the dissolution rate in vitro and pharmacokinetics in vivo.8,9
Currently, the most nanosuspensions drugs are oral administration on the market or in clinical research. The enhancement in oral bioavailability can be attributed to the increased solubility and dissolution rate and improved bioadhesion of nanocrystals.10 For example, the release rate and bioavailability of 160 nm betulinic acid nanosuspensions were higher than that of 400 nm and 700 nm betulinic acid nanosuspensions due to the increased solubility and dissolution rate.11 The size also affects the efficiency and mechanism of cellular uptake.12,13 Rejman13,14 et al investigated the effect of particle size on the pathway of entry in non-phagocytic B16 cells, the results showed that internalization of microspheres with a diameter < 200 nm involved clathrin-coated pits, for particles of 500 nm in size, caveolae-mediated internalization became predominant pathway of entry.
Compared with matrix nanoparticles, such as polymeric nanoparticles, liposomes and solid lipid nanoparticles, nanosuspensions offer almost 100% drug loading15 and reduced fasted/fed state variation.16,17 Nanosuspensions also provide more options for dosage forms, such as capsules and tablets or injection freeze-dried powder solidified by spray drying, freeze drying and fluidized bed drying, as well as better commercialization potential due to simple operation and easy industrial production of preparation methods.18,19
Considering the above factors, CsA was formulated into nanosuspensions. In the present study, CsA-NSs were prepared by a wet bead milling method with particle sizes of 280 nm, 522 nm and 2967 nm. The physical stability of particle size of CsA-NSs was investigated under simulated human gastrointestinal conditions. Then, the dissolution rates in vitro of CsA-NSs were investigated. The intestinal absorption properties of CsA-NSs were investigated by in situ single-pass intestinal perfusion model in SD rats. The absorption properties in vivo of CsA-NSs with different particle sizes were studied in SD rats.
Materials and Methods
Materials
Cyclosporin A (CsA) was purchased from Taishang Chemical Pharmacy Company (Taishang, China). Cyclosporin D (CsD) was purchased from Shanghai Tongtian Biotechnology Company (Shanghai, China). Neoral® (Cyclosporine soft gelatin capsules) was purchased from a local drugstore. Vitamin E polyethylene glycol succinate (TPGS) was purchased from Shanghai Aladdin Biochemical Technology Co., Ltd. (Shanghai, China). Sodium dodecyl sulfate (SDS) was purchased from BASF, Ludwigshafen, Germany. Hydroxypropyl cellulose (HPC) was purchased from Nippon Soda Co., Ltd. (Tokyo, Japan). Simulated intestinal fluid (SIF) and simulated gastric fluid (SGF) were purchased from Shanghai Yuanye Bio-Technology Co., Ltd. (Shanghai, China). The purified water used in this study was prepared using a Milli-Q system (EMD Millipore, Billerica, MA, USA). HPLC-grade acetonitrile and methanol were obtained from Thermo Fisher Scientific (Waltham, MA, USA). All the other reagents were of analytical grade.
Preparation of CsA-NSs with Different Particle Sizes
CsA-NSs with different particle sizes were prepared by the wet bead milling method. HPC (7.5 g), TPGS (1.0 g) and SDS (0.1 g) were dissolved in deionized water (100 mL) to form a surfactant solution. CsA (15 g) was added to the surfactant solution and stirred at 300 rpm with a magnetic agitator. The uniform CsA suspensions with the surfactants were prepared by a high-shear apparatus (Ultra Turrax, T25, IKA, Staufen, Germany) at 10,000 rpm for 5 min. The uniform suspensions were then milled using a grinding machine (Dyno®-Mill Research Lab, WAB, Switzerland) at 1500, 2000, and 2500 rpm for 5 min, followed by 3000 rpm for 2.0 h to prepare CsA-NSs with different particle sizes. In this study, 0.3 mm yttrium-stabilized zirconium beads were used as milling media. The volume of the grinding bead was 48 mL and accounts for 80% of the grinding cavity.
In vitro Characterization of CsA -NSs
Particle Characterization
The CsA-NSs samples were diluted in water to a suitable concentration. The mean particle size (MPS) and polydispersity index (PDI) of CsA-NSs with smaller particle sizes were detected by photon correlation spectroscopy (PCS), using a Malvern Zetasizer (ZS-90; Malvern Instruments, Malvern, UK). Potentially larger particles or aggregates cannot be detected by PCS. So, the median diameter (D50) of CsA-NSs with larger particle sizes was analyzed by laser diffractometry (LD) using a Mastersizer (2000; Malvern Instruments, Malvern, UK). The zeta potential of CsA-NSs was detected using a Malvern Zetasizer (ZS-90; Malvern Instruments, Malvern, UK). The optical parameters of cyclosporin A were as follows: real refractive index (RI) 1.49 and imaginary refractive index (IRI) 0.03.20 D50 will also be referred to as MPS for ease of description in the following article.
Morphology
The morphologies of CsA-NSs were examined by scanning electron microscopy (SEM) (JSM-7900F, JEOL, Japan). The samples were dried and coated with gold before determination. In addition, transmission electron microscopy (TEM) (JEM 2010, JEOL, Japan) was used to determine the morphologies of CsA-NSs. A drop of the CsA-NSs was placed on the surface of a copper grid, and the excess liquid vehicle was drained onto a piece of filter paper.
Powder X-Ray Diffraction (PXRD)
The crystallinity state of CsA in raw CsA powder and CsA-NSs was analyzed with a diffractometer (D8-Advance, Bruker, Germany). The scanning rate of 2°/min over a 2θ range of 5–45° was performed. Samples investigated using PXRD analysis were the same batch as those used in DSC analysis.
Differential Scanning Calorimetry (DSC)
The thermal behavior of CsA, the excipients (HPC, TPGS and SDS), the physical mixture (raw CsA and stabilizers), and the CsA-NSs were analyzed with a differential scanning calorimetry (NETZSCH, Germany). Accurately weighted samples of 3 mg were placed in open aluminium pans, and DSC scans were recorded at a heating rate of 10 K/min from 20°C to 200°C under nitrogen purge gas flow (20 mL/min). An empty pan was used as reference.
Particle Size Stability Studies in Different Environments
This study aimed to investigate on the absorption of cyclosporin A nanosuspensions. Therefore, it is necessary to investigate the stability of particle size in experimental processes. The stability of the particle size of all the nanosuspensions was studied at 4°C and room temperature. The stability of the particle size of CsA-NSs was also investigated in Krebs–Henseleit buffer (KB), SGF and SIF at 37°C for 4 h, 2 h and 12 h, respectively. MPS of all samples were analyzed in triplicate and reported as the standard deviation.
Equilibrium Solubility of the Drug
The equilibrium solubility of coarse CsA and CsA-NSs during 48 h were evaluated in water, hydrochloric acid pH 1.2, phosphate buffer pH 4.5 and phosphate buffer pH 6.8. In this study, excess amount of coarse CsA and CsA-NSs was dispersed in a centrifuge tube (50 mL), containing 30 mL of the medium, by shaking at 100 rpm at 37 ± 0.5°C in a thermostatic oscillator (Tianjin Honour Instrument, Co. Ltd., China). After 48 h, 5 mL samples were withdrawn and filtered through a 0.22-µm syringe filter. Equilibrium solubility tests were performed in triplicate (n = 3). 20 µL of filtrate was injected into the HLPC system for analysis.
In vitro Dissolution
A dissolution study was done by Chinese Pharmacopoeia Specifications (Paddle method, RC1207DP, Tianda Tianfa Technology Co. Ltd., Tianjin, China), using 900 mL of water, hydrochloric acid solution of pH 1.2, phosphate buffer of pH 4.5 and phosphate buffer of pH 6.8 as the dissolution medium. The temperature was maintained at 37 ± 0.5°C and stirred at 100 rpm. Samples (5 mL) were withdrawn and replaced with the equal volume of fresh medium at predetermined time intervals (5, 10, 20, 30, 40, 50, 60 min). The samples were filtered through a membrane filter of 0.22 µm pore size (Tianjin Jinteng Experimental Equipment, Co. Ltd., Tianjin, China) and filtrate was collected. The experiments were conducted in triplicate (n = 3). 20 µL of filtrate was injected into HLPC system for analysis.
HPLC Analysis
The content of CsA in filtrate was assayed by a HPLC (1640, Agilent, USA). The absorbance wavelength was set at 214 nm. The mobile phase was a mixture of phosphate acid (pH 2.5) solution and acetonitrile at a 10:90 v/v. A CAPCELL PAK C18 column (5 µm, 4.6 mm × 250 mm, Shiseido, Japan) was used with a flow rate of 1 mL/min and the column temperature was maintained at 70°C using a column heater.
The HPLC method was validated for the determination of CsA. A calibration curve (1.0–100.0 µg/mL) was prepared using seven calibration standards with a correlation coefficient value of 0.999. The detection limit and quantification limit were 0.25 µg/mL and 0.5 µg/mL, respectively.
In situ Single-Pass Intestinal Perfusion and in vivo Pharmacokinetic Studies
Animal Experiments
Male Sprague-Dawley rats (weighing 220 ± 20 g) were supplied by Beijing Keyu Animal Breeding Center (Beijing, China). All animal studies were performed according to the Guidelines for the Care and Use of Laboratory Animals and were approved by the Animal Ethics Committee at Beijing Institute of Pharmacology and Toxicology. The rats were acclimatized under standard conditions at a room temperature of 25 ± 2°C and a relative humidity of 40–60% under natural light/dark conditions for 1 week and had free access to diet and water. Food was withdrawn 12 h prior to beginning the study.
In situ Single-Pass Intestinal Perfusion Model
Nine male SD rats were randomly and equally divided into 3 groups: 280 nm-CsA-NSs, 500 nm-CsA-NSs and 2967 nm-CsA-NSs. The experimental setup is illustrated in Scheme 1. After overnight fasting, SD rats were anaesthetised by intraperitoneal injection of urethane (1g/kg bodyweight), and additional anaesthetic was administered if required. Cannulations were made at the duodenum (1 to 11 cm downward from the pylorus), jejunum (15 to 25 cm downward from the pylorus), ileum (0 to 10 cm upward from the caecum) and colon (0 to 10 cm downward from the caecum) of anesthetized SD rats. The intestinal content was removed with physiological saline until the effluent became clear. Absorbent gauze with soaking saline was placed on the intestine tissue to minimize dehydration, and the tested animal was warmed by a heat lamp. Krebs–Henseleit buffer21 containing CsA-NSs (40 µg/mL CsA), which was maintained at 37°C in a water bath by stirring, was perfused along the bowel through the cannula at a flow rate of 0.20 mL/min. After a stabilization period of 30 min, the perfusate samples were collected into pre-weighed 5.0 mL vials every 20 min for 6 times. The mercy killing of the animals was exercised with saturated ether. The intestines were cut and the lengths were measured.
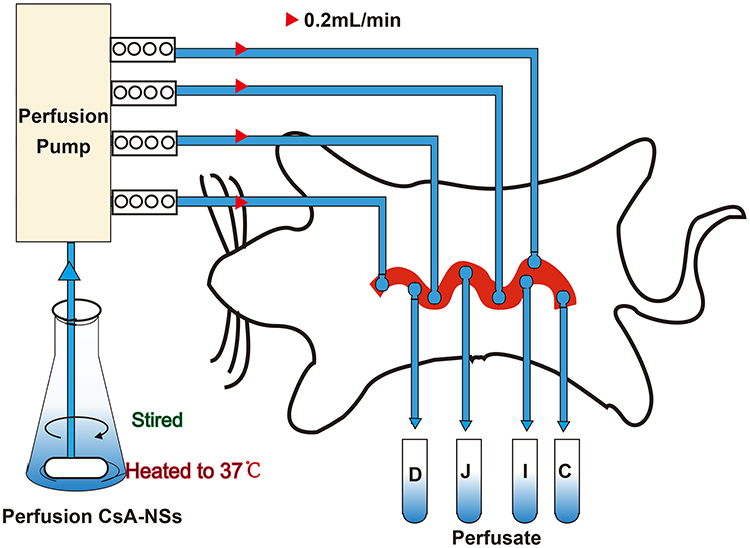 |
Scheme 1 Schematic diagram of in situ single-pass intestinal perfusion model. D: Perfusate from duodenum; J: perfusate from jejunum; I: perfusate from ileum; C: perfusate from colon. |
Sample Preparation
200 µL acetonitrile was added into 50 µL of the intestinal perfusate sample followed by 1 min vortex mixing, then the sample was centrifuged at 14,000 × g for 15 min to obtain the supernatant. 20 µL supernatant was injected into the column for HPLC analysis. HPLC conditions are the same as above.
Data Analysis of in situ Single-Pass Intestinal Perfusion Model
Due to the absorption of drugs and water in the intestinal segment, the volume of the perfusate and the concentration of CsA change. In this experiment, gravimetric analysis was used to correct the inflow and outflow volumes of the perfusate to eliminate the influence on the volume change. The density of the samples was calculated by weight/volume. The absorption rate constants (Kα) and effective permeability coefficients (Peff) of CsA-NSs across rat intestine were calculated based on the disappearance of the drug in perfusate using the following equations:22,23
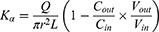
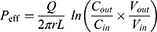


where Q is the flow rate of the drug through the intestine (0.2 mL/min); r is the radius of the rat intestine, and L is the length of intestinal segment perfused after completion of the perfusion experiment. Cin, Cout, min and mout are the drug concentration (µg/mL) and quality (g) of the perfusate entering and exiting the intestinal segment, respectively.
In vivo Pharmacokinetic Studies
Twenty-four healthy male SD rats were randomly and equally divided into 4 groups. Two hundred and eighty nm-CsA-NSs, 522 nm-CsA-NSs, 2967 nm-CsA-NSs and the contents of Neoral® microemulsion capsule were suspended in water, then the suspensions were orally administered to four groups of rats, respectively, at a 25 mg/kg dose level. Orbital blood collection is an important experimental technique in pharmacokinetics. Compared with the tail cutting and tail cutting blood collection, it has the advantages of high blood collection volume, continuous blood collection and not easy to be polluted. Thus, the orbital blood collection was used to collected blood (0.2 mL) at predetermined time points (0.25 h, 0.5 h, 1 h, 1.5 h, 2 h, 3 h, 4 h, 6 h, 8 h, 12 h, 24 h, 36 h and 48 h) into EDTA-K2 surface-coated tubes and stored at −80°C.
Sample Preparation
A 10 μL aliquot of CsD (200 ng/mL) solution as the internal standard (IS) was added into a 50 µL blood sample and vortexed for 1 min. A 200 µL aliquot of acetonitrile was added to the mixture sample and vortex-mixed for 1 min. The mixture was centrifuged at 14,000 × g for 15 min to obtain supernatant. 5 μL of the supernatant was injected into the column for LC-MS/MS analysis.
LC-MS/MS Condition
CsA concentration in the blood was measured using an Agilent 6460A (CA, USA) triple quadrupole LC-MS/MS system with an Agilent 1200 series combined LC system. The Agilent source parameters were a capillary voltage of 4500 V, gas temperature was 180°C, gas flow was 13 L/min, nebulizer gas pressure was 18 psi. The mass transitions were m/z 1219.7 →1202.8 for CsA (fragmentor voltage 180 V, collision energy 30 eV), m/z 1233.8 → 1216.8 for CsD (fragmentor voltage 180 V, collision energy 30 eV). The autosampler temperature was set at 10°C and the column oven temperature was set at 60°C. Analyses were performed with a 3 μm 100 × 2.1 mm Thermo HyPURITY C18 analytical column (MA, USA). The mobile phase consists of 90% methanol and 10% 10 mM ammonium formate buffer (pH 3.5) with a flow of 0.3 mL/min and a run time of 3.0 min.
The LC-MS/MS method was validated for the determination of CsA in rat blood. A calibration curve (0.01–2.5 µg/mL in blood) was prepared with a correlation coefficient value of 0.998. The detection limit and quantification limit were 0.5 ng/mL and 1.0 ng/mL, respectively.
Statistical Analysis
All the results were expressed as mean ± SD. The data were analyzed using the Student’s t-test. Values of p < 0.05 was considered statistically significant for all tests.
Results and Discussions
Size Distribution
The size distribution of CsA-NSs was measured by DLS. As seen in Figure 1, the MPS and PDI became smaller with prolongation of grinding time. Within 5 min, at a speed of 1500 rpm, MPS reduced to approx 3000 nm. With continuation of the milling, CsA-NSs with 522 nm and 280 nm were obtained after 30 min and 105 min at a speed of 3000 rpm, respectively. PDI decreased from 0.541 to 0.111. It was observed that particle size no longer decreased when prolonging the milling time above 105 min. And the zeta potential remained at about −20 mV during the grinding process. During grinding, the strong shear force and attrition force of the yttrium-stabilized zirconium oxide grinding beads in the wet media mill significantly impacted upon the macroparticles and broke them into multiple microparticles. These microparticles were further broken into small uniform nanoparticles by prolongation of grinding time. The CsA-NSs with 280 nm, 522 nm and 2967 nm formulation were chosen for further study.
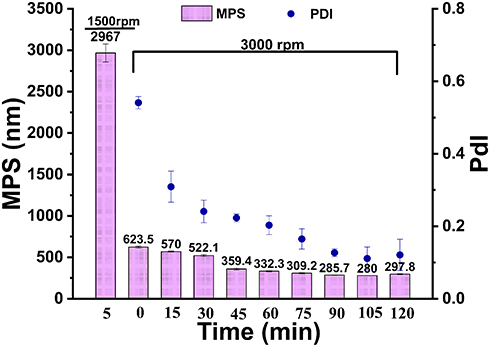 |
Figure 1 Mean particle size (MPS) and polydispersity index (PDI) as a function of milling time for cyclosporin A, (n = 3). |
Surface Morphology of CsA-NSs
The morphology of CsA-NSs was shown in Figures 2 and 3. The results showed that CsA-NSs with particle size of 280 nm had near spheroid and uniform particle structures (Figures 2A and 3A). CsA-NSs of 522 nm had both of near spheroid and large chunks particle structures (Figures 2B and 3B). Figures 2C and 3C show that CsA-NSs with a particle size of 2967 nm were massive and irregular in shape. The particle size of the nanocrystals was basically identical to the results of size distribution.
 |
Figure 2 SEM of CsA-NS of 280 nm (A), 522 nm (B), 2967 nm (C). Magnification = 10000 ×. |
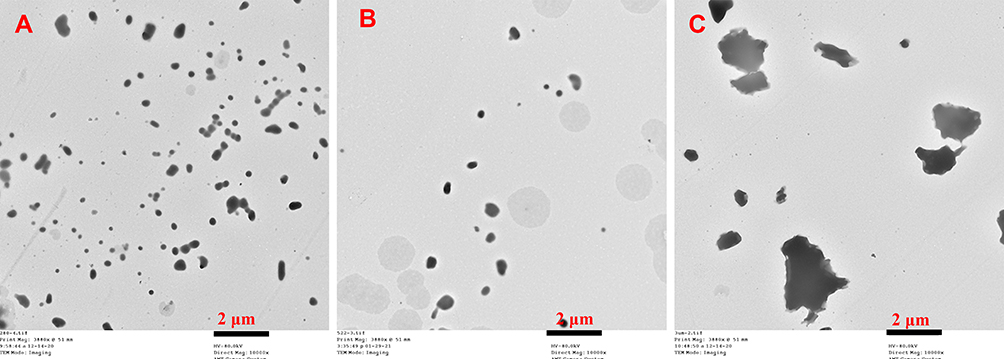 |
Figure 3 TEM of CsA-NS of 280 nm (A), 522 nm (B), 2967 nm (C). Magnification = 10000 ×. |
PXRD
Besides the size and distribution, the crystalline or polymorphic nature of CsA-NSs is a very critical parameter. The XRPD patterns of raw material and processed nanoparticles are shown in Figure 4. X-ray diffractograms of pure CsA particles and the physical mixture showed obvious peaks and revealed that most of the raw CsA particles were present in crystalline form. However, the intensity of the diffraction peaks of the CsA-NSs was decreased compared to those of the raw CsA particles, and the intensity reflects the material’s crystallization strength. This illustrated that the crystallinity of CsA-NSs was lower than that of the raw CsA particles without any processing. The same peak direction of the raw material and processed nanoparticles proved that stabilizers did not affect the physical characteristics.24
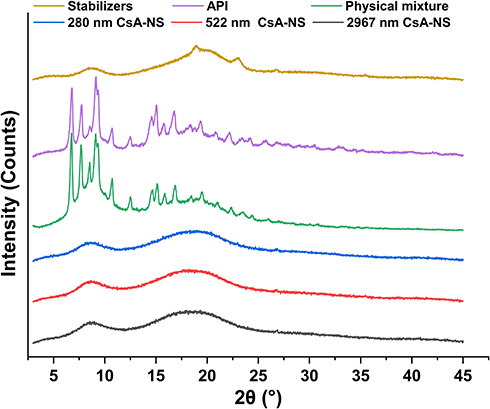 |
Figure 4 X-ray diffraction patterns of stabilizers, API, physical mixture, 280 nm CsA-NS, 522 nm CsA-NS and 2967 nm CsA-NS. |
DSC
DSC analysis was also performed to further investigate the crystalline state of CsA-NSs. DSC thermograms of stabilizers, raw CsA, physical mixture (raw CsA and stabilizers), and powder of CsA-NSs are shown in Figure 5. The DSC thermogram of raw CsA showed a weak endothermic peak at approximately 107–132°C25 and revealed that there was some crystalline structure in raw CsA. The peak of pure CsA was not observed in the thermogram of the physical mixture, which showed obvious influence from stabilizers. The DSC thermograms of the CsA-NSs showed no melting point as pure CsA but a gentle exothermic peak at approximately 80°C, which presents crystallization process and indicates that most of CsA occurs in an amorphous form in CsA-NSs. The DSC thermograms of stabilizers and physical mixture showed sharp transitions at 37°C, which correspond to the melting points of TPGS (37–41°C),26 but this peak is absent in CsA-NSs. The reason for this phenomenon was that TPGS was spread out and absorbed by the surface of nanoparticles.
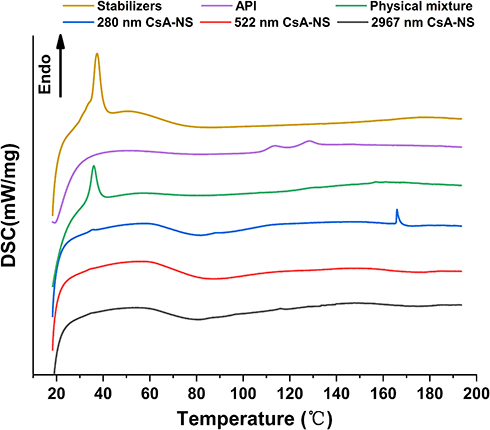 |
Figure 5 DSC diffraction patterns of stabilizers, API, physical mixture, 280 nm CsA-NS, 522 nm CsA-NS and 2967 nm CsA-NS. |
Particle Size Stability in Different Environments
As shown in Figure 6, no significant changes in MPS of the CsA-NSs were observed within three months 4°C and room temperature (RT), indicating that the particle size of CsA-NSs was sufficiently stable for storage. The particle size of the CsA-NSs increased only slightly after the CsA-NSs mixed with KB, SGF and SIF at 37°C for 4 h, 2 h and 12 h, respectively, which suggested that the particle size of CsA-NSs remained stable in the whole experimental process.
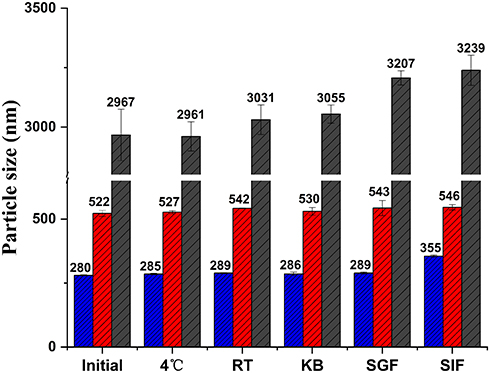 |
Figure 6 Particle size stability of CsA-NSs in different condition. Initial: 0 day after preparation; 4 ℃: stored at 4 °C for 3 months; RT: stored at room temperature for 3 months; KB: mixed with KB at 37 ℃ for 4 h; SGF: mixed with SGF at 37 ℃ for 2 h; SIF: mixed with SIF at 37 ℃ for 12 h, (n = 3). |
Solubility and Dissolution Studies
Equilibrium solubility study can represent the saturation solubility of CsA within a non-sink condition in a 48-h period. As illustrated in Table 1, there was a significant increase (p < 0.01) in equilibrium solubility of CsA-NSs compared to coarse CsA (about 2-fold increase in equilibrium solubility). Moreover, 280 nm CsA-NS has significant increase (p < 0.05) compared to 3000 nm CsA-NSs in hydrochloric acid pH 1.2. For phosphate buffer pH 4.5 and phosphate buffer pH 6.8, the equilibrium solubility of 280 nm CsA-NSs and 522 nm CsA-NSs was significantly higher (p < 0.05) than that of 3000 nm CsA-NSs. These results indicate that the increase in equilibrium solubility may be caused by the solubilization of stabilizer and the reduction of particle size according to Ostwald Freundlich equation. Meanwhile, the equilibrium solubility of CsA-NSs in hydrochloric acid pH 1.2 was lower than that in the other three media, but the equilibrium solubility of coarse CsA remained unchanged, which indicated that the solubilization of stabilizers decreased in acidic environment.
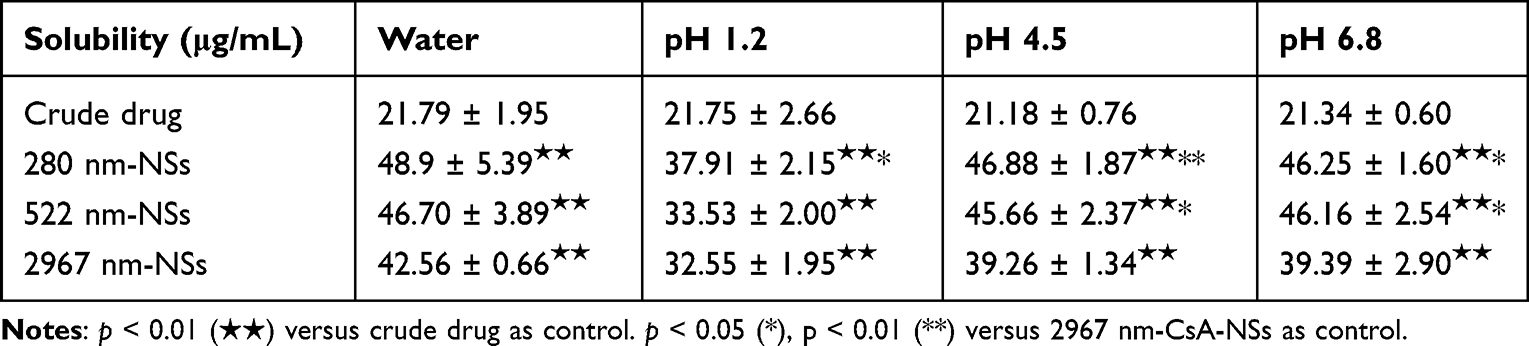 |
Table 1 Coarse CsA and CsA-NSs Solubility in Water, Hydrochloric Acid pH 1.2, Phosphate Buffer pH 4.5 and Phosphate Buffer pH 6.8 (n = 3, Means ± SD) |
The dissolution profiles of CsA-NSs with different particle sizes were evaluated in four kinds of medium: water, hydrochloric acid pH 1.2, phosphate buffer pH 4.5 and phosphate buffer pH 6.8. As shown in Figure 7A, 280 nm CsA-NSs showed the highest dissolution rate (89.8% in the first 10 min), while the release percentage of CsA from 522 to 2967 nm CsA-NSs were approximately 80.7% and 69.6% within 10 min, respectively, in water. For hydrochloric acid pH 1.2 (Figure 7B), phosphate buffer pH 4.5 (Figure 7C) and phosphate buffer pH 6.8 (Figure 7D), although the final dissolution degree and release trend of CsA-NSs are consistent, the dissolution rate is slower than that of water. As shown in Figure 7B, 280 nm CsA-NSs also showed the highest dissolution rate (85.9% in the first 10 min), while the release percentage of CsA from 522 to 2967 nm CsA-NSs were approximately 78.6% and 71.6% within 10 min, respectively. This was due to the solubilization of stabilizers decreased in acidic environment. As shown in Figure 7C and D, in phosphate buffer, the dissolution rate decreased further. The release percentage of CsA from 280 nm, 522 nm and 2967 nm CsA-NSs were approximately 78.3%, 68.3% and 62.6% within 10 min, respectively, in phosphate buffer pH 4.5. The release percentage of CsA from 280 nm, 522 nm and 2967 nm CsA-NSs were approximately 81.2%, 70.3% and 64.7% within 10 min, respectively, in phosphate buffer pH 6.8. This is because the phosphate decreased the solubility of CsA (During the experiment, it was found that the cause was unknown). In general, the dissolution rate of CsA-NSs followed a particle size-dependent dissolution trend. Faster dissolution rate of CsA in nanocrystals with smaller particle size might be attributed to the increase in surface area and surface energy.
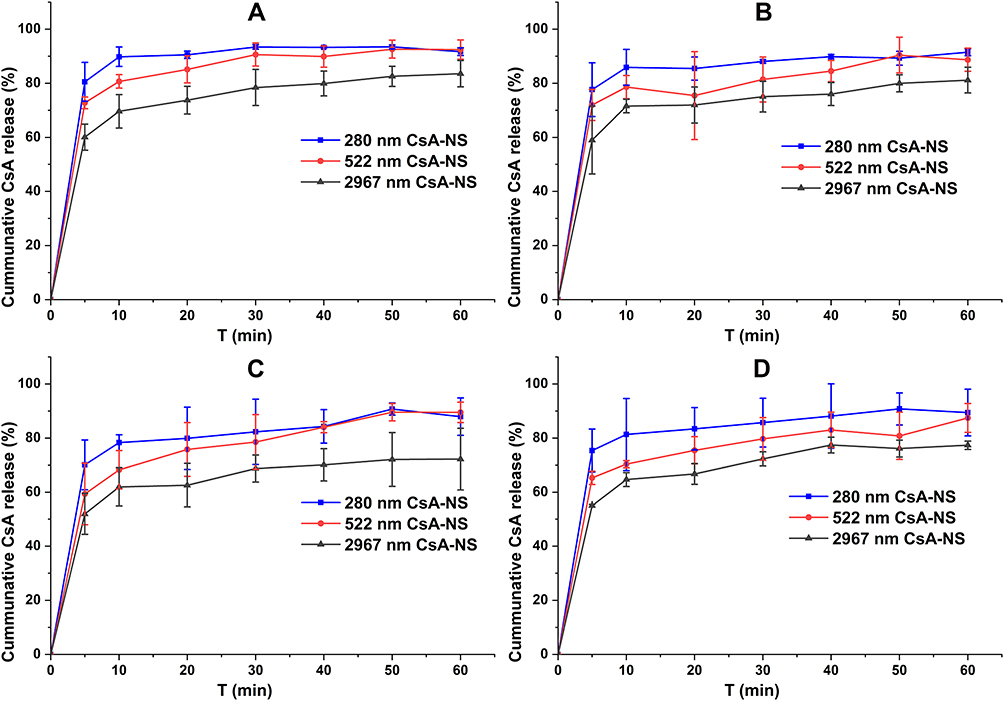 |
Figure 7 In vitro drug release testing of different sized (280 nm, 522 nm, and 2967 nm) nanosuspensions in water (A), pH 1.2, hydrochloric acid (B), pH 4.5, phosphate buffer (C) and pH 6.8, phosphate buffer (D). (USP apparatus II with paddles at 100 rpm, n = 3). |
In situ Single-Pass Intestinal Perfusion
In situ single-pass intestinal perfusion models address the complexity of intestinal processes, which eventually determine in vivo intestinal absorption. This complexity not only includes the normal expression levels of P450 enzymes and the existence of a protective mucus layer,27 but also remains intact in blood vessels and nerves.28 The assessment was based on the disappearance of the drug in the lumen. The absorption rate constants (Ka) and effective permeability coefficients (Peff) obtained in the single-pass intestinal perfusion (SPIP) models are presented in Table 2. The results showed the Ka and Peff appeared to be higher as the particle size of CsA-NSs decreases. The Ka and Peff of CsA-NSs (280 nm) were all the higher than that of CsA-NSs (522 nm) and CsA-NSs (2967 nm) in four segments. This is due to the fact that the transport of CsA-NSs across the intestine could be stimulated by improving dissolution rate and saturation solubility and prolonging the time of mucoadhesion to GI29 caused by the decrease in particle.
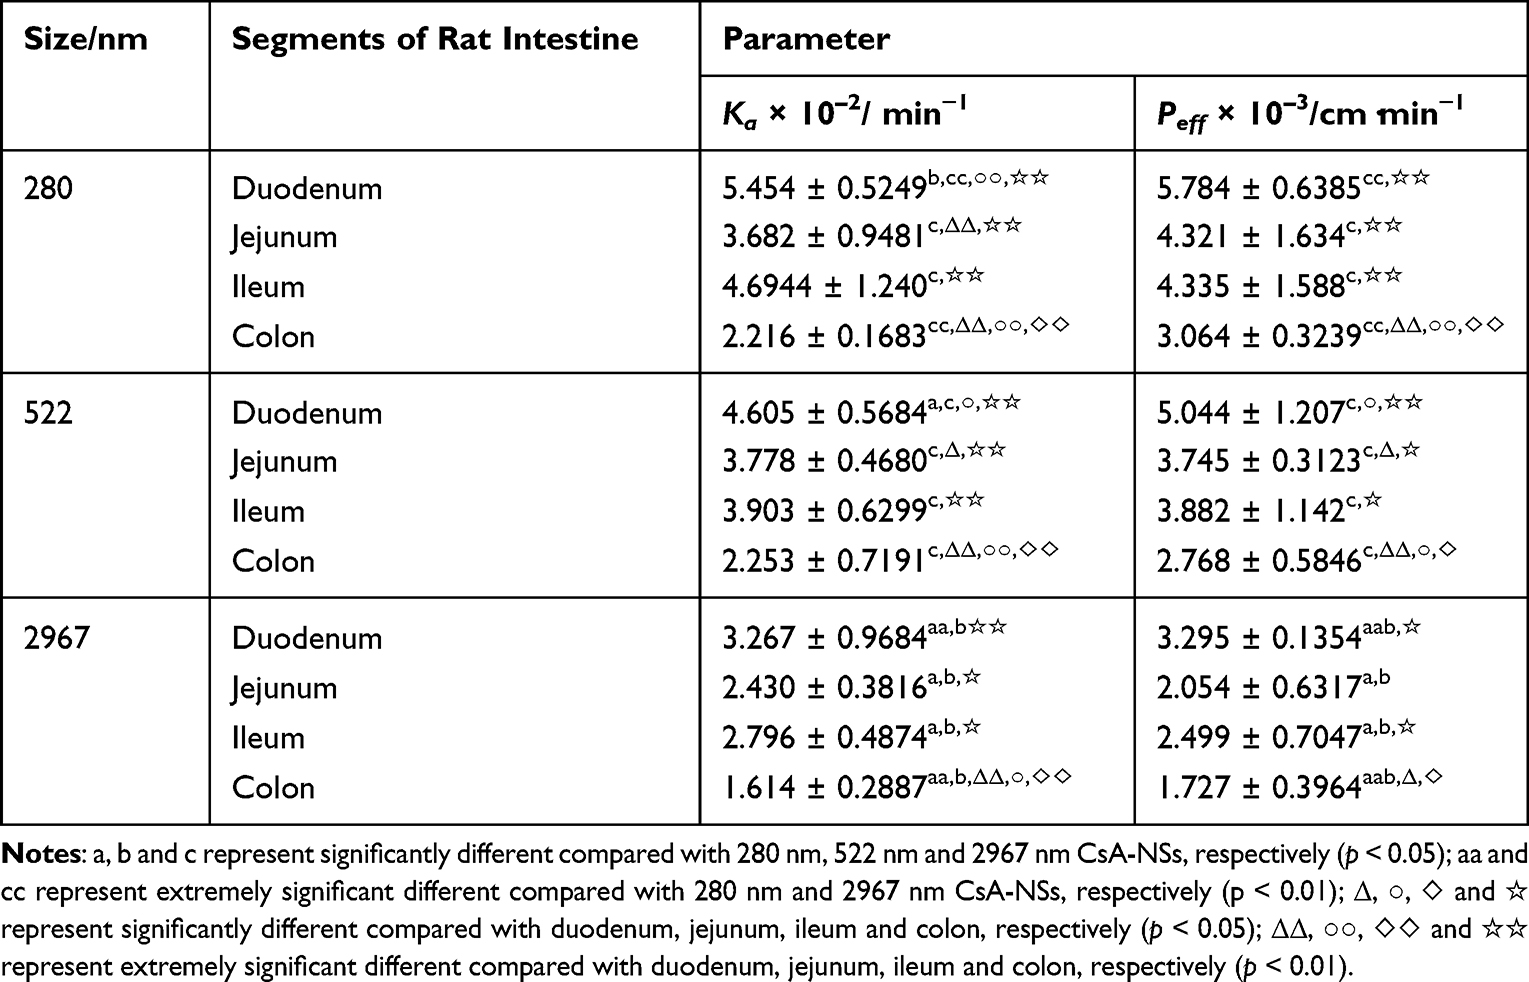 |
Table 2 Absorption Parameters of CsA-NSs with Different Size in Rat Intestine at a Dose of 40 µg/mL (n = 3, Means ± SD) |
The results also showed that CsA-NSs in duodenal absorption were the best, followed by ileum and jejunum, and finally colon. For 280 nm CsA-NSs, Ka and Peff in duodenal were significantly higher than that in jejunum and colon. And similar results occurred for 522 nm CsA-NSs and 2967 nm CsA-NSs. The reasons for the results were complex (Scheme 2). Firstly, there were lower effusion and higher metabolism of CsA because of less p-glycoprotein30,31 and more CYP 3A9 (metabolic enzymes of CsA)32 in duodenal compared with other intestinal segments. Secondly, various digestive juices, such as bile (bile salt, bile pigment, cholesterol, lecithin and so on), entered the small intestine through the duodenal segment. The bile acted as surfactant to promote the dissolution and absorption of CsA-NSs. Due to the special physiological characteristics of the duodenum leading to high metabolism, low effusion and high solubility, the disappearance of CsA in the CsA-NSs perfusion fluids was the highest in the duodenum. It is reported that ileum carries more Peyer’s patches and M cells than jejunum, in which particles above 1 µm were trapped in Peyer’s patches.33,34 This may be the reason why more CsA-NSs are absorbed in ileum than jejunum.
 |
Scheme 2 Schematic diagram about transport of CsA-NSs in rat small intestine. |
Pharmacokinetics Studies
The pharmacokinetics of CsA-NSs with different particle sizes following a dose oral administration of 25 mg/kg was investigated in SD rats with the marketed microemulsion (Neoral®) as reference. The blood concentration–time profiles of CsA are shown in Figure 8, and the pharmacokinetic parameters are shown in Table 3. Two hundred and eighty nm CsA-NS exhibited more desirable pharmacokinetic characteristics compared to the 522 nm and 2967 nm CsA-NSs. The AUC0-48h and Cmax values of CsA-NSs formulations increased in descending order of 280 nm > 522 nm > 2967 nm, while the Tmax values followed the reverse rank order for the different sized samples. The results showed the highest Cmax (2.364 ± 0.289 µg/mL) of 280 nm CsA-NS at Tmax of 4.2 ± 2.1 h in the three kinds of CsA-NSs, while CsA-NSs with size of 2967 nm showed the lowest (1.546 ± 1.021 µg/mL) at Tmax of 5.8 ± 2.2 h. And, in case of CsA-NS with size of 522 nm, the Cmax of CsA was found to be 2.364 ± 0.289 µg/mL at 4.3 ± 3.4 h. Furthermore, the AUC0-48h of 280 nm CsA-NS was about 1.12-fold of that 522 nm CsA-NS, and about 1.51-fold of that 2967 nm CsA-NSs. The AUC0-48h of 280 nm, 522 nm and 2967 nm CsA-NSs were compared with the reference (Neoral®) values, resulting in a relative bioavailability of 90.20%, 80.18% and 59.61%, respectively.
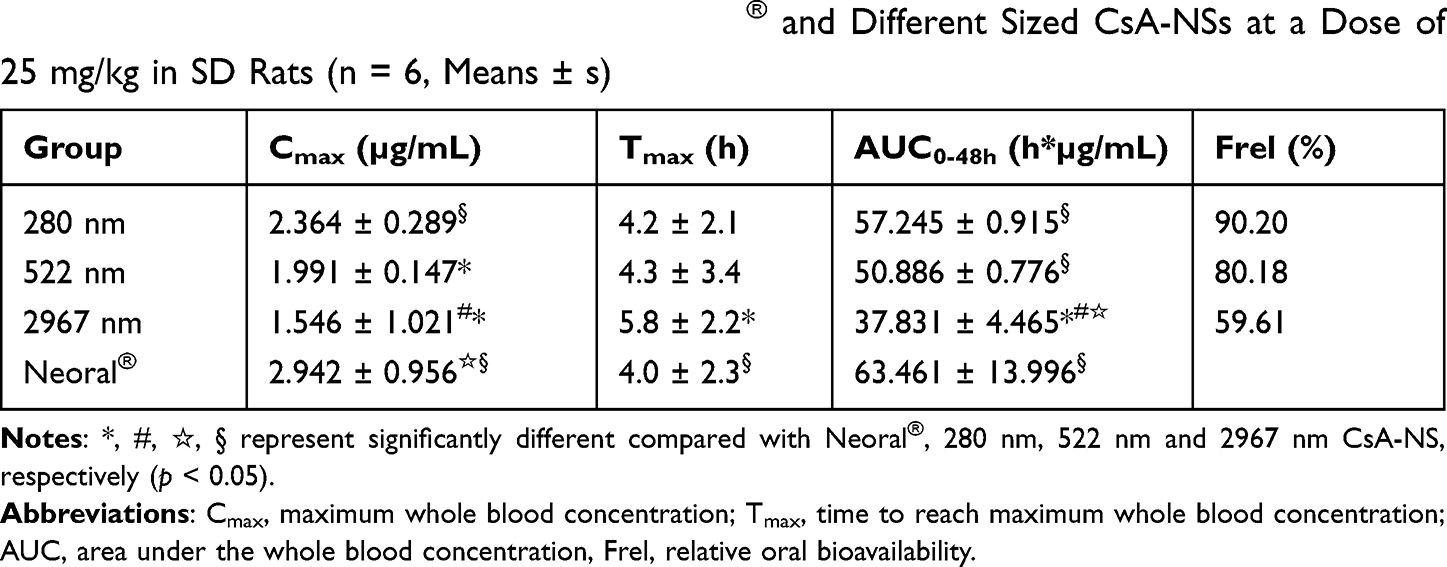 |
Table 3 Pharmacokinetic Parameters of Neoral® and Different Sized CsA-NSs at a Dose of 25 mg/kg in SD Rats (n = 6, Means ± s) |
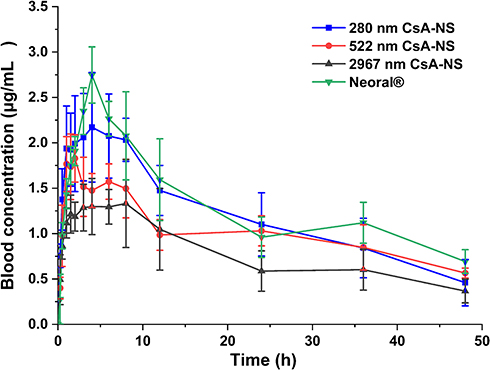 |
Figure 8 Mean drug blood concentration-time profiles after oral of Neoral® and CsA-NSs at a dose of 25 mg/kg in S.D. rats (n = 6, means ± SD). |
The enhanced oral absorption of nanometer-size CsA-NSs was attributed to the increased saturation solubility and dissolution velocity in digestive juice, as well as prolonging time of mucoadhesion to GIT of CsA-NSs caused by the decrease in particle.35 Moreover, integral nanocrystals across the gastrointestinal barrier (GIT) entered systemic circulation via several mechanisms, including paracellular passage (size <50 nm), endocytosis uptake (size <500 nm) and the lymphatic uptake (size <5000 nm) – particles adsorbed by the M cells of the Peyer’s patches.36 Thus, CsA-NSs with smaller size have higher drug concentration gradient between GIT and blood vessels and more ways into systemic circulation across GIT. In summary, reducing particle size can significantly improve the oral bioavailability of CsA-NSs, which is consistent with the results of in situ single-pass intestinal perfusion experiments. The pharmacokinetic data demonstrated that the drug was reduced during in situ single-pass intestinal perfusion experiments and was absorbed into the blood, albeit with efflux and metabolism. Compared with the commercially available drug Neoral®, the relative bioavailability of CsA-NSs (280 nm) can reach 90.2%. This indicated that CsA-NSs (280 nm and 522 nm) were bioequivalent to the commercially available drug Neoral®. In addition to particle size effect, nanocrystal formulation technique was considered. Due to the presence of large amounts of P-gp and metabolic enzymes, CsA greatly was limiting its intestinal uptake. Thus, TPGS, which can inhibit, to some extent, the activity of P-gp and metabolic enzymes, used as a stabilizer to formulate CsA-NSs may further improve the bioavailability of CsA.
Although 280 nm CsA-NS has better saturated solubility, dissolution rate, intestinal absorption characteristics and oral bioavailability than that of 522 nm CsA-NS, the difference in performance between 280 nm and 522 nm CsA-NSs was not very significant. And CsA-NSs (280 nm and 522 nm) were bioequivalent to the commercially available drug Neoral®. In our study, we found that it takes 90 minutes to prepare 280 nm CsA-NS, but only 30 minutes to prepare 522 nm CsA-NS, which means that producing nanocrystals with smaller particle sizes requires much higher energy and more time. In industrial production, not only the performance of drugs but also the cost, efficiency and energy consumption should be considered. Thus, it is unrealistic to pursue the preparation of nanocrystals with small particle size, and there should be an optimal particle size range in industrial production.
Conclusion
In this study, CsA-NSs with different particle sizes were successfully prepared by wet milling method. CsA-NS with smaller particle sizes exhibited higher solubility, faster dissolution rate, better intestinal transport properties and more desirable pharmacokinetic characteristics. We believe that a marked enhancement of the solubility and dissolution rate achieved by the reduction in particle size could account for the improved absorption of CsA in vivo. However, considering the cost, efficiency and energy consumption of production, the nanocrystals with small size are not an optimal choice, and there should be an optimal particle size range in industrial production. Meanwhile, as a functional stabilizer, the contribution of TPGS to increased bioavailability is unclear and correlational studies are a major focus of our future studies.
List of Abbreviations
CsA-NS, cyclosporin A nanosuspension; CsA, cyclosporin A; BCS, biopharmaceutics classification system; CsD, cyclosporin D; TPGS, vitamin E polyethylene glycol succinate; SDS, sodium dodecyl sulfate; HPC, hydroxypropyl cellulose; SIF, simulated intestinal fluid; SGF, simulated gastric fluid; MPS, mean particle size; SEM, scanning electron microscope; DSC, differential scanning calorimeter; PCS, photon correlation spectroscopy; D50, median diameter; PDI, polydispersity; HPH, high-pressure homogenization; LD, laser diffractometry; RI, real refractive index; IRI, imaginary refractive index; GI, gastrointestinal; SD rat, Sprague–Dawley rat; RH, relative humidity; TEM, transmission electron microscopy; XRD, X-ray diffraction; SD, standard deviation; Cmax, maximum whole-blood concentration; Tmax, time to reach maximum whole-blood concentration; AUC, area under the whole blood concentration; Frel, relative oral bioavailability.
Ethics Approval
Male Sprague–Dawley rats weighing 200–250 g (certificate no. SCXK- (Beijing) 2018-0010) were provided by the Beijing Institute of Pharmacology and Toxicology (Beijing, China). The pharmacokinetics study was approved by the Animal Ethics Committee at Beijing Institute of Pharmacology and Toxicology (ethics code permit no. IACUC-DWZX-2020-639). Moreover, approval was received prior to beginning this research.
Data Sharing Statement
The datasets used and/or analyzed during the current study are available from the corresponding authors on reasonable request.
Author Contributions
All authors made a significant contribution to the work reported, whether that is in the conception, study design, execution, acquisition of data, analysis and interpretation, or in all these areas; took part in drafting, revising or critically reviewing the article; gave final approval of the version to be published; have agreed on the journal to which the article has been submitted; and agree to be accountable for all aspects of the work.
Funding
This work was supported by the National Natural Science Foundation of China (No. 81573357).
Disclosure
The authors declare that they have no conflicts of interest in this work.
References
1. Jain S, Kambam S, Thanki K, Jain AK. Cyclosporine A loaded self-nanoemulsifying drug delivery system (SNEDDS): implication of a functional excipient based co-encapsulation strategy on oral bioavailability and nephrotoxicity. RSC Adv. 2015;5:49633–49642. doi:10.1039/c5ra04762e
2. Basaran E, Demirel M, Sirmagul B, Yazan Y. Cyclosporine-A incorporated cationic solid lipid nanoparticles for ocular delivery. J Microencapsul. 2010;27:37–47. doi:10.3109/02652040902846883
3. Liu M, Zhong X, Yang Z. Chitosan functionalized nanocochleates for enhanced oral absorption of cyclosporine A. Sci Rep. 2017;7:41322. doi:10.1038/srep41322
4. Kesisoglou F, Panmai S, Wu Y. Nanosizing–oral formulation development and biopharmaceutical evaluation. Adv Drug Deliv Rev. 2007;59:631–644. doi:10.1016/j.addr.2007.05.003
5. Du B,Shen G, Wang D, Pang L, Chen Z, Liu Z. Development and characterization of glimepiride nanocrystal formulation and evaluation of its pharmacokinetic in rats. Drug Deliv. 2013;20:25–33. doi:10.3109/10717544.2012.742939
6. Muller RH, Gohla S, Keck CM. State of the art of nanocrystals–special features, production, nanotoxicology aspects and intracellular delivery. Eur J Pharm Biopharm. 2011;78:1–9. doi:10.1016/j.ejpb.2011.01.007
7. Kayaert P, Li B, Jimidar I, et al. Solution calorimetry as an alternative approach for dissolution testing of nanosuspensions. Eur J Pharm Biopharm. 2010;76:507–513. doi:10.1016/j.ejpb.2010.09.009
8. Lu Y, Qi J, Dong X, Zhao W, Wu W. The in vivo fate of nanocrystals. Drug Discov Today. 2017;22:744–750. doi:10.1016/j.drudis.2017.01.003
9. Di J, Gao X, Du Y, et al. Size, shape, charge and “stealthy” surface: carrier properties affect the drug circulation time in vivo. Asian J Pharm Sci. 2021;16:444–458. doi:10.1016/j.ajps.2020.07.005
10. Li Q, Liu CG, Yu Y. Separation of monodisperse alginate nanoparticles and effect of particle size on transport of vitamin E. Carbohydr Polym. 2015;124:274–279. doi:10.1016/j.carbpol.2015.02.007
11. Wang R, Wang X, Jia X, Wang H, Li J, Li J. Impacts of particle size on the cytotoxicity, cellular internalization, pharmacokinetics and biodistribution of betulinic acid nanosuspensions in combined chemotherapy. Int J Pharm. 2020;588:119799. doi:10.1016/j.ijpharm.2020.119799
12. Langston Suen WL, Chau Y. Size-dependent internalisation of folate-decorated nanoparticles via the pathways of clathrin and caveolae-mediated endocytosis in ARPE-19 cells. J Pharm Pharmacol. 2014;66:564–573. doi:10.1111/jphp.12134
13. Xie Y, Shi B, Xia F, et al. Epithelia transmembrane transport of orally administered ultrafine drug particles evidenced by environment sensitive fluorophores in cellular and animal studies. J Control Release. 2018;270:65–75. doi:10.1016/j.jconrel.2017.11.046
14. Rejman J, Zuhorn I, Hoekstra D, Hoekstra D. Size-dependent internalization of particles via the pathways of clathrin- and caveolae-mediated endocytosis. Biochem J. 2004;377:159–169. doi:10.1042/bj20031253
15. Bi C, Miao XQ, Chow SF, et al. Particle size effect of curcumin nanosuspensions on cytotoxicity, cellular internalization, in vivo pharmacokinetics and biodistribution. Nanomedicine. 2017;13:943–953. doi:10.1016/j.nano.2016.11.004
16. Zhang X, Zhao J, Guan J, et al. Exploration of nanocrystal technology for the preparation of lovastatin immediate and sustained release tablets. J Drug Deliv Sci Technol. 2019;50:107–112. doi:10.1016/j.jddst.2019.01.018
17. Zhang X, Li LC, Mao S. Nanosuspensions of poorly water soluble drugs prepared by top-down technologies. Curr Pharm Des. 2014;20:388–407. doi:10.2174/13816128113199990401
18. Jacob S, Nair AB, Shah J. Emerging role of nanosuspensions in drug delivery systems. Biomater Res. 2020;24:3. doi:10.1186/s40824-020-0184-8
19. Pawar VK, Singh Y, Meher JG, Gupta S, Chourasia MK. Engineered nanocrystal technology: in-vivo fate, targeting and applications in drug delivery. J Control Release. 2014;183:51–66. doi:10.1016/j.jconrel.2014.03.030
20. Romero GB, Arntjen A, Keck CM, Muller RH. Amorphous cyclosporin A nanoparticles for enhanced dermal bioavailability. Int J Pharm. 2016;498:217–224. doi:10.1016/j.ijpharm.2015.12.019
21. Xie YS, Ren XL, Pan GX, Gao XM, Liu CX. The assessment of absorption of periplocin in situ via intestinal perfusion of rats by HPLC. Biomed Chromatogr. 2008;22:196–201. doi:10.1002/bmc.914
22. Wang XY, Lian H, Lu X-Y, et al. [Intestinal absorption of phenolic acids in Rhus chinensis extracts by in situ single-pass perfusion model in rats]. Zhongguo Zhong Yao Za Zhi. 2019;44:2373–2378. doi:10.19540/j.cnki.cjcmm.20190318.502 Chinese.
23. Hu J, Chen D, Jiang R, Tan Q, Zhu B, Zhang J. Improved absorption and in vivo kinetic characteristics of nanoemulsions containing evodiamine-phospholipid nanocomplex. Int J Nanomedicine. 2014;9:4411–4420. doi:10.2147/IJN.S59812
24. Du J, Zhou Y, Wang L, Wang Y. Effect of PEGylated chitosan as multifunctional stabilizer for deacetyl mycoepoxydience nanosuspension design and stability evaluation. Carbohydr Polym. 2016;153:471–481. doi:10.1016/j.carbpol.2016.08.002
25. Guada M, Lasa-Saracibar B, Lana H, Dios-Vieitez Mdel C, Blanco-Prieto MJ. Lipid nanoparticles enhance the absorption of cyclosporine A through the gastrointestinal barrier: in vitro and in vivo studies. Int J Pharm. 2016;500:154–161. doi:10.1016/j.ijpharm.2016.01.037
26. Mu L, Feng SS. Vitamin E TPGS used as emulsifier in the solvent evaporation/extraction technique for fabrication of polymeric nanospheres for controlled release of paclitaxel (Taxol). J Control Release. 2002;80:129–144. doi:10.1016/S0168-3659(02)00025-1
27. Stappaerts J, Brouwers J, Annaert P, Augustijns P. In situ perfusion in rodents to explore intestinal drug absorption: challenges and opportunities. Int J Pharm. 2015;478:665–681. doi:10.1016/j.ijpharm.2014.11.035
28. Chen G, Min X, Zhang Q, Zhang Z, Synthesis CG. Evaluation of PEG-PR for water flux correction in an in Situ Rat Perfusion Model. Molecules. 2020;25:5123. doi:10.3390/molecules25215123
29. Hussain N, Jaitley V, Florence AT. Recent advances in the understanding of uptake of microparticulates across the gastrointestinal lymphatics. Adv Drug Deliv Rev. 2001;50:107–142. doi:10.1016/S0169-409X(01)00152-1
30. Fricker G, Drewe J, Huwyler J, Gutmann H, Beglinger C. Relevance of p-glycoprotein for the enteral absorption of cyclosporin A: in vitro-in vivo correlation. Br J Pharmacol. 2012;118:1841–1847. doi:10.1111/j.1476-5381.1996.tb15612.x
31. Fojo AT, Ueda KS, Slamon DJ, Poplack DG, Gottesman MM, Pastan I. Expression of a multidrug-resistance gene in human tumors and tissues. Proc Natl Acad Sci U S A. 1987;84:265–269. doi:10.1073/pnas.84.1.265
32. Cao X, Gibbs ST, Fang L, et al. Why is it challenging to predict intestinal drug absorption and oral bioavailability in human using rat model. Pharm Res. 2006;23:1675–1686. doi:10.1007/s11095-006-9041-2
33. Witoonsaridsilp W, Panyarachun B, Jaturanpinyo M, Sarisuta N. Phospholipid vesicle–bound lysozyme to enhance permeability in human intestinal cells. Pharm Dev Technol. 2013;18:821–827. doi:10.3109/10837450.2012.700930
34. Des Rieux A, Fievez V, Garinot M, Schneider YJ, Préat V. Nanoparticles as potential oral delivery systems of proteins and vaccines: a mechanistic approach. J Control Release. 2006;116:1–27. doi:10.1016/j.jconrel.2006.08.013
35. Gao L, Liu G, Ma J, et al. Drug nanocrystals: in vivo performances. J Control Release. 2012;160:418–430. doi:10.1016/j.jconrel.2012.03.013
36. Kulkarni SA, Feng SS. Effects of particle size and surface modification on cellular uptake and biodistribution of polymeric nanoparticles for drug delivery. Pharm Res. 2013;30:2512. doi:10.1007/s11095-012-0958-3
 © 2022 The Author(s). This work is published and licensed by Dove Medical Press Limited. The full terms of this license are available at https://www.dovepress.com/terms.php and incorporate the Creative Commons Attribution - Non Commercial (unported, v3.0) License.
By accessing the work you hereby accept the Terms. Non-commercial uses of the work are permitted without any further permission from Dove Medical Press Limited, provided the work is properly attributed. For permission for commercial use of this work, please see paragraphs 4.2 and 5 of our Terms.
© 2022 The Author(s). This work is published and licensed by Dove Medical Press Limited. The full terms of this license are available at https://www.dovepress.com/terms.php and incorporate the Creative Commons Attribution - Non Commercial (unported, v3.0) License.
By accessing the work you hereby accept the Terms. Non-commercial uses of the work are permitted without any further permission from Dove Medical Press Limited, provided the work is properly attributed. For permission for commercial use of this work, please see paragraphs 4.2 and 5 of our Terms.