")
Back to Journals » Open Access Journal of Sports Medicine » Volume 10
The effect of concussion on batting performance of major league baseball players
Authors Chow BH, Stevenson AM, Burke JF, Adelman EE
Received 29 October 2018
Accepted for publication 30 January 2019
Published 12 March 2019 Volume 2019:10 Pages 41—48
DOI https://doi.org/10.2147/OAJSM.S192338
Checked for plagiarism Yes
Review by Single anonymous peer review
Peer reviewer comments 3
Editor who approved publication: Prof. Dr. Andreas Imhoff
Bryan H Chow,1 Alyssa M Stevenson,2 James F Burke,3,4 Eric E Adelman5
1Department of Anesthesiology, Duke University, Durham, NC, USA; 2Department of Psychiatry, University of Michigan, Ann Arbor, MI, USA; 3Department of Neurology, University of Michigan, Ann Arbor, MI, USA; 4Department of Veterans Affairs, Ann Arbor VA Healthcare System, Ann Arbor, MI, USA; 5Department of Neurology, University of Wisconsin, Madison, WI, USA
Purpose: Previous investigations into concussions’ effects on Major League Baseball (MLB) players suggested that concussion negatively impacts traditional measures of batting performance. This study examined whether post-concussion batting performance, as measured by traditional, plate discipline, and batted ball statistics, in MLB players was worse than other post-injury performance.
Subjects and methods: MLB players with concussion from 2008 to 2014 were identified. Concussion was defined by placement on the disabled list or missing games due to concussion, post-concussive syndrome, or head trauma. Injuries causing players to be put on the disabled list were matched by age, position, and injury duration to serve as controls. Mixed effects models were used to estimate concussion’s influence after adjusting for potential confounders. The primary study outcome measurements were: traditional (eg, average), plate discipline (eg, swing-at-strike rate), and batted ball (eg, ground ball percentage) statistics.
Results: There were 85 concussed players and 212 controls included in the analyses. There was no significant difference in performance between concussed players and controls. However, concussed players started at a lower level of performance pre-event than the controls, striking out a 9.2% rate vs 8.2% (P=0.042) with an isolated power of 0.075 vs 0.082 (P=0.035). For concussed players, traditional batting statistics decreased before plate discipline metrics.
Conclusion: MLB players’ performance was lower after return from concussion, but no more than after return from other injuries. The decreased performance prior to concussion suggests that concussion-related performance declines may not be due exclusively to concussion and perhaps point to risk factors predisposing to concussion.
Keywords: MLB, head injury, professional sports, athletic performance, brain injury
Introduction
In the last decade, concussion has received increasing attention in Major League Baseball (MLB). Concussions represent 1% of MLB injuries that prevent players from competing, with a median loss of 9 days and a mean loss of 21 days of play.1 The high velocity of the impacts and collisions of baseball-related concussion can be severe enough to end players’ careers.2,3 In 2011, MLB implemented several measures to address concussion, including mandatory neuropsychological testing before the start of each season, standardized evaluation and clearance of players, and a new 7-day disabled list (DL) specifically for concussion and possible concussion that requires medical clearance before returning to play.4 MLB also instituted new rules in 2014 to reduce player collisions at home plate,5 and to permit the use of protective caps for pitchers.6
Concussion can cause a variety of deficits relevant to baseball performance including deficits in the visuospatial, attentional, and visual networks of the brain, while also affecting coordination,7,8 attention,7,9,10 and reaction time.11 Concussion may also interfere with oculomotor pathways.12 Prior work has also suggested that concussion may impact on-field performance, including a decrease in slugging percentage,13 a traditional statistic that measures a batter’s power, as well as other traditional measures of batter performance, such as batting average, on-base percentage, and on-base plus slugging percentage.14 However, there are no data on how plate discipline (swinging at “good” pitches), strike zone visualization, or pitched ball visualization change after concussion.
We sought to examine the effect of concussion on batting performance by reviewing data from before and after MLB players were placed on the disabled list or missed games from concussion. Given the prior data, we anticipated that concussion would result in lingering neurological effects after overt symptoms subside and players are medically cleared to return to play. This would result in worse performance in concussed players compared to players with other injuries. We also explored whether specific post-concussion patterns existed in batting performance.
Methods
Subjects
Using the Pro Sports Transactions Archive15 and the MLB transactions page,16 we identified all position players (players other than pitchers) who were either placed on the disabled list or missed time due to injury from 2008 to 2014. Players were identified as having a concussion if they were placed on the disabled list or missed games because of concussion, post-concussive syndrome, or head trauma. A similar approach, using publically available records, has been used to evaluate concussion in professional hockey,17 basketball,18 and football players.19,20 To corroborate the diagnosis of concussion for non-disabled list events, we reviewed at least one news article describing the event, if available. After our independent review, players not thought to have suffered a concussion were excluded from our analyses. Disagreements about the diagnosis of concussion were resolved by consensus among three of the authors (BHC, AMS, and EEA). We excluded players whose injury occurred either too early (before 15 days of play) or too late (less than 30 days of play) in the season to determine performance before and after the event. If a player had multiple concussions during a season (n=6), we included the first concussion but excluded any subsequent events. As controls, we identified injured players on the disabled list without a head injury and matched injuries (not players) by position, age, year, and number of days missed in a 2:1 ratio to players with concussion. This study was determined to be not regulated by the University of Michigan Institutional Review Board.
Design
Our primary analysis looked at traditional batting statistics (batting average, on-base percentage, slugging percentage, isolated power) as indicators for performance before and after injury, accounting for the player’s pre-injury performance, and compared it to matched controls. A glossary of the statistics used is in Table 1. Secondary analyses compared pre- and post-concussion plate discipline and batted ball data as performance markers.
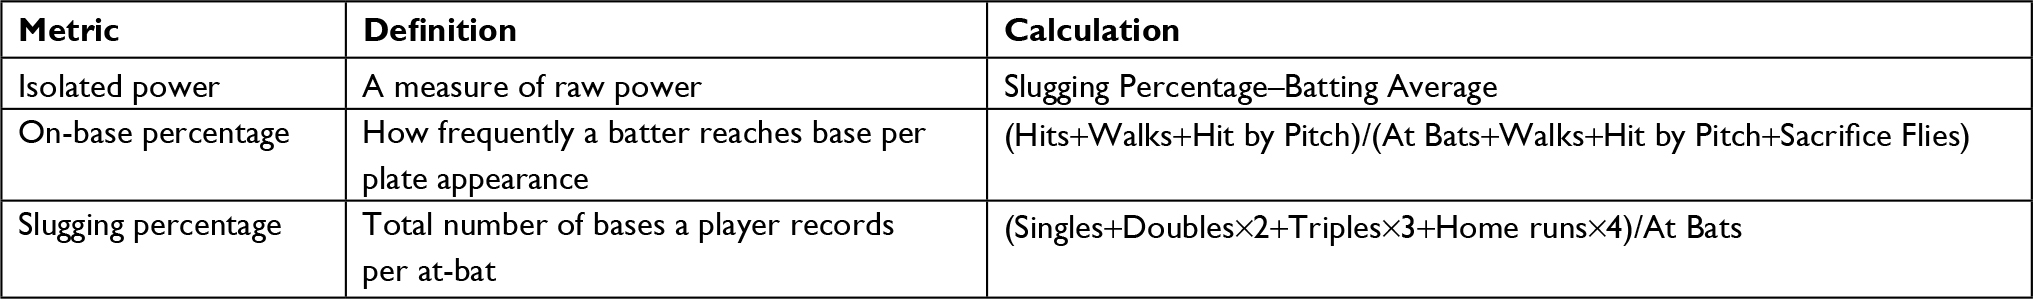 | Table 1 Glossary |
The data for our analyses were obtained from BrooksBaseball.net21 and Fangraphs.com.22 Both of these sites report pitch-by-pitch details for pitchers and batters for each at bat in every MLB game in a systematic, consistent manner that incorporates the use of pre-set algorithms and manual verification. The data from these sites are used by major sports networks and baseball analysts. While both sites contain the same information, for ease of data abstraction we used BrooksBaseball.net for pitch data and Fangraphs.com for batted ball data. Our analyses include regular season MLB games, excluding pre- and postseason competition.
We examined outcomes in three broad statistical categories: traditional, plate discipline, and batted ball. Traditional measures of performance include batting average, on-base percentage, slugging percentage, and isolated power. These statistics generally measure outcomes of an at bat and they are frequently cited as indicators of overall performance. Plate discipline statistics evaluate swing or take (deciding not to swing) percentages when the pitch is a ball or strike. Plate discipline can give insight into changes in the player’s approach and may be particularly susceptible to the effects of concussion. The decision to swing and the subsequent ability to make contact rely on a combination of reaction time, visuospatial skills, and executive function. Thus, a change in plate discipline statistics may reflect changes in these neural pathways. Batted ball statistics look at the general trajectory (ground ball, line drive, fly ball), location (pulled, central, or opposite field), and strength of contact (soft, medium, hard). These measures reflect how well a player is making contact with the ball, as line drives and hard contact represent a player hitting the ball more squarely. After accounting for plate discipline, batted ball stats may give further insight into smaller changes in coordination after both concussive and non-concussive injuries. To ensure that any patterns we saw were not due to a change in pitch type (fastball vs non-fastball) or percentage of strikes thrown, we examined these values for both players with concussion as well as controls.
Statistical analysis
For each outcome studied, we fit multi-level regression models appropriate to the functional form of the outcome (logistic for binary outcomes and linear for continuous outcomes), with a random player-level intercept across all years of player data in all datasets. The random player-level intercept accounts for a player’s overall performance level. Models with at-bat based outcomes were also adjusted for park effects (by including every home stadium a fixed effect in both at-bat and pitch-by-pitch models), opponent, year, position, and batter handedness. Models with pitch-by-pitch based outcomes were adjusted for pitch type (fastball vs curveball), pitch speed, pitcher handedness, and an interaction between pitcher and batter handedness. Adjustment for days missed was included in the analyses. Time relative to injury was included in the model across five periods: 1) Non-injury season, to establish the player’s performance the year before, 2) Pre-event, which contained statistics of the current year prior to the event, 3) 15 days after return from injury, 4) 15–30 days after return from injury, and 5) the remainder of the season. Differences in outcomes associated with injury across time periods were estimated by including an interaction term between time period and injury type (concussion vs control). Effect sizes were estimated with average marginal effects. The concussed player’s performance was compared with controls as well as with his pre-concussion performance.
Results
There were 85 concussed players and 212 controls included in the study. More players were placed on the disabled list because of concussion in later years of the study; players were classified based on most frequently played position during that year (Table 2). Injuries in the control group were predominantly musculoskeletal.
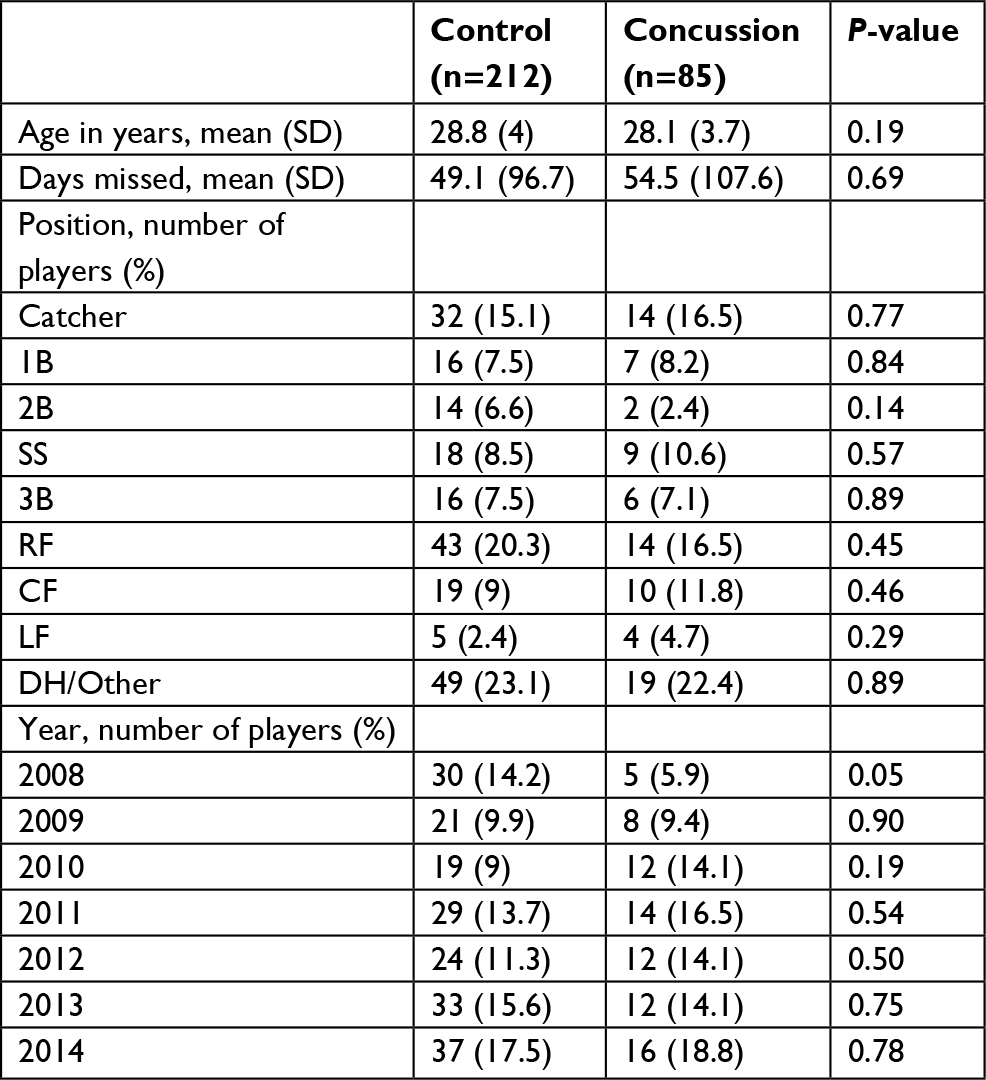 | Table 2 Player characteristics by position in control and concussion groups |
Concussed players versus controls
In the concussed group, batting average, on-base percentage, slugging, and isolated power all decreased after injury (Figure 1); however, contrary to our hypothesis, no significant difference existed between the concussion and control groups for traditional batting statistics at any post-injury time period analyzed.
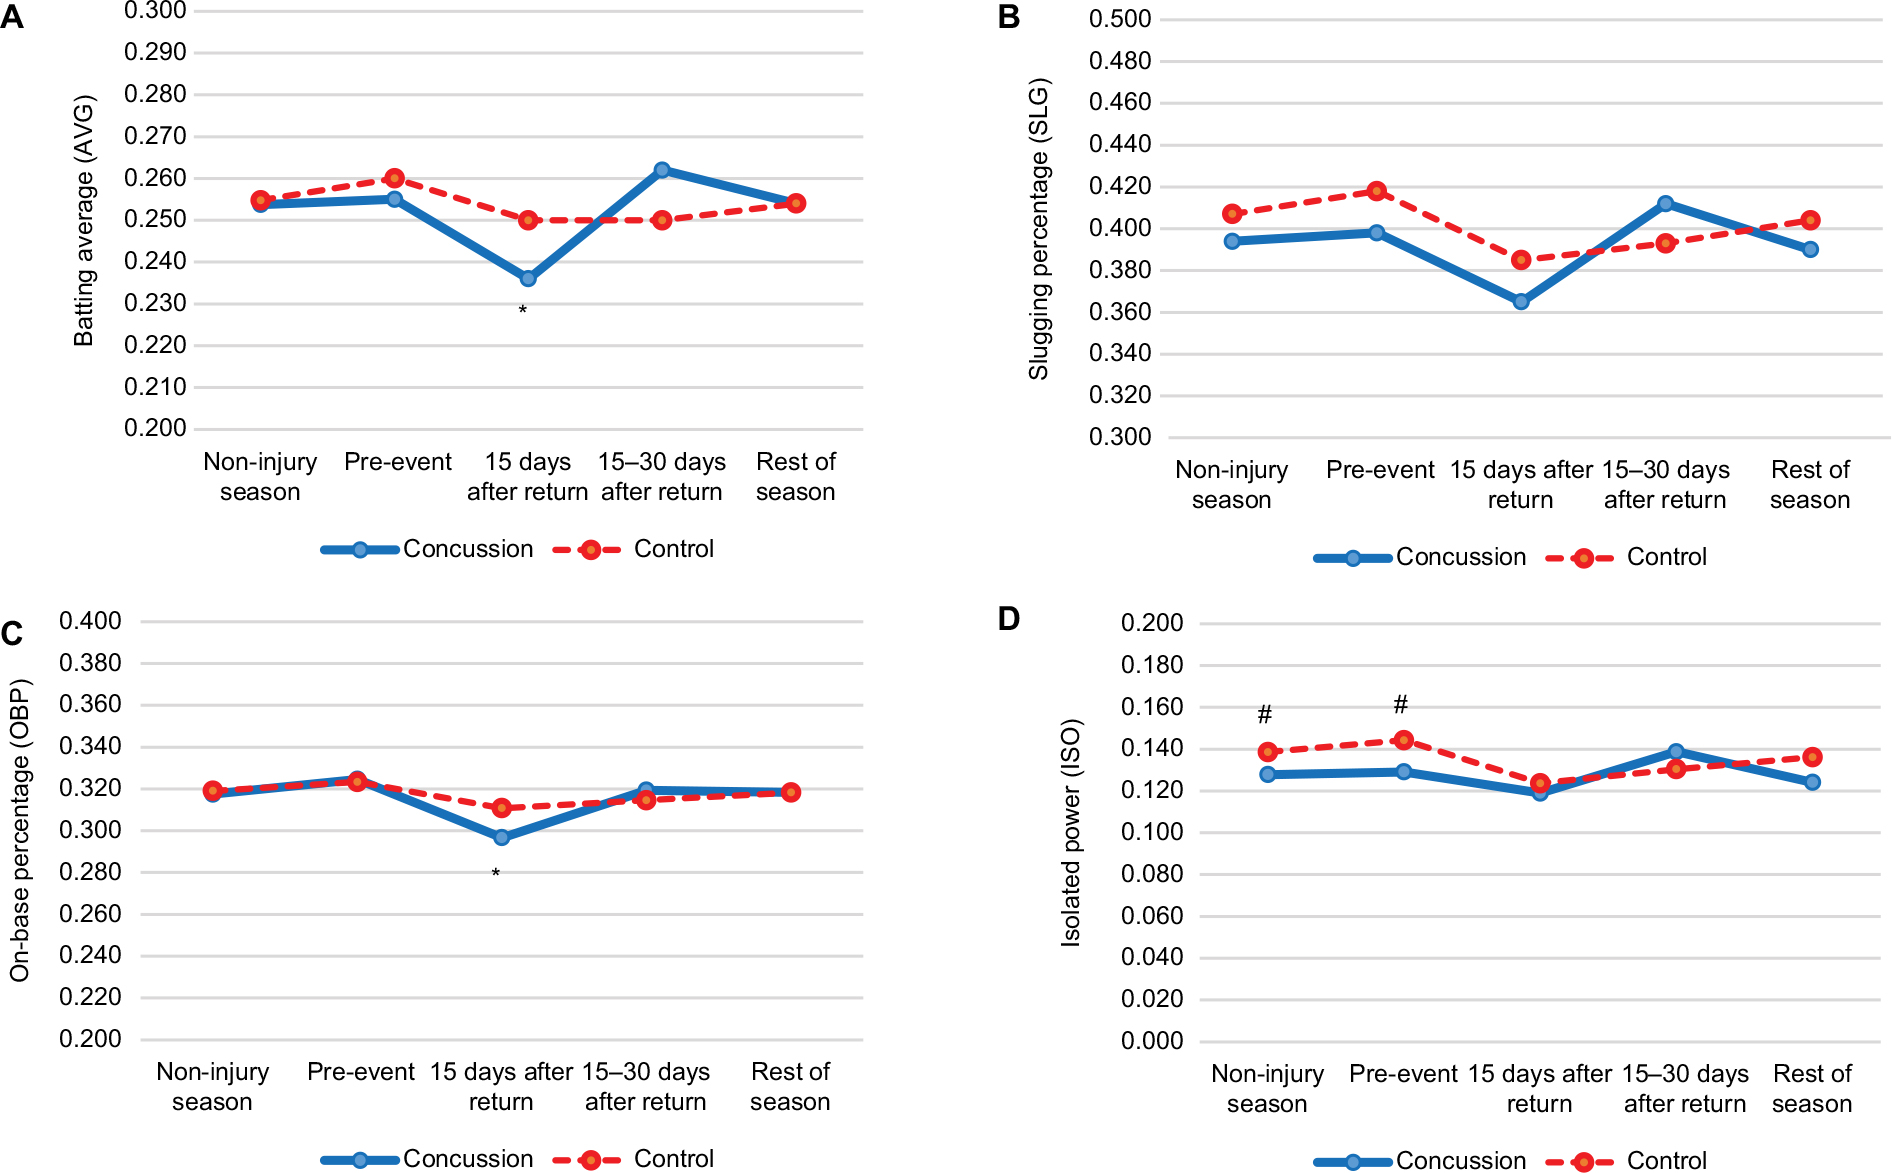 | Figure 1 Comparison of traditional batting statistics of concussed and control players before and after event. (A) Batting average; (B) On-base percentage; (C) Slugging percentage; and (D) Isolated power. Notes: *Indicates a P<0.05 for a comparison between the concussed players at a given time vs their own pre-concussion performance. # indicates a P<0.05 for a comparison between concussed players vs controls. Abbreviations: AVG, battling average; SLG, slugging percentage; OBP, on-base percentage; ISO, isolated power. |
An unanticipated finding was that, in the pre-event time period, isolated power was higher in the controls than the concussed cohort (0.144 vs 0.129, P=0.04). Slugging percentage was also higher in the control group (0.418 vs 0.398), but the difference was not significant (P=0.6). As with the traditional statistics, we observed a decrease in performance in the concussion cohort compared to controls prior to the time of injury. Hard contact rates are considered representative of better performance.23 Compared to the control group, concussed players had a higher soft contact rate (19.1% vs 17.5%, P=0.02) and a lower hard contact rate (26.2% vs 29.2%, P<0.01) pre-event (Table 3).
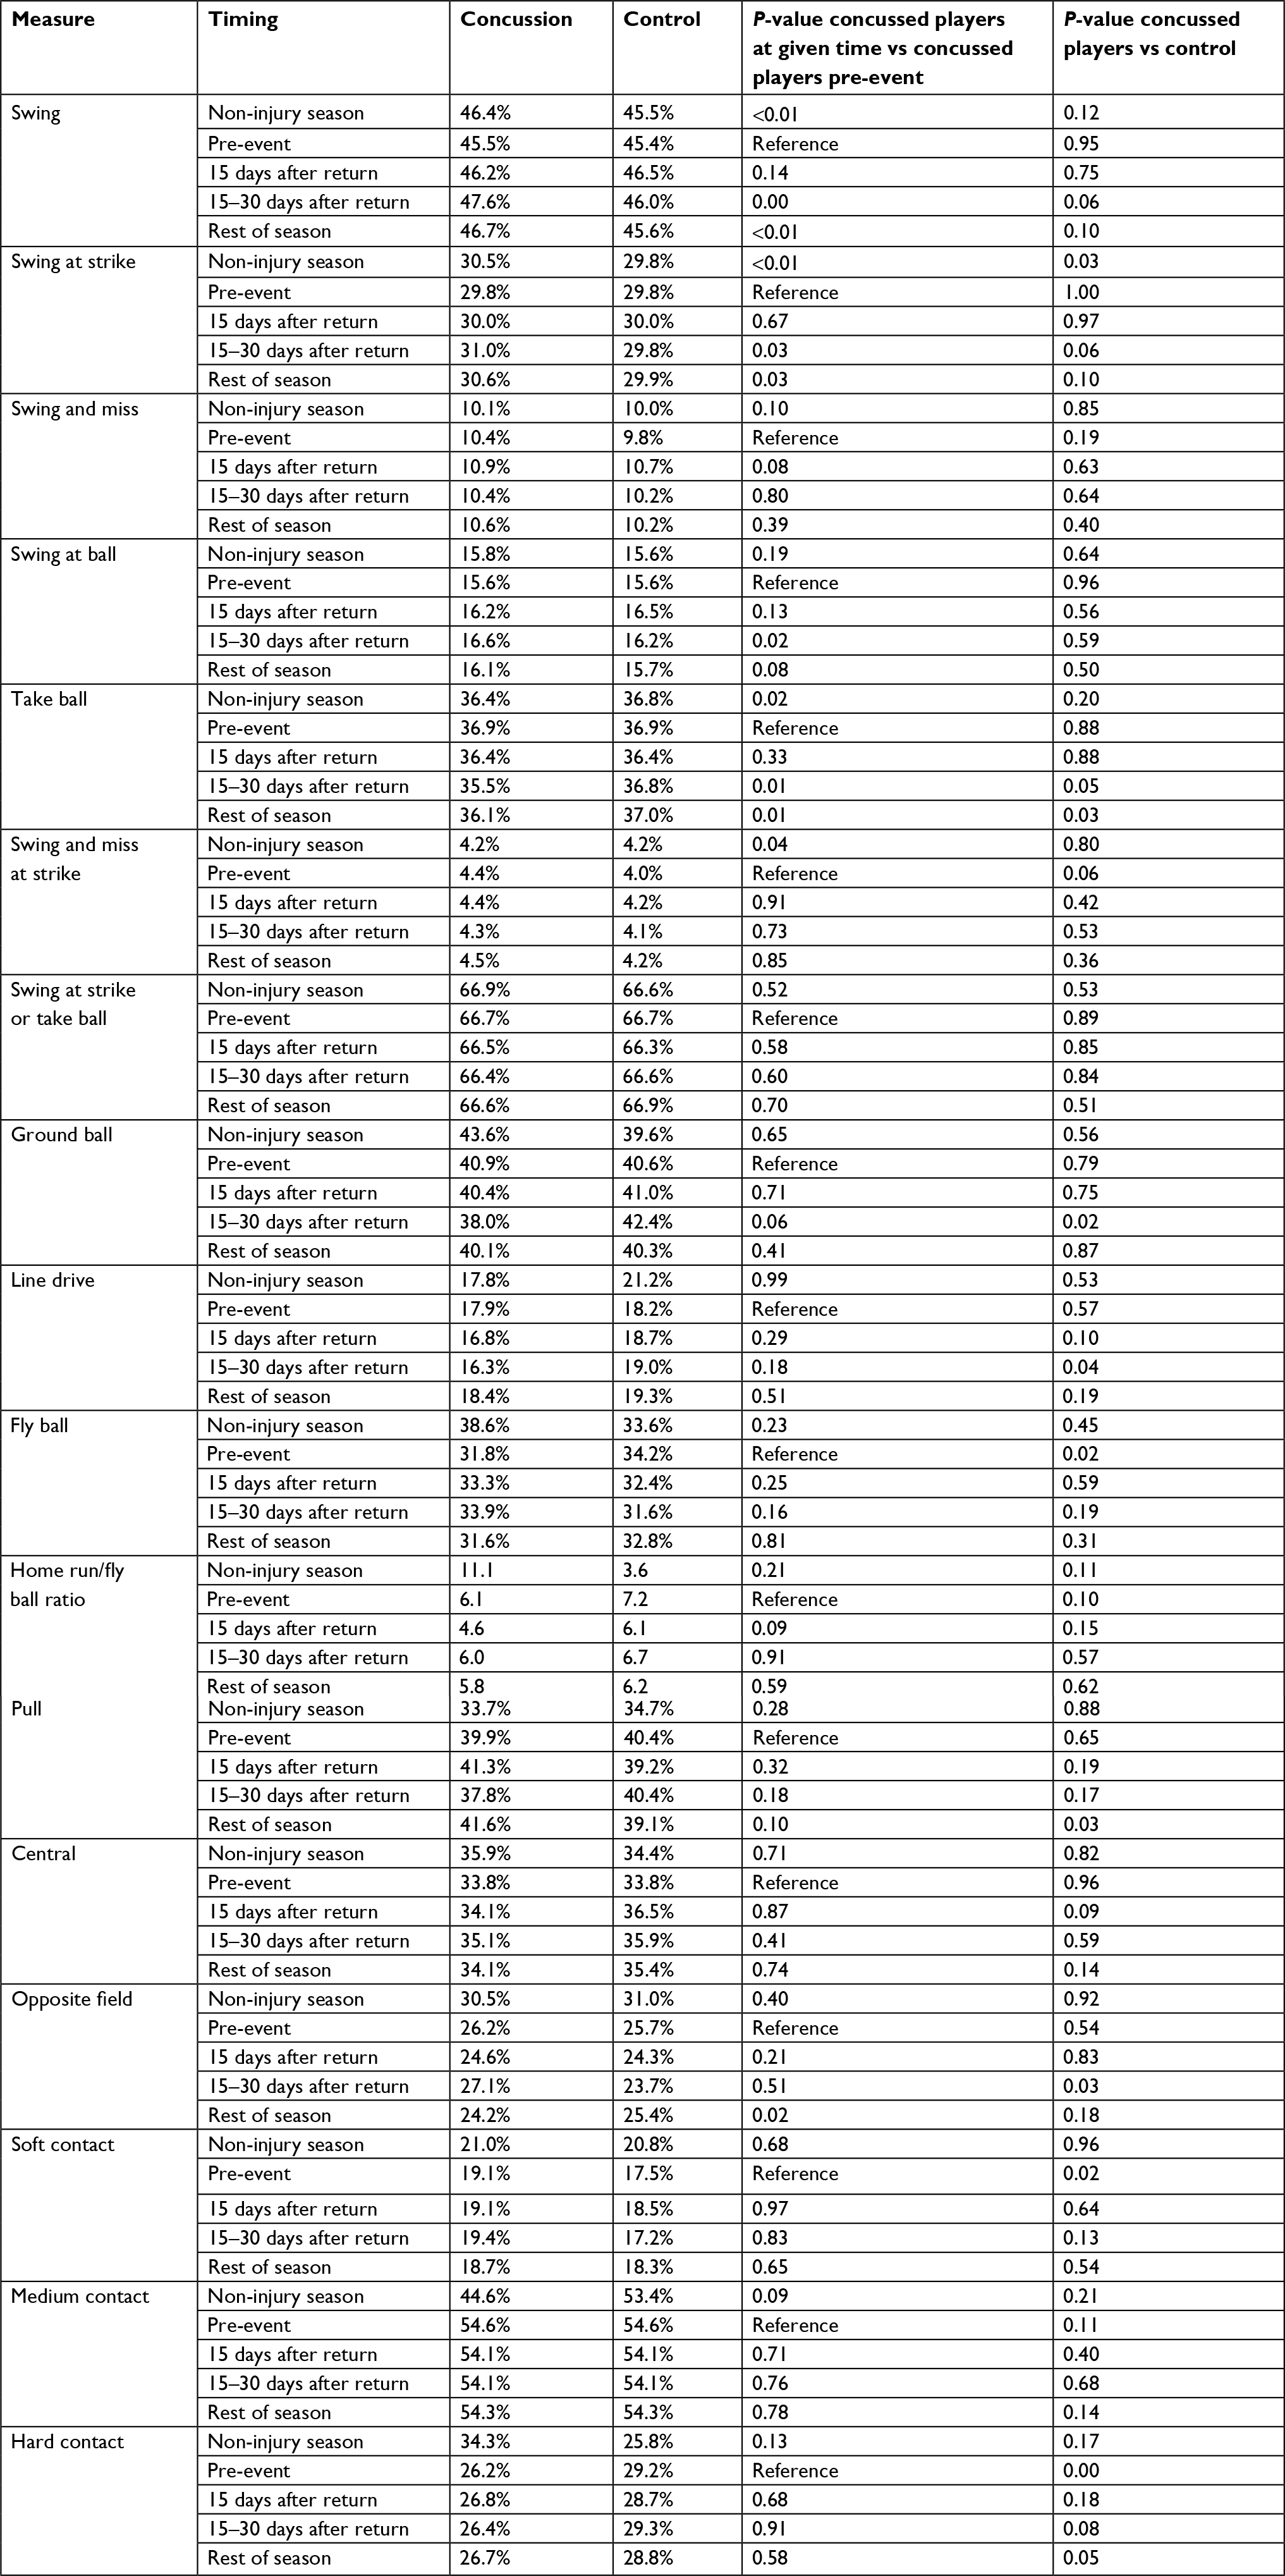 | Table 3 Plate discipline and batted ball statistics |
In the 15–30 days after return to play, some small, but statistically significant differences did exist. The players in the concussion group were less likely to hit ground balls (38.0% vs 42.4%, P=0.02) and line drives (16.3% vs 19.0%, P=0.04), and more likely to hit the ball to the opposite field (27.1% vs 23.7%, P=0.03) compared to the control group.
To ensure that pitchers were not approaching concussed players differently, we examined the strike frequency and composition of the pitches thrown to each group. In both the concussion and control groups, 47.5% of pre-event pitches were likely strikes, and this percentage remained relatively stable after the event. The cohorts also received a similar percentage of fastballs before (36.1% for concussion group vs 35.9% for control) and 15 days after return (35.2% for concussion group vs 35.6% for control.)
Pre-concussion versus post-concussion
In the 15 days after concussed players returned from their injuries, batting average and on-base percentage decreased significantly from their own pre-event baseline; batting average dropped from a pre-event of 0.255–0.236 (P=0.04), and on-base percentage from 0.325 to 0.297 (P<0.01). By 15–30 days after injury, these statistics returned to their pre-event levels; batting average during this time was 0.262, compared to 0.255 pre-event (P=0.58), and on-base percentage was 0.319 vs 0.325 pre-event (P=0.62). Slugging percentage did not decrease significantly 15 days after concussion (P=0.07). There was no significant change in isolated power.
When looking at additional measures, as shown in Table 3, in the 15 days after concussion, compared with their pre-concussion baseline, players were not more likely to swing in general (46.2% vs 45.5%, P=0.14), swing at balls (16.2% vs 15.6%, P=0.13), or swing at strikes (30.0% vs 29.8%, P=0.67). Player’s plate discipline declined in the 15–30 days after concussion relative to pre-concussion baseline. Players had a statistically significant increase in their rates of swinging overall (47.6% vs 45.5%, P<0.01), swinging at balls (16.6% vs 15.6%, P=0.02), and swinging at strikes (31.0% vs 29.8%, P=0.03), and a statistically significant decrease in their rates of taking balls (35.5% vs 36.9%, P=0.01).
In the concussed cohort, there was no significant change in ground ball, line drive, or fly ball rates 15 days after concussion compared to their own baseline pre-event. Similarly, there was no significant change in pull, central, opposite field percentages, nor in the soft, medium, or hard contact rates 15 days after concussion compared to their performance prior to concussion.
Discussion
We found a significant decrease in traditional measures of MLB players’ batting performance after return from a concussion, which was similar to prior work by Wasserman et al.14 However, contrary to both their findings and our hypothesis, we found that there was no evidence of a greater decrease in performance in MLB players with concussion compared to players injured in another manner. After injury, the performance in both groups, as measured by traditional, plate discipline, and batted ball statistics, worsened relative to pre-injury performance, and there was no significant difference in the performance decline of concussed players when compared with other injured players.
Our findings may differ from the previous study by Wasserman et al14 because of the choice of control group. Rather than using uninjured players after return from the bereavement list or paternity leave as controls, we studied players who suffered injuries other than concussion. Regardless of the type of injury, concussion or not, players endured a period of decreased performance as they worked their way back from injury making for a more robust control group when compared to players who missed time without an injury. We also compared players to their pre-injury baseline which may better control for confounders. Compared with the Wasserman et al14 study, one difference with our controls is that the length of time away from play was similar, whereas the paternity and bereavement control group from the previous study had a mean time off from 4.75±2.53 days compared to the concussed cohort’s 10.91±9.09 days.14 Another possible explanation for this divergence from previous studies is that being injured in any way has an effect that merely being away from play does not. An injury may cause a psychological effect or a physical one, such as pain disrupting sleep or concentration, which has an impact on performance after return.
In our study, by the 15–30-day period, the decrease in the traditional statistics of the concussed group was no longer visible—concussed players’ average and on-base percentages had rebounded to pre-event levels. The observation that concussed and control players perform at a similar level following return to competition is seen in several studies of other sports, including professional hockey,17 basketball,18 and football.19,20
Unexpectedly, we observed that the pre-event baseline in the year of the concussion, but not in the years prior to concussion, of the concussed group was generally worse than that of the control group. This trend was most noticeable for isolated power, soft contact percentage, and hard contact percentage. The quality of contact trend is particularly intriguing, as this group of statistics has been suggested to be a good indicator of performance.23 Interestingly, a similar phenomenon was previously observed in NFL players 2 weeks before they were listed as having a concussion, and several hypotheses were offered: concussion may be an underreported or delayed diagnosis, concussion may be a multi-hit phenomenon, or there may be an underlying condition that increases the chance of suffering from a concussion.20 Concussions in baseball tend to occur after large, high-impact single events, particularly the concussions we studied, making the first two explanations less applicable to baseball, with the exception of catchers, who endure multiple hits to the head from foul tips and swung bats. The third theory, that the players in the concussed cohort were somehow more at risk for a concussion, is plausible; there could have been an underlying condition such as fatigue, depression, or musculoskeletal injury that both made them more vulnerable to a concussion and caused their performance to decline prior to their injury. Prior concussion may have also increased the players’ susceptibility to a future concussion. Considerable future work is needed to explore this concept.
Our analysis yielded another interesting trend. When examining concussed players, traditional batting statistics decreased in the first 15 days, followed by a decrease in plate discipline most apparent between days 15 and 30. It may be that concussed players initially kept their original plate approach but later compensated by becoming more aggressive during the 15–30-day period after their performance declined during the first 15 days, but again, further study is needed to draw definitive conclusions, particularly because, while some of these differences are statistically significant, the magnitude of the difference is small.
There are several limitations to our research. The disabled list is an imperfect tool for diagnosing concussion, and players placed on the disabled list with concussion may have a more severe brain injury than players with concussion not placed on the disabled list. Even with the likely bias toward severe concussion, we did not observe meaningful differences when compared with players on the disabled list from other injuries. We did not address less obvious events or questionable concussive events (eg, head laceration), and the number of concussions we included was constrained by sufficient batting data before and after the event. Some of the batted ball data was based on a smaller than ideal sample size, so we were again constrained by the amount of time before and after the injury. Recovery after concussion may be different than recovery after a non-concussive injury, leading to confounding factors that we were unable to control for. We did not control for additional injuries in the post-concussive period, which may have impacted our results. Finally, unaccounted for variables that could affect player performance include the quality of the opposing team’s defense; the use of the shift; and the length of travel and travel’s effect on sleep, which has recently been shown to decrease batting performance.24
Future analyses could use the MLB Health and Injury Tracking System (HITS) rather than the disabled list to identify players suffering from concussion more accurately. A later study of this topic could use MLB’s Statcast, introduced in 2015, which may expose subtler changes in performance after a concussion by providing more specific batted ball data and advanced defensive metrics. The ideal study to examine the question of concussion’s effects on performance would need to study the pre-event phenomenon and follow players post-event. Regular mood and sleep surveys before a concussion happens could delve into this issue, and injuries occurring before a concussion need to be accounted for as well. Ultimately, improvements in the diagnosis of concussion would greatly enhance our ability to examine its effects on athletes.
Conclusion
In summary, MLB players’ performance decreased after return from concussion, but this decline was not statistically different from the decrease after returning to play from other injuries.
Acknowledgment
We appreciate the assistance of Dan Brooks and Harry Pavlidis in assisting with data abstraction from BrooksBaseball.net.
Disclosure
The authors report no conflicts of interest in this work.
References
Green GA, Pollack KM, D’Angelo J, et al. Mild traumatic brain injury in major and minor league baseball players. Am J Sports Med. 2015;43(5):1118–1126. | ||
Associated Press. Concussion symptoms force Matheny to retire. ESPN.com web site. Available from: http://sports.espn.go.com/mlb/news/story?id=2751419. Published February 1, 2007; Accessed September 27, 2018. | ||
Strauss J. Catcher LaRue says career is over. St. Louis Post-Dispatch web site. Available from: http://www.stltoday.com/sports/baseball/professional/catcher-larue-says-career-is-over/article_324aa4d7-ff34-5706-b12a-b1a023d58d00.html. Published September 19, 2010; Accessed September 27, 2018. | ||
Associated Press. MLB Institutes 7-day DL for concussions. ESPN.com web site. Available from: http://sports.espn.go.com/mlb/news/story?id=6270514. Published March 29, 2011; Accessed September 27, 2018. | ||
Hagen P. New rule on home-plate collisions put into effect. MLB.com website. Available from: https://www.mlb.com/news/mlb-institutes-new-rule-on-home-plate-collisions/c-68267610. Published February 24, 2014; Accessed September 27, 2018. | ||
Hagen P. MLB approves padded cap for pitchers. MLB.com web site. Available from: https://www.mlb.com/news/major-league-baseball-approves-padded-cap-for-pitchers/c-67202016. Published January 28, 2014. Accessed February 20, 2019. | ||
Catena RD, van Donkelaar P, Halterman CI, Chou LS. Spatial orientation of attention and obstacle avoidance following concussion. Exp Brain Res. 2009;194(1):67–77. | ||
Chiu SL, Osternig L, Chou LS. Concussion induces gait inter-joint coordination variability under conditions of divided attention and obstacle crossing. Gait Posture. 2013;38(4):717–722. | ||
Halterman CI, Langan J, Drew A, et al. Tracking the recovery of visuospatial attention deficits in mild traumatic brain injury. Brain. 2006;129(Pt 3):747–753. | ||
Heitger MH, Jones RD, Macleod AD, Snell DL, Frampton CM, Anderson TJ. Impaired eye movements in post-concussion syndrome indicate suboptimal brain function beyond the influence of depression, malingering or intellectual ability. Brain. 2009;132(Pt 10):2850–2870. | ||
Fazio VC, Lovell MR, Pardini JE, Collins MW. The relation between post concussion symptoms and neurocognitive performance in concussed athletes. NeuroRehabilitation. 2007;22(3):207–216. | ||
Johnson B, Zhang K, Hallett M, Slobounov S. Functional neuroimaging of acute oculomotor deficits in concussed athletes. Brain Imaging Behav. 2015;9(3):564–573. | ||
Schwindel LE, Moretti VM, Watson JN, Hutchinson MR. Epidemiology and outcomes of concussions in major league baseball. Ann Orthop Rheumatol. 2014;2(3):1022. | ||
Wasserman EB, Abar B, Shah MN, Wasserman D, Bazarian JJ. Concussions are associated with decreased batting performance among major league baseball players. Am J Sports Med. 2015;43(5):1127–1133. | ||
Search baseball transactions. Pro sports transactions web site. Available from: http://www.prosportstransactions.com/baseball/Search/Search.php. Accessed September 27, 2018. | ||
MLB transactions. MLB.com web site. Available from: http://mlb.mlb.com/mlb/transactions. Accessed September 27, 2018. | ||
Kuhn AW, Zuckerman SL, Totten D, Solomon GS. Performance and style of play after returning from concussion in the National hockey League. Am J Sports Med. 2016;44(8):2152–2157. | ||
Yengo-Kahn AM, Zuckerman SL, Stotts J, et al. Performance following a first professional concussion among national Basketball association players. Phys Sportsmed. 2016;44(3):297–303. | ||
Kumar NS, Chin M, O’Neill C, Jakoi AM, Tabb L, Wolf M. On-field performance of National Football League players after return from concussion. Am J Sports Med. 2014;42(9):2050–2055. | ||
Reams N, Hayward RA, Kutcher JS, Burke JF. Effect of concussion on performance of National Football League players. Int J Sports Physiol Perform. 2017;12(8):1100–1104. | ||
BrooksBaseball. BrooksBaseball.net web site. Available from: http://www.brooksbaseball.net. Accessed September 27, 2018. | ||
Fangraphs. Fangraphs.com web site. Available from: http://www.fangraphs.com. Accessed September 27, 2018. | ||
Quality of contact STATs. Fangraphs.com web site. Available from: http://www.fangraphs.com/library/offense/quality-of-contact-stats/. Accessed September 27, 2018. | ||
Song A, Severini T, Allada R. How jet lag impairs major league baseball performance. Proc Natl Acad Sci USA. 2017;114(6):1407–1412. |
 © 2019 The Author(s). This work is published and licensed by Dove Medical Press Limited. The full terms of this license are available at https://www.dovepress.com/terms.php and incorporate the Creative Commons Attribution - Non Commercial (unported, v3.0) License.
By accessing the work you hereby accept the Terms. Non-commercial uses of the work are permitted without any further permission from Dove Medical Press Limited, provided the work is properly attributed. For permission for commercial use of this work, please see paragraphs 4.2 and 5 of our Terms.
© 2019 The Author(s). This work is published and licensed by Dove Medical Press Limited. The full terms of this license are available at https://www.dovepress.com/terms.php and incorporate the Creative Commons Attribution - Non Commercial (unported, v3.0) License.
By accessing the work you hereby accept the Terms. Non-commercial uses of the work are permitted without any further permission from Dove Medical Press Limited, provided the work is properly attributed. For permission for commercial use of this work, please see paragraphs 4.2 and 5 of our Terms.