")
Back to Journals » Neuropsychiatric Disease and Treatment » Volume 10
The effect of atypical antipsychotics on brain N-acetylaspartate levels in antipsychotic-naïve first-episode patients with schizophrenia: a preliminary study
Authors Grošić V, Grošić P, Kalember P, Janović M, Radoš M, Mihanović M, Henigsberg N
Received 27 January 2014
Accepted for publication 26 March 2014
Published 7 July 2014 Volume 2014:10 Pages 1243—1253
DOI https://doi.org/10.2147/NDT.S61415
Checked for plagiarism Yes
Review by Single anonymous peer review
Peer reviewer comments 4
Vladimir Grošić,1 Petra Folnegovic Grošić,2 Petra Kalember,3,4 Maja Bajs Janović,2 Marko Radoš,3,4 Mate Mihanović,1 Neven Henigsberg3,5
1Psychiatric Hospital Sveti Ivan, Zagreb, 2University Hospital Center Zagreb, University of Zagreb, Zagreb, 3Polyclinic Neuron, Croatian Institute for Brain Research, Zagreb, 4Department of Neuropharmacology and Behavioral Pharmacology, Croatian Institute for Brain Research, University of Zagreb, Zagreb, 5Vrapče University Hospital, University of Zagreb, Zagreb, Croatia
Purpose: To investigate the correlates of a clinical therapeutic response by using the parameters measured by proton magnetic resonance spectroscopy after the administration of atypical antipsychotics.
Patients and methods: Twenty-five antipsychotic-naïve first-episode patients with schizophrenia were monitored for 12 months. The patients were evaluated using 1H magnetic resonance spectroscopy in the dorsolateral prefrontal cortex and Positive and Negative Syndrome Scale, Clinical Global Impression Scale of Severity, Tower of London – Drexel University, Letter–Number Span Test, Trail Making Test A, and Personal and Social Performance Scale. They were administered atypical antipsychotics, starting with quetiapine. In the absence of a therapeutic response, another antipsychotic was introduced.
Results: After 12 study months, the N-acetylaspartate/creatine (NAA/Cr) level did not significantly change at the whole-group level. Additional analysis revealed a significant rise in the NAA/Cr level in the study group that stayed on the same antipsychotic throughout the study course (P=0.008) and a significant drop in NAA/Cr in the study group that switched antipsychotics (P=0.005). On the whole-group level, no significant correlations between NAA/Cr values and other scores were found at either baseline or after 12 study months.
Conclusion: One-year treatment with atypical antipsychotics administered to antipsychotic-naïve patients didn’t result in a significant rise in the NAA/Cr ratio. However, a significant rise was witnessed in the study group in which a satisfactory therapeutic response had been achieved with a single antipsychotic administration.
Keywords: schizophrenia, atypical antipsychotics, NAA, MRS
Introduction
N-acetylaspartate (NAA) is considered to be the marker of neuron dysfunction and/or loss.1–3 Akin to the level of creatine (Cr) plus phosphocreatine and some other brain metabolites, the NAA level can be determined using in vivo proton magnetic resonance spectroscopy (1H MRS). Upon the cessation of an adverse impact or treatment, the NAA level may prove itself reversible.4–7
A meta-analysis that compared NAA levels in patients with schizophrenia and healthy controls found significant NAA reductions in the frontal lobe and hippocampus in patients with schizophrenia. Many authors consider that decreased NAA levels might be a biomarker for neurological diseases. The main results are presented in Table 1.8–31 NAA changes occur in the early stage of illness. No further decrease in the NAA level was found among chronic patients.9,10
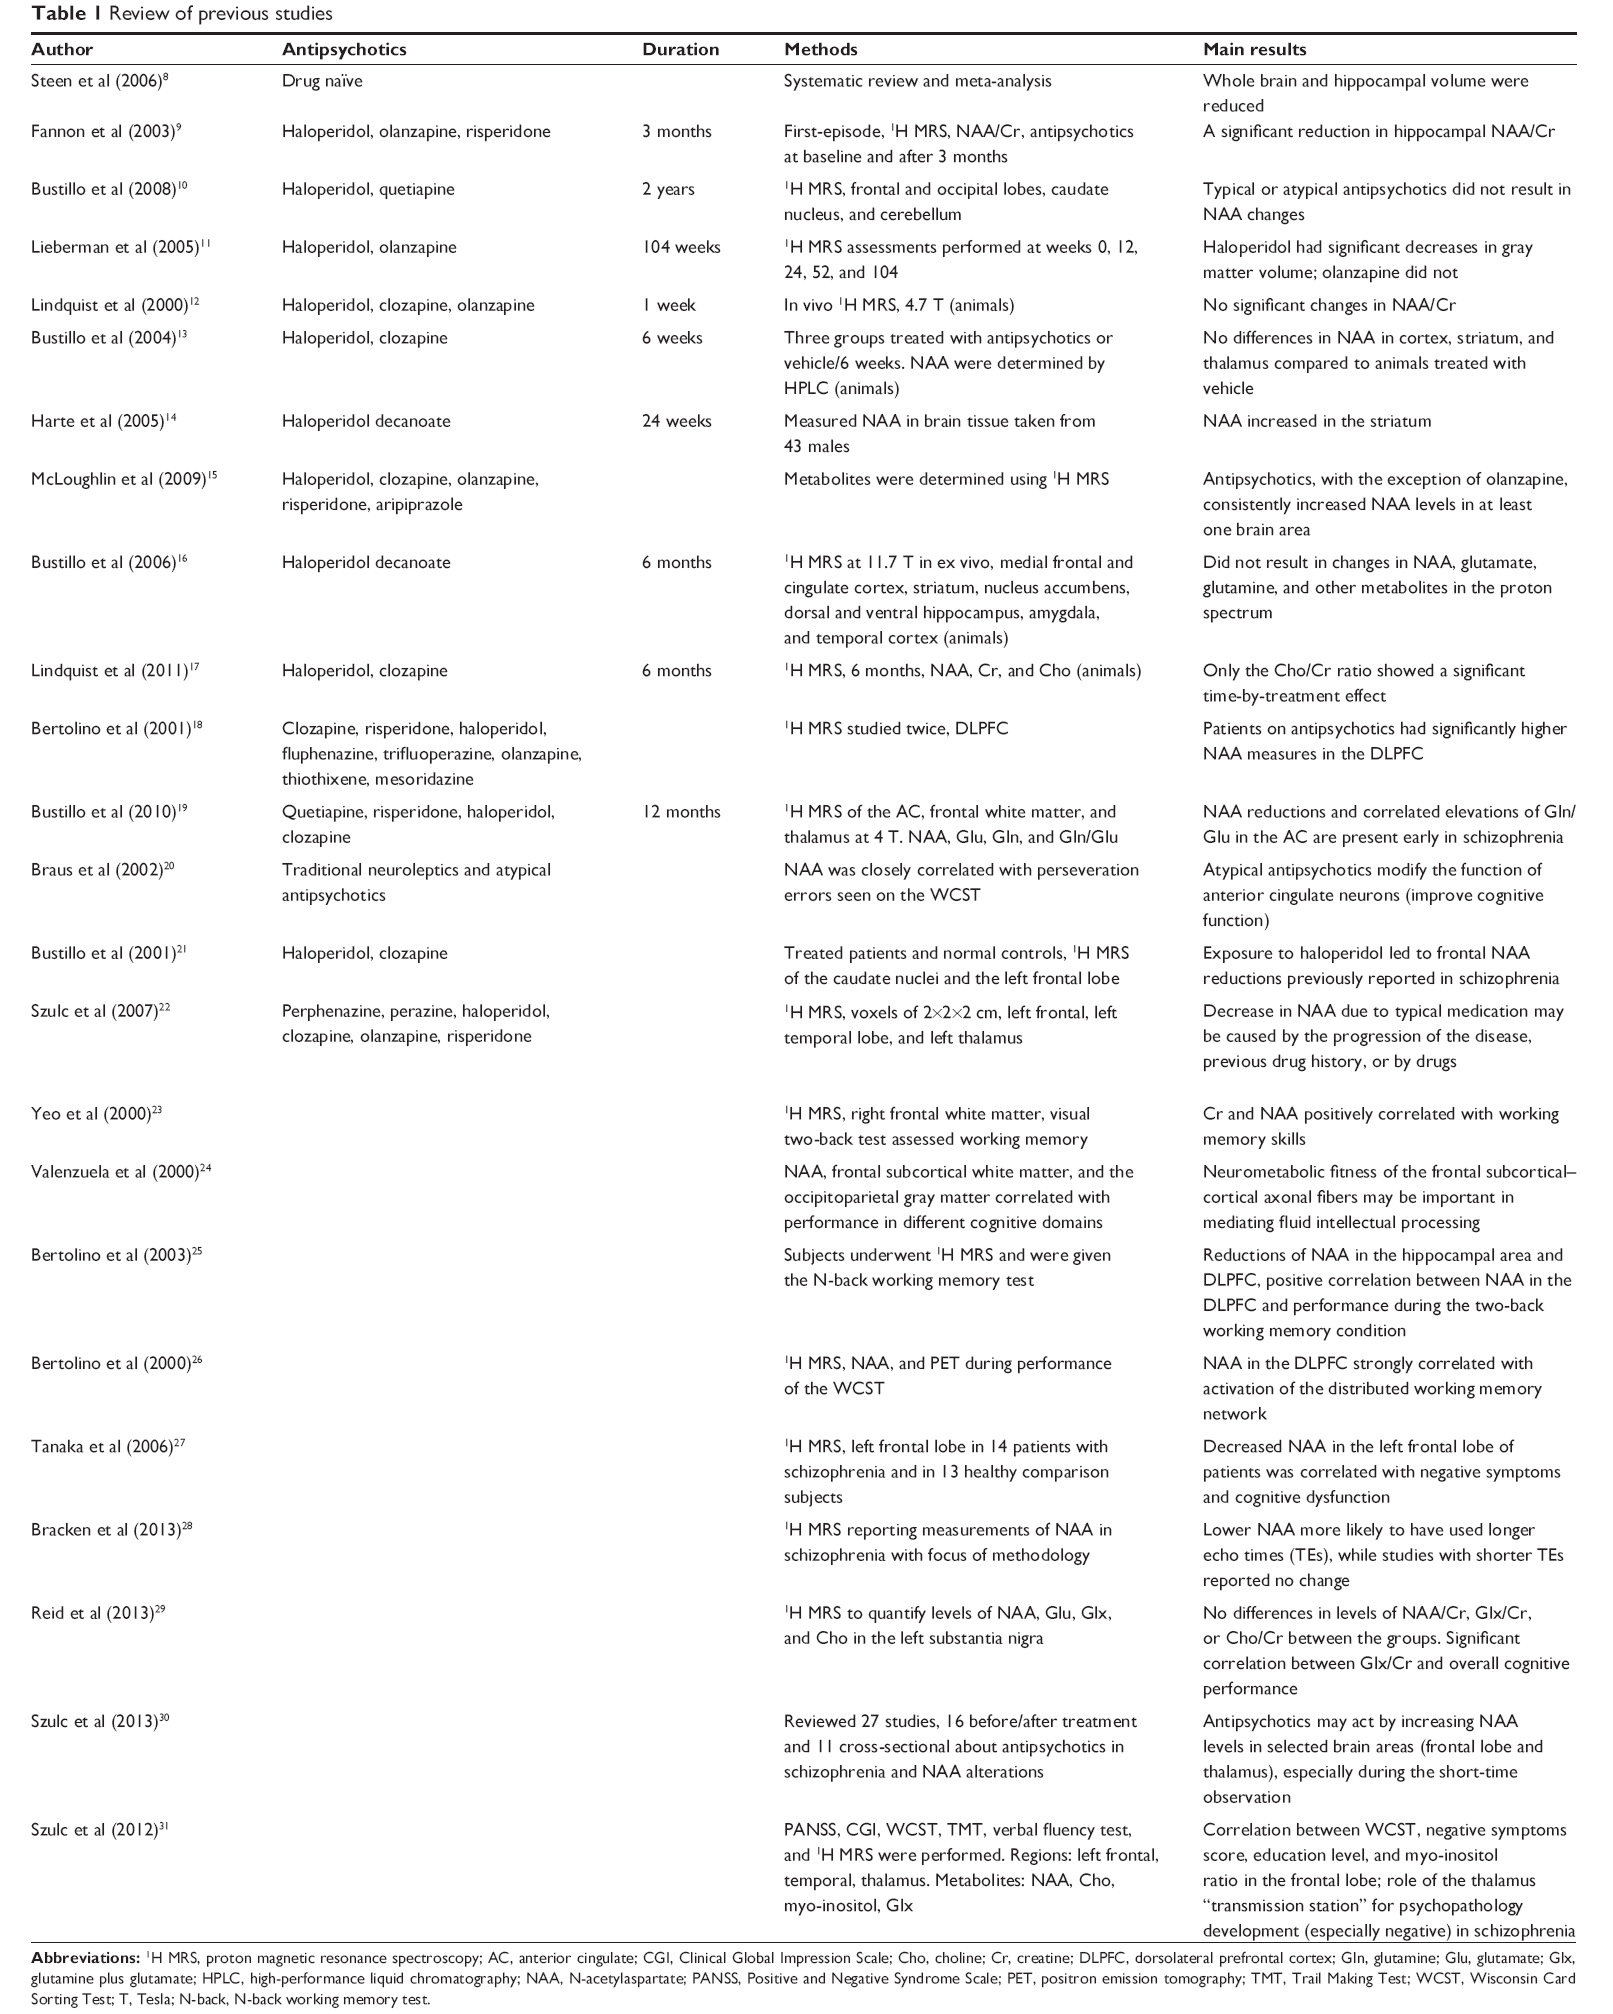 | Table 1 Review of previous studies |
The aim of this study was to investigate the correlates of a clinical therapeutic response by using the parameters measured by 1H MRS after the administration of atypical antipsychotics. The specific aim was to establish the influence of atypical antipsychotics on the NAA/Cr ratio in the dorsolateral prefrontal cortex of antipsychotic-naïve first-episode patients with schizophrenia, as well as to investigate the relationship between the NAA/Cr ratio and positive, negative, and cognitive symptoms and functioning of patients.
Materials and methods
Patients
The study enrolled patients diagnosed with schizophrenia and schizophreniform disorder in line with Diagnostic and Statistical Manual of Mental Disorders, Fourth Edition criteria.32 Throughout the follow-up course, all patients were expected to meet the diagnostic criteria observed with schizophrenia. Patients were recruited from the pool of consecutive outpatients seen by the Polyclinic Neuron (Zagreb, Croatia) and were all antipsychotic-naïve at the time of the first scan. All the patients had regular checkups. No psychotherapy was performed.
Exclusion criteria were: other psychiatric disorders, neurological disorders, a history of significant drug abuse, drug use in the past year, pregnancy and lactation, major somatic conditions, head trauma that rendered the patient unconscious, risk of suicide as estimated by the Columbia Suicide Severity Rating Scale,33 and the incapacity to give informed consent. No brain atrophy or other brain morphology alteration was seen on any baseline MR imaging. Upon being thoroughly informed about the study concept, the patients gave their written informed consent. The study was approved by the institutional Board of Ethics.
Follow-up procedure
Two MR imaging scans were completed; the first one took place at baseline and the second one was scheduled for the end of the 1-year follow-up period (±1 month). Prior to each scan, the patients were administered 5–10 mg diazepam. Throughout the follow-up course, patients were administered antipsychotics in line with the study protocol. At first, quetiapine (400–800 mg QD) was introduced. In cases where a treatment response was not seen within 3 months – despite dose adjustments (as established using adequate scales), olanzapine (10–20 mg QD) was introduced. In cases where the above history repeated itself, olanzapine was first replaced by risperidone (2–8 mg QD) and then by clozapine (100–900 mg QD).
The study was initially comprised of 30 patients. Two of them were subsequently excluded after they had an overwhelming fear response that prevented the completion of either the first or second scan. One examinee withdrew his informed consent, while one witnessed a major deterioration and had to be hospitalized, rendering him unable to complete the study. Following the first scan, one examinee suffered an injury to his eye caused by metal foreign body penetration. This injury necessitated his departure from the study. The study was completed by 25 examinees. Upon the study’s completion, ten patients were treated with quetiapine, ten with olanzapine, and four with risperidone, while clozapine was not taken by any of the patients. Despite the study’s protocol, in the single case where a patient developed metabolic syndrome, ziprasidone had to be introduced.
Instruments
Both at baseline and at every 3 months for the remainder of the study, the following tests were administered: Positive and Negative Syndrome Scale (PANSS)34 applicable for psychopathology, Clinical Global Impression of Severity (CGI-S)35 suitable for the determination of severity level, Tower of London – Drexel University (TOL DX),36 Trail Making Test A (TMT-A)37 and Letter–Number Span Test (LN)38 suitable for swift neuropsychological assessment, and Personal and Social Performance Scale (PSP)39 suitable for the determination of functionality level.
PANSS consists of positive, negative, and general psychopathology scales. For TOL DX, which is viewed as the executive functions test, the examinee is required to move several differently colored beads across three pegs in line with a predestined pattern, making as few moves as possible. Within the frame of TMT-A, which is viewed as the visual attention test, the examinee is asked to connect randomly arranged numbers in their sequential order. LN, which is considered to be a working memory test, requires the examinee to sort relatively short sequences of randomly presented letters and numbers in both sequential and alphabetic order.
Treatment response was evaluated using CGI-S and CGI of Improvement35 every 3 months. In addition, the Simpson–Angus Scale40 for parkinsonism, Abnormal Involuntary Movements Scale41 for tardive dyskinesia, and the Barnes Akathisia Rating Scale42 for akathisia were used every 3 months.
1H MRS
Patients were scanned using a 3T MR device (Magnetom® Trio; Siemens AG, Erlangen, Germany) equipped with a 12-channel head coil suitable for MRS. Standard T1 and T2 sequences completed in the coronal, sagittal, and axial plane and covering the entire brain were acquired for each subject to the effect of spectral localization and exclusion of possible structural brain damage. The spectroscopic volume of interest, having a size of 15×15×15 mm, was selected in the left dorsolateral prefrontal cortex region (Figure 1) so as to minimize the amount of cerebrospinal fluid contained in the volume of interest.
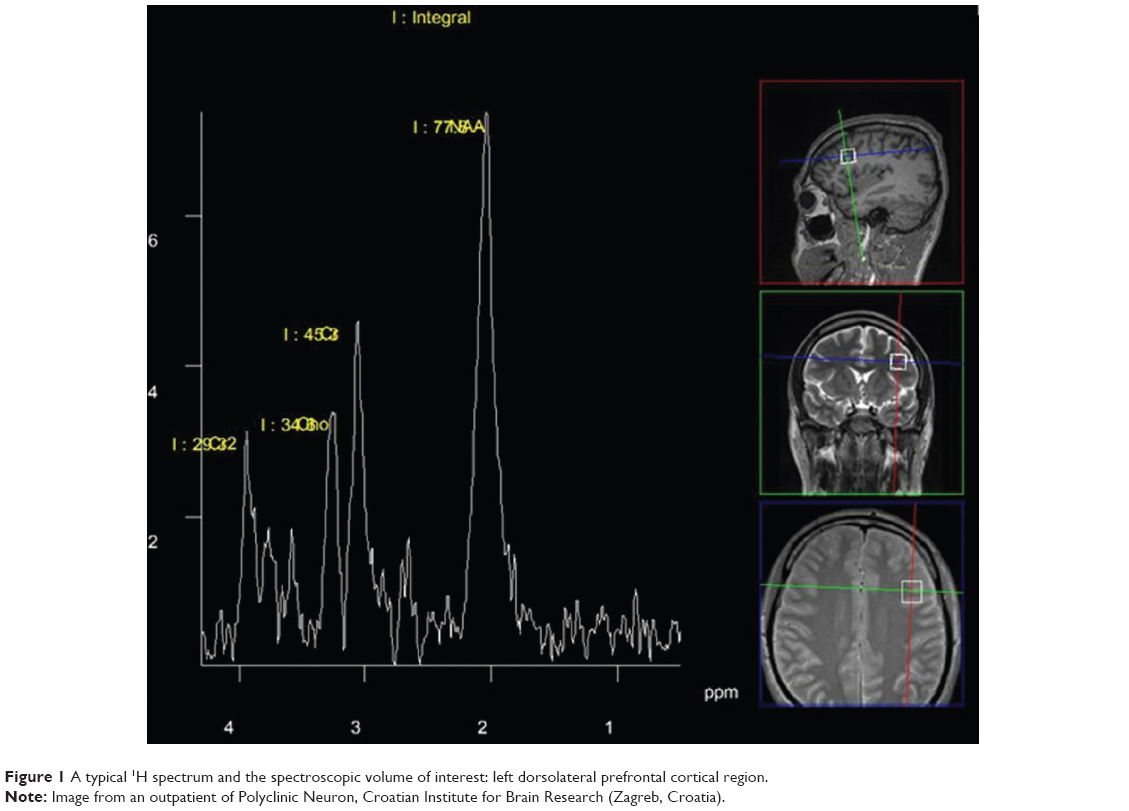 | Figure 1 A typical 1H spectrum and the spectroscopic volume of interest: left dorsolateral prefrontal cortical region. |
Given the fact that the patients’ profiles called for shorter scanning times, the left dorsolateral prefrontal cortex, which is the brain area frequently targeted by other authors as well, was focused on. Single-voxel spectra were acquired using a point-resolved spectroscopy; the echo time equaled 135 milliseconds, with a repetition time of 2,000 milliseconds and a spectral width of 10 ppm. The target area was scanned 128 times on average with a scanning time of 4:17 minutes. An appropriate automated procedure was used to optimize field homogeneity, radiofrequency pulse power, and water suppression, as well as to convert the lines into a Gaussian shape. A typical 1H MRS spectrum is shown in Figure 1. By virtue of the foregoing, integral values of NAA and Cr peaks were obtained, while NAA/Cr ratios were used for further analysis.
Statistical analysis
The Smirnov–Kolmogorov test was used to analyze data distribution. Due to the nature of the findings and a relatively small sample size, nonparametric tests were employed with other analyses. Medians and corresponding interquartile ranges were used to describe quantitative values. Differences in antipsychotic drug use and quantitative scores (PANSS, CGI-S, TOL DX, LN, TMT-A, and PSP scores and NAA/Cr values) seen between the study groups, were analyzed using the Mann–Whitney U test. The Wilcoxon test was used to assess differences between quantitative variables seen at the beginning and at the end of the study (after 12 months). Spearman’s correlation coefficients (rho) were calculated so as to analyze the correlation between MR findings and test scores. All P-values lower than 0.05 were considered statistically significant. All statistical analyses made use of IBM SPSS® Statistics version 19.0.0.1 (IBM Corporation, Armonk, NY, USA).
Results
Twenty-five patients were monitored for 12 months: 15 (60.0%) had used more than one antipsychotic drug. The majority of patients were men (20; 80.0%). The educational background of the study group was as follows: 16 examinees (64.0%) had 12 years of formal education. Thirteen patients (52.0%) were unemployed, 17 (68.0%) were single, and 18 (72.0%) declared themselves tobacco smokers. All patients were right-handed.
Viewed on the whole-group level, no significant NAA/Cr changes were seen after 12 months of study (P=0.668). The subsequent analysis embraced two distinctive patient groups: one included patients who – due to their favorable and swift therapeutic response – remained on initial quetiapine therapy throughout the study course, and the other included patients who, within the same timeframe, had to be administered two or more atypical antipsychotics. There were no significant differences between the groups (Table 2). It is possible that the first group maintained better therapy compliance or social support. Throughout the monitoring period, these two groups showed no significant differences in their scores on the following psychiatric tests: PANSS, CGI-S, TOL DX, LN, TMT-A, and PSP. The only exception was the NAA/Cr ratio after 12 months, which was significantly higher in the group that stayed on the same antipsychotic drug throughout the study course (median [IQR] 1.93 [1.87–2.27]) compared to the drug-changing group (1.70 [1.37–1.77]; P=0.006). As for the differences between paired measures (baseline versus month 12), the drug-changing group exhibited noteworthy dynamics: total PANSS score (P=0.001), positive PANSS score (P=0.001), general PANSS score (P=0.011), CGI-S score (P=0.018), and NAA/Cr (P=0.008) decreased, while LN score (P=0.001) and PSP score (P=0.001) increased (Table 3). In the group that stayed on the same antipsychotic drug throughout the study course, total PANSS score (P=0.032), positive PANSS score (P=0.009), negative PANSS score (P=0.027), and CGI-S score (P=0.025) decreased, while LN score (P=0.005), PSP score (P=0.008), and NAA/Cr (P=0.005) increased (Table 4).
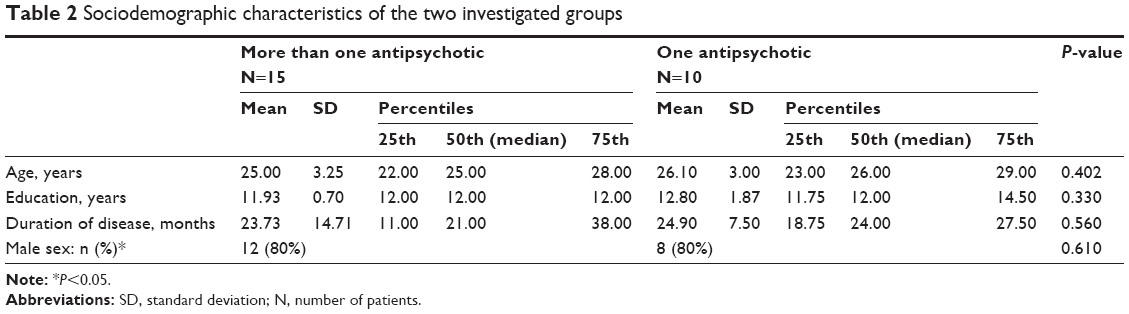 | Table 2 Sociodemographic characteristics of the two investigated groups |
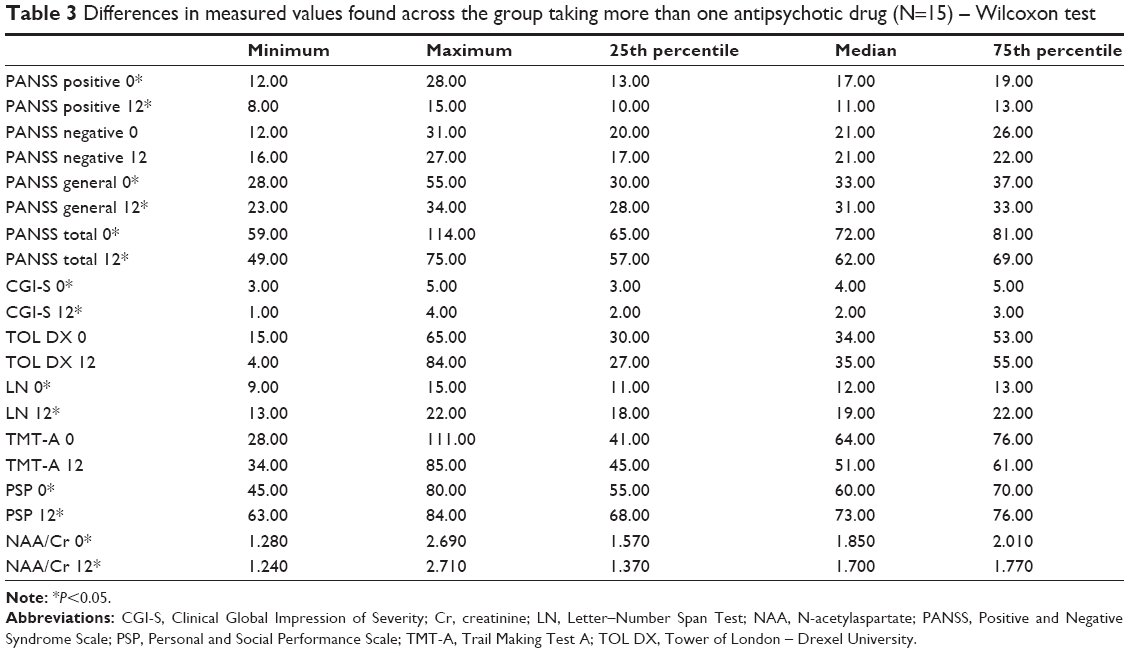 | Table 3 Differences in measured values found across the group taking more than one antipsychotic drug (N=15) – Wilcoxon test |
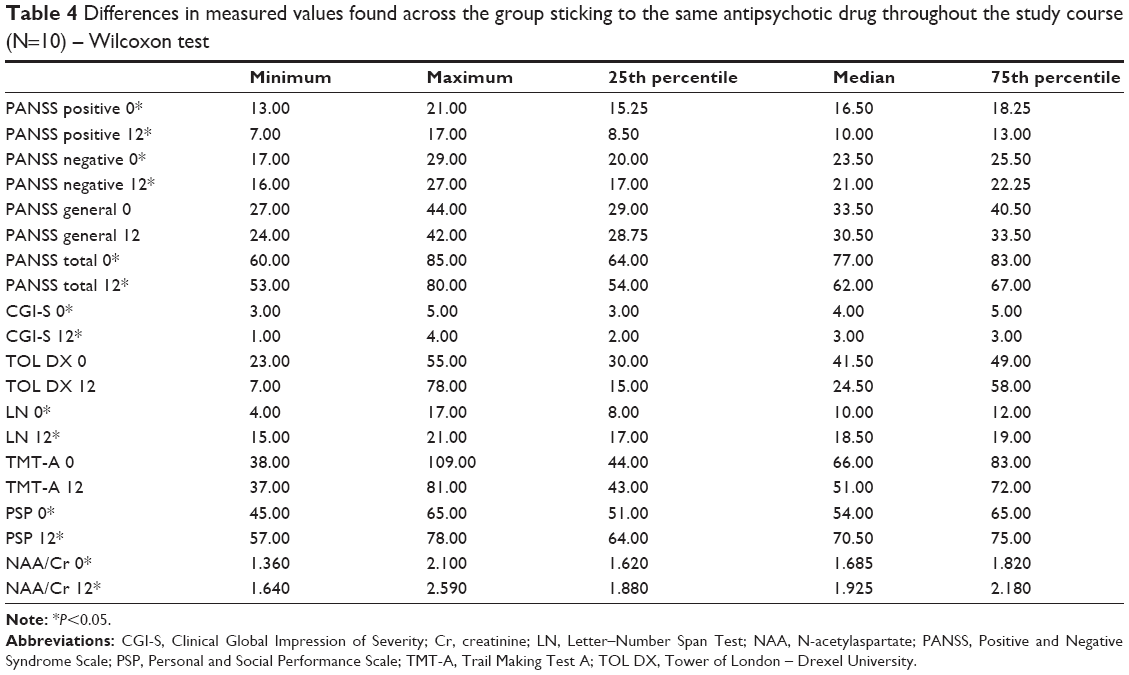 | Table 4 Differences in measured values found across the group sticking to the same antipsychotic drug throughout the study course (N=10) – Wilcoxon test |
In the group with more than one antipsychotic drug, significant negative correlations of NAA/Cr with PANSS positive and TOL DX score were found at the beginning of the study. After 12 months, NAA/Cr levels were significantly positive correlated with Hamilton Depression Rating Scale and LN scores.
At the beginning of the study in the group with only one antipsychotic drug, a significant correlation was noted between NAA/Cr and Hamilton Depression Rating Scale levels. After 12 months, significant and strong negative correlations of NAA/Cr with CGI-S and TMT-A scores were found (Table 5).
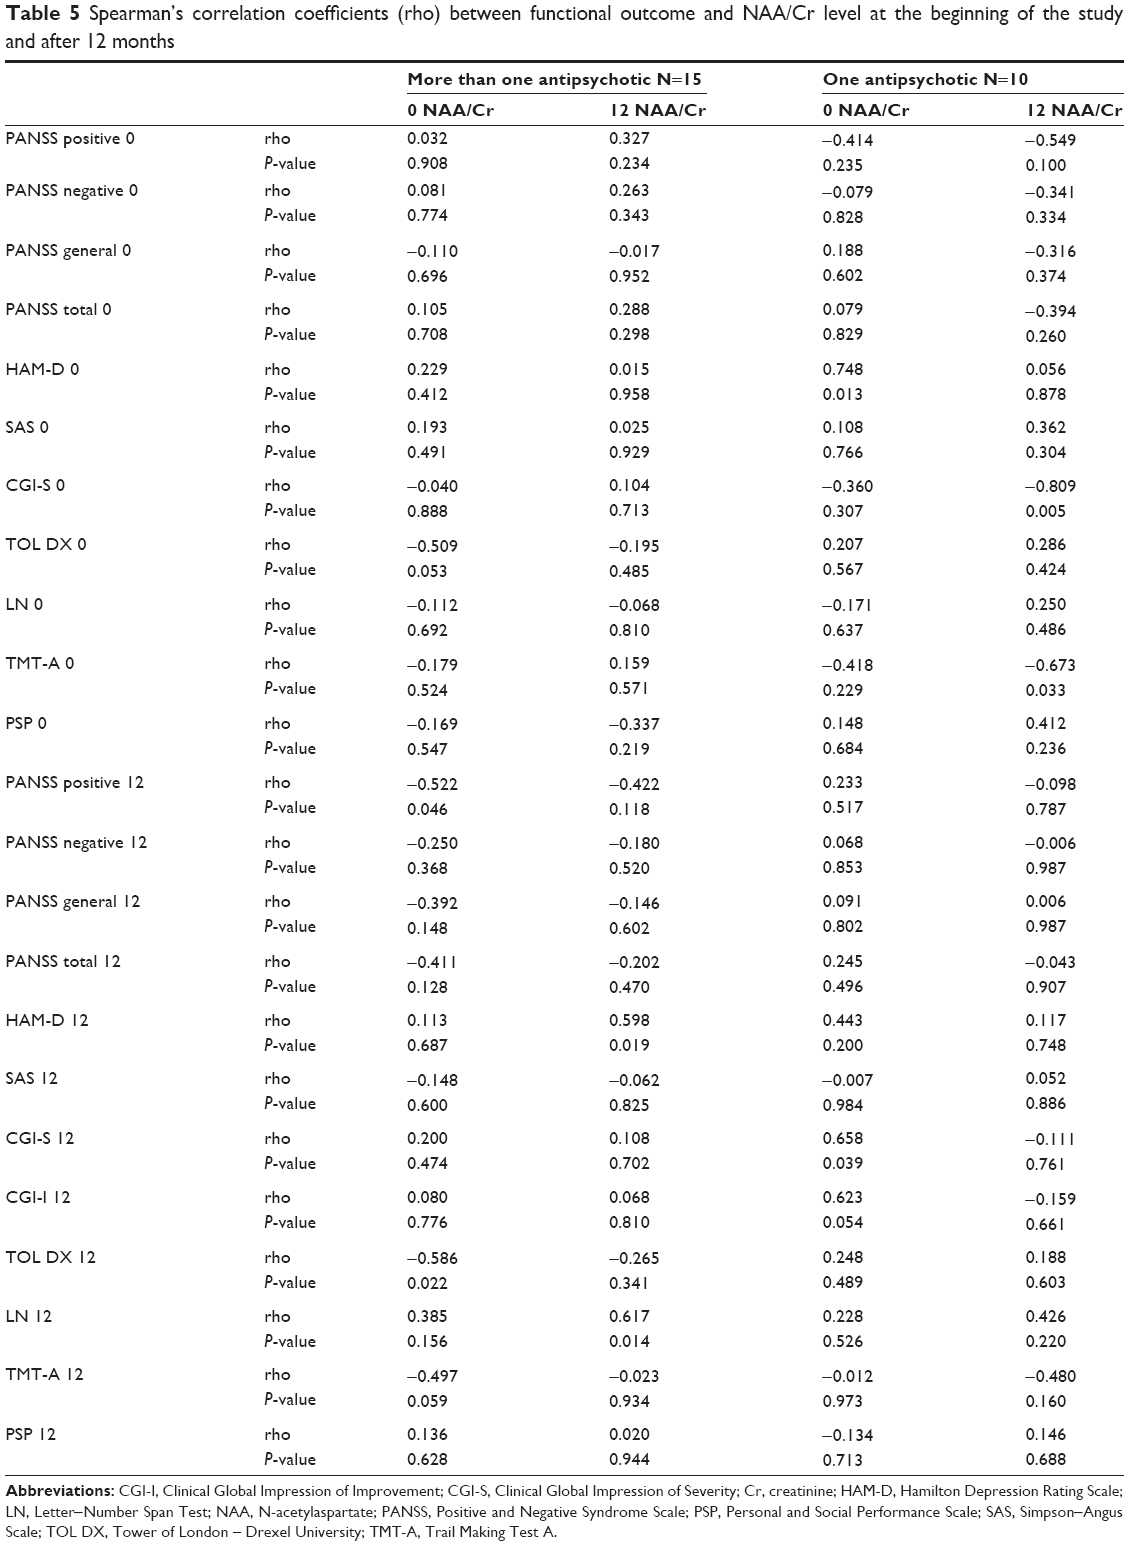 | Table 5 Spearman’s correlation coefficients (rho) between functional outcome and NAA/Cr level at the beginning of the study and after 12 months |
Viewed on the whole-sample level, no significant correlations between NAA/Cr values and other scores were seen either at baseline or after 12 study months. The same goes for the baseline status of the patients changing their antipsychotic drugs in the further course. After 12 study months, significant correlations between NAA/Cr and other scores were noted only among drug-switching patients, in whom a positive correlation with LN score was established (rho=0.617; P=0.014).
Discussion
This study failed to demonstrate any significant difference in NAA/Cr throughout the administration of the novel antipsychotic drug. Similar results were obtained in several recent studies.10,19 However, an intra-sample comparison of patients who favorably and swiftly responded to initial therapy with patients who needed two or more antipsychotic drugs (in order to attain a satisfactory therapeutic response) pointed towards different outcomes. Upon completion of the therapy, the first patient group showed a significant rise in NAA/Cr, both from baseline and compared to the second patient group’s month 12 results. The second patient group not only failed to experience a rise in NAA/Cr, but also experienced a drop in NAA/Cr throughout the therapy course, despite the satisfactory end-study stage therapeutic response (Figure 2).
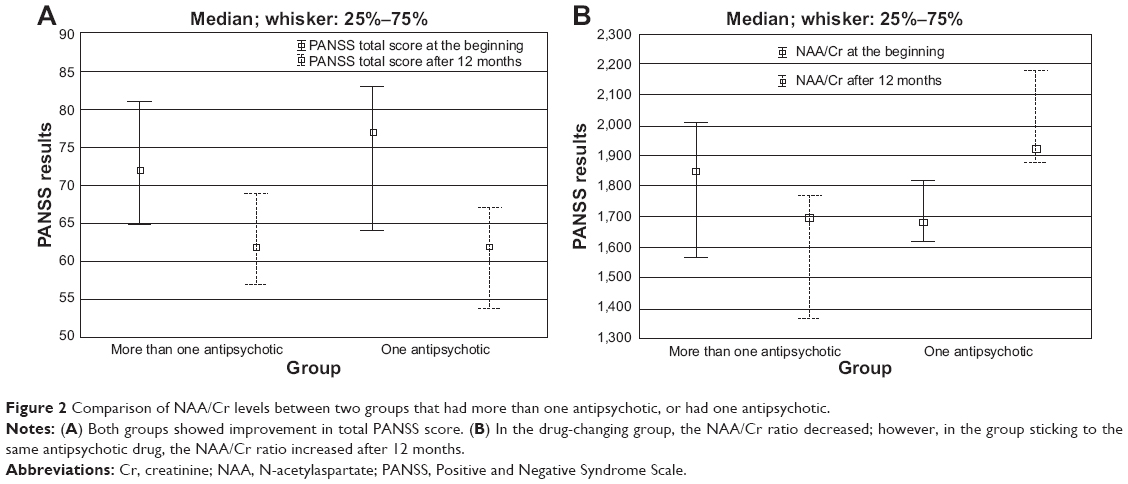 | Figure 2 Comparison of NAA/Cr levels between two groups that had more than one antipsychotic, or had one antipsychotic. |
To the best of the authors’ knowledge, this is the very first follow-up study carried out in antipsychotic-naïve first-episode schizophrenic patients. The baseline scan was performed without any antipsychotic or other treatment except 5–10 mg diazepam for all patients. The differing results of the two groups might explain why the outcomes of previous studies vary to such a great extent. Differences in study outcomes could also be attributed to the differences in duration of the monitoring period, as well as the differences in sample sizes, selection of the target brain region, and the employed 1H MRS technique. In addition, the administered antipsychotic drugs were mutually different and given in various disease and treatment stages. The authors are fully aware of the limitations of this study, which can be attributed to the size of the studied sample. This was especially apparent with the intra-sample patient grouping; however, the fact that the patients who stayed on a single antipsychotic drug throughout the monitoring period exhibited a unanimous rise in NAA/Cr levels deserves attention and should be considered indicative.
The current results correspond with those of another study which demonstrated a drop in NAA levels across the non-remitting patients and a rise in NAA levels across the remitting patients, even though a 28-day treatment of manic adolescents failed to yield any rise in total NAA levels.43 It is worth noting that the patients treated within the framework of the above study received olanzapine, which failed to yield a rise in NAA levels in the examinees (N=10) despite the achieved therapeutic response. That could be best explained by the fact that this study focused on patients with schizophrenia, while the study in reference was comprised of type I bipolar disorder patients. The results could also be related to the affective basis of bipolar disorder.44 In addition, the NAA rise witnessed within the framework of the latter study is more likely to be attributed to the alleviation of manic symptoms than to the olanzapine-related therapeutic effects. Even though the patients in the current study were treated with more than one atypical antipsychotic drug and unanimously responded to treatment (thereby taking the study design into account), the rise in NAA/Cr levels was witnessed only in the quetiapine monotherapy arm. Such a finding, together with the lack of olanzapine-related therapeutic benefits, could be suggestive of differences in the acting mechanisms of various atypical antipsychotic drugs, at least when it comes to NAA. Pending additional research, of course, MRS might prove to be a useful guide for choosing the early-stage therapy of patients with schizophrenia. However, the fact that olanzapine was the first administered and the last withdrawn drug in the study protocol – that is to say, the only drug administered to the study group throughout the entire 12-month study course – should not be neglected.
This study failed to reveal any substantial relationship between NAA/Cr and a psychopathology profile. The correlation between the investigated variable and cognitive functioning is merely suggested by the positive correlation with LN scores, which was seen only at follow-up month 12 and only in patients taking more than one antipsychotic drug. The absence of correlation between the investigated parameter and cognitive functioning could be attributed in part to a lower number of employed tests compared to some of the previous studies. That is, within the frame of the current study, only rapid neuropsychological testing was carried out, mostly because of the patients’ profiles; on the occasion of the first testing, the patients were acute and antipsychotic medication-naïve.
While some of the studies from the introduction managed to demonstrate a correlation between the alterations in 1H MRS – established metabolite concentrations and various symptoms (only in functionally-related brain regions, however), other studies failed to reveal such a specific pattern and operated on the presumption of wider white and gray matter damage inflicted by schizophrenia.45 Bustillo et al are of the opinion that studies investigating schizophrenia, which implies minor, albeit widespread, white and gray matter alterations, should aim to target wider brain regions.46
This is also a limitation of the current study, which targeted one brain region only. Another limitation may be the sole availability of baseline and final MR scans. Additional scans would significantly contribute to a better understanding of NAA/Cr study dynamics, especially when it comes to scores obtained with the employed battery of tests.47
Conclusion
In summary, a 1-year administration of atypical antipsychotic drugs to antipsychotic-naïve patients failed to evoke any substantial rise in NAA/Cr. However, a significant increase in NAA/Cr levels was seen in patients who stayed on their initial antipsychotic medication, which yielded a favorable therapeutic response. Despite the limitations of the current study, this finding points towards a link between NAA/Cr levels and atypical antipsychotic medication, which should be further investigated within a broader framework.48
Acknowledgments
Patient consent was obtained for the use of the photo in Figure 1. All authors have equally contributed to the publication. Henigsberg was a team leader and principal researcher in the project.
Disclosure
The authors report no conflicts of interest in this work.
References
Maddock RJ, Buonocore MH. MR spectroscopic studies of the brain in psychiatric disorders. Curr Top Behav Neurosci. Epub 2012 Feb 1. | ||
Moffett JR, Ross B, Arun P, Madhavarao CN, Namboodiri AM. N-acetylaspartate in the CNS: from neurodiagnostics to neurobiology. Prog Neurobiol. 2007;81(2):89–131. | ||
Demougeot C, Marie C, Giroud M, Beley A. N-acetylaspartate: a literature review of animal research on brain ischaemia. J Neurochem. 2004; 90(4):776–783. | ||
Narayanan S, De Stefano N, Francis GS, et al. Axonal metabolic recovery in multiple sclerosis patients treated with interferon β-1b. J Neurol. 2001;248(11):979–986. | ||
Salo R, Buonocore MH, Leamon M, et al. Extended findings of brain metabolite normalization in MA-dependent subjects across sustained abstinence: a proton MRS study. Drug Alcohol Depend. 2011;113(2–3): 133–138. | ||
Henigsberg N, Kalember P, Hrabać P, et al. 1-H MRS changes in dorsolateral prefrontal cortex after donepezil treatment in patients with mild to moderate Alzheimer’s disease. Coll Antropol. 2011;35(Suppl 1): 159–162. | ||
Henigsberg N, Bajs M, Hrabać P, et al. Changes in brain metabolites measured with magnetic resonance spectroscopy in antidepressant responders with comorbid major depression and posttraumatic stress disorder. Coll Antropol. 2011;35(Suppl 1):145–148. | ||
Steen RG, Mull C, McClure R, Hamer RM, Lieberman JA. Brain volume in first-episode schizophrenia: systematic review and meta-analysis of magnetic resonance imaging studies. Br J Psychiatry. 2006; 188:510–518. | ||
Fannon D, Simmons A, Tennakoon L, et al. Selective deficit of hippocampal N-acetylaspartate in antipsychotic-naïve patients with schizophrenia. Biol Psychiatry. 2003;54(6):587–598. | ||
Bustillo JR, Rowland LM, Jung R, et al. Proton magnetic resonance spectroscopy during initial treatment with antipsychotic medication in schizophrenia. Neuropsychopharmacology. 2008;33(10):2456–2466. | ||
Lieberman JA, Tollefson GD, Charles C, et al. Antipsychotic drug effects on brain morphology in first-episode psychosis. Arch Gen Psychiatry. 2005;62(4):361–370. | ||
Lindquist DM, Hawk RM, Karson CN, Komoroski RA. Effects of antipsychotic drugs on metabolite ratios in rat brain in vivo. Magn Reson Med. 2000;43(3):355–358. | ||
Bustillo J, Wolff C, Myers-y-Gutierrez A, et al. Treatment of rats with antipsychotic drugs: lack of an effect on brain N-acetyl aspartate levels. Schizophr Res. 2004;66(1):31–39. | ||
Harte MK, Bachus SB, Reynolds GP. Increased N-acetylaspartate in rat striatum following long-term administration of haloperidol. Schizophr Res. 2005;75(2–3):303–308. | ||
McLoughlin GA, Ma D, Tsang TM, et al. Analyzing the effects of psychotropic drugs on metabolite profiles in rat brain using 1H NMR spectroscopy. J Proteome Res. 2009;8(4):1943–1952. | ||
Bustillo J, Barrow R, Paz R, et al. Long-term treatment of rats with haloperidol: lack of an effect on brain N-acetyl aspartate levels. Neuropsychopharmacology. 2006;31(4):751–756. | ||
Lindquist DM, Dunn RS, Cecil KM. Long term antipsychotic treatment does not alter metabolite concentrations in rat striatum: an in vivo magnetic resonance spectroscopy study. Schizophr Res. 2011; 128(1–3):83–90. | ||
Bertolino A, Callicott JH, Mattay VS, et al. The effect of treatment with antipsychotic drugs on brain N-acetylaspartate measures in patients with schizophrenia. Biol Psychiatry. 2001;49(1):39–46. | ||
Bustillo JR, Rowland LM, Mullins P, et al. 1H-MRS at 4 Tesla in minimally treated early schizophrenia. Mol Psychiatry. 2010;15(6):629–636. | ||
Braus DF, Ende G, Weber-Fahr W, Demirakca T, Tost H, Henn FA. Functioning and neuronal viability of the anterior cingulate neurons following antipsychotic treatment: MR-spectroscopic imaging in chronic schizophrenia. Eur Neuropsychopharmacol. 2002;12(2):145–152. | ||
Bustillo JR, Lauriello J, Rowland LM, et al. Effects of chronic haloperidol and clozapine treatments on frontal and caudate neurochemistry in schizophrenia. Psychiatry Res. 2001;107(3):135–149. | ||
Szulc A, Galinska B, Tarasow E, et al. N-acetylaspartate (NAA) levels in selected areas of the brain in patients with chronic schizophrenia treated with typical and atypical neuroleptics: a proton magnetic resonance spectroscopy (1H MRS) study. Med Sci Monit. 2007;13(Suppl 1):17–22. | ||
Yeo RA, Hill D, Campbell R, Vigil J, Brooks WM. Developmental instability and working memory ability in children: a magnetic resonance spectroscopy investigation. Dev Neuropsychol. 2000;17(2):143–159. | ||
Valenzuela MJ, Sachdev PS, Wen W, Shnier R, Brodaty H, Gillies D. Dual voxel proton magnetic resonance spectroscopy in the healthy elderly: subcortical-frontal axonal N-acetylaspartate levels are correlated with fluid cognitive abilities independent of structural brain changes. Neuroimage. 2000;12(6):747–756. | ||
Bertolino A, Sciota D, Brudaglio F, et al. Working memory deficits and levels of N-acetylaspartate in patients with schizophreniform disorder. Am J Psychiatry. 2003;160(3):483–489. | ||
Bertolino A, Esposito G, Callicott JH, et al. Specific relationship between prefrontal neuronal N-acetylaspartate and activation of the working memory cortical network in schizophrenia. Am J Psychiatry. 2000;157(1):26–33. | ||
Tanaka Y, Obata T, Sassa T, et al. Quantitative magnetic resonance spectroscopy of schizophrenia: relationship between decreased N-acetylaspartate and frontal lobe dysfunction. Psychiatry Clin Neurosci. 2006;60(3):365–372. | ||
Bracken BK, Rouse ED, Renshaw PF, Olson DP. T2 relaxation effects on apparent N-acetylaspartate concentration in proton magnetic resonance studies of schizophrenia. Psychiatry Res. 2013;213(2):142–153. | ||
Reid MA, Kraguljac NV, Avsar KB, White DM, den Hollander JA, Lahti AC. Proton magnetic resonance spectroscopy of the substantia nigra in schizophrenia. Schizophr Res. 2013;147(2–3):348–354. | ||
Szulc A, Galińska-Skok B, Waszkiewicz N, Bibulowicz D, Konarzewska B, Tarasów E. Proton magnetic resonance spectroscopy changes after antipsychotic treatment. Curr Med Chem. 2013;20(3):414–427. | ||
Szulc A, Galińska-Skok B, Tarasów E, et al. Clinical and cognitive correlates of the proton magnetic resonance spectroscopy measures in chronic schizophrenia. Med Sci Monit. 2012;18(6):CR390–CR398. | ||
First MB, Spitzer RL, Gibbon M, Wiliams JBW. Structured Clinical Interview for DSM-IV-TR Axis I Disorders, Research Version (SCID-I). New York, NY: Biometrics Research; 2001. | ||
Posner K, Brown GK, Stanley B, et al. The Columbia-Suicide Severity Rating Scale: initial validity and internal consistency findings from three multisite studies with adolescents and adults. Am J Psychiatry. 2011; 168(12):1266–1277. | ||
Kay SR, Fiszbein A, Opler LA. The positive and negative syndrome scale (PANSS) for schizophrenia. Schizophr Bull. 1987;13(2):261–276. | ||
Guy W. ECDEU Assessment Manual for Psychopharmacology. Washington, DC: US Department of Health, Education, and Welfare; 1976. | ||
Culbertson W, Zillmer E. Tower of London Drexel University (TOL DX). 2nd ed. Chicago, IL: Multi-Health Systems; 2005. | ||
Tombaugh TN. Trail Making Test A and B: normative data stratified by age and education. Arch Clin Neuropsychol. 2004;19(2):203–214. | ||
Gold JM, Carpenter C, Randolph C, Goldberg TE, Weinberger DR. Auditory working memory and Wisconsin Card Sorting Test performance in schizophrenia. Arch Gen Psychiatry. 1997;54(2):159–165. | ||
Morosini PL, Magliano L, Brambilla L, Ugorini S, Pioli R. Development, reliability and acceptability of a new version of the DSM-IV Social and Occupational Functioning Assessment Scale (SOFAS) to assess routine social functioning. Acta Psychiatr Scand. 2000;101(4):323–329. | ||
Simpson GM, Angus JW. A rating scale for extrapyramidal side effects. Acta Psychiatr Scand Suppl. 1970;212:11–19. | ||
Simpson GM, Lee JH, Zoubok B, Gardos G. A rating scale for tardive dyskinesia. Psychopharmacology (Berl). 1979;64(2):171–179. | ||
Barnes TR. A rating scale for drug-induced akathisia. Br J Psychiatry. 1989;154:672–676. | ||
DelBello MP, Cecil KM, Adler CM, Daniels JP, Strakowski SM. Neurochemical effects of olanzapine in first-hospitalization manic adolescents: a proton magnetic resonance spectroscopy study. Neuropsychopharmacology. 2006;31(6):1264–1273. | ||
Kalayci D, Ozdel O, Sözeri-Varma G, Kiroğlu Y, Tümkaya S. A proton magnetic resonance spectroscopy study in schizoaffective disorder: comparison of bipolar disorder and schizophrenia. Prog Neuropsychopharmacol Biol Psychiatry. 2012;37(1):176–181. | ||
Ross AJ, Sachdev PS. Magnetic resonance spectroscopy in cognitive research. Brain Res Brain Res Rev. 2004;44(2–3):83–102. | ||
Bustillo JR, Chen H, Gasparovic C, et al. Glutamate as a marker of cognitive function in schizophrenia: a proton spectroscopic imaging study at 4 Tesla. Biol Psychiatry. 2011;69(1):19–27. | ||
Tandon N, Bolo NR, Sanghavi K, et al. Brain metabolite alterations in young adults at familial high risk for schizophrenia using proton magnetic resonance spectroscopy. Schizophr Res. 2013;148(1–3):59–66. | ||
Bustillo JR. Use of proton magnetic resonance spectroscopy in the treatment of psychiatric disorders: a critical update. Dialogues Clin Neurosci. 2013;15(3):329–337. |
 © 2014 The Author(s). This work is published and licensed by Dove Medical Press Limited. The full terms of this license are available at https://www.dovepress.com/terms.php and incorporate the Creative Commons Attribution - Non Commercial (unported, v3.0) License.
By accessing the work you hereby accept the Terms. Non-commercial uses of the work are permitted without any further permission from Dove Medical Press Limited, provided the work is properly attributed. For permission for commercial use of this work, please see paragraphs 4.2 and 5 of our Terms.
© 2014 The Author(s). This work is published and licensed by Dove Medical Press Limited. The full terms of this license are available at https://www.dovepress.com/terms.php and incorporate the Creative Commons Attribution - Non Commercial (unported, v3.0) License.
By accessing the work you hereby accept the Terms. Non-commercial uses of the work are permitted without any further permission from Dove Medical Press Limited, provided the work is properly attributed. For permission for commercial use of this work, please see paragraphs 4.2 and 5 of our Terms.