")
Back to Journals » OncoTargets and Therapy » Volume 9
The effect of antagonizing RGD-binding integrin activity in papillary thyroid cancer cell lines
Authors Cheng W, Feng F, Ma C, Wang H
Received 26 October 2015
Accepted for publication 18 January 2016
Published 11 March 2016 Volume 2016:9 Pages 1415—1423
DOI https://doi.org/10.2147/OTT.S99166
Checked for plagiarism Yes
Review by Single anonymous peer review
Peer reviewer comments 2
Editor who approved publication: Professor Daniele Santini
Weiwei Cheng, Fang Feng, Chao Ma, Hui Wang
Department of Nuclear Medicine, Shanghai Xin Hua Hospital, Shanghai Jiao Tong University School of Medicine, Shanghai, People’s Republic of China
Abstract: Patients with papillary thyroid cancer (PTC) generally have good prognosis, but inoperable and radioactive iodine–refractory PTC still poses significant clinical challenges due to lack of effective treatment and higher mortality rates. Given the important role of integrins in multiple steps of tumor development, integrin-targeting therapy could be an effective strategy for PTC therapy. In this study, we investigated the antitumor effect of antagonizing Arg-Gly-Asp (RGD)-binding integrin activity in several PTC cell lines. Two RGD-binding integrin heterodimers αvβ3 and αvβ5 were first determined with fluorescence-activated cell sorting (FACS) and immunofluorescence assay. Cell proliferation and apoptosis were examined by Cell Counting Kit-8 assay and FACS, respectively. Cell migration and invasion were determined by transwell assays. All three PTC cell lines examined (BCPAP, K1, and TPC1) showed a moderate-to-high expression of αvβ3 and αvβ5 (P<0.05). Antagonizing the two heterodimers with the RGD-containing antagonist showed moderate inhibitory effect on cell viability of K1 and BCPAP cells, while the inhibitory effect was more significant in TPC1 cells. Similarly, the apoptotic effect induced by antagonizing αvβ3 and αvβ5 was much stronger in TPC1 cells than in BCPAP and K1 cells. Cell migration and invasion were significantly inhibited by αvβ3 and αvβ5 antagonism in all three PTC cell lines. Our results suggested that the demonstrated expression of RGD-binding integrin on PTC cells provides the possibility of integrin-targeting treatment in PTC. The strong apoptotic effect observed in TPC1 cells indicated that a subgroup of PTC patients may benefit from the cytotoxic effect of RGD-binding integrin antagonism, while the strong inhibitory effect on migration and invasion in all three PTC cells by antagonizing αvβ3 and αvβ5 showed there is an exciting possibility that targeting RGD-binding integrin may serve a potential therapeutic approach for metastatic PTC patients.
Keywords: radioactive iodine refractory PTC, αvβ3, αvβ5, cilengitide
Introduction
Integrins are heterodimeric transmembrane receptors regulating cell–cell and cell–extracellular matrix (ECM) interactions.1,2 Many studies have implicated the important role of integrins in tumor cell invasion, migration, proliferation, and survival.3,4 In addition to their role in tumor cells, integrins on the membrane of endothelial cells have also been demonstrated to profoundly promote tumor angiogenesis and eventually influence the malignant potential of the tumor.3–5 Therefore, antagonism of integrins is supposed to play an important role in curtailing tumor progression significantly by dually targeting tumor cells and tumor angiogenesis. Among the large subfamily of integrin heterodimers, some of them have been found to bind to ECM through the Arg-Gly-Asp (RGD) motif, and therefore, peptides containing RGD structure usually have a high affinity and specificity for these integrin heterodimers, particularly for αvβ3 and αvβ5.6 This characteristic enables pharmacologic disruption of integrin–ECM binding to achieve antitumor effect, and thus many small molecules containing the RGD sequence have been manufactured as integrin antagonists.7–9 With these antagonists, many studies have already demonstrated profound antitumor effects by antagonizing RGD-binding integrin activity in a wide range of cancers.10–13
Papillary thyroid cancer (PTC) accounts for ~80% of all thyroid cancers and is the most common endocrine malignancy, with a currently rapidly increasing incidence.14,15 Although PTC generally has a good prognosis, patients with inoperable and radioactive iodine–refractory (RAIR) lesions have a relatively high morbidity and mortality rate, representing currently a major therapeutic challenge in thyroid cancer medicine.16 In a previous study, we demonstrated a significantly stronger expression of RGD-binding integrins in some PTC lesions using a RGD-containing imaging tracer.17 The RGD-containing imaging tracer can help clinicians to select only those patients who show high expression of RGD-binding integrins, which will guarantee the efficiency of targeted therapy. Therefore, integrin-targeting therapy would be a novel and effective therapeutic strategy for RAIR PTC as long as integrin antagonism in PTC can be demonstrated to be an effective treatment at first.
In the present study, we firstly analyzed the expression levels of αvβ3 and αvβ5, two important RGD-binding integrin heterodimers,18 in several PTC cell lines and then investigated the antitumor effect in PTC cell lines by antagonizing αvβ3 and αvβ5 activity using a widely studied RGD-containing integrin antagonist, cilengitide.12,19
Materials and methods
Cell culture
Three thyroid cancer cell lines were used in this study: BCPAP and K1 were cell lines harboring BRAFV600E mutation while TPC1 cells contained RET/PTC1 rearrangement. All the three cell lines lost their differentiation potential in terms of thyroid gene expression and the ability to take up iodine.20 BCPAP and K1 cell lines were cultured in Dulbecco’s Modified Eagle’s Medium mixed with Ham’s F12 (DMEM/F-12) and MCDB105 medium in 1:1:1 proportion, supplemented with 10% fetal bovine serum (FBS) and 1% penicillin/streptomycin. TPC1 cell line was cultured in Roswell Park Memorial Institute (RPMI)1640 with 10% FBS and 1% penicillin/streptomycin.
The study was approved by the ethics committees of the Shanghai Jiao Tong University and Shanghai Xin Hua Hospital and by the institutional review board of Shanghai Xin Hua Hospital.
Flow-cytometric analysis of αvβ3 and αvβ5 integrin expression
Antibodies against αvβ3 (dilution 1:100) and αvβ5 (dilution 1:100) (R&D Systems, Minneapolis, MN, USA) were used to label 1×10⁶ cells in a total volume of 200 μL phosphate-buffered saline (PBS). After rinsing thrice with PBS, a fluorescein isothiocyanate (FITC)-conjugated secondary antibody (Sigma-Aldrich, St Louis, MO, USA) was added (dilution 1:50). Excess of unbound secondary antibody was removed by rinsing with PBS. Secondary antibody alone (ie, without adding primary antibody) was used as a negative control. Labeled cells were measured by fluorescence-activated cell sorting (FACS).
Immunofluorescence assay for αvβ3 and αvβ5 integrin expression
In order to confirm and to further characterize αvβ3 and αvβ5 expression in PTC cells, immunofluorescence staining assay was performed for each investigated cell line. Cells were allowed to adhere overnight on chamber slides before fixation with 4% paraformaldehyde. Then the cells were blocked in 5% bovine serum albumin for 40 minutes at 37°C and incubated overnight at 4°C in a solution containing diluted primary antibodies against αvβ3 (dilution 1:100) and αvβ5 (dilution 1:100) (R&D Systems). After rinsing thrice with PBS, the slides were incubated in diluted FITC-labeled secondary antibody (1:200) for 1 hour at room temperature in the dark. The expression of αvβ3 and αvβ5 was visualized using a fluorescence stereomicroscope (Leica Microsystems, Wetzlar, Germany). Images were further processed with Image J software. (National Institutes of Health, Bethesda, MD, USA).
Cell viability analysis
Cell survival was assessed using standard Cell Counting Kit-8 (CCK-8) method. Cells were seeded in a 96-well plate (2,000 cells/well). After overnight incubation, plates were treated with 5, 10, 25, and 50 μM cilengitide (Selleckchem, Houston, TX, USA) for 24, 48, and 72 hours. Wells added with equal concentration of dimethyl sulfoxide (DMSO, 0.2%) without cilengitide were regarded as control. After treatment for 24, 48, and 72 hours, 10 μL CCK-8 solution (Sigma-Aldrich) was added to each well of the plate and the plates were incubated at 37°C for 1 hour. Formazan absorbance at 450 nm was measured in a microplate reader (Thermo LabSystem, Beverly, MA, USA). Absolute optical density values were used to compare cell viability between different groups.
Cell apoptosis assay
Cells were seeded in six-well plates (5×10⁴ cells/well). After a 24-hour serum starvation, 25 and 50 μM cilengitide (the two concentrations were selected for further experiments according to the cell viability assay) was added into wells. After incubation for 48 hours, both detached and adherent (after trypsinization) cells were harvested, rinsed with PBS, and subjected to sequential staining with FITC Annexin V Apoptosis Detection Kit (Thermo Fisher Scientific, Waltham, MA, USA) by two-color flow cytometry, according to the manufacturer’s protocol. Cells positive for both FITC-Annexin V and propidium iodide (PI) staining were in late apoptosis stage or already dead, while cells positive for FITC-Annexin V but negative for PI were in the early stage of apoptosis.
Western blot assay
To further confirm cell apoptosis of PTC cell lines after antagonizing integrin activity, the expression of cleaved PARP (cPARP) of different groups of cells was analyzed using anti-cPARP antibody (Epitomics, Burlingame, CA, USA).
Cell migration assay and invasion assay
Cell migration was assayed by using 24-well transwell chambers (Corning Incorporated, Corning, NY, USA). The upper and lower compartments were separated by polycarbonate filters with 8 μm pore size to permit cell migration. After 24-hour serum starvation, 1×10⁵ cells/well were seeded onto the filters in medium (0% FBS) containing 0, 25, and 50 μM cilengitide and medium containing 10% FBS was added to the lower chambers. As control, the same number of cells was seeded into normal 24-well plates with the same cilengitide concentration. After 48 hours of incubation at 37°C with 5% CO2, cells passing the filters and attaching to the lower sides of filters were harvested using trypsin and the cell number was quantified. The percentage of migrating cells was calculated after correction for controls grown under identical conditions without filters.
Cell invasion was also assayed by using 24-well transwell chambers. Before the assay, the polycarbonate filters were coated with 70 μL Matrigel (Corning Incorporated; 5 mg/mL). The remaining steps were similar to those followed for cell migration assay.
Statistical analysis
All data were presented as mean ± standard deviation. The expression of αvβ3 and αvβ5 in PTC cell lines was compared with that in negative control using Student’s t-test and statistical significance was defined as two-tailed P<0.05. Comparisons of cell proliferation, apoptosis, invasion, and migration among different groups were conducted by one-way analysis of variance (ANOVA). Calculations were performed using SPSS 19.0. Statistical significance was assumed for P<0.05. All the experiments were repeated at least two or three times.
Results
Expression of integrins αvβ3 and αvβ5 in PTC cell lines
The expression of αvβ3 and αvβ5 integrins on the cell surface was characterized by flow cytometry using specific monoclonal antibodies. The expression levels of αvβ3 and αvβ5 on the three PTC cell lines were different. As shown in Figure 1, there was a population of TPC1 cells that showed stronger fluorescence intensity, while all BCPAP and K1 cells showed only moderate fluorescence intensity, indicating a much stronger expression of αvβ3 and αvβ5 in TPC1 cells than in BCPAP and K1 cells. Specifically, the percentage of TPC1 cells exhibiting positive expression of αvβ3 and αvβ5 was 69.3%±7.4% and 52.8%±1.8%, respectively (P<0.05), while in the other two cells, the percentage of cells with positive αvβ3 and αvβ5 expression was 35.1%±2.3% and 41.9%±3.2% (BCPAP, P<0.05), and 37.7%±2.3% and 48.0%±1.4% (K1, P<0.05), respectively (Figure 1). Immunofluorescence microscopy further confirmed the expression of αvβ3 and αvβ5 and showed the distribution of the two heterodimers in three cell lines (Figure 1).
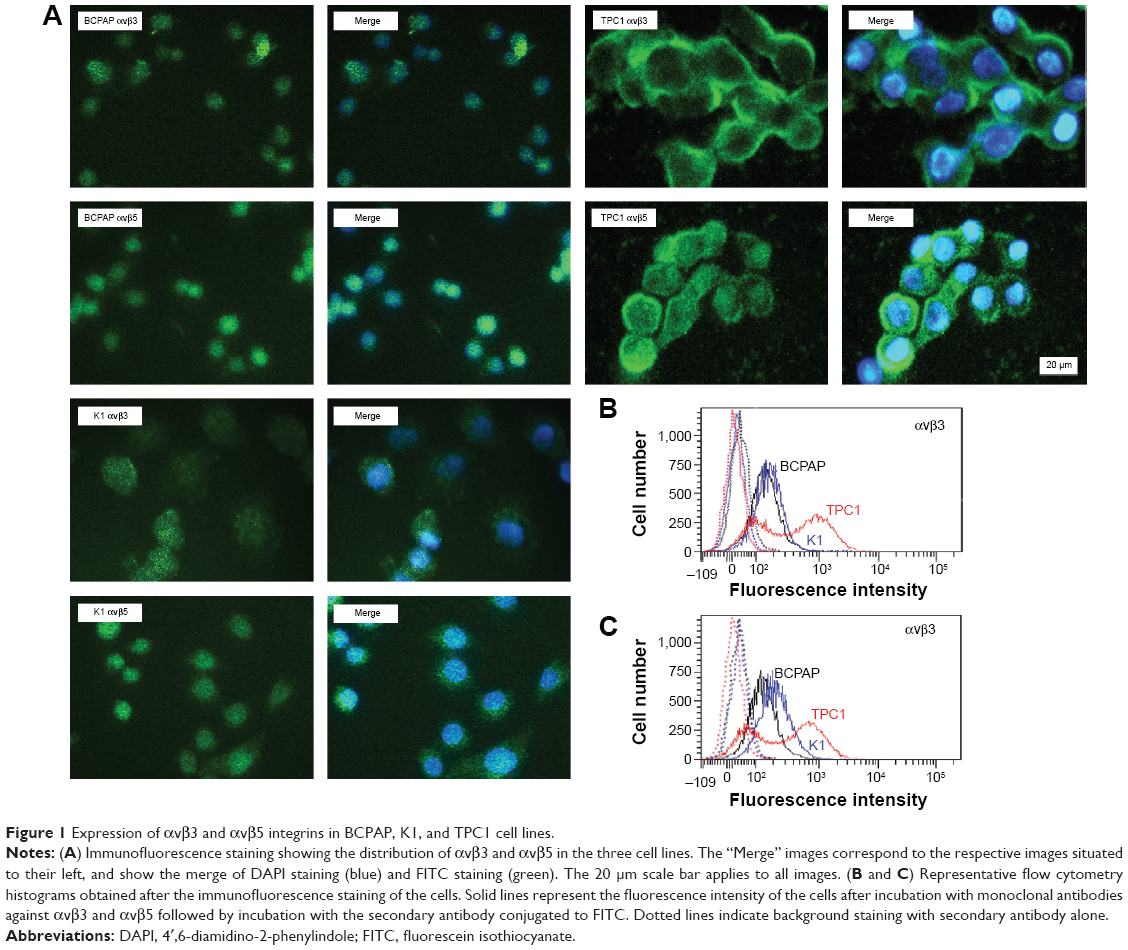 | Figure 1 Expression of αvβ3 and αvβ5 integrins in BCPAP, K1, and TPC1 cell lines. |
Cell viability after antagonizing αvβ3 and αvβ5 activity
Morphologic changes of BCPAP, K1, and TPC1 cells were monitored over 24 hours after adding 25 and 50 μM cilengitide. All the three cell lines started to round up, detached from the flask, and tended to form cell clusters in a concentration-dependent manner (Figure 2). The effect of antagonizing αvβ3 and αvβ5 upon the proliferation of PTC cell lines was assessed by CCK-8 assay. Cell viability was quantified at 0, 24, 48, and 72 hours after cilengitide treatment. In TPC1 cells, which showed the highest expression of αvβ3 and αvβ5, treatment with cilengitide resulted in a highly significant, dose-dependent cell growth inhibition at 24, 48, and 72 hours (P<0.05) (Figure 3A). While in BCAP and K1 cells, the inhibition of cell growth was rather mild as compared to that of TPC1 cells, but still showed a statistically significant difference at 48 and 72 hours (P<0.05) (Figure 3A).
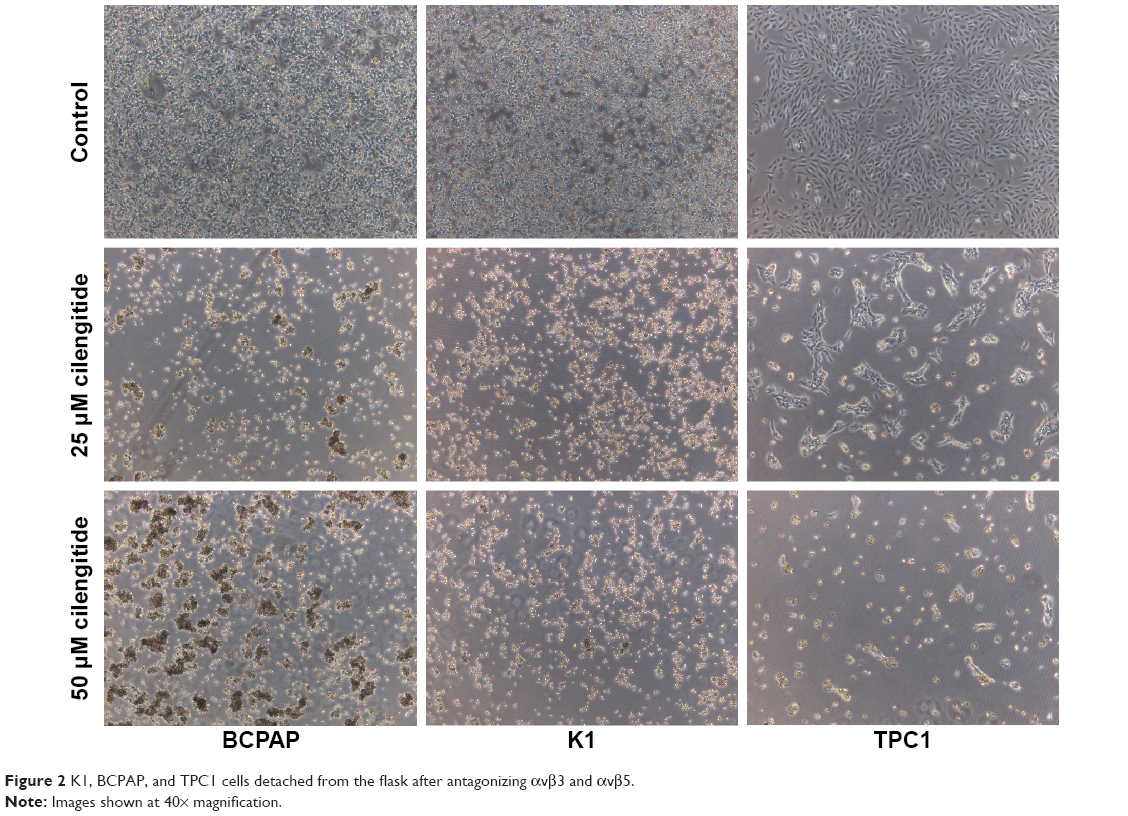 | Figure 2 K1, BCPAP, and TPC1 cells detached from the flask after antagonizing αvβ3 and αvβ5. |
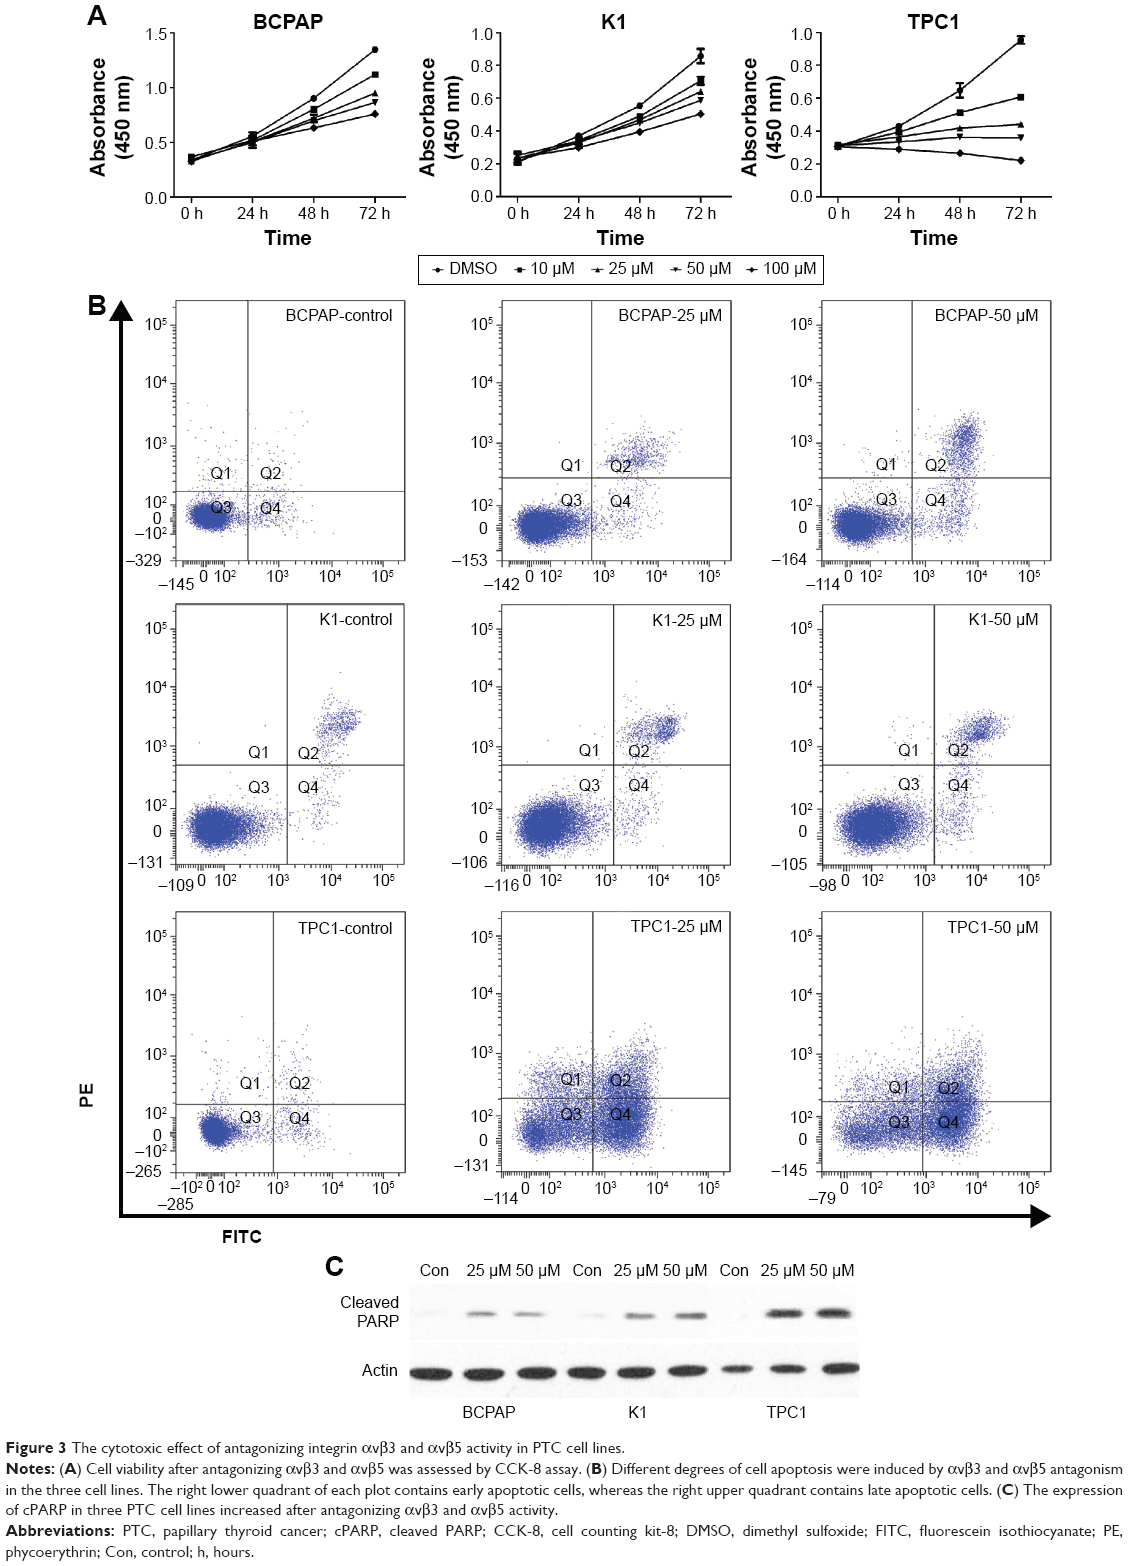 | Figure 3 The cytotoxic effect of antagonizing integrin αvβ3 and αvβ5 activity in PTC cell lines. |
Cytotoxic effect of antagonizing αvβ3 and αvβ5 activity in PTC cell lines
The loss of integrin-mediated cell–matrix interaction can induce apoptosis of some cell types, which is called anoikis. To examine whether PTC cell lines are sensitive to anoikis, we performed apoptosis assay at the 48-hour time point following cilengitide treatment. The result showed that antagonizing αvβ3 and αvβ5 activity with 50 μM cilengitide induced significant apoptosis in all the three cell lines (P<0.05), but the responses varied among different cell lines (Figure 3B). In BCPAP cells, the late/dead apoptosis (Q2) and early apoptotic (Q4) events increased from 3.4%±0.8% in control cells to 6.7%±0.5% in cells treated with cilengitide (P<0.05). K1 cells showed a similar apoptotic pattern after cilengitide treatment (cells in Q2 and Q4 increased from 3.2%±0.5% to 9.4%±0.2%, P<0.05). In contrast, TPC1 showed a much higher response to cilengitide, with apoptotic events (Q2 + Q4) increasing from 2.0%±0.7% to 37.8%±1.0% after cilengitide treatment (P<0.05). As mentioned earlier, nearly all cells detached morphologically from the flask after cilengitide treatment. Among the detached cells, most BCPAP and K1 cells were still alive (~70% and 82%, respectively), while only 20% of TPC1 cells were alive. It was also observed that the detached K1 and BCPAP cells (exposed to cilengitide for 48 hours) were able to reattach and grow after withdrawal of cilengitide, while TPC1 cells showed a much worse cell attachment (data not shown).
We further examined the expression level of cPARP protein, which served as a marker for cell apoptosis. After blocking αvβ3 and αvβ5 activity, the expression of cPARP slightly increased in BCPAP and K1 cells but significantly increased in TPC1 cells, which was basically consistent with the result of apoptosis assay (Figure 3C).
Antagonizing integrin activity reduces migration and invasion of PTC cells
Tumor invasion into surrounding areas and metastatic lesions constitute significant events of PTC. As integrins are crucial for cell invasion and migration, we next analyzed the effect of antagonizing integrin activity on PTC cell migration and invasion. As most cells detached from the flask after integrin antagonism, the gap assays were difficult to carry out. Therefore, we used the transwell assay to investigate the migration of three PTC cells. The migration of BCPAP, K1, and TPC1 cells were all clearly inhibited by cilengitide in a dose-dependent manner, although the expression levels of αvβ3 and αvβ5 in the three cell lines were different. The invasive ability of the three cell lines also significantly decreased after cilengitide treatment (Figure 4). It is interesting to note that K1 and BCPAP cells, which showed reduced expression of αvβ3 and αvβ5, had a more decreased ability of migration and invasion as compared with TPC1 cells. After treatment with 25 μM cilengitide, the migration of BCPAP and K1 cells decreased by 37% and 51%, respectively, while that of TPC1 cells decreased by 15% (P<0.05 for all the three cell lines); the invasion of BCPAP and K1 cells decreased by 32% and 21%, respectively, while that of TPC1 cells decreased by 16% (P<0.05 for all the three cell lines) (Figure 4).
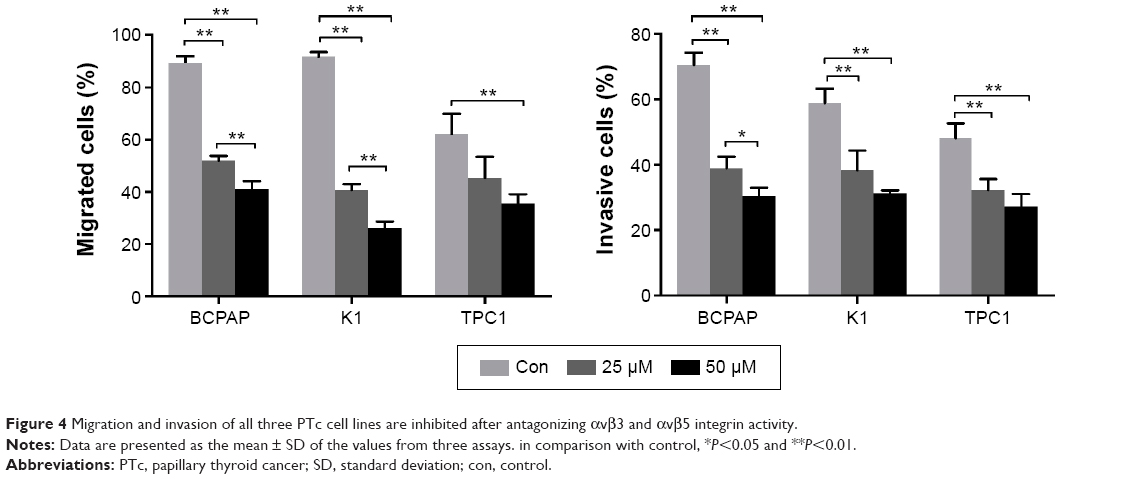 | Figure 4 Migration and invasion of all three PTc cell lines are inhibited after antagonizing αvβ3 and αvβ5 integrin activity. |
Discussion
Integrins are transmembrane receptors that bind ECM proteins or other adhesion receptors on neighboring cells, regulating a variety of cellular processes such as cell motility, migration, and proliferation.2 For these properties, integrin activation has been involved in many pathological processes like tumor growth, survival, metastasis formation, and tumor angiogenesis, and therefore make integrin attractive target for cancer therapy.3,21,22 Although PTCs are the most common endocrine malignancy, they usually receive less attention due to their benign biologic behavior in the majority of the patients. At present, there is no data regarding integrin-targeting therapy in PTC, despite the need of novel therapeutic approaches for inoperable or RAIR PTC tumors.
Dahlman et al and Illario et al reported that the expression of some integrin subunits and heterodimers are different between thyroid cancer and normal thyroid tissue.23,24 Hoffmann et al previously described integrin expression in several thyroid cancer cell lines including TPC1 cell line.25 In contrast to their results, we observed a strong expression of both αvβ3 and αvβ5 in TPC1 cell line. In K1 and BCPAP cell lines, which were not investigated in Hoffmann’s study, the expression of αvβ3 and αvβ5 was modest as compared with that of TPC1 cells. The availability of αvβ3 and αvβ5 receptors on PTC cells indicated that integrin-targeted therapy will not only inhibit tumor neovasculature but will also directly inhibit the tumor itself.
In this study, antagonizing αvβ3 and αvβ5 integrin activity led to the detachment of all three PTC cell lines. In endothelial cells, blocking integrin activity usually induces cell detachment and results in anoikis.26,27 However, as we know, tumor cells generally can escape from anoikis and eventually invade other organs. Among the three PTC cell lines we investigated, TPC1 showed a significant loss of cell viability while BCPAP and K1 cells exhibited a mild reduction in cell proliferation after detachment from the flask following cilengitide treatment. Moreover, after withdrawal of cilengitide, TPC1 cell line showed a much worse cell attachment and cell status when compared with K1 and BCPAP cells, indicating that anoikis-sensitive tumor is more likely to benefit from antagonizing integrin therapy. For K1 and BCPAP cells, which are relatively resistant to anoikis, there is some concern that the detached cells may have a metastatic potential. However, detached tumor cells have to interact with ECM to penetrate the adjacent tissues or distant organs, which can be disrupted by integrin antagonism. Moreover, as shown in Figure 2, cells tend to cluster together after detachment from the flask. The strengthened cell–cell adhesion has been reported to promote a more epithelial-like morphology and suppress tumor cell migration.28,29 As we know, tumor invasion and metastasis are very common in PTC. It has been reported that the occurrence of central lymph node metastasis ranges from 40% to 90% in all PTC cases.30,31 Integrin is the key player in tumor metastasis and invasion by virtue of its ability to mediate cell–cell and cell–matrix interactions.32 Therefore, we examined the effect of antagonizing integrin activity toward PTC cell invasion and migration. The ability of migration and invasion of all the three PTC cell lines was inhibited significantly after integrin antagonism. It is interesting to note that TPC1 cells, which showed the highest expression of αvβ3 and αvβ5 and exhibited the most significant cytotoxic effect after antagonizing integrin activity, conversely showed the mildest decrease in invasion and migration after integrin antagonism. This may partly be attributed to the natural lower ability of invasion and migration of TPC1 cells as compared to that of BCPAP and K1 cells.33
In addition to the important role of integrin in tumor cell invasion and migration, it has been reported that integrin αvβ3 plays a key role in osteoclast migration, which is essential for osteoclast activity in osteolytic bone metastases.34,35 Therefore, antagonizing αvβ3 with integrin antagonists may be of great clinical significance in reducing skeletal-related events and in improving the quality of life of PTC patients with bone metastasis, especially in view of the relative long-term survival of PTC patients.36
The integrin antagonist we used in this study, cilengitide, is currently under critical review because of its failure in late-stage clinical trial.37,38 As our primary purpose was to assess the antitumor effect of integrin-targeted treatment in PTC, we still used cilengitide as the antagonist, taking into account its wide range of preclinical experience and easy acquisition.
In this study, our data indicated that there was a moderate-to-high expression of αvβ3 and αvβ5 integrins in PTC cell lines. Antagonizing the two heterodimers with the RGD-containing antagonist showed a moderate cytotoxic effect in K1 and BCPAP cells, while the cytotoxic effect was much stronger in TPC1 cells. The strong cytotoxic effect observed in TPC1 cells indicated that a subgroup of PTC patients may benefit from αvβ3 and αvβ5 antagonism therapy. In terms of cell invasion and migration, all the three PTC cell lines had a significantly inhibited response upon antagonizing αvβ3 and αvβ5. As a result, it is expected that RGD-binding integrin-targeted therapy with a RGD-containing integrin antagonist may be an effective specific therapy regimen for the treatment of PTC, especially in patients with metastatic lesions.
Acknowledgments
The authors thank Shanghai Sixth People’s Hospital and Institute of Biomedical Sciences, East China Normal University, for providing K1, BCPAP, and TPC1 cell lines. The study was supported by the Shanghai Pujiang Program (No 13PJD022) and Shanghai Health Bureau Fund (No 20124016).
Disclosure
The authors report no conflicts of interest in this work.
References
Humphries JD, Byron A, Humphries MJ. Integrin ligands at a glance. J Cell Sci. 2006;119(Pt 19):3901–3903. | ||
Hynes RO. Integrins: bidirectional, allosteric signaling machines. Cell. 2002;110(6):673–687. | ||
Desgrosellier JS, Cheresh DA. Integrins in cancer: biological implications and therapeutic opportunities. Nat Rev Cancer. 2010;10(1):9–22. | ||
Guo W, Giancotti FG. Integrin signalling during tumour progression. Nat Rev Mol Cell Biol. 2004;5(10):816–826. | ||
Weis SM, Cheresh DA. αV Integrins in angiogenesis and cancer. Cold Spring Harb Perspect Med. 2011;1(1):a006478. | ||
Ruoslahti E. RGD and other recognition sequences for integrins. Annu Rev Cell Dev Biol. 1996;12:697–715. | ||
Plow EF, Haas TA, Zhang L, Loftus J, Smith JW. Ligand binding to integrins. J Biol Chem. 2000;275(29):21785–21788. | ||
Xiong JP, Stehle T, Zhang R, et al. Crystal structure of the extracellular segment of integrin alpha Vbeta3 in complex with an Arg-Gly-Asp ligand. Science. 2002;296(5565):151–155. | ||
Zitzmann S, Ehemann V, Schwab M. Arginine-glycine-aspartic acid (RGD)-peptide binds to both tumor and tumor-endothelial cells in vivo. Cancer Res. 2002;62(18):5139–5143. | ||
Reardon DA, Neyns B, Weller M, Tonn JC, Nabors LB, Stupp R. Cilengitide: an RGD pentapeptide alphanubeta3 and alphanubeta5 integrin inhibitor in development for glioblastoma and other malignancies. Future Oncol. 2011;7(3):339–354. | ||
Russo MA, Paolillo M, Sanchez-Hernandez Y, et al. A small-molecule RGD-integrin antagonist inhibits cell adhesion, cell migration and induces anoikis in glioblastoma cells. Int J Oncol. 2013;42(1):83–92. | ||
Lautenschlaeger T, Perry J, Peereboom D, et al. In vitro study of combined cilengitide and radiation treatment in breast cancer cell lines. Radiat Oncol. 2013;8:246. | ||
Wilisch-Neumann A, Kliese N, Pachow D, et al. The integrin inhibitor cilengitide affects meningioma cell motility and invasion. Clin Cancer Res. 2013;19(19):5402–5412. | ||
Hundahl SA, Fleming ID, Fremgen AM, Menck HR. A National Cancer Data Base report on 53,856 cases of thyroid carcinoma treated in the U.S., 1985–1995 [see comments]. Cancer. 1998;83(12):2638–2648. | ||
Jemal A, Murray T, Ward E, et al. Cancer statistics, 2005. CA Cancer J Clin. 2005;55(1):10–30. | ||
Sacks W, Braunstein GD. Evolving approaches in managing radioactive iodine-refractory differentiated thyroid cancer. Endocr Pract. 2014;20(3):263–275. | ||
Cheng W, Wu Z, Liang S, et al. Comparison of 18F-AIF-NOTA-PRGD2 and 18F-FDG uptake in lymph node metastasis of differentiated thyroid cancer. PLoS One. 2014;9(6):e100521. | ||
Maubant S, Saint-Dizier D, Boutillon M, et al. Blockade of alpha v beta3 and alpha v beta5 integrins by RGD mimetics induces anoikis and not integrin-mediated death in human endothelial cells. Blood. 2006;108(9):3035–3044. | ||
Wang JT, Liu Y, Kan X, Liu M, Lu JG. Cilengitide, a small molecule antagonist, targeted to integrin alphanu inhibits proliferation and induces apoptosis of laryngeal cancer cells in vitro. Eur Arch Otorhinolaryngol. 2014;271(8):2233–2240. | ||
Pilli T, Prasad KV, Jayarama S, Pacini F, Prabhakar BS. Potential utility and limitations of thyroid cancer cell lines as models for studying thyroid cancer. Thyroid. 2009;19(12):1333–1342. | ||
Goodman SL, Picard M. Integrins as therapeutic targets. Trends Pharmacol Sci. 2012;33(7):405–412. | ||
Perdih A, Dolenc MS. Small molecule antagonists of integrin receptors. Curr Med Chem. 2010;17(22):2371–2392. | ||
Dahlman T, Grimelius L, Wallin G, Rubin K, Westermark K. Integrins in thyroid tissue: upregulation of alpha2beta1 in anaplastic thyroid carcinoma. Eur J Endocrinol. 1998;138(1):104–112. | ||
Illario M, Amideo V, Casamassima A, et al. Integrin-dependent cell growth and survival are mediated by different signals in thyroid cells. J Clin Endocrinol Metab. 2003;88(1):260–269. | ||
Hoffmann S, Maschuw K, Hassan I, et al. Differential pattern of integrin receptor expression in differentiated and anaplastic thyroid cancer cell lines. Thyroid. 2005;15(9):1011–1020. | ||
Frisch SM, Francis H. Disruption of epithelial cell-matrix interactions induces apoptosis. J Cell Biol. 1994;124(4):619–626. | ||
Oliveira-Ferrer L, Hauschild J, Fiedler W, et al. Cilengitide induces cellular detachment and apoptosis in endothelial and glioma cells mediated by inhibition of FAK/src/AKT pathway. J Exp Clin Cancer Res. 2008;27:86. | ||
Canel M, Serrels A, Frame MC, Brunton VG. E-cadherin-integrin crosstalk in cancer invasion and metastasis. J Cell Sci. 2013;126(Pt 2):393–401. | ||
Serrels A, Canel M, Brunton VG, Frame MC. Src/FAK-mediated regulation of E-cadherin as a mechanism for controlling collective cell movement: insights from in vivo imaging. Cell Adh Migr. 2011;5(4):360–365. | ||
Grebe SK, Hay ID. Thyroid cancer nodal metastases: biologic significance and therapeutic considerations. Surg Oncol Clin N Am. 1996;5(1):43–63. | ||
Moo TA, McGill J, Allendorf J, Lee J, Fahey T, 3rd, Zarnegar R. Impact of prophylactic central neck lymph node dissection on early recurrence in papillary thyroid carcinoma. World J Surg. 2010;34(6):1187–1191. | ||
Stivarou T, Patsavoudi E. Extracellular molecules involved in cancer cell invasion. Cancers (Basel). 2015;7(1):238–265. | ||
Saiselet M, Floor S, Tarabichi M, et al. Thyroid cancer cell lines: an overview. Front Endocrinol (Lausanne). 2012;3:133. | ||
Bretschi M, Merz M, Komljenovic D, Berger MR, Semmler W, Bauerle T. Cilengitide inhibits metastatic bone colonization in a nude rat model. Oncol Rep. 2011;26(4):843–851. | ||
Nakamura I, Pilkington MF, Lakkakorpi PT, et al. Role of alpha(v)beta(3) integrin in osteoclast migration and formation of the sealing zone. J Cell Sci. 1999;112(Pt 22):3985–3993. | ||
Farooki A, Leung V, Tala H, Tuttle RM. Skeletal-related events due to bone metastases from differentiated thyroid cancer. J Clin Endocrinol Metab. 2012;97(7):2433–2439. | ||
Stupp R, Hegi ME, Gorlia T, et al. Cilengitide combined with standard treatment for patients with newly diagnosed glioblastoma with methylated MGMT promoter (CENTRIC EORTC 26071-22072 study): a multicentre, randomised, open-label, phase 3 trial. Lancet Oncol. 2014;15(10):1100–1108. | ||
Tucci M, Stucci S, Silvestris F. Does cilengitide deserve another chance? Lancet Oncol. 2014;15(13):e584–e585. |
 © 2016 The Author(s). This work is published and licensed by Dove Medical Press Limited. The full terms of this license are available at https://www.dovepress.com/terms.php and incorporate the Creative Commons Attribution - Non Commercial (unported, v3.0) License.
By accessing the work you hereby accept the Terms. Non-commercial uses of the work are permitted without any further permission from Dove Medical Press Limited, provided the work is properly attributed. For permission for commercial use of this work, please see paragraphs 4.2 and 5 of our Terms.
© 2016 The Author(s). This work is published and licensed by Dove Medical Press Limited. The full terms of this license are available at https://www.dovepress.com/terms.php and incorporate the Creative Commons Attribution - Non Commercial (unported, v3.0) License.
By accessing the work you hereby accept the Terms. Non-commercial uses of the work are permitted without any further permission from Dove Medical Press Limited, provided the work is properly attributed. For permission for commercial use of this work, please see paragraphs 4.2 and 5 of our Terms.