")
Back to Journals » ClinicoEconomics and Outcomes Research » Volume 9
The economic and humanistic costs of chronic lower back pain in Japan
Authors Montgomery W, Sato M , Nagasaka Y, Vietri J
Received 28 February 2017
Accepted for publication 11 May 2017
Published 23 June 2017 Volume 2017:9 Pages 361—371
DOI https://doi.org/10.2147/CEOR.S134130
Checked for plagiarism Yes
Review by Single anonymous peer review
Peer reviewer comments 2
Editor who approved publication: Professor Giorgio Colombo
William Montgomery,1 Masayo Sato,2 Yasuo Nagasaka,2 Jeffrey Vietri3
1Global Patient Outcomes & Real World Evidence, Eli Lilly Australia Pty Ltd., West Ryde, Australia; 2Medical Development Unit Japan, Eli Lilly Japan K.K., Kobe, Japan; 3Kantar Health, Horsham, PA, USA
Background: Few data are available that provide estimates of the economic impact of chronic lower back pain (CLBP) in Japan. The current study estimated the patient burden and the direct and indirect medical costs associated with CLBP in Japan using data from a large cross-sectional patient survey. CLBP was hypothesized to be associated with a considerable burden of illness and a large economic impact.
Methods: Study participants completed the Japan National Health and Wellness Survey in 2014, which included measures of health-related quality of life (HRQoL), work impairment, impairment to daily activities, and healthcare service use. Data from those reporting CLBP (N=392) were contrasted against those from matched controls without back pain, using age and sex-adjusted models.
Results: CLBP patients reported significantly lower HRQoL relative to matched controls. Age- and sex-adjusted models estimated mean annual per patient direct and indirect costs attributable to CLBP to be ¥1,820,297 ($15,239 or €12,551) and ¥1,479,899 ($12,389 or €10,203), respectively, with the majority of direct costs related to hospital expenses (¥1,584,759, which is equivalent to $13,267 and €10,927). In estimating the economic impact of CLBP on society, the CLBP respondents were estimated to include 1,508,524 individuals when extrapolated to the Japanese population (815,461 of them employed). Ultimately, this represented approximately ¥1.2 trillion ($10 billion and €8.3 billion) per year in lost productivity at the time of this study.
Conclusion: This study of patients with CLBP in Japan has shown it to be associated with a significant burden on patients and to have a considerable negative impact on the Japanese economy primarily driven by lost productivity. Further research on the effectiveness of interventions to improve the outcomes of those with CLBP is warranted.
Keywords: indirect costs, direct costs, work impairment, healthcare resource use, quality of life
Introduction
Back pain is well documented as one of the most common health problems in the world. Approximately 70–85% of all individuals report experiencing back pain at some point during their lives.1 According to the Global Burden of Disease 2010 report, lower back pain (LBP) causes more disability than any other condition globally, with a prevalence and LBP-related burden that increases as people grow older.2 The global point prevalence of LBP has been estimated to be 9.4%.2 However, lifetime prevalence of LBP in Japan has been estimated to be as high as 83% among the general population, using data from a large study of nearly 70,000 internet-based survey respondents, noting that most respondents were without disability.3 Another recent survey in Japan found that LBP was the site of pain for approximately 31% of Japanese adults with chronic pain in a community postal survey (however, it only allowed one response for the location of pain).4 Moreover, the worldwide burden that is attributed to LBP has been rapidly increasing over time, with estimates for LBP-related disability-adjusted life years skyrocketing from 58.2 million in 1990 to 83 million in 2010.2
Back pain, particularly LBP, has been shown to be responsible for considerable individual and societal economic burden.2,5 In fact, LBP is thought to be the leading cause of activity limitation and work absence throughout much of the world.6–8 In Japan, the estimated economic burden of work-related LBP in 2011 was ¥82.14 billion, consisting of ¥26.48 and ¥55.66 billion for inpatient and outpatient care, respectively. The adjusted annual total cost (medical and indemnity [i.e., work-related LBP compensation] costs) per capita was estimated at ¥669.9 When attempting to estimate the economic impact of a disease or condition, it is useful to divide the costs into direct medical costs – those that are attributable to the use of healthcare resource (e.g., hospitalization, healthcare professionals’ time, medical equipment and supplies, medications, etc.) – and indirect costs – those costs that are due to the lost productivity, such as lost days of work, or reduced work productivity as a result of the morbidity or mortality associated with the condition.10 In a 2015 study of data from a Japanese national survey, the estimated direct and indirect costs of LBP were stratified by level of pain severity and compared with estimates for direct and indirect costs for matched controls. Although the direct costs were similar across groups, the indirect costs were significantly higher among those with moderate (¥1.69 million) and severe (¥1.88 million) pain, relative to matched controls (¥0.95 million).11 Finally, wage loss among Japanese workers has been shown to be particularly high among those suffering from both back/neck pain and comorbid mental health conditions such as depressive or anxiety-related symptoms.12
Chronic pain is particularly debilitating, both at the individual and societal levels.13 Inoue et al reported a prevalence of chronic lower back pain (CLBP) of approximately 12% in a Japanese community postal survey.4 Another 2015 study reported the indirect costs of chronic pain estimated from a Japanese national survey (72.10% of respondents reported chronic back pain specifically).14 In this study, employed patients with chronic pain were estimated to have had ¥232,815 in lost wages due to absenteeism and ¥1,255,570 in costs due to presenteeism (i.e., being present at work but not able to work at full capacity due to illness or other condition),15 per-patient, per-year.14 Moreover, the estimated total indirect costs for survey respondents, who were employed, with chronic pain were significantly higher than employed respondents with non-chronic pain (¥1,513,879 vs. ¥1,000,650).14
Literature from Japan and other countries has shown that interventions targeting back pain are able to reduce both suffering and economic burden.16–18 However, there are few data that provide estimates of the economic impact of CLBP in Japan, specifically those that policy makers could use to evaluate the impact of different pharmaceutical and non-pharmaceutical interventions for people with CLBP. Prior research in Japan has focused on estimates of the societal burden associated with LBP and chronic pain in Japan,14 but not CLBP specifically. Thus, the current study has attempted to estimate the direct medical and indirect costs associated with CLBP in Japan using data from a large observational study collecting self-reported responses from a nationally representative cross-sectional patient survey in Japan.
It is important to note that Japan has a long history of having a comprehensive universal healthcare system that covers the entire population. Reimbursement fees and patient co-payments are set by the national government and patients are responsible for a fixed proportion of their medical care fees, in general, depending on whether they are employed or retired. In congruence with a world-wide trend, the costs of prescription medications in Japan have also continued to increase in recent years.19 The current study contributes novel data specifically assessing the burden of CLBP for patients, while also providing information on the economic burden of LBP (particularly with regard to the costs of medications) and its implications for patients and society in a country with universal healthcare such as Japan (i.e., unlike similar studies conducted in countries such as the US that do not have universal healthcare).
Methods
Data source
Data were provided by the Japan National Health and Wellness Survey (NHWS; Kantar Health, NY, USA), an annual internet-based survey of the general population aged 18 years and older in Japan. Potential respondents are selected from an opt-in survey panel through stratified random sampling, with strata by age and sex specified to match the population. E-mail invitations to participate in the NHWS were sent to 197,597 Lightspeed Research panel or panel partner members, with Web links to participate in the survey that was administered online. All participants provided their informed consent online for this study, and they received points that could be accumulated and exchanged for various prizes. In 2014, a total of 42,263 people responded to the survey invitation (contact rate of 21.7%), of whom 7,823 withdrew before providing informed consent and 1,587 quit during the main survey, for a response rate of 15.4%. An additional 2,687 failed to meet the inclusion criteria. This study thus employed the data from the final sample of eligible respondents collected in 2014 (N=30,000).
In addition to membership in the survey panel and providing informed consent, respondents were required to read and write Japanese and be at least 18 years old. All information was collected through self-report. Previous research has shown that the participants in the survey panel are generally representative of the population when matched for age and sex.20 The protocol and questionnaire for the NHWS were reviewed for exemption for institutional review board (IRB) review. The study was found to be exempt by Pearl IRB (Indianapolis, IL, US, study number 14-KAN-106), given that this was a survey study asking about relatively non-invasive subject matter with minimal anticipated impact on respondents. The NHWS data used in this study can be made available for noncommercial research and validation purposes upon request.
Sample definition
CLBP
Respondents were considered to have CLBP if they experienced LBP in the prior month to the survey and had also been diagnosed by a physician with LBP for at least 3 months, consistent with the definition used in Japanese and US treatment guidelines.21,22 Respondents indicating LBP who did not fit this definition were excluded from further analysis.
Control
Respondents were considered to be in the control group if they were adults aged 18 years and older who had participated in the NHWS but did not fit the inclusion/exclusion criteria specified for the CLBP group. A select subset of the broader control group was utilized for propensity matching purposes for comparisons as described later in this study.
Measures
Health-related quality of life
The revised Medical Outcomes Study 36-Item Short Form Survey Instrument (SF-36v2) was used to measure health-related quality of life (HRQoL).23 This is a multipurpose, generic HRQoL instrument. Two summary scores calculated from this measure were used: the physical component summary (PCS), an index of overall physical functioning, and the mental component summary (MCS) scores, which is an index of mental and emotional health. Scores can be interpreted relative to the US population average of 50 with a standard deviation of 10, with higher scores indicating better HRQoL. Responses to the SF-36v2 were also used to generate health state utilities according to the SF-6D algorithm, a preference-based, single index measure for health using general population values.24 The SF-6D index has interval scoring properties and yields summary scores on a theoretical 0–1 scale (with an empirical floor of 0.3). Higher scores indicate better (more preferred) health status, with 1 being equivalent to perfect health.
Work productivity and activity impairment
Work productivity was assessed using the general health version of the Work Productivity and Activity Impairment-General Health questionnaire, which assesses absenteeism (work time missed), presenteeism (impairment while at work), overall work productivity impairment (a combination of absenteeism and presenteeism), and activity impairment (impairment in daily activities) due to health problems over the prior 7 days.25 All are reported as percentages, with higher numbers indicating greater impairment. Only respondents who reported being full-time or part-time employed provided data for absenteeism, presenteeism, and overall work impairment. All respondents provided data for activity impairment.
Healthcare resource use
Healthcare resource use is assessed in the NHWS as all-cause healthcare provider (HCP) visits, emergency room (ER) visits, and hospitalizations in the 6 months prior to the survey. HCP visits were calculated by summing the self-reported number of visits to specific types of HCPs (e.g., general internist, psychiatrist, dentist, nurse, etc.).
Estimated direct medical costs and indirect costs
Direct medical costs were estimated by multiplying the self-reported physician visits, ER visits, and hospitalizations by their respective 2011 unit costs sourced from the Japanese Ministry of Health, Labour, and Welfare.26 Because the NHWS asks for information on the number of visits during the prior 6 months, the values were then doubled to provide an estimate of annual direct costs.
Indirect costs were estimated using the Human Capital approach to calculate the monetary value of the aforementioned work productivity loss. See Lofland et al for a detailed explanation of the methodology as well as other methods.27 Estimated costs were calculated by using the estimated overall wages/salaries in Japanese ¥ for each respondent obtained from the Ministry of Health, Labour, and Welfare.28 The number of hours missed in the last week because of one’s health (absenteeism) and the number of hours of productivity loss (e.g., 20% presenteeism for 50 hours worked equals 10 hours of productivity loss) missed in the last week because of health impairment while at work (presenteeism) were each multiplied by the hourly wage rates by age and sex in 2011 to arrive at total lost wages per respondent for 1 week. Costs were then annualized by multiplying weekly estimates by 50 (work weeks in a year). Presenteeism costs and absenteeism costs were summed to calculate indirect costs. The Human Capital approach is a well-established methodology used in prior studies of occupational illness and injury populations,29 mental disorders,30 and those with pain conditions such as rheumatoid arthritis in Quebec31 and knee osteoarthritis in Singapore.32
Analysis
Respondents who reported a physician diagnosis of CLBP were compared with matched respondents who did not report LBP using propensity scores; other types of pain were not used as an exclusion criterion for the primary analysis. Propensity scores were calculated using a logistic regression predicting diagnosed CLBP using the following covariates: age, sex, Charlson comorbidity index (CCI), income category, marital status, university education, body mass index (BMI) category, cigarette smoking, alcohol use, and exercise. The predicted values from this regression were used as propensity scores to match respondents with CLBP to respondents without back pain on a one-to-one basis using a greedy matching algorithm. Matched samples were then compared using independent-samples t-tests and chi-square tests.
Although the propensity matching resulted in similar respondent characteristics across CLBP and non-CLBP groups, some significant differences remained post-match, with the CLBP group being slightly older and having a different distribution of BMI categories and higher mean CCI score. Therefore, regression analyses were conducted within the matched sample incorporating age, BMI category, CCI score, and CLBP as predictors, in order to control for the residual differences. Regression-estimated means were calculated at the mean of the covariates to provide differences between the groups after adjusting for these confounders. HRQoL variables were analyzed using linear regression, while other variables were modeled using generalized linear models with a negative binomial distribution and log-link function.
Results
The sample included 392 respondents who met inclusion criteria for CLBP in the current study. The disposition of respondents is presented in Figure 1. Sociodemographic characteristics of the sample and comparisons of respondents with diagnosed CLBP and matched controls with no back pain are presented in Table 1. As already noted, the two groups showed significant differences across age, BMI, CCI, and smoking status. Respondents with diagnosed CLBP (Diagnosed CLBP) had an average age of 54 years, and 45% were women and 62% were employed. Matched controls with no back pain (No back pain) had an average age of 51 years, and 43% were women and 60% were employed. The statistical power to detect a moderate effect size difference (Cohen’s d=0.30) across the two matched groups (N=392 per group) was estimated to be over 98%, given a two-tailed alpha of 0.05.
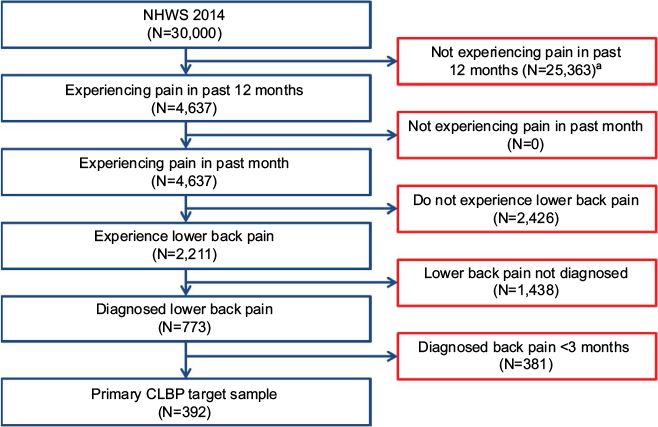 | Figure 1 Respondent disposition in NHWS. Note: aThis is the sample of respondents from whom the matched control group was obtained. Abbreviations: CLBP, chronic lower back pain; NHWS, National Health and Wellness Survey. |
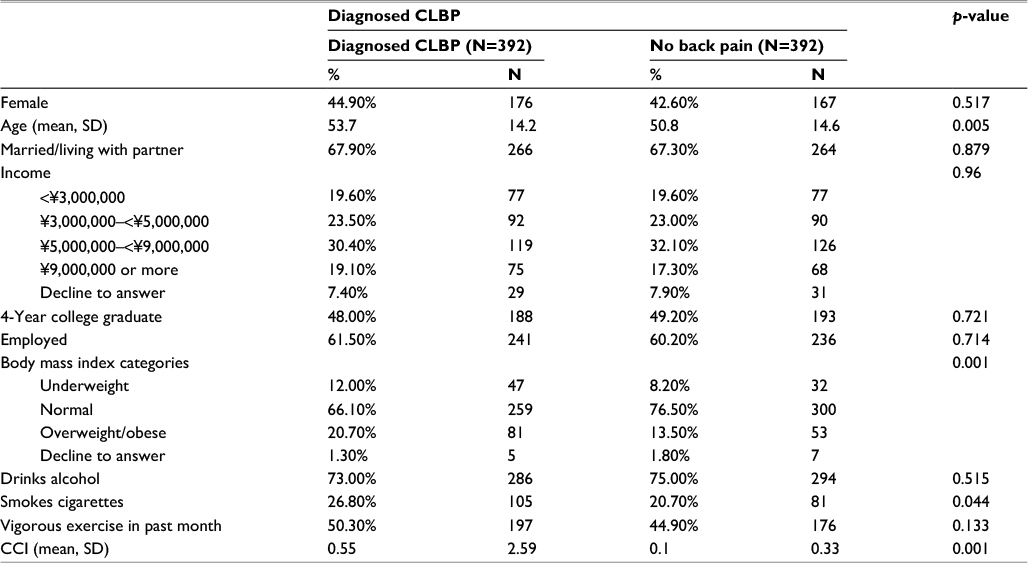 | Table 1 Demographics: matched bivariate comparisons Notes: Drinks alcohol refers to “any self-reported alcohol use (versus not)”; smokes cigarettes refers to “current cigarette smoking (versus not)”; vigorous exercise in the past month refers to “report of at least one day of exercise in the prior 30 days (versus not)”. Abbreviations: CCI, Charlson comorbidity index; CLBP, chronic lower back pain. |
Details of respondents’ pain are presented in Table 2. Most CLBP patients rated their pain as either mild (47%) or moderate (44%), and almost half (45%) had daily problems with pain. The great majority (82%) of CLBP patients had been diagnosed by an orthopedist, though fewer than half were currently using a prescription for pain (40%); approximately three of every four using a prescription were using nonsteroidal anti-inflammatory drugs (NSAIDs; either oral or topical). Most (63%) of those who were not currently using a prescription had used one in the past.
 | Table 2 Pain characteristics among the CLBP sample Abbreviations: CLBP, chronic lower back pain; NSAID, nonsteroidal anti-inflammatory drug. |
Comparison of outcomes revealed significantly lower HRQoL among CLBP patients (Diagnosed CLBP) relative to matched controls without back pain (No back pain), with decrements of approximately 8 points of PCS scores, 5 points on MCS scores, and 0.10 points on the SF-6D health utility (all p<0.001; Table 3; Figure 2). Regression analysis adjusting for confounders showed decrements of 7 points in PCS, approximately 6 points in MCS, and 0.10 points for SF-6D scores (all p<0.001). Decrements exceeded minimally important differences (MIDs) for PCS and MCS scores (MID=3), as well as for SF-6D health utility (MID=0.041).23,33
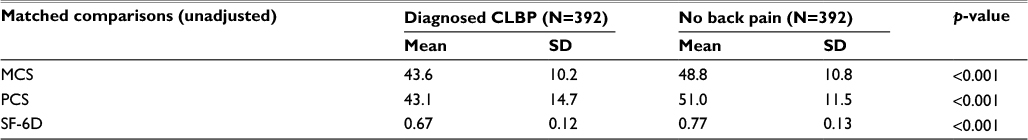 | Table 3 Health-related quality of life in CLBP patients and matched controls Abbreviations: CLBP, chronic lower back pain; MCS, mental component summary; PCS, physical component summary; SF-6D, a preference-based, single index measure for health using general population values. |
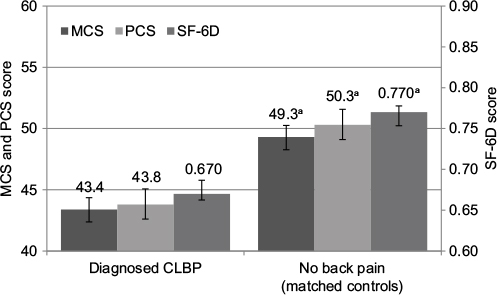 | Figure 2 Health-related quality of life in CLBP patients and matched controls (regression-adjusted [estimated] means with 95% confidence intervals). Note: ap<0.001, indicating results that are statistically significantly higher than results for the same measure in the comparison group. Abbreviations: CLBP, chronic lower back pain; MCS, mental component summary; PCS, physical component summary; SF-6D, a preference-based, single index measure for health using general population values. |
CLBP was also associated with greater impairment to work and activities (Table 4; Figure 3). The level of presenteeism among CLBP patients was approximately 1.5 times that of matched controls (31% vs. 22%, p<0.001), and this relationship remained after adjusting for confounders. The pattern of overall work impairment was consistent with presenteeism, with notably higher levels of impairment among those with CLBP. Likewise, impairment to non-work activities was approximately 1.5 times as high in CLBP patients as controls (37% vs. 22%, p<0.001); regression adjustment did not affect these results. The absolute level of absenteeism was fairly low in both groups, and the difference in absenteeism between CLBP patients and controls did not reach conventional levels of statistical significance.
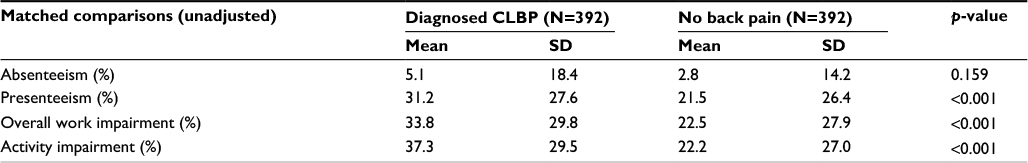 | Table 4 Work and activity impairment in CLBP patients and matched controls Abbreviation: CLBP, chronic lower back pain. |
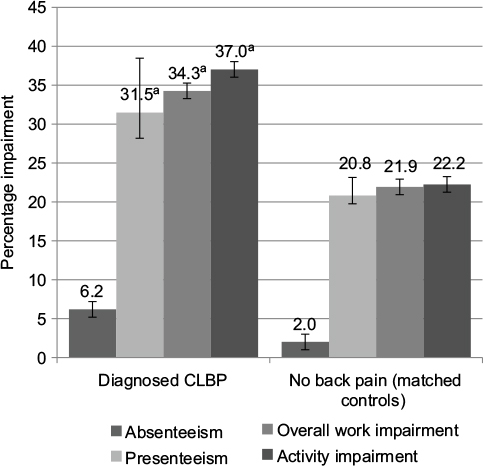 | Figure 3 Work and activity impairment in CLBP patients and matched controls (regression-adjusted [estimated] means with 95% confidence intervals). Note: ap<0.001, indicating results that are statistically significantly higher than results for the same measure in the comparison group. Abbreviation: CLBP, chronic lower back pain. |
Use of certain healthcare resources was likewise elevated among CLBP patients relative to those without back pain, with approximately seven more HCP visits in the 6-month recall period in both the matched comparisons and regression analysis (Table 5). Indirect costs due to lost productivity were also estimated to be 44% higher for CLBP patients than those without back pain, or approximately ¥470,000 ($3,938 and €3,242) more per patient per year than matched controls; similar results were seen in the regression analysis (Table 6; Figure 4). Likewise, direct costs due to HCP visits were almost three times as high among CLBP patients as matched controls, for an incremental ¥136,000 ($1,139 and €938) per year. Direct costs due to ER visits were fairly small, and the difference was no longer significant after adjusting for covariates, nor was the difference in hospitalization costs significant. Therefore, only HCP visits, a component of total direct costs, were reliably associated with significant difference in costs.
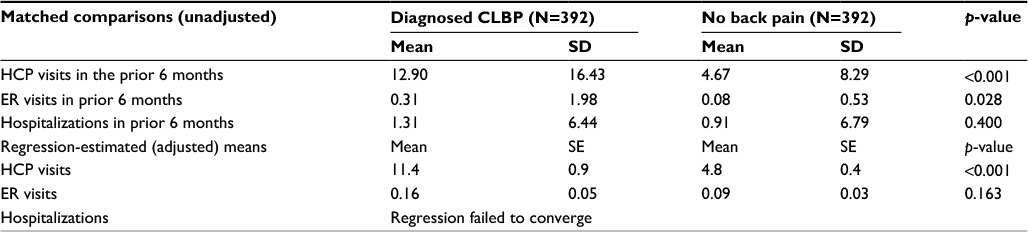 | Table 5 Healthcare resource use: bivariate comparisons for continuous variables Abbreviations: CLBP, chronic lower back pain; ER, emergency room; HCP, healthcare provider; SE, standard error. |
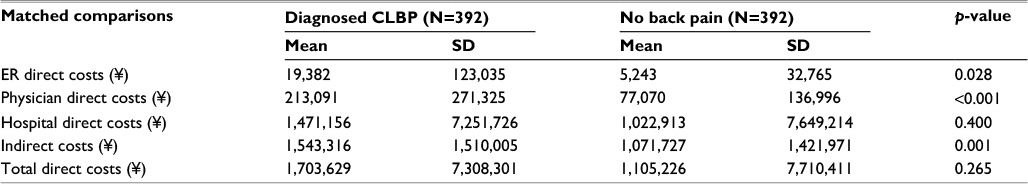 | Table 6 Estimated medical costs according to presence of CLBP (per patient per year) Abbreviations: CLBP, chronic lower back pain; ER, emergency room. |
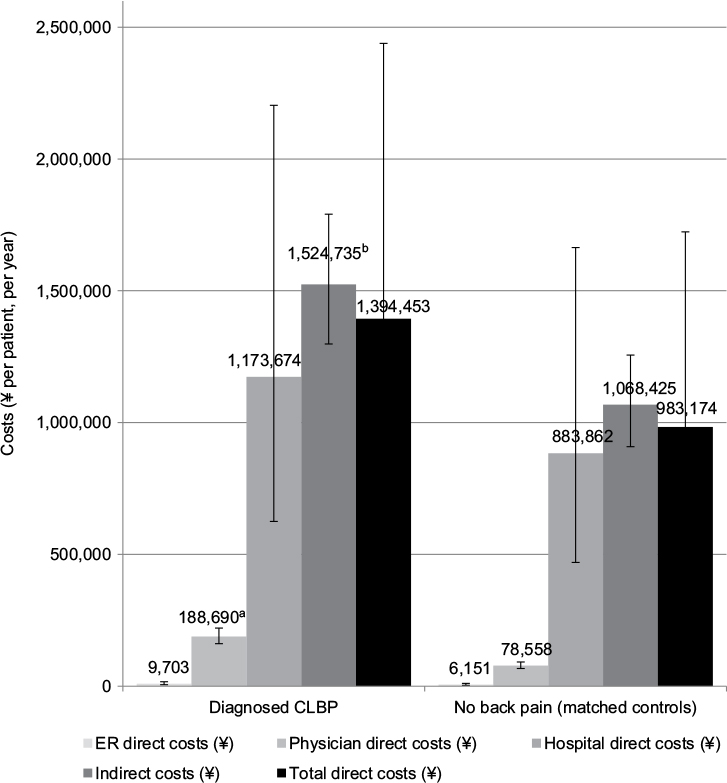 | Figure 4 Costs (¥ per patient, per year) in CLBP patients and matched controls (regression-adjusted [estimated] means with 95% confidence intervals). Note: ap<0.001, bp<0.01, indicating results that are statistically significantly higher than results for the same measure in the comparison group. Abbreviations: CLBP, chronic lower back pain; ER, emergency room. |
Applying frequency weights based on age and sex did not greatly change the pattern of results, though the estimated mean direct costs rose from ¥1.4 million ($11,674 or €9,614; Figure 4) to ¥1.8 million ($15,239 or €12,551; Figure 5). The CLBP group was estimated at 1.5 million people when projected to the Japanese population, each of whom were estimated to incur ¥1.8 million in annual direct costs, which would equate to ¥2.7 trillion ($22.6 billion or €18.6 billion) across the entire country. Approximately 800,000 of these individuals were employed, each of whom were estimated to incur ¥1.5 million in annual indirect costs, which would equate to ¥1.2 trillion ($10 billion and €8.3 billion) per year of productivity lost by CLBP patients over and above the direct costs.
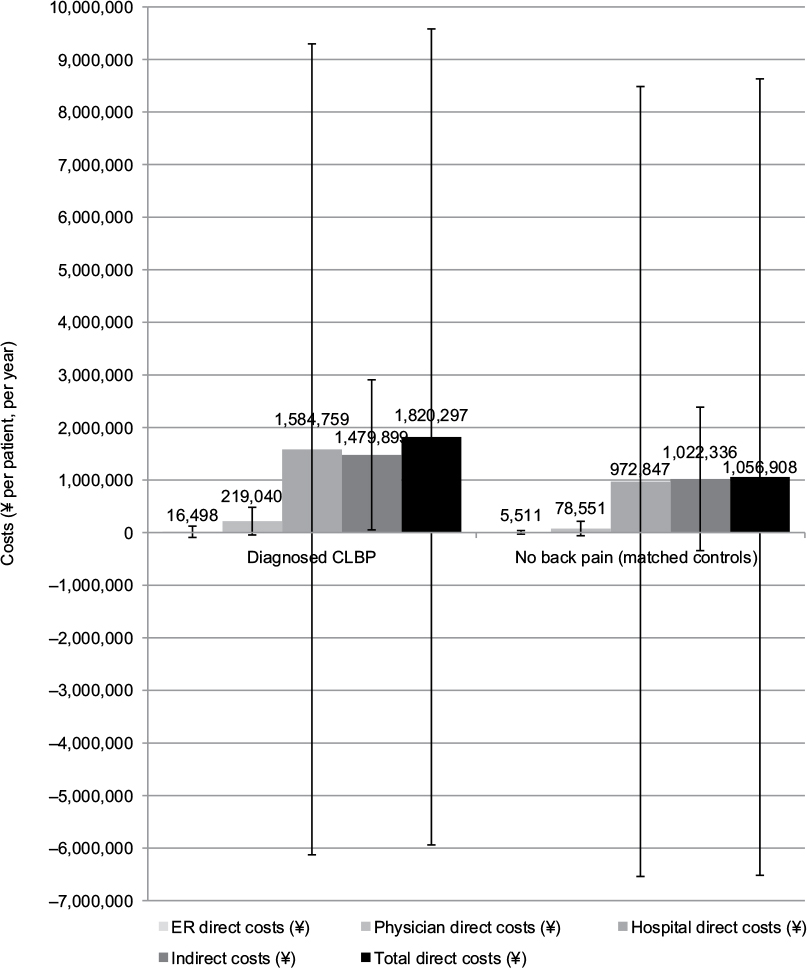 | Figure 5 Costs (¥ per patient, per year) in CLBP patients and matched controls (means weighted by age and sex with ±1 standard deviation error bars). Abbreviations: CLBP, chronic lower back pain; ER, emergency room. |
Discussion
The current study used matched comparisons to estimate the direct medical and indirect costs associated with CLBP in Japan using data from a cross-sectional survey. These data provide an updated comprehensive quantitative review on the impact of CLBP on HRQoL, work productivity, and healthcare resource use in Japan.
The current study is differentiated from previous reports on LBP and chronic pain in Japan in that it describes individual and societal sequelae of CLBP specifically. Like these prior reports on LBP and chronic pain sufferers,9,11,14 the current study participants with CLBP reported lowered HRQoL, reduced work productivity, and heightened use of healthcare resources compared to those not reporting back pain. Group differences (diagnosed CLBP vs. no back pain) exceeded the MID across both physical and mental HRQoL and health utility measures.23,33 Moreover, respondents reporting CLBP were also significantly older, had significantly higher BMI, were significantly more likely to be a current smoker, and had significantly more medical comorbidities compared to controls.
Age and sex adjusted models estimated mean annual per patient direct medical and indirect costs of CLBP to be ¥1,820,297 ($15,239 or €12,551) and ¥1,479,899 ($12,389 or €10,203), respectively, with the majority of direct medical costs attributable to hospital expenses (¥1,584,759, which is equivalent to $13,267 and €10,927). Indirect cost estimates were found to be comparable with those from previous studies of chronic pain patients.14 In estimating the economic impact of CLBP on society, the CLBP respondents were estimated to include 1,508,524 individuals when projected to the Japanese population (815,461 of them employed). Ultimately, this represents approximately ¥1.2 trillion ($10 billion or €8.3 billion) per year in lost productivity at the time of this study.
Strikingly, the average respondent with CLBP reported mild-to-moderate daily pain, indicating that their pain does not fully resolve – possibly despite pain-management efforts. Indeed, four out of ten (39.8%) patients with CLBP were currently taking a prescription medication for their pain and notably, of these patients, four in six were taking NSAIDs (76.3%) and one in six (14.1%) were taking opioids. Furthermore, among patients with CLBP not currently taking a prescription for their pain, 62.7% had previously used a prescription to manage their pain. It is unclear why this group would have discontinued their treatment if they were continuing to experience pain. Possibilities previously described in European studies are that the medication was not effective, the medication caused problematic side effects, and/or that a systematic breakdown in communication regarding these problems between patients with CLBP and their prescribing physicians took place –forming a vicious cycle leading to inadequate pain management.34 Taken together, these data indicate that patients with CLBP are faced with considerable unmet needs and that existing management strategies for CLBP have room for improvement. These unmet needs would likely be more complicated for patients with comorbid conditions that have been shown to interact with CLBP, such as depression.35
The results of this study should be interpreted by considering certain limitations. First, the sample participated using an Internet survey, which may call into question the generalizability of the findings. However, it is ensured that demographic composition of the sample is representative of the general Japanese population, particularly after weighting. Second, all data were self-reported, including diagnosis and symptom information. Also, no clinical measures were available in this survey database and it was not possible to control for all factors that may have affected results (e.g., unmeasured variables correlated with the presence of CLBP in the study). Nonetheless, self-reported measures were routinely used to collect information on the variables used in this study in similar prior studies.4,11,12,14,18,35,36 Also, current study findings align with research using hospital financial service and work injury compensation data.17,18 Finally, because of the cross-sectional nature of the study, a causal relationship between CLBP and the outcomes could not be established.
Conclusion
Overall, the experience of patients with CLBP in Japan is one where patients suffer from significantly worse HRQoL and poor health outcomes and where the societal impact represents a significant burden on the Japanese economy. The results from the current study can be used for the purposes of evaluating interventions for CLBP, which have been reported to attenuate suffering and economic burden in patients with LBP.16–18 Further, longitudinal research to evaluate the effectiveness of different interventions for the management of CLBP on patient outcomes and the associated economic burden is needed.
Acknowledgments
The authors acknowledge Tammy Schuler, PhD, for assistance with literature review and writing. This study was funded by Eli Lilly Japan K.K., as were this manuscript and publication fees. Kantar Health conducted this study with funding from Lilly and manages the NHWS.
Author contributions
Jeffrey Vietri performed the statistical analyses. All authors contributed to study design, interpretation, and writing/review of this publication, including approval of the final manuscript.
Disclosure
William Montgomery is a full-time employee of Eli Lilly Australia Pty Ltd. Masayo Sato and Yasuo Nagasaka are full-time employees of Eli Lilly Japan K.K. Jeffrey Vietri was an employee of Kantar Health at the time of this study and its reporting. The authors report no other conflicts of interest in this work.
References
Andersson GBJ. The epidemiology of spinal disorders. In: Frymoyer JW, editor. The Adult Spine: Principles and Practice. Philadelphia: Lippincott-Raven; 1997:93–141. | ||
Hoy D, March L, Brooks P, et al. The global burden of low back pain: estimates from the Global Burden of Disease 2010 study. Ann Rheum Dis. 2014;73(6):968–974. | ||
Fujii T, Matsudaira K. Prevalence of low back pain and factors associated with chronic disabling back pain in Japan. Eur Spine J. 2013;22(2):432–438. | ||
Inoue S, Kobayashi F, Nishihara M, et al. Chronic pain in the Japanese community–prevalence, characteristics and impact on quality of life. PLoS One. 2015;10(6):e0129262. | ||
Maniadakis N, Gray A. The economic burden of back pain in the UK. Pain. 2000;84(1):95–103. | ||
Dagenais S, Caro J, Haldeman S. A systematic review of low back pain cost of illness studies in the United States and internationally. Spine J. 2008;8(1):8–20. | ||
Lidgren L. The bone and joint decade 2000–2010. Bull World Health Organ. 2003;81(9):629. | ||
Maetzel A, Li LC, Pencharz J, Tomlinson G, Bombardier C; Community Hypertension and Arthritis Project Study Team. The economic burden associated with osteoarthritis, rheumatoid arthritis, and hypertension: a comparative study. Ann Rheum Dis. 2004;63(4):395–401. | ||
Itoh H, Kitamura F, Yokoyama K. Estimates of annual medical costs of work-related low back pain in Japan. Ind Health. 2013;51(5):524–529. | ||
World Health Organization. WHO guide to cost-effectiveness analysis. Global Programme on Evidence for Health Policy, World Health Organization, Geneva. Available from: http://www.who.int/choice/publications/p_2003_generalised_cea.pdf. Published 2003. Accessed December 10, 2016. | ||
Sadosky AB, DiBonaventura M, Cappelleri JC, Ebata N, Fujii K. The association between lower back pain and health status, work productivity, and health care resource use in Japan. J Pain Res. 2015;8:119–130. | ||
Wada K, Arakida M, Watanabe R, Negishi M, Sato J, Tsutsumi A. The economic impact of loss of performance due to absenteeism and presenteeism caused by depressive symptoms and comorbid health conditions among Japanese workers. Ind Health. 2013;51(5):482–489. | ||
Phillips CJ. The cost and burden of chronic pain. Br J Pain. 2009;3(1):2–5. | ||
Takura T, Ushida T, Kanchiku T, et al. The societal burden of chronic pain in Japan: an internet survey. J Orthop Sci. 2015;20(4):750–760. | ||
Aronsson G, Gustafsson K, Dallner M. Sick but yet at work. An empirical study of sickness presenteeism. J Epidemiol Community Health. 2000;54(7):502–509. | ||
Igarashi A, Akazawa M, Murata T, et al. Cost-effectiveness analysis of pregabalin for treatment of chronic low back pain in patients with accompanying lower limb pain (neuropathic component) in Japan. Clinicoecon Outcomes Res. 2015;7:505–520. | ||
Sawazaki K, Mukaino Y, Kinoshita F, et al. Acupuncture can reduce perceived pain, mood disturbances and medical expenses related to low back pain among factory employees. Ind Health. 2008;46(4):336–340. | ||
Takura T, Shibata M, Inoue S, et al. Socioeconomic value of intervention for chronic pain. J Anesth. 2016;30(4):553–561. | ||
Aitken M. Global medicines use in 2020: outlook and implications. IMS Health. Available from: http://www.imshealth.com/en/thought-leadership/quintilesims-institute/reports/global-medicines-use-in-2020. Published 2015. Accessed January 13, 2017. | ||
Liu GG, DiBonaventura Md, Yuan Y, et al. The burden of illness for patients with viral hepatitis C: evidence from a national survey in Japan. Value Health. 2012;15(1 Suppl):S65–S71. | ||
Chou R, Qaseem A, Snow V, et al; Clinical Efficacy Assessment Subcommittee of the American College of Physicians; American College of Physicians; American Pain Society Low Back Pain Guidelines Panel. Diagnosis and treatment of low back pain: a joint clinical practice guideline from the American College of Physicians and the American Pain Society. Ann Intern Med. 2007;147(7):478–491. | ||
Japanese Orthopaedic Association. Clinical Practice Guideline for the Management of Low Back Pain. Tokyo: Nankodo Co., Ltd.; 2012. | ||
Maruish ME. User’s Manual for the SF-36v2 Health Survey. 3rd ed. Lincoln, RI: QualityMetric Incorporated; 2011. | ||
Brazier J, Roberts J, Deverill M. The estimation of a preference-based measure of health from the SF-36. J Health Econ. 2002;21(2):271–292. | ||
Reilly MC, Zbrozek AS, Dukes EM. The validity and reproducibility of a work productivity and activity impairment instrument. Pharmacoeconomics. 1993;4(5):353–365. | ||
Ministry of Health, Labour, and Welfare. Trends in the estimation of medical expenses per hospitalization (Japanese). Available from: http://www.mhlw.go.jp/bunya/iryouhoken/database/zenpan/dl/h23_doukou_03.pdf. Published 2011. Accessed September 3, 2014. | ||
Lofland JH, Pizzi L, Frick KD. A review of health-related workplace productivity loss instruments. Pharmacoeconomics. 2004;22(3):165–184. | ||
Ministry of Health, Labour, and Welfare. Outpatient services; Central Social Insurance Medical Council at 30 Dec 2011 (Japanese). Available from: http://www.mhlw.go.jp/stf/shingi/2r9852000001wj9o-att/2r9852000001wje3.pdf [Japanese]. Accessed September 3, 2014. | ||
Leigh JP, Markowitz SB, Fahs M, Shin C, Landrigan PJ. Occupational injury and illness in the United States. Estimates of costs, morbidity, and mortality. Arch Intern Med. 1997;157(14):1557–1568. | ||
Marcotte DE, Wilcox-Gök V. Estimating the employment and earnings costs of mental illness: recent developments in the United States. Soc Sci Med. 2001;53(1):21–27. | ||
Fautrel B, Clarke AE, Guillemin F, et al. Costs of rheumatoid arthritis: new estimates from the human capital method and comparison to the willingness-to-pay method. Med Decis Making. 2007;27(2):138–150. | ||
Xie F, Thumboo J, Fong KY, et al. A study on indirect and intangible costs for patients with knee osteoarthritis in Singapore. Value Health. 2008;11(Suppl 1):S84–S90. | ||
Walters SJ, Brazier JE. Comparison of the minimally important difference for two health state utility measures: EQ-5D and SF-6D. Qual Life Res. 2005;14(6):1523–1532. | ||
Varrassi G, Müller-Schwefe G, Pergolizzi J, et al. Pharmacological treatment of chronic pain – the need for change. Curr Med Res Opin. 2010;26(5):1231–1245. | ||
Tsuji T, Matsudaira K, Sato H, Vietri J. The impact of depression among chronic low back pain patients in Japan. BMC Musculoskelet Disord. 2016;17(1):447. | ||
Nakamura M, Nishiwaki Y, Ushida T, Toyama Y. Prevalence and characteristics of chronic musculoskeletal pain in Japan: a second survey of people with or without chronic pain. J Orthop Sci. 2014;19(2):339–350. |
 © 2017 The Author(s). This work is published and licensed by Dove Medical Press Limited. The full terms of this license are available at https://www.dovepress.com/terms.php and incorporate the Creative Commons Attribution - Non Commercial (unported, v3.0) License.
By accessing the work you hereby accept the Terms. Non-commercial uses of the work are permitted without any further permission from Dove Medical Press Limited, provided the work is properly attributed. For permission for commercial use of this work, please see paragraphs 4.2 and 5 of our Terms.
© 2017 The Author(s). This work is published and licensed by Dove Medical Press Limited. The full terms of this license are available at https://www.dovepress.com/terms.php and incorporate the Creative Commons Attribution - Non Commercial (unported, v3.0) License.
By accessing the work you hereby accept the Terms. Non-commercial uses of the work are permitted without any further permission from Dove Medical Press Limited, provided the work is properly attributed. For permission for commercial use of this work, please see paragraphs 4.2 and 5 of our Terms.