")
Back to Journals » Vascular Health and Risk Management » Volume 19
The Diastolic Oscillation Amplitude Used as an Arterial Aging Indicator
Authors Clara FM , Alfie J , Scandurra A, Fita M
Received 10 August 2022
Accepted for publication 27 March 2023
Published 4 April 2023 Volume 2023:19 Pages 193—200
DOI https://doi.org/10.2147/VHRM.S381452
Checked for plagiarism Yes
Review by Single anonymous peer review
Peer reviewer comments 2
Editor who approved publication: Professor Mirna N Chahine
Fernando M Clara,1,2 José Alfie,3 Adriana Scandurra,1 Mariana Fita2
1Instituto de Investigaciones Científicas y Tecnológicas en Electrónica, Universidad Nacional de Mar del Plata/ CONICET, Mar del Plata, Argentina; 2Unidad Cardiometabólica, Centro de Especialidades Médicas Ambulatorias, Mar del Plata, Argentina; 3Unidad de Hipertensión Arterial, Servicio de Clínica Médica, Hospital Italiano de Buenos Aires, Ciudad de Buenos Aires, Argentina
Correspondence: Fernando M Clara, ICyTE, UNMDP/CONICET, Av. Juan B. Justo 4302, Mar del Plata, B7600, Argentina, Tel +54 0223 481-0046, Email [email protected]
Introduction: The compliance of the distal arteries depends on their vasoconstrictor tone and distensibility and is sensitive to endothelial function and aging. C2, a component of the Windkessel model, is a measure of distal arterial compliance, and establishes the magnitude of the pressure rise during early diastole. It is calculated from the diastolic portion of the radial pulse wave using sophisticated analyses. C2 is used as a cardiovascular risk indicator since it decreases with aging, high blood pressure, and diabetes. Here, we propose an alternative method to assess the distal arteries distensibility by measuring the amplitude of the oscillation that occurs at the beginning of diastole.
Methods: Peripheral pulse wave was evaluated noninvasively by applanation tonometry in 511 individuals (264 women) aged between 13 and 70 years. Diastolic amplitude (DA) was measured as the peak-to-peak amplitude of the diastolic oscillation. Radial augmentation index (RAIx) and pulse wave velocity (PWV) were also calculated.
Results: DA decreased approximately 2% per decade of life between 16 and 70 years from 19% to 7%, and was higher in men than in women (p< 0.0001). Linear regression analysis identified RAIx as the strongest predictor of AD (p< 0.0001), followed by age and height. Sex modified the age-related decrease in DA (p< 0.001). By applying the method to measure DA from previously published data, we found a strong linear correlation with C2.
Conclusion: DA decreased linearly with age in a reciprocal manner to the increase in radial augmentation index, was greater in men than women, and was independent of blood pressure and heart rate, as previously reported for C2. We propose that measuring DA could provide an alternative index to evaluate distal arterial compliance and aging.
Keywords: pulse wave analysis, diastole, distal arteries, ageing
Introduction
The compliance of the distal arteries depends on their vasomotor tone and distensibility and is sensitive to endothelial function and aging. C2, a component of the Windkessel model, is a measure of distal arterial compliance, and establishes the magnitude of the pressure rise during early diastole.
Otto Frank’s original Windkessel model (1899) explained the diastolic phase of the pulse wave by considering the central arteries as an elastic reservoir that stores blood during systole and releases it during diastole.1 Goldwyn and Watt (1967) introduced the concept of proximal and distal compliance (C1 and C2 respectively) in a 4-element Windkessel model.2 Different reports also identify C2 as the elastic properties of the small distal arteries,3–5 which decreases with age and cannot be attributed to a specific region.6,7 The Goldwyn and Watt model explains the damped oscillation superimposed on the exponential drop in diastolic pressure. It is produced by the energy exchange between L, C2 and peripheral resistance.6,7
C2 has been proposed as an index of endothelial function, but its clinical application is limited by its sophisticated calculation explained by Segers et al, that requires a system of equations resolution that includes the empirical estimation of Rp and L, which could introduce errors.3
Superimposed on the exponentially decreasing diastolic profile, immediately after the incisure, follows a damped oscillation that has been attributed to distal arterial compliance (Figure 1).3 The physiological function of this oscillation is to increase systemic flow during early diastole. Aging alters the contour of the pulse waveform during both systole and diastole. While the systolic wave widens with aging at the expense of the increase in the augmentation pressure, the diastolic wave flattens, at the expense of the decrease in the diastolic oscillation amplitude (DA). Illustrating this, Figure 2 shows three representative radial pulse waveforms from healthy individuals of different ages.
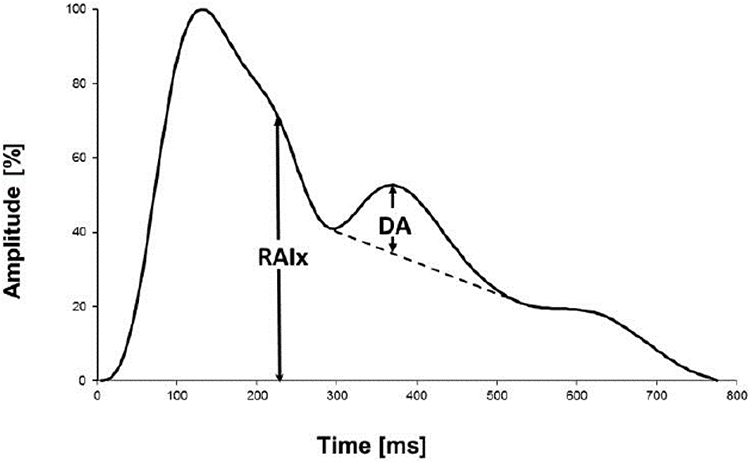 |
Figure 1 Radial pulse wave recording in a healthy adult. It was normalized in amplitude (0% −100%). The oscillation observed at the beginning of diastole depends on the distal arteries compliance. Abbreviations: DA, diastolic amplitude; RAIx, radial augmentation index. |
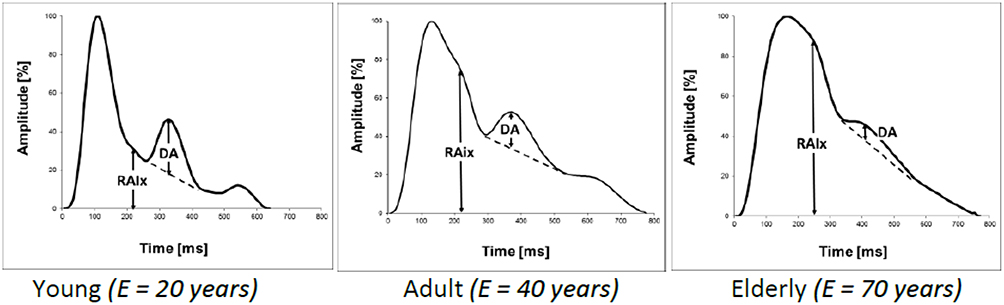 |
Figure 2 Effects of aging in healthy individuals. With increasing age, the systolic wave widens, and the oscillation amplitude flattens. |
Here we use DA as an alternative indicator of the distal compliance in the same way as the Diastolic Increase Index from the aortic pressure wave proposed by Heim et al, as illustrated in Figure 1.8 They measured the amplitude of the oscillation during diastole in the aortic pressure waveform as its peak-to-peak amplitude. We applied the method proposed by Heim to measure DA directly from the radial waveform and determine its relationship with age, radial augmentation index (RAix), blood pressure, and heart rate in healthy men and women.
Methods
Our study complies with the Declaration of Helsinki, and was approved by the Research Ethics Committee of the National University of Mar del Plata, and registered with the code NO- 2021-31009786-GDEBA-DPEGSFFMSALGP. All participants were informed about the purpose of the study and provided written consent. A parent or legal guardian of participants under 18 years of age provided informed consent.
To verify how DA varies with age, a healthy population consisting of 247 men and 264 women between the ages of 13 and 70 was selected, with normal blood pressure values, cholesterol, blood glucose, BMI, and free of medication. None of the participants reported chronic illnesses, drinking alcohol daily, or smoking cigarettes. It was requested to avoid the ingestion of tea, coffee, and food in the previous two hours.
Brachial blood pressure was after 15 minutes of resting measured, in a sitting position, with the right arm resting at the level of the heart, using a calibrated aneroid sphygmomanometer (Heine, Gamma 4.0), considering the average of three readings taken at 1-minute intervals.
The pulse wave was obtained by applanation tonometry immediately after blood pressure measurement, using a Murata 7BB-12-9 piezoelectric pressure sensor gently compressed at the radial palpation site.9 The sensor output was amplified with a maximum gain of 200 and a bandwidth of 15 Hz. It was then digitized, sampling at 8-bit resolution and 200 Hz sampling rate, and finally, acquired on a PC and processed. The software used was Mathcad 7, which includes signal processing.
Two one-minute radial pulse recordings for each subject in a sitting position were evaluated. The records were processed by averaging the 8 cardiac cycles with maximum correlation. The averaged signal was normalized in amplitude, corresponding the 100% amplitude to systolic pressure and 0% to diastolic pressure.
DA was measured from the averaged radial pulse wave contour, by tracing a line between the dicrotic notch and the minimum value of the first cycle of the subsequent damped oscillation, as shown in Figure 1. The maximum difference between the line and the pulse wave during diastole gives the DA value.8 This determination is so simple that it can even be carried out by hand on paper record if an appropriate software is not available.
Aortic PWV was calculated by dividing the estimated reflection distance proposed by Pierce et al through a regression equation based on BMI and age, by the time difference between the peaks values of systolic pressure and the reflected wave.10
RAIx was measured as the height of the inflection point produced by the reflected wave in the amplitude normalized pulse wave record. The inflection point corresponds to the zero crossing of the fourth derivative function.11,12
Statistical analysis was performed using MATLAB® (MathWorks, Natick, MA, USA). According to the results of Lilliefors test, normal distribution of data cannot be assumed. Wilcoxon rank sum test was used for comparisons between studied variables. Results are expressed as mean ± standard deviation (SD) or median and 1st–3rd quartiles, as appropriated. A p value < 0.05 was considered statistically significant. Stepwise regression was used to perform the linear regression model.
Results
At comparable mean age, men showed significantly higher Height, BMI, SBP, DBP, MAP, DA, and lower HR, RAIx, and PWV than women (Table 1).
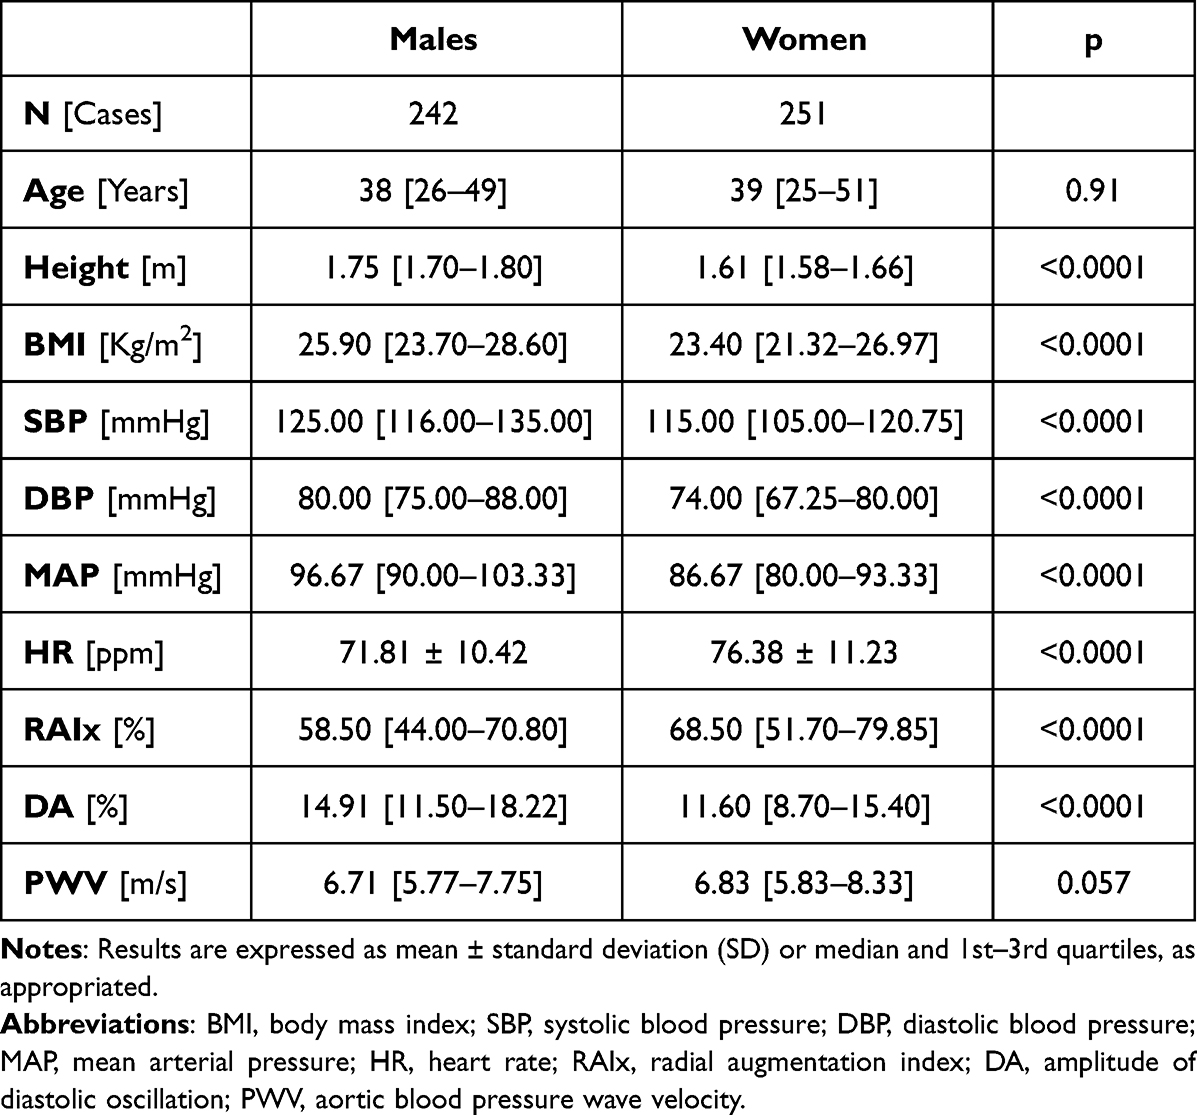 |
Table 1 General Characteristics of All Cases |
When plotting DA as a function of age (Figure 3), women showed lower values than men across the whole age spectrum. The Wilcoxon test indicated that with the same mean age, women show a lower DA value than men (p<0.0001). The approximation curves are 2nd-order exponentials, which shows that the reduction in DA with age was practically linear in the age range considered, decreasing approximately 2% per decade of life between 16 and 70 years.
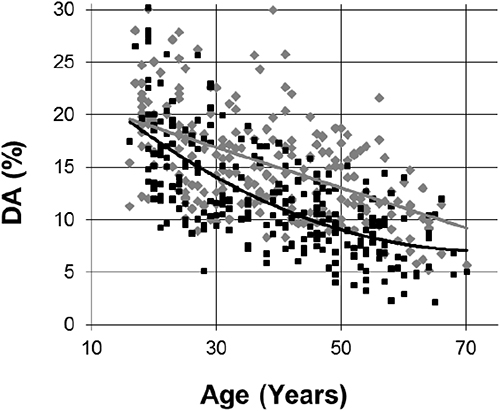 |
Figure 3 Variation of DA with age in healthy individuals of both sexes. Males: Gray diamonds, Females: Black squares. The approximation curves are 2nd order polynomials. The determinant coefficient values are R2= 0.35 for females and R2= 0.49 for males. |
Multiple linear regression analysis (Table 2) identified RAIx as the strongest predictor of DA, followed by age and height. Sex only had significance when associated with age. HR, blood pressure, PWV, and BMI, were not independent predictors of DA.
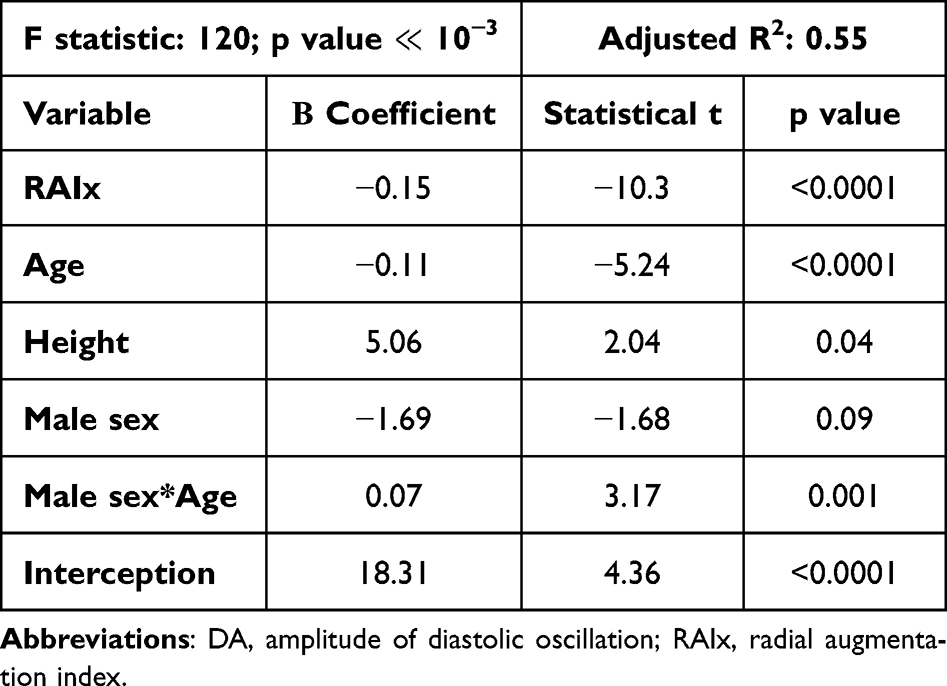 |
Table 2 Linear Regression Coefficients of the Variable DA, for Both Sexes |
Discussion
The pulse wave is the pressure drop that occurs over the Windkessel output, consisting of the parallel formed by C2 and peripheral resistance. The value of C2 affects particularly the oscillation that occurs at the start of diastole, since it forms part of a resonant circuit together with L and C1. DA represents the amplitude of that oscillation.
We measured the amplitude of the oscillation DA directly from the radial pulse contour (Figure 1), in a manner analogous to that applied by Heim for aortic pressure. We propose that DA represents a surrogate measure of C2, whose calculation is based on the estimation of peripheral resistance and the application of mathematical algorithms.13–15
The linearity of the relationship between DA and C2 can be obtained from the simulation carried out by Wang et al, applying the method that we are proposing.16 They simulated the Windkessel output pressure during diastole for six different values of C2, and determined values of L, C1, and peripheral resistance, within or close to the physiological range. They obtained six pulse wave curves plotted against time. For each of these curves, the graphic calculation procedure explained in Figure 1 was applied, obtaining six different values of DA. Plotting the DA values graphically calculated versus the corresponding C2 values, obtained the relationship between both variables shown in Figure 4, in which a high correlation is observed (R2 = 0.99). This signifies that DA can also be considered an indicator of distal arteries stiffness, equivalent to C2. The increase in DA with C2 can also be found in the graphs presented by Segers et al.3
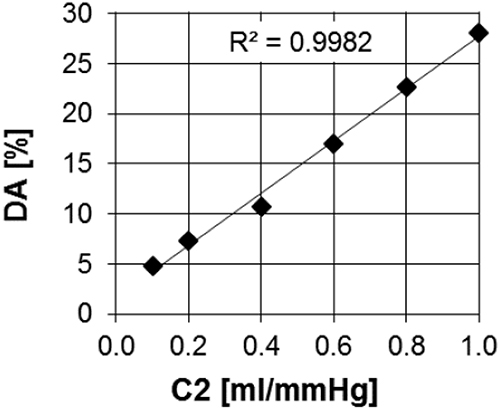 |
Figure 4 Variation of DA with C2. Notes: Data from Wang et al.16 |
In addition, the results of the multiple regression analysis indicate that DA behaves similarly to C2 in its relationship with the variables that affect the cardiovascular system.
Linear DA regression revealed that the most significant predictors of DA were RAIx and age, followed by height and sex (Table 2). DA was not significantly related to BMI, HR, MAP, PP, and PWV.
The strong association between DA and age shown in Table 2 resembles the correlation between C2 and age shown by Mc Veigh et al, suggesting that radial DA would also be a marker of distal arterial aging.
The high correlation between DA and RAIx could be due to a common dependence on endothelial function, as occurs between the aortic augmentation index and C2.3
The explanation of the high correlations between DA, age, and IAR, is the following.
The compliance of an artery is defined as the variation in volume produced by a variation in pressure. It increases with arterial diameter and length, and decreases with the thickness and elastic modulus of its wall. In particular, the microcirculatory compliance is proportional to the mass of the perfused skeletal muscle territory.
The diameter of muscular arteries depends on the contractile state or tone of their vascular smooth muscle, determined by the balance between vasoconstrictor and vasodilator substances released by the endothelium into the arterial wall.17,18
Healthy endothelium ensures highly compliant aortic walls and low PWV. In addition, nitric oxide-dependent vasorelaxation at the aortic reflection zone and the distal muscular arteries gives rise to a low amplitude reflected wave that reaches the radial recording zone almost at the end of systole, causing a low RAIx value. In the distal arteries, the relaxed walls increase C2 and DA.19,20
The effects of nitric oxide on the pressure waveform are reproduced by the administration of nitroglycerin as illustrated by Munir et al. By measuring RAix and DA from the figure, a reciprocal change becomes apparent. Nitroglycerin administration induced a decrease in RAIx, from 78% to 27%, and a concomitant increase in DA, from 10% to 19%.21
Age-related endothelial dysfunction causes a decrease in C2, and a concomitant increase in RAIx.
The Increased distal arterial vasoconstrictor tone caused by age-related endothelial dysfunction contributes to the decrease in C2.22 Decreasing C2 also decreases DA, according to the reports of Mc Veigh (1999) and Wang.16,19
In contrast, our earlier finding of a higher radial DA in young elite athletes than in age-matched controls might express the effects of improved endothelial function. This leads to an increase in the diameter of the small arteries that supply the skeletal muscles that have become hypertrophied as a result of intense training.23,24
Sex differences in DA could be determined by anthropometric factors. A shorter height and lower muscle mass than men together with smaller arterial diameter might contribute to decrease distal compliance and AD in women.
Multiple regression analysis indicated that HR did not influence DA. The latter is consistent with that reported by Heim at the central level, showing that in contrast to the strong inverse relationship of RAIx with HR, DA was independent of it.8
In agreement with previous findings using C2, our results showed a weak relationship of DA with MAP and PP.19
Perspectives
We propose that measuring DA directly from the radial artery waveform, instead of calculating C2, could avoid potential errors derived from mathematical algorithms applications.13–15
DA measurement could easily replace C2 calculation for distal arteries assessment, which is a target of cardiometabolic diseases and aging. Additionally, AD might represent a marker of cardiovascular adaptation to physical training.
Limitations
Although the proposed method is simple and DA measurement is always possible, we have noticed a considerable dispersion of values in the set of volunteers.
Physical training or sports activity practiced continuously produces an increase in the diameter and a decrease in the wall thickness of the distal arteries involved and increases the irrigation of the trained muscle mass.24 But the effects depend on the intensity, the training time, the continuity and the various modalities offered in gyms. Anaerobic training increases arterial stiffness, aerobic decreases it, and they are generally practiced in combination.25
Despite the fact that none of the volunteers is a professional athlete, the dispersion could be attributed to individual physical activity, which was not considered.
Conclusions
AD is the pressure drop over C2, which represents the distal arteries compliance in the Windkessel model. Radial DA could be used as an alternative index of distal arterial stiffness instead of the more sophisticated calculation of C2.
Both indicators, AD and C2, are closely related, as can be seen in the simulation carried out by Wang et al. Supporting this relationship, we found that DA is higher in men than in women, decreases with age in both sexes, and is independent of blood pressure and heart rate, as other studies have reported for C2.
Just as the RAIx evaluates aortic stiffness, DA measurement allows evaluating the distal arteries stiffness, related to aging and cardiometabolic diseases.
Disclosure
The authors report no conflicts of interest in this work.
References
1. Frank O. Die Grundform des arteriellen Pulses. Zeitung für Biologie. 1899;37:483–586.
2. Goldwyn R, Watt T. Arterial pressure pulse contour analysis via a mathematical model for the clinical quantification of human vascular properties. IEEE Trans Biomed Eng. 1967;14:11–17. doi:10.1109/TBME.1967.4502455
3. Segers P, Qasem A, De Backer T, Carlier S, Verdonck P, Avolio A. Peripheral “oscillatory” compliance is associated with aortic augmentation index. Hypertension. 2001;37(6):1434–1439. doi:10.1161/01.HYP.37.6.1434
4. Rietzchel ER, Boeykens E, De Buyzere ML, Duprez DA, Clement DL. A comparison between systolic and diastolic pulse contour analysis in the evaluation of arterial stiffness. Hypertension. 2001;37(6):E15–22. doi:10.1161/01.hyp.37.6.e15
5. Duprez DA, Forbang NI, Allison MA, Peralta CA, Shea S, Jacobs DR
6. Tao J, Liu D, Wang L, et al. Arterial elasticity identified by pulse wave analysis and its relation to endothelial function in patients with coronary artery disease. J Hum Hypertens. 2007;21(2):149–153. doi:10.1038/sj.jhh.1002112
7. Francis SE. Continuous estimation of cardiac output and arterial resistance from arterial blood pressure using a third-order Windkessel model [Thesis (M. Eng.)]. Massachusetts Institute of Technology, Dept. of Electrical Engineering and Computer Science; 2007.
8. Heim A, Liaudet L, Waeber B, Feihl F. Pulse wave analysis of aortic pressure: diastole should also be considered. J Hypertens. 2013;31:94–102. doi:10.1097/HJH.0b013e32835ae97d
9. Mackenzie IS, Wilkinson IB, Cockcroft JR. Assessment of arterial stiffness in clinical practice. QJM. 2002;95(2):67–74. doi:10.1093/qjmed/95.2.67
10. Pierce G, Casey D, Fiedorowicz J, et al. Aortic pulse wave velocity and reflecting distance estimation from peripheral waveforms in humans: detection of age- and exercise training-related differences. Am J Physiol Heart Circ Physiol. 2013;305(1):H135–42. doi:10.1152/ajpheart.00916.2012
11. Kohara K, Tabara Y, Oshiumi A, Miyawaki Y, Kobayashi T, Miki T. Radial augmentation index: a useful and easily obtainable parameter for vascular aging. Am J Hypertens. 2005;18(1 Pt 2):11S–14S. doi:10.1016/j.amjhyper.2004.10.010
12. Takazawa K, Tanaka N, Takeda K, Kurosu F, Ibukiyama C. Underestimation of vasodilator effects of nitroglycerin by upper limb blood pressure. Hypertension. 1995;26(3):520–523. doi:10.1161/01.HYP.26.3.520
13. Williams B. Pulse wave analysis and hypertension: evangelism versus skepticism. J Hypertens. 2004;22(3):447–449. doi:10.1097/00004872-200403000-00002
14. Millaseau SC, Patel SJ, Redwood SR, Ritter JM, Chowienczyk PJ. Pressure wave reflection assessed from the peripheral pulse - is a transfer function necessary? Hypertension. 2003;41(1016–1020):1016–1020. doi:10.1161/01.HYP.0000057574.64076.A5
15. Hope SA, Tay DB, Meredith IT, Cameron JD. Use of arterial transfer functions for the derivation of arterial wave form characteristics. J Hypertens. 2003;21:1299–1305. doi:10.1097/00004872-200307000-00017
16. Wang L, Xu L, Zhou S, et al. Design and implementation of a pulse wave generator based on Windkessel model using field programmable gate array technology. Biomed Signal Process Control. 2017;36:93–101. doi:10.1016/j.bspc.2017.03.008
17. Sehgel NL, Vatner SF, Meininger GA. “Smooth muscle cell stiffness syndrome”-revisiting the structural basis of arterial stiffness. Front Physiol. 2015;6:335. doi:10.3389/fphys.2015.00335
18. Lacolley P, Regnault V, Avolio AP. Smooth muscle cell and arterial aging: basic and clinical aspects. Cardiovasc Res. 2018;114(4):513–528. doi:10.1093/cvr/cvy009
19. McVeigh GE, Bratteli CW, Morgan DJ, et al. Age-related abnormalities in arterial compliance identified by pressure pulse contour analysis. Hypertension. 1999;33:1392–1398. doi:10.1161/01.HYP.33.6.1392
20. Tao J, Jin YF, Yang Z, et al. Reduced arterial elasticity is associated with endothelial dysfunction in persons of advancing age: comparative study of noninvasive pulse wave analysis and laser Doppler blood flow measurement. Am J Hypertens. 2004;17(8):654–659. doi:10.1016/j.amjhyper.2004.03.678
21. Munir S, Jiang B, Guilcher A, et al. Exercise reduces arterial pressure augmentation through vasodilation of muscular arteries in humans. Am J Physiol Heart Circ Physiol. 2008;294(4):H1645–50. doi:10.1152/ajpheart.01171.2007
22. Scioli MG, Bielli A, Arcuri G, Ferlosio A, Orlandi A. Ageing and microvasculature. Vasc Cell. 2014;16(6):19. doi:10.1186/2045-824X-6-19
23. Clara F, Alfie J, Blanco G, Resina C, Fita M, Meschino G. Radial pulse wave analysis in young male elite athletes. Artery Res. 2021;27(2):69–74. doi:10.2991/artres.k.201208.001
24. Green DJ, Spence A, Rowley N, Thijssen DH, Naylor LH. Vascular adaptation in athletes: is there an ‘athlete’s artery’? Exp Physiol. 2012;97:295–304. doi:10.1113/expphysiol.2011.058826
25. Beattie K, Kenny IC, Lyons M, Carson BP. The effect of strength training on performance in endurance athletes. Sports Med. 2014;44(6):845–865. doi:10.1007/s40279-014-0157-y
 © 2023 The Author(s). This work is published and licensed by Dove Medical Press Limited. The full terms of this license are available at https://www.dovepress.com/terms.php and incorporate the Creative Commons Attribution - Non Commercial (unported, v3.0) License.
By accessing the work you hereby accept the Terms. Non-commercial uses of the work are permitted without any further permission from Dove Medical Press Limited, provided the work is properly attributed. For permission for commercial use of this work, please see paragraphs 4.2 and 5 of our Terms.
© 2023 The Author(s). This work is published and licensed by Dove Medical Press Limited. The full terms of this license are available at https://www.dovepress.com/terms.php and incorporate the Creative Commons Attribution - Non Commercial (unported, v3.0) License.
By accessing the work you hereby accept the Terms. Non-commercial uses of the work are permitted without any further permission from Dove Medical Press Limited, provided the work is properly attributed. For permission for commercial use of this work, please see paragraphs 4.2 and 5 of our Terms.