")
Back to Journals » Clinical Interventions in Aging » Volume 17
The Diagnostic Value of the Deepest S Wave in 12-Lead Electrocardiogram to Elderly Patients with Essential Hypertension and Left Ventricular Hypertrophy
Received 1 July 2022
Accepted for publication 11 November 2022
Published 22 November 2022 Volume 2022:17 Pages 1663—1672
DOI https://doi.org/10.2147/CIA.S380814
Checked for plagiarism Yes
Review by Single anonymous peer review
Peer reviewer comments 2
Editor who approved publication: Dr Maddalena Illario
Dapeng Ji,* Bo Zhang,* Bo He
Department of Cardiac Function, The Sixth Hospital of Wuhan, Affiliated Hospital of Jianghan University, Wuhan, People’s Republic of China
*These authors contributed equally to this work
Correspondence: Bo He, Department of Cardiac Function, The Sixth Hospital of Wuhan, Affiliated Hospital of Jianghan University, No. 168 Hong Kong Road, Wuhan, 430050, People’s Republic of China, Tel: +86-13437154321, Email [email protected]
Objective: This study aims to explore the diagnostic value of the deepest S wave (SD) in elderly patients with essential hypertension and left ventricular hypertrophy (LVH).
Methods: A retrospective study was conducted in elderly patients with essential hypertension from October 2020 to December 2021. The 12-lead electrocardiogram (ECG) examination was carried out at the time of admission. Echocardiography was performed to estimate left ventricular mass (LVM) and the left ventricular muscle mass index (LVMI) was adjusted by the body surface area (BSA). The Receiver Operating Characteristic (ROC) curve for diagnosing hypertension with LVH was drawn, the cut-off value was determined according to the Youden index, and the area under the curve (AUC) was calculated. The diagnostic values of SD, SD+Sv4, ravl+Sv3, and Sv1+Rv5 were compared.
Results: The results of SD, SD+Sv4, RavL+Sv3, and Sv1+Rv5 in the Study group were 2.03 (1.56– 2.57) mV, 3.09 (2.38– 3.98) mV, 2.19 (1.46– 2.78) mV, and 3.38 (2.67– 4.19) mV respectively, which were all higher than those in the Control group [0.93 (0.68– 1.23) mV, 1.37 (1.32– 2.18) mV, 1.03 (0.68– 1.46) mV, and 2.28 (1.67– 2.67) mV], P< 0.001. Compared with the ROC curved by SD+Sv4, RavL+Sv3, and Sv1+Rv5, the AUC of the ROC curved by SD was [0.887, 95% CI (0.837– 0.927)], and the cut-off value was 1.298 with the Sensitivity = 86.03 and Specificity = 86.59 in diagnosing essential hypertension with LVH. In female patients, the AUC of the ROC curved by SD was [0.891, 95% CI (0.841– 0.934)], and the cut-off value was 1.304 with the Sensitivity of 89.32% and Specificity of 88.67%, which were all higher than those in male patients [AUC = 0.887, 95% CI (0.828– 0.943); cut-off value = 1.288; Sensitivity = 82.12%, and Specificity = 84.22%].
Conclusion: ECG can effectively diagnose elderly patients with essential hypertension and LVH and the diagnostic value of SD and SD+Sv4 are higher than the current Cornell criteria and Sokolow–Lyon criteria.
Keywords: essential hypertension, left ventricular hypertrophy, elderly patients, deepest S wave, electrocardiogram criteria
Introduction
With continuous changes in people’s living habits and dietary structure, about one-third of adults suffer from hypertension, and about 750,000 people die each year due to cardiovascular and cerebrovascular accidents caused by hypertension.1 China has become an aging society and hypertension is one of the most common chronic diseases in the elderly.2,3 Essential hypertension is a cardiovascular syndrome with elevated systemic arterial pressure as the main clinical manifestation.4 Poor long-term control of blood pressure results in a corresponding change in the structure of the heart, that is, left ventricular hypertrophy (LVH). LVH can increase the risk of cardiovascular diseases such as arrhythmia, myocardial ischemia, heart failure, and sudden cardiac death, posing a serious threat to the life and health of patients.5 In recent years, related reports have pointed out that early diagnosis and treatment can prevent and reverse LVH, thereby improving the prognosis of patients.6 Therefore, early, timely and accurate diagnosis of essential hypertension with LVH has become a hotspot of clinical research.
The 12-lead electrocardiogram (ECG) has the advantages of easy operation, good repeatability, non-invasiveness, and economy, and has been widely used in clinical practice.7 At present, the Cornell criteria and Sokolow–Lyon criteria are often used clinically for ECG diagnosis of LVH, but the sensitivity of these two methods is only 20–50%.8 Peguero et al has proposed a new diagnostic standard: SD+Sv4 standard, which is the sum of the amplitude of the deepest S wave in any lead (SD) and the amplitude of the S wave in lead V4 (Sv4); SD+Sv4≥2.8 mV in male patients and SD+Sv4≥2.3 mV in female patients are the diagnosed criteria for LVH.8 The sensitivity of SD+Sv4 criteria for diagnosing LVH was higher than 62%, which was significantly higher than other traditional diagnostic criteria.8 However, the SD+Sv4 standard was proposed based on a small sample population, which has not been validated in the domestic population.
Based on the above background, this study aimed to explore the diagnostic value of the deepest S wave (SD) in elderly patients with essential hypertension and LVH, to provide clinical evidence.
Methods and Material
Population
A retrospective study was conducted in elderly patients with essential hypertension who were admitted to our hospital from October 2020 to December 2021. According to the inclusion and exclusion criteria, there were 106 elderly patients with essential hypertension and left ventricular hypertrophy, and 90 patients were selected to form the Study group; by propensity matching of the age and gender, with a ratio of 0.9:1, 100 essential hypertensive patients were randomly selected from the remaining patients to form a Control group.
This study protocol complies with the relevant requirements of the Declaration of Helsinki of the World Medical Association and ethics approval was waived by our hospital because the review of patients’ data is anonymous. Patient enrollment flow chart is shown in Figure 1.
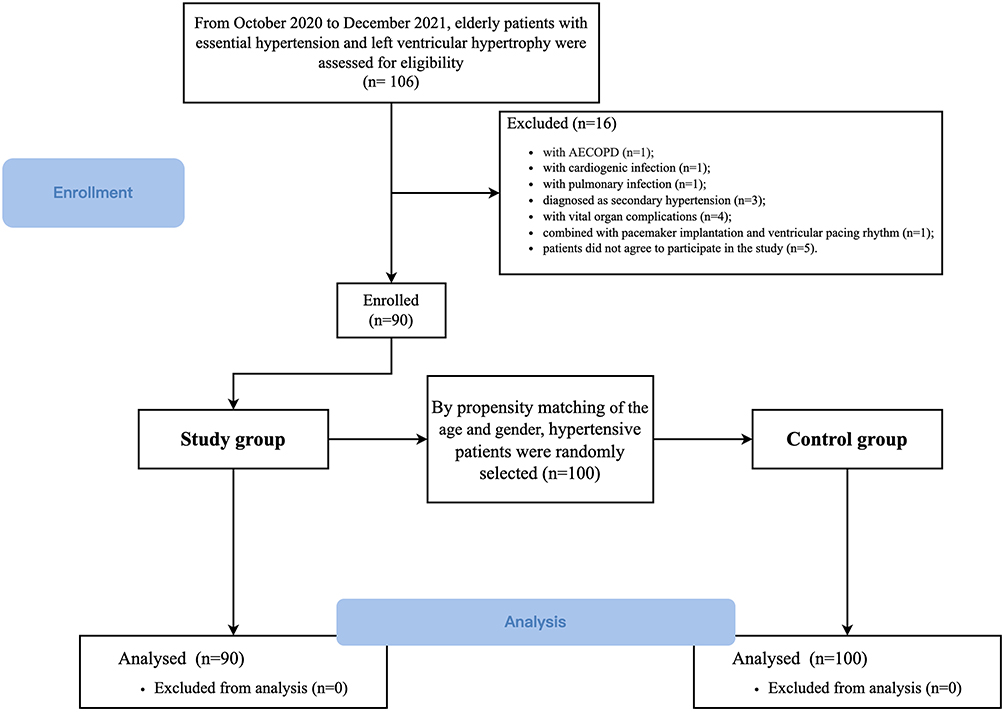 |
Figure 1 Patient enrollment flow chart. Abbreviation: AECOPD, acute exacerbation of chronic obstructive pulmonary disease. |
Inclusion and Exclusion Criteria
Inclusion criteria: (1) Age > 60 years old. A definite diagnosis of essential hypertension;9 (2) A definite diagnosis of left ventricular hypertrophy;10 (3) A normal mental state; (4) Agreed to participate in this study and signed written informed consent.
Exclusion criteria: (1) Combination of hematological diseases such as leukemia and anemia; (2) Combination of immune diseases such as autoimmune thyroiditis, Hashimoto’s thyroiditis, and immune thrombocytopenic purpura; (3) Combination liver and kidney diseases such as functional acute renal failure, decompensated cirrhosis; (4) Existence of cardiovascular system and pulmonary infection such as lobar pneumonia, lobular pneumonia, and infectious myocarditis; (5) Existence of pulmonary diseases such as respiratory infections, bronchial diseases, and lung cancer; (6) Combination of cardiomyopathy, heart valve disease, and severe arrhythmia; (7) A definite diagnosis of secondary hypertension; (8) Combined with complete left or right bundle branch block; (9) Implanted pacemaker and the presence of paced rhythm.
ECG Examination and Data Measurement
The 12-lead ECG examination was carried out at the time of admission. Foton FX7402 electrocardiographic comprehensive automatic analyzer was used, the speed was set to 25 mm/s, and the calibration was 10 mm/mV. Before the examination, the patients were made comfortable for 10 minutes in a quiet environment. Electrodes were placed in conventional positions, with the ECG baseline being stable, free of interference, and the graph was clear. 4–6 cardiac cycles were recorded in every lead, and 3 consecutive ECG cycles with a stable baseline were selected.
The PR segment was set as the baseline, individual leads were analyzed by measuring the highest R and deepest S waves in all precordial and limb leads, and only the largest compound voltage was selected in the presence of voltage differences within the same lead. The deepest S wave in the ECG was defined as SD, and the sum of the amplitude of the deepest S wave (SD) in all leads and the amplitude of the S wave in lead V4 (Sv4) is defined as SD+Sv4. The Cornell standard is the amplitude of the R wave in lead avL plus the amplitude of the S wave in lead V3 (RavL+Sv3); the Sokolow–Lyon standard is the amplitude of the S wave in lead V1 plus the amplitude of the higher R wave in lead V5 (Sv1+Rv5).
The above data were all obtained and analyzed by independent physicians who had more than 8-year experience and did not know the grouping of patients.
Ultrasonography and Measurement of Left Ventricular Mass
Echocardiography was performed on the same day as the ECG was carried out. Transthoracic echocardiography (TTE) was used as the reference method to estimate left ventricular mass (LVM). A Philips EPIQ 7C echocardiograph with an X5-1 probe in a frequency of 50 MHz was used to perform the TTE. Patients were instructed to breathe calmly and in the left lateral position, and the limb lead electrocardiogram was recorded synchronously. The interventricular thickness (IV thickness), left ventricular end-diastolic diameter (LVed), left ventricular posterior wall thickness (LV posterior wall thickness), and ejection fraction were recorded in the parasternal long-axis view. LVM was calculated according to the American Society of Echocardiography (ASE) recommendation and the LVH was definitely diagnosed:10 LVM (g) = 0.8×1.04×[(IV thickness+LVed+LV posterior wall thickness)3- LVed3]+0.6. Left ventricular muscle mass index (LVMI) was the result of the LVM adjusted by the body surface area (BSA). The diagnostic criteria for LVH in female patients was LVMI>95 g/m2 and in male patients was LVMI>115 g/m2.
The above data were all obtained and recorded by independent physicians who had more than 8-year experience and did not know the grouping of patients.
Observation Index
The clinical data (gender, age, body surface area, heart rate and blood pressure at admission), the comorbid diseases (peripheral vascular disease, diabetes, carotid plaque), results of ultrasound examinations (ejection fraction, LVMI, left ventricular posterior wall thickness, interventricular thickness), and the drug usage (calcium channel inhibitors, ACE inhibitors/ARBs, beta receptor inhibitors) of the two groups were collected.
The patients’ ECG parameters were taken as the main research objects, and the results of SD, SD+Sv4, ravl+Sv3, and Sv1+Rv5 were obtained from each patient.
Statistics
SPSS 22.0 software was used to analyze the data. Kolmogorov–Smirnov method was used for normality test. Normally distributed measurement data were expressed as mean ± standard deviation (SD), and Student’s t-test was used for comparisons, while non-normally distributed measurement data were expressed as median (interquartile range), and the comparisons were examined by Mann–Whitney test (non-parametric distribution). The categorical data were expressed as n (%), and the differences between the two groups were examined by chi-square analysis or Fisher’s exact test. P<0.05 was considered statistically significant.
According to the results of SD, SD+Sv4, RavL+Sv3, and Sv1+Rv5 in the two groups, the Receiver Operating Characteristic (ROC) curve for diagnosing hypertension with LVH was drawn, and the cutoff value was determined according to the Youden index, and the area under the curve (AUC) was calculated. Equivalence tests were compared by Z-scores calculated by Med Calc software. P<0.05 was considered a statistically significant difference.
Result
From October 2020 to December 2021, elderly patients with essential hypertension who were admitted to our hospital were retrospectively included in this study. According to the inclusion and exclusion criteria, there were 106 elderly patients with essential hypertension and LVH, and 90 patients were selected to form the Study group; a total of 16 patients were excluded for the following reasons: 1 patient combined with acute exacerbation of chronic obstructive pulmonary disease (AECOPD), 1 patient combined with cardiogenic infection, 1 patient combined with pulmonary infection, 3 patients were diagnosed as secondary hypertension, 4 patients combined with vital organ complications, 1 patient combined with pacemaker implantation and ventricular pacing rhythm, and 5 patients did not agree to participate in this study. Then based on the age and gender of the patients, 100 hypertensive patients were randomly selected to form the Control group by propensity matching. In the Study group, there were 64 males and 26 females, with an average age of 68.97±10.43 years. In the Control group: there were 78 males and 22 females, with an average age of 68.91±10.34 years (see Figure 1).
Demographic Comparisons
There were no significant differences in two groups among gender, age, comorbidities (peripheral vascular disease, diabetes, carotid atherosclerotic plaque), heart rate at the admission, ejection fraction assessed by the ultrasound, and drug usage (calcium channel inhibitors, angiotensin converting enzyme (ACE) inhibitors/angiotensin receptor blockers (ARBs), β-receptor inhibitors), P>0.05. The body surface area of the Study group was 1.75±0.23 m2, which was higher than that of the Control group (1.65±0.24 m2) with statistically significant differences, P = 0.004. The systolic blood pressure and diastolic blood pressure of the Study group at admission were 162.28 (154.93–171.04) mmHg and 99.09 (92.00–107.04) mmHg respectively, which were higher than those of the Control group [141.34 (132.32–149.73) mmHg vs 95.34 (85.36–101.08) mmHg], P<0.001. The Left ventricular posterior wall thickness and the interventricular thickness of the Study group were 13.08 (11.98–13.67) mm and 13.07 (12.78–14.23) mm, respectively, which were significantly higher than those of the Control group [8.81 (8.09–9.49) mm vs 8.78 (8.07–9.53) mm], P<0.001. The left ventricular muscle weight index of the Study group was 123.87 (116.31–142.89), which was higher than that of the Control group [64.09 (55.38–80.09)], P<0.001 (see Table 1).
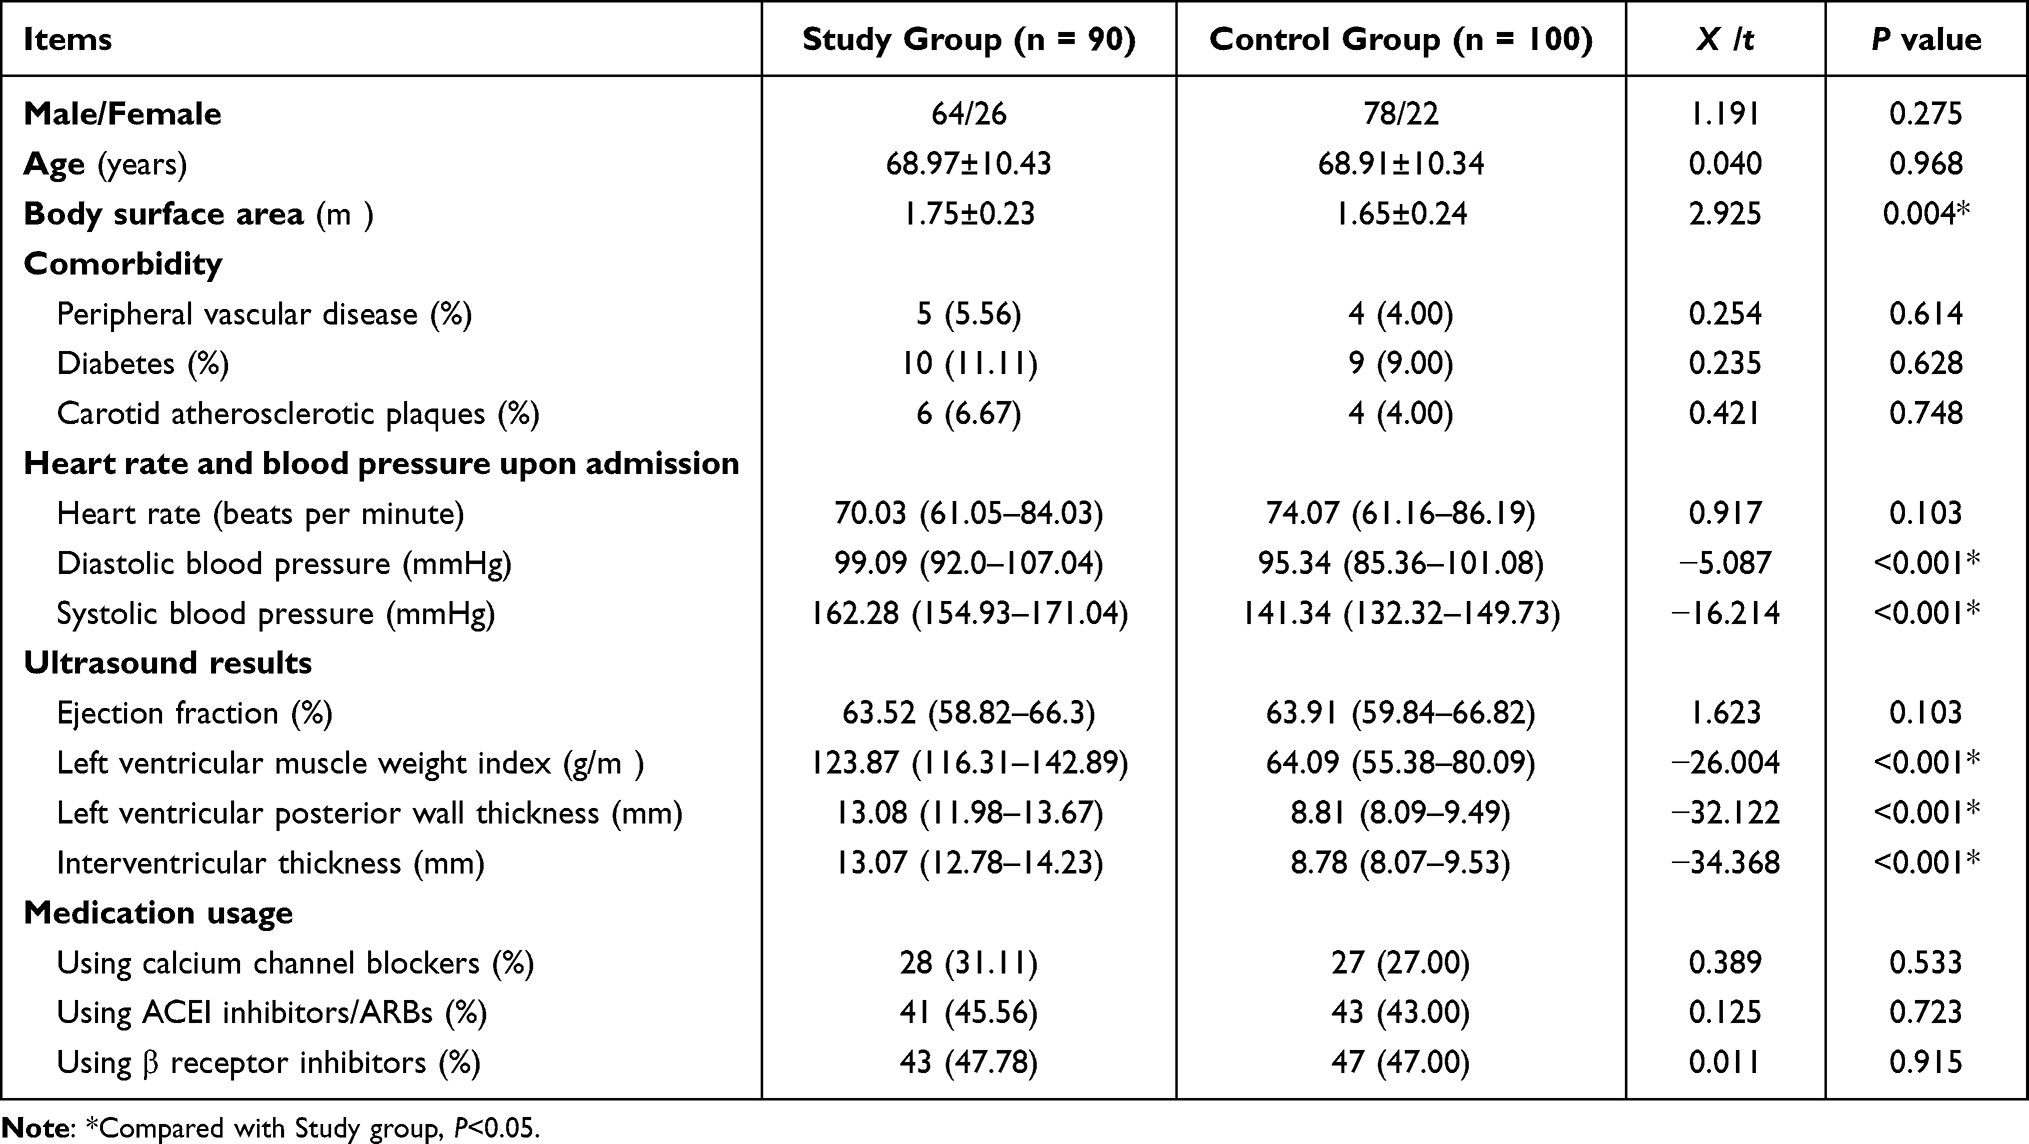 |
Table 1 Demographic Comparisons |
Comparisons of Measured Values of Electrocardiogram Between the Two Groups
The results of SD, SD+Sv4, RavL+Sv3, and Sv1+Rv5 in the Study group [2.03 (1.56–2.57) mV, 3.09 (2.38–3.98) mV, 2.19 (1.46–2.78) mV, and 3.38 (2.67–4.19) mV respectively] were all higher than those in the Control group [0.93 (0.68–1.23) mV, 1.37 (1.32–2.18) mV, 1.03 (0.68–1.46) mV, and 2.28 (1.67–2.67) mV], P<0.001 (see Table 2.)
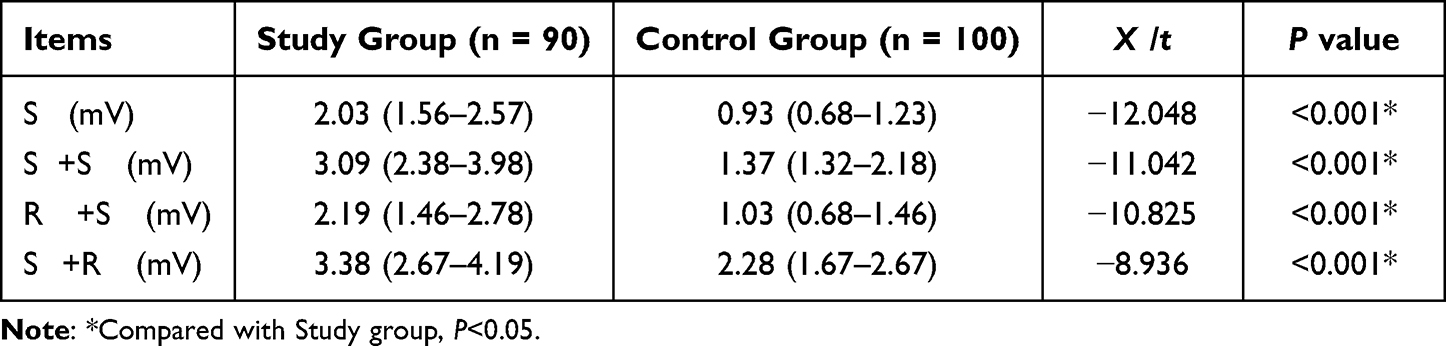 |
Table 2 Comparisons of Measured Values of Electrocardiogram Between the Two Groups |
Diagnostic Value of SD, SD+Sv4, RavL+Sv3, and Sv1+Rv5 in Elderly Patients with Essential Hypertension Complicated with Left Ventricular Hypertrophy
Compared with the ROC curved by SD+Sv4, RavL+Sv3, and Sv1+Rv5, the AUC of the ROC curved by SD was [0.887, 95% CI (0.837–0.927)], and the cut-off value was 1.298 with the Sensitivity = 86.03% and Specificity = 86.59% in diagnosing essential hypertension with LVH. The AUC of the ROC curved by SD+Sv4, RavL+Sv3, and Sv1+Rv5 were [0.859, 95% CI (0.811–0.899)], [0.838, 95% CI (0.789–0.893)], and [0.817, 95% CI (0.768–0.869)] respectively; and the Sensitivity and the Specificity of the ROC curved by SD+Sv4, RavL+Sv3, and Sv1+Rv5 were (cut-off value = 1.823; 85.36% vs 85.52%), (cut-off value = 1.613; 73.62% vs 83.06%), and (cut-off value = 2.693; 72.83% vs 83.04%) respectively (see Figure 2 and Table 3).
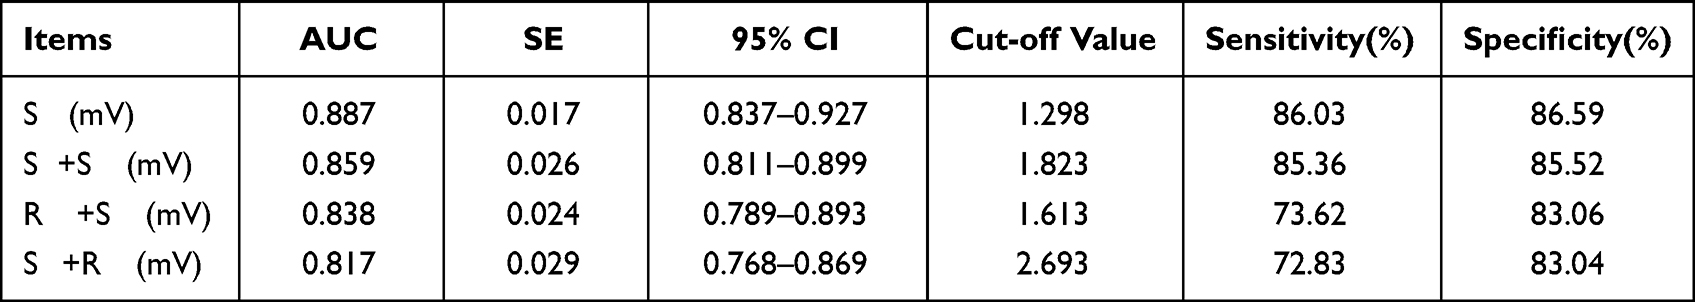 |
Table 3 Diagnostic Value of SD, SD+Sv4, RavL+Sv3, and Sv1+Rv5 in Elderly Patients with Essential Hypertension Complicated with Left Ventricular Hypertrophy |
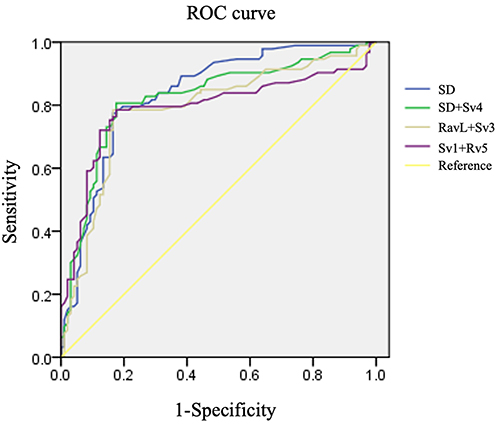 |
Figure 2 ROC curve of the diagnostic value of SD, SD+Sv4, RavL+Sv3, and Sv1+Rv5 in elderly patients with essential hypertension and LVH. |
Diagnostic Value of SD, SD+Sv4, RavL+Sv3, and Sv1+Rv5 in Elderly Male and Female Patients with Essential Hypertension Complicated with Left Ventricular Hypertrophy
In female patients, the AUC of the ROC curved by SD was [0.891, 95% CI (0.841–0.934)], and the cut-off value was 1.304 with the Sensitivity = 89.32% and Specificity = 88.67%, which were all higher than those in male patients [AUC = 0.887, 95% CI (0.828–0.943); cut-off value = 1.288; Sensitivity = 82.12%, and Specificity = 84.22%]. The Sensitivity and Specificity of the ROC curved by SD+Sv4 in female patients were 88.98 and 89.68 respectively, which were higher than those in male patients, and were higher than those ROC curved by RavL+Sv3, and Sv1+Rv5 in male (Sensitivity = 81.79%, and Specificity = 83.26% vs Sensitivity = 81.97%, and Specificity = 83.21%) and female patients (Sensitivity = 83.66%, and Specificity = 85.39% vs Sensitivity = 82.92%, and Specificity = 85.0%1). The AUC of the ROC curved by SD+Sv4, ravl+Sv3, and Sv1+Rv5 in males were [AUC = 0.803, 95% CI (0.794–0.956), AUC = 0.829, 95% CI (1.027–1.683), and AUC = 0.809, 95% CI (0.739–0.869)] and in females were [AUC = 0.791, 95% CI (0.793–0.948), AUC = 0.838, 95% CI (1.009–1.693), and AUC = 0.809, 95% CI (0.757–0.884)] (see Figures 3–4 and Tables 4–5).
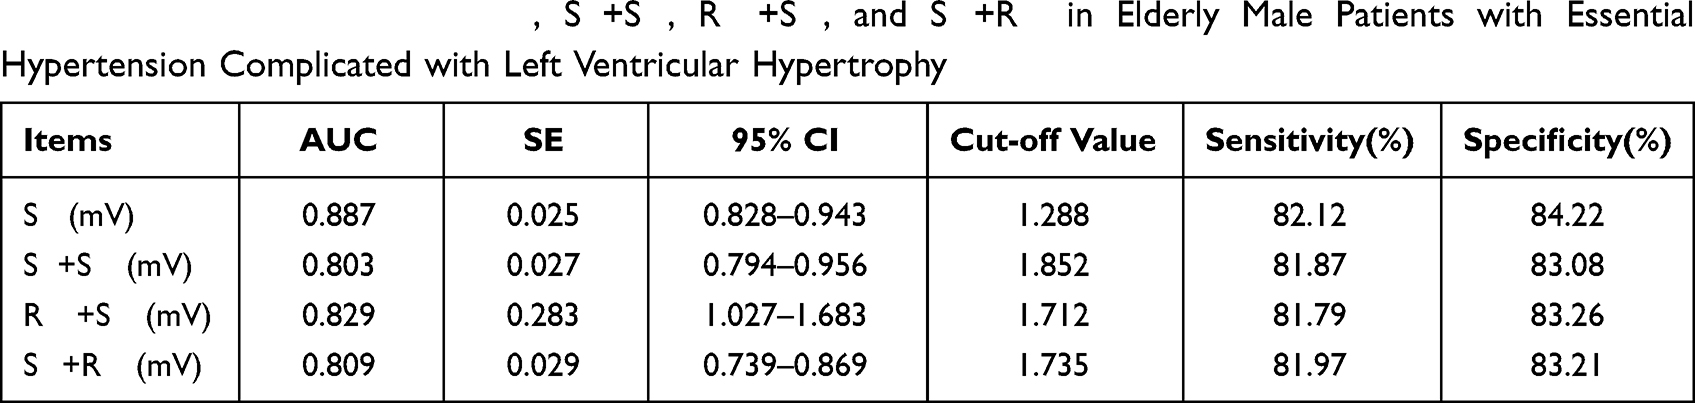 |
Table 4 Diagnostic Value of SD, SD+Sv4, RavL+Sv3, and Sv1+Rv5 in Elderly Male Patients with Essential Hypertension Complicated with Left Ventricular Hypertrophy |
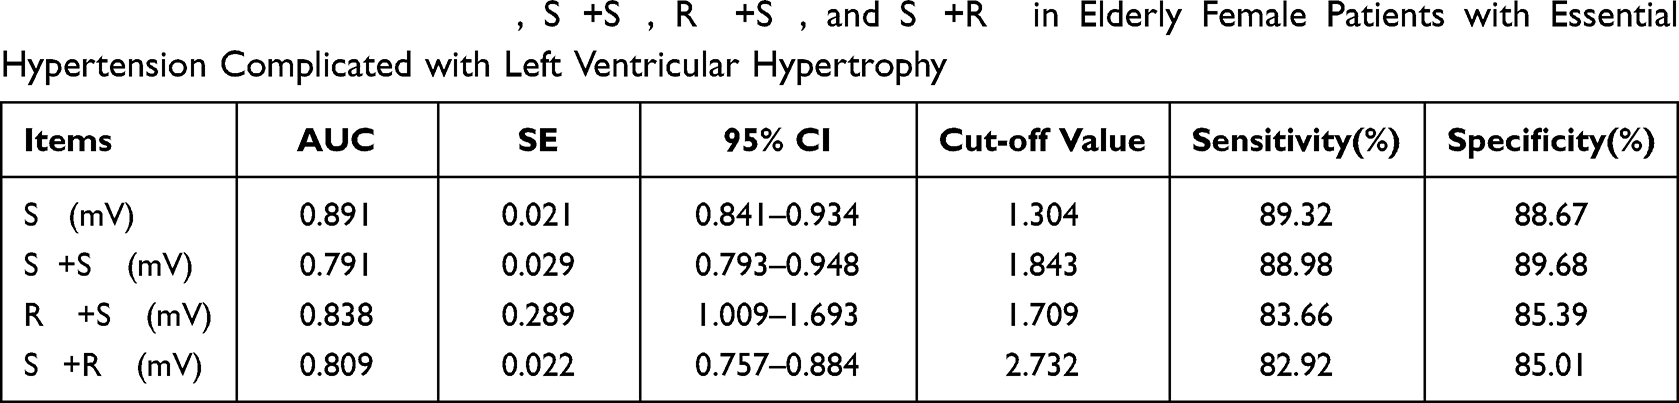 |
Table 5 Diagnostic Value of SD, SD+Sv4, RavL+Sv3, and Sv1+Rv5 in Elderly Female Patients with Essential Hypertension Complicated with Left Ventricular Hypertrophy |
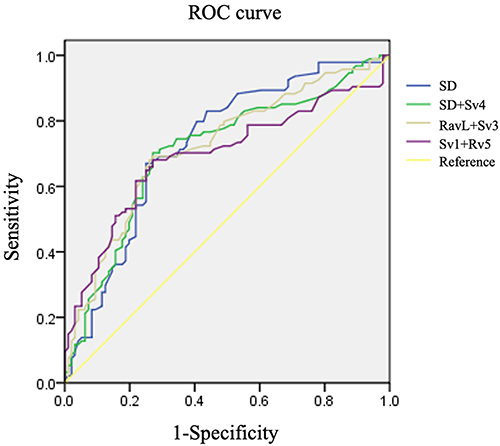 |
Figure 3 ROC curve of the diagnostic value of SD, SD+Sv4, RavL+Sv3, and Sv1+Rv5 in elderly male patients with essential hypertension and LVH. |
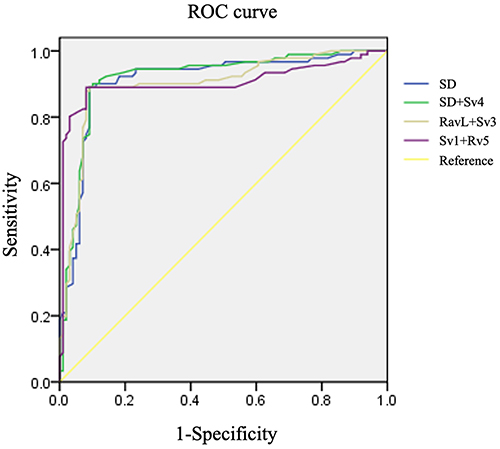 |
Figure 4 ROC curve of the diagnostic value of SD, SD+Sv4, RavL+Sv3, and Sv1+Rv5 in elderly female patients with essential hypertension and LVH. |
Discussion
Hypertension is a chronic disease that requires long-term control. When hypertension develops to a certain level, it will lead to ventricular hypertrophy, and in severe cases, it will further lead to left ventricular failure and even death.11 Therefore, early diagnosis of elderly hypertensive patients with LVH is helpful for early treatment and may be related to a better prognosis outcome. For its simplicity, low price, convenience, and repeatability, electrocardiography is often used as the preferred examination for screening, diagnosing, and evaluating cardiac diseases. LVH is associated with an increase in the left ventricular weight, and the ECG can detect left ventricular hypertrophy by detecting an increase in voltage, which makes the ECG a good basis for assessing changes in left ventricular mass.12 The 2016 Asian Expert Consensus on the Diagnosis and Treatment of Hypertension and Left Ventricular Hypertrophy clearly pointed out that an electrocardiogram is the first choice for screening and diagnosing hypertension and left ventricular hypertrophy.13 The results of this study showed that, compared with the Control group, patients in the Study group had statistically significant differences in body surface area, heart rate, diastolic blood pressure, systolic blood pressure, left ventricular muscle weight index, left ventricular posterior wall thickness, and interventricular thickness, suggesting that the elderly patients with essential hypertension and LVH may have the basis of abnormal ECG results.
A study by Durrer et al14 pointed out that the S wave in the last 50 ms of the QRS wave is generated by the depolarization of the left ventricle cardiomyocytes and the left ventricular free wall, which can better reflect the main depolarization vector of the left ventricle. The location of myocardial hypertrophy varies among individuals and is not limited to the recording range of a certain lead; in addition, the ECG vector generated after depolarization of the hypertrophic myocardium is not necessarily parallel to the direction of the lead, so SD, the amplitude of the deepest S wave, was chosen to fully reflect the change of the left ventricular depolarization vector.8 The results of this study showed that the voltage values of SD, SD+Sv4, RavL+Sv3, and Sv1+Rv5 in the Study group were higher than those in the Control group, indicating that the elderly patients with essential hypertension and LVH had obvious ECG abnormalities, and SD, SD+Sv4, RavL+Sv3, and Sv1+Rv5 had significantly risen.
Research by Xia15 et al pointed out that SD+Sv4 standard is superior to Cornell standard and Sokolow–Lyon standard in diagnosing LVH; Shao16 et al also believed that SD+Sv4 standard can be more effective than Cornell standard and Sokolow–Lyon standard. The results of this study showed that the AUC value, sensitivity and specificity of the ROC curved by SD and SD+Sv4 were all better than those of the ROC curved by RavL+Sv3, and Sv1+Rv5, the Cornell standard and the Sokolow–Lyon standard, suggesting that SD and SD+Sv4 could be used to diagnose elderly patients with essential hypertension and LVH. Excluding the differences of study subjects and ethnics, in the first half of ventricular depolarization, the Q wave and R wave ascending branch represent the depolarization of the interventricular septum, conduction system (His bundle, left and right bundle branches, and Purkinje fibers), and endomyocardial fibers. The polarization process, while the descending part of the R wave and the S wave appears in the second half of the depolarization, represents the depolarization of the left ventricular myocardium and epicardial free wall, which can explain that changes in SD and can reflect mild to moderate left ventricular voltage changes in hypertrophic patients.
Zhang17 et al studied elderly patients over 65 years old in the community, and the results showed there was no gender difference in LVMI in patients with LVH. Félix-Redondo18 et al pointed out that heart size, the thickness of the subcutaneous fat layer, hormone levels, and tissue conductivity may affect the diagnostic efficacy in gender. The results of this study showed that in different genders, the ROC curves drawn by SD and SD+Sv4 can be used for the diagnosis of essential hypertension with LVH; compared with male patients, the AUC, sensitivity, and specificity of the ROC curves drawn by SD and SD+Sv4 in female patients were higher, suggesting that SD and SD+Sv4 have a better diagnostic value in female patients for essential hypertension with LVH. Studies by Michel19 et al pointed out that the adaptation of the heart to pressure overload resulted in the remodeling of the myocardium in an earlier stage for the changes of hormones. Sun Rong20 and other studies thought estrogen can prevent the deposition of collagen in myocardial cells, and can inhibit angiotensin-induced collagen synthesis. Therefore, it is speculated that the myocardial interstitial remodeling in the elderly male patients with essential hypertension with LVH may be more severe than that in the female patients of the same age, which leads to the weakening of the cardiac electrical activity of the hypertrophic myocardium on the electrocardiogram, and this, in turn, reduced the diagnostic performance of the ECG.
The research also has the following shortcomings: (1) This study is a single-center, retrospective analysis, and there is a selection bias in the included patients. Therefore, the community population should be further selected for a controlled study in the later stage. (2) There is no cross-validation between the results of cardiac magnetic resonance imaging (MRI) and the results measured by echocardiography.
Conclusion
ECG can effectively diagnose elderly patients with essential hypertension and left ventricular hypertrophy, and the diagnostic value of SD and SD+Sv4 is higher than the current Cornell criteria and Sokolow–Lyon criteria.
Disclosure
The authors report no conflicts of interest in this work.
References
1. Lutz W, Sanderson W, Scherbov S. The coming acceleration of global population ageing. Nature. 2008;451(7179):716–719. doi:10.1038/nature06516
2. Di Palo KE, Barone NJ. Hypertension and heart failure: prevention, targets, and treatment. Heart Fail Clin. 2020;16(1):99–106. doi:10.1016/j.hfc.2019.09.001
3. Al Ghorani H, Götzinger F, Böhm M, et al. Arterial hypertension - Clinical trials update 2021. Nutr Metab Cardiovasc Dis. 2022;32(1):21–31. doi:10.1016/j.numecd.2021.09.007
4. Rubattu S, Gallo G. The natriuretic peptides for hypertension treatment. High Blood Press Cardiovasc Prev. 2022;29(1):15–21. doi:10.1007/s40292-021-00483-5
5. Rossi GP, Bisogni V, Rossitto G, et al. Practice recommendations for diagnosis and treatment of the most common forms of secondary hypertension. High Blood Press Cardiovasc Prev. 2020;27(6):547–560. doi:10.1007/s40292-020-00415-9
6. Lin B-Y, Li P, Wu X-D, et al. The relationship between homocysteine, blood pressure variability, and left ventricular hypertrophy in patients with essential hypertension: an observational study. Adv Ther. 2020;37(1):381–389. doi:10.1007/s12325-019-01154-7
7. Liao T, Liao P, Chen R, et al. Comparison of the effects of a conventional 12-lead ECG with a 24-hour Holter ECG for the diagnosis of pacemaker implantation in patients with arrhythmias. J Imaging Res Med Appl. 2021;5(07):231–232.
8. Peguero JG, Lo Presti S, Perez J, et al. Electrocardiographic criteria for the diagnosis of left ventricular hypertrophy. J Am Coll Cardiol. 2017;69(13):1694–1703.
9. Chinese Society of Neurology, Chinese Stroke Society. Chinese guidelines for diagnosis and treatment of acute ischemic stroke 2018. Chin J Neurol. 2018;51(9):666–682.
10. Barbieri A, Bursi F, Mantovani F, et al. Left ventricular hypertrophy reclassification and death: application of the recommendation of the American Society of Echocardiography/European Association of Echocardiography. Eur Heart J Cardiovasc Imaging. 2012;13(1):109–117. doi:10.1093/ejechocard/jer176
11. Jiao Z, Wei H, Li J, et al. Quantitative analysis and differentiation of MR images between hypertrophic cardiomyopathy and hypertensive left ventricular hypertrophy with U-Net neural network. Chin J Magn Reson Imaging. 2020;11(9):741–746.
12. Madias JE. Apparent electrocardiogram left ventricular hypertrophy during tachycardia. J Electrocardiol. 2021;65:3–7. doi:10.1016/j.jelectrocard.2021.01.001
13. Duncan JR, Macdonald EJ, Dorsett KM, et al. Does left ventricular hypertrophy by electrocardiogram predict adverse outcomes in pregnancies with chronic hypertension. J Matern Fetal Neonatal Med. 2020;33(10):1638–1642. doi:10.1080/14767058.2018.1524457
14. Durrer D, Van Dam RT, Freud GE, et al. Total excitation of the isolated human heart. Circulation. 1970;41(6):899–912. doi:10.1161/01.CIR.41.6.899
15. Xia Y, Li X, Zhang H, et al. Diagnostic capability and influence factors for a new electrocardiogram criterion in the diagnosis of left ventricular hypertrophy in a Chinese population. Cardiology. 2020;145(5):294–302. doi:10.1159/000505421
16. Shao Q, Meng L, Tse G, et al. Newly proposed electrocardiographic criteria for the diagnosis of left ventricular hypertrophy in a Chinese population. Ann Noninvasive Electrocardiol. 2019;24(2):e12602. doi:10.1111/anec.12602
17. Zhang W, Zhou Y, Bai B, et al. Consistency of left ventricular hypertrophy diagnosed by electrocardiography and echocardiography: the Northern Shanghai Study. Clin Interv Aging. 2019;14:549–556. doi:10.2147/CIA.S180723
18. Félix-Redondo FJ, Fernández-Bergés D, Calderón A, et al. Prevalence of left-ventricular hypertrophy by multiple electrocardiographic criteria in general population: hermex study. J Hypertens. 2012;30(7):1460–1467. doi:10.1097/HJH.0b013e3283546719
19. Michel FS, Magubane M, Mokotedi L, et al. Sex-specific effects of adrenergic-induced left ventricular remodeling in spontaneously hypertensive rats. J Cardiac Fail. 2017;23(2):161–168. doi:10.1016/j.cardfail.2016.09.017
20. Sun R, Yi D, Tan S. Effects of sexual hormones on the tissue structure of the heart in rats underwent ovarian resection with spontaneous hypertensive. Shandong Medl J. 2016;56(17):31–33.
 © 2022 The Author(s). This work is published and licensed by Dove Medical Press Limited. The full terms of this license are available at https://www.dovepress.com/terms.php and incorporate the Creative Commons Attribution - Non Commercial (unported, v3.0) License.
By accessing the work you hereby accept the Terms. Non-commercial uses of the work are permitted without any further permission from Dove Medical Press Limited, provided the work is properly attributed. For permission for commercial use of this work, please see paragraphs 4.2 and 5 of our Terms.
© 2022 The Author(s). This work is published and licensed by Dove Medical Press Limited. The full terms of this license are available at https://www.dovepress.com/terms.php and incorporate the Creative Commons Attribution - Non Commercial (unported, v3.0) License.
By accessing the work you hereby accept the Terms. Non-commercial uses of the work are permitted without any further permission from Dove Medical Press Limited, provided the work is properly attributed. For permission for commercial use of this work, please see paragraphs 4.2 and 5 of our Terms.