")
Back to Journals » International Journal of General Medicine » Volume 15
The Diagnostic Value of Hepatic and Renal Biochemical Tests for the Detection of Preeclampsia Among Pregnant Women Attending the Antenatal Care Clinic at the University of Gondar Comprehensive Specialized Hospital, Gondar, Northwest Ethiopia
Authors Walle M , Getu F , Gelaw Y , Getaneh Z
Received 16 July 2022
Accepted for publication 4 October 2022
Published 10 October 2022 Volume 2022:15 Pages 7761—7771
DOI https://doi.org/10.2147/IJGM.S382631
Checked for plagiarism Yes
Review by Single anonymous peer review
Peer reviewer comments 2
Editor who approved publication: Dr Scott Fraser
Muluken Walle,1 Fasil Getu,1 Yemataw Gelaw,2 Zegeye Getaneh2
1Department of Medical Laboratory Science, College of Medicine and Health Sciences, Jigjiga University, Jijiga, Ethiopia; 2Department of Hematology and Immunohematology, School of Biomedical and Laboratory Sciences, College of Medicine and Health Sciences, University of Gondar, Gondar, Ethiopia
Correspondence: Muluken Walle, Email [email protected]
Background: Preeclampsia has a deleterious effect on renal and liver function, which results in alterations of various biochemical tests. Therefore, the main aim of this study was to evaluate the role of some hepatic and renal biochemical tests in the diagnosis of preeclampsia.
Methods: A comparative cross-sectional study was carried out on a total of 126 pregnant women after 20th week of gestation who attended at the University of Gondar Comprehensive Specialized Hospital. The participants were divided into two groups as cases and controls. The case group consisted of 63 preeclamptic women, whereas the control group had 63 age and gestational week matched normotensive pregnant women. From each participant, three milliliters of blood was collected, the serum part was separated, and selected biochemical tests were measured using Humastar 800 chemistry analyzer. An independent t-test and receiver operating characteristics were done using SPSS 20 for comparison and diagnostic value determination of different biochemical tests between the study groups.
Results: The maternal serum aminotransferases, total bilirubin, Creatinine, and Urea levels were all significantly elevated in preeclamptic women compared to normotensive pregnant women. The receiver operating characteristics plots revealed that serum aspartate aminotransferase level had area under the curve of 0.89 (95% CI: 0.84– 0.95) and can distinguish preeclampsia patients from normotensive pregnant women at cut-off value of ≥ 58.5 U/l with 74.6% sensitivity, 87.3% specificity, and 80.9% diagnostic accuracy. Serum Creatinine level had area under the curve of 0.91 (95% CI: 0.86– 0.96), which enabled to indicate preeclampsia at a cut-off value ≥ 0.90 mg/dl with 77.8% sensitivity and 85.7% specificity.
Conclusion: An increased serum aminotransferases, total bilirubin, creatinine, and Urea levels in pregnant women could indicate the development of preeclampsia, and needs to be investigated. Among biochemical tests, serum Creatinine level was the best diagnostic marker of preeclampsia, followed by serum aspartate aminotransferase level.
Keywords: hepatic test, renal test, biochemical test, pregnancy, preeclampsia
Introduction
Hepatic biochemical tests are a group of blood tests used to assess liver function, liver damage, and biliary system function.1 In addition, hepatic biochemical tests can be used to evaluate aspects of physiology outside the hepatobiliary system like coagulation and hemolysis.2 Serum liver enzyme levels, hepatic synthetic function tests, and serum bilirubin levels are among the commonly used hepatic biochemical tests performed to assess the health of the liver.3 Elevated serum liver enzymes (often aminotransferase) levels often indicate liver damage, whereas abnormal serum albumin indicates the setting of impaired hepatic synthetic function. On the other hand, serum bilirubin level is mostly used to assess the ability of the liver to detoxify metabolites and transport organic anions into bile.3–5
Renal biochemical tests are a group of tests which can be performed to assess the kidney’s functioning capacity. The most common tests for assessing renal function in clinical practice are used to estimate the kidney’s glomerular filtration rate (GFR) and to screen for proteinuria.6 A compromised renal function with decreased GFR results in an elevation of different renal biochemical parameters.7 The most routinely used biochemical markers to assess renal function are serum creatinine and urea levels.8
Preeclampsia (PE) is a pregnancy-related multisystem medical disorder characterized by new onset hypertension, systolic blood pressure (SBP) of ≥140 mmHg and/or diastolic blood pressure (DBP) of ≥90 mmHg on two occasions, and proteinuria after the 20th gestation week (GW) in a previously normotensive (NT) woman.9 It is one of the leading causes of maternal and newborn morbidity and mortality.10 This disorder affects around 4.6% of all pregnancies worldwide.11 Moreover, its prevalence in Ethiopia ranges from 3.99% to 5.49%.12
The development of PE involves a multifactorial process in which no one element is strictly necessary for its occurrence, and it leads to multiorgan dysfunction.13 A 2-stage model has been developed to address the pathophysiology of PE. First, abnormal placentation due to deficient trophoblastic invasion of the maternal vascular bed decreases maternal blood supply to the placenta and fetus, which ultimately leads to the development of placental ischemia.14 The second stage of PE begins when the placenta releases reactive oxygen species, chemokines, pro-inflammatory cytokines, and anti-angiogenic factors into the maternal circulation in response to growing ischemia, which contributes to endothelial damage and multiorgan dysfunction.15–17
There are numerous pathophysiological abnormalities of PE. Possibly, these changes occur to a large extent and are translated into a full clinical presentation of PE. The pathophysiological changes of PE have a deleterious impact on renal and liver function18 and result in alterations of various biochemical parameters.13 Liver damage associated with PE may array from mild hepatocellular necrosis with serum enzyme aminotransferase abnormalities to ominous hemolysis.19 At least one abnormal liver biochemical test result can be found in around 53% of women with PE.20 The altered liver function due to the pathophysiological process of PE causes an elevation in serum aspartate aminotransferase (AST), alanine aminotransferase (ALT), and bilirubin levels.1 Similarly, studies have shown that glomerular endothelial cell injury, damage to the glomerular basement membrane, and hypoperfusion of the glomeruli are often extensive during PE which results in loss of intrinsic filtration capacity and lowers the GFR.21–23 The altered renal function may cause a change in various renal biochemical parameters like the elevation of serum creatinine and urea levels.13,24
The use of biomarkers to detect PE in early pregnancy could aid in the identification of high- and low-risk pregnancies for monitoring and intervention.25 As a result, there is a continuous demand in searching for biomarkers that can detect PE during early pregnancy,26 however, there is no clinically useful screening test that is considered reliable and cost-effective.27,28 A panel of laboratory testing that includes multiple common hepatic and renal biochemical tests may be useful in diagnosing PE.29 Although numerous studies have indicated altered renal function with elevated blood urea and serum creatinine levels during PE,30 it is unclear if these parameters can be utilized as reliable diagnostic markers for PE development.7 Moreover, there is a lack of a clear clinical cut-off value that can be practically used for the diagnosis of PE.26 Such confusing results have encouraged us to carry out a detailed study on the role of hepatic and renal biochemical tests in the diagnosis of PE. Thus, the main aim of this study was to evaluate hepatic and renal biochemical tests for the diagnosis of PE and to derive a cutoff value for those parameters showing a significant association with the disease.
Methods and Materials
Study Area, Design, and Period
A hospital-based comparative cross-sectional study was carried out from February to May 2021 at Antenatal Care Center (ANC) clinic in University of Gondar Comprehensive Specialized Hospital. The hospital is located in Gondar town, which is 727 kilometers away from Addis Ababa, Ethiopia’s capital.
Eligibility Criteria
The study population were divided into two groups (cases and controls). The case group consisted of pregnant women with PE, based on the American College of Obstetricians and Gynecologists (ACOG) definition as SBP ≥ 140 mm Hg and/or DBP ≥ 90 mm Hg, and proteinuria greater than +1 in semi-quantitative urine dipstick test. On the other hand, the control group included age and GW matched NT pregnant women. In both groups, participants who attended the University of Gondar Comprehensive Specialized Hospital ANC clinic during the study period were recruited. Moreover, participants who volunteered to give their informed consent were included in this study.
Women with a history of hypertension, diabetes mellitus, history of recurrent miscarriages, preterm labor, intrauterine growth restriction, intrauterine fetal death, previous hepatic or renal disease, autoimmune diseases, anemia, tuberculosis, multiple fetuses, idiopathic thrombocytopenic purpura, or any other bleeding diathesis, heart disease, myeloproliferative disorders, immunosuppression or history of illicit drug use were excluded from the study. Moreover, subjects who had evidence of hepatitis B or C virus infection and alcoholics were excluded. Target populations who refused to participate in the study were excluded.
Sample Size Determination and Sampling Technique
Since the PE cases (study population) were small in the study period, the sample size was determined by using a census method.31 Therefore, all PE cases who attended the ANC clinic within the study period and fulfilled the inclusion criteria were recruited by a convenient sampling technique. Moreover, age and GW matched NT pregnant women who attended the hospital for routine obstetric care during the data collection period were recruited as a control group by considering a one-to-one ratio between cases (PE pregnant women) and controls (NT pregnant women).
Data Collection
Clinical, Anthropometric, and Obstetric Data Collection
After informed consent was obtained from each study participant, complete clinical and obstetrics data, including age, anthropometric data, BP, parity, gravidity, and GW, were collected using a predesigned data collection format. The height and weight of the participants were measured using Stadiometer (Infiniti Med Lab Pvt. Ltd., India). The body mass index (BMI) was computed by dividing weight in kilograms by height in meters squared (m2) to screen the body fat ratio.32 The participants’ BP were measured by qualified nurses using an automatic BP monitor (Sinocare Inc, Changsha, China) according to the standard measurement procedure (SOP) recommended by the American Heart Association.33 The mean arterial pressure (MAP) was then calculated using the formula MAP = [(2DBP) + SBP]/3 (48).
Laboratory Sample Collection and Analysis
Three mL of whole blood was drawn into a serum separator tube by venipuncture technique using the syringe method from each participant following SOPs after taking the consent and the questionnaire had been completed during their ANC visit. The collected blood was allowed to clot for sixty minutes and the serum was separated from the cells by centrifugation for five minutes at 2200–2500 RPM. Finally, biochemical measurement was undergone on the separated serum by using Humastar 800 (Human GmbH, Germany) chemistry analyzer. The analyzed biochemical tests for liver function were aspartate aminotransferase (AST), alanine aminotransferase (ALT), total protein, and total bilirubin. On the other hand, serum creatinine and urea levels were done to assess renal function. All samples were collected as soon as the PE diagnosis was confirmed and examined within two hours of collection.
A random urine specimen was collected using a clean dry leak-proof urine cup to determine using a urinalysis reagent strip (Vaxpert Inc., Miami, FI, USA). The chemical strip shows a color change if certain proteins are present in the urine after 1 min of immersing and removing the strip from a cup of urine. Then, the color changes are graded as +1, +2, and +3 by comparing the reagent area to the corresponding color blocks on the canister label at the specified times by holding the strip close to the color blocks.
Data Analysis and Interpretation
The data were first input into Epi-data version 4.6 software and then exported to SPSS 20 (SPSS Inc., Chicago, IL, USA) for analysis. The data normality of the distribution was confirmed using the Kolmogorov Smirnov test. An independent t-test was used for the comparison of data between the two groups, and the results were expressed as mean ± standard deviation (SD). The receiver operating characteristics (ROC) curve analysis was used to describe the relationship between the true positive rate (sensitivity) and the false-positive rate for different values of biochemical tests that showed significant differences between PE and NT groups. Youden’s index was calculated as “sensitivity+specificity-1” to establish the best combinations of sensitivity and specificity for determining the optimal cut-off values of biochemical tests that might be utilized as a diagnostic point of PE development. Moreover, the area under the curve (AUC) was utilized to provide a summary of the tests’ diagnostic accuracy and identify the best parameter for PE detection. A 2-tailed P-value < 0.05 was considered statistically significant.
Data Quality Assurance
Before the actual data collection, the questionnaire was pre-tested and training was given to the data collectors. Close supervision of data collectors and review of the collected data for completeness and consistency were performed by the investigators of the study. Anthropometric and BP measures were performed twice, with the average being used. All the sample collection procedures were carried out following SOPs. The quality of the collected blood samples was checked for hemolysis, lipaemia, correct volume, etc. on the regular basis. The performance of the instrument for biochemical tests was monitored by using normal and pathologic controls. Moreover, the manufacturer’s instructions and SOP were strictly followed at each step of the laboratory analysis. The results were properly documented, transcribed, and reviewed. Data were entered using a double-entry method to trace data entry errors.
Results
A total of 126 pregnant women (63PEand 63 NT) were included in the study. The mean age of the study participants was 27.8 ± 4.68 years old (28.1 ± 4.61 years old for PE and 27.5 ± 4.77 years old for NT). Additionally, the mean GW of pregnancy of the included participants was 33.9 ± 4.6 (33.8 ± 4.8 weeks for PE and 34.1 ± 4.4 weeks for NT groups). There were no significant variations in age, GW, gravidity, and parity between the NT and PE groups. However, SBP and DBP of PE patients were significantly higher compared to the NT pregnant women with a mean ±SD value of 145.4 ± 8.6 and 94.5 ± 6.1 in the PE patients, and 103.7 ± 10.2 and 69.5 ± 7.5 in the NT group, respectively. On the other hand, BMI was significantly lower in PE than in NT pregnant women [21.8 ± 2.1 vs 22.9 ± 2.7] (p < 0.05) (Table 1).
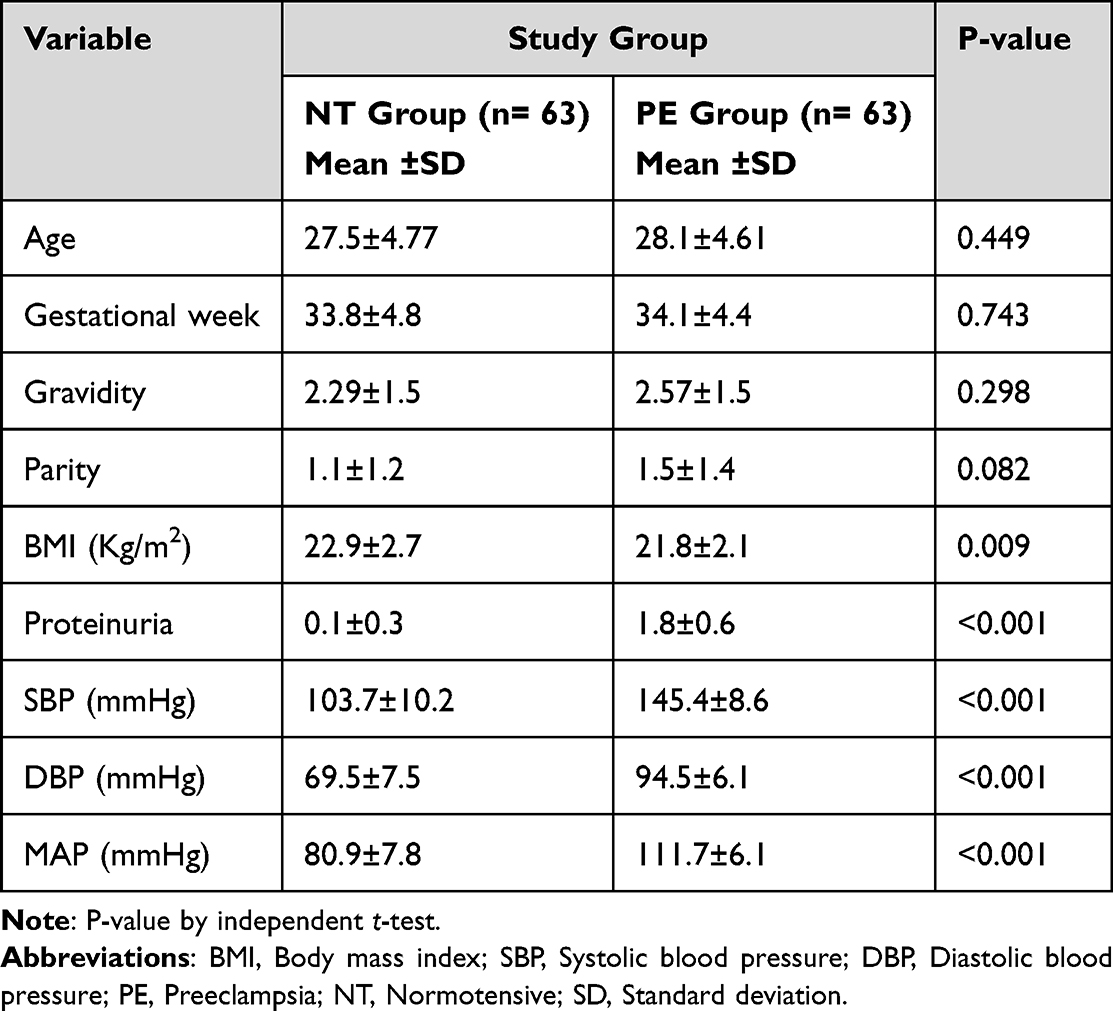 |
Table 1 Comparison of Clinical and Obstetric Characteristics of Study Participants Between PE and NT Pregnant Women (n = 126) |
Comparison of Serum Biochemical Tests Among Study Groups
We found that among biochemical measurements which were used to assess liver function, the levels of serum transaminases (AST and ALT) were significantly higher in the PE group compared to the NT group. The mean ±SD value of ALT in cases was 52.51 ± 16.86 U/L while in the controls it was 38.44 ± 9.24 (P<0.001). The mean ±SD values of serum AST in the cases was 79.41 ± 25.54 U/L and in the controls, it was 46.84 ± 12.05 U/L (P<0.001). We also found that the level of serum total bilirubin was significantly higher in the PE group compared to the NT group [1.15 ± 0.40 mg/dl vs 0.87 ± 0.14 mg/dl]. On the other hand, serum albumin and total protein levels were lower in the PE group compared to the NT group with a mean ±SD value of 3.06±0.49 g/dl and 5.51 ± 1.23 g/dl in the PE group, and 3.17 ± 0.49 g/dl and 5.89 ± 1.44 g/dl in the NT group, respectively, but the change were not statistically significant (P > 0.05) (Table 2).
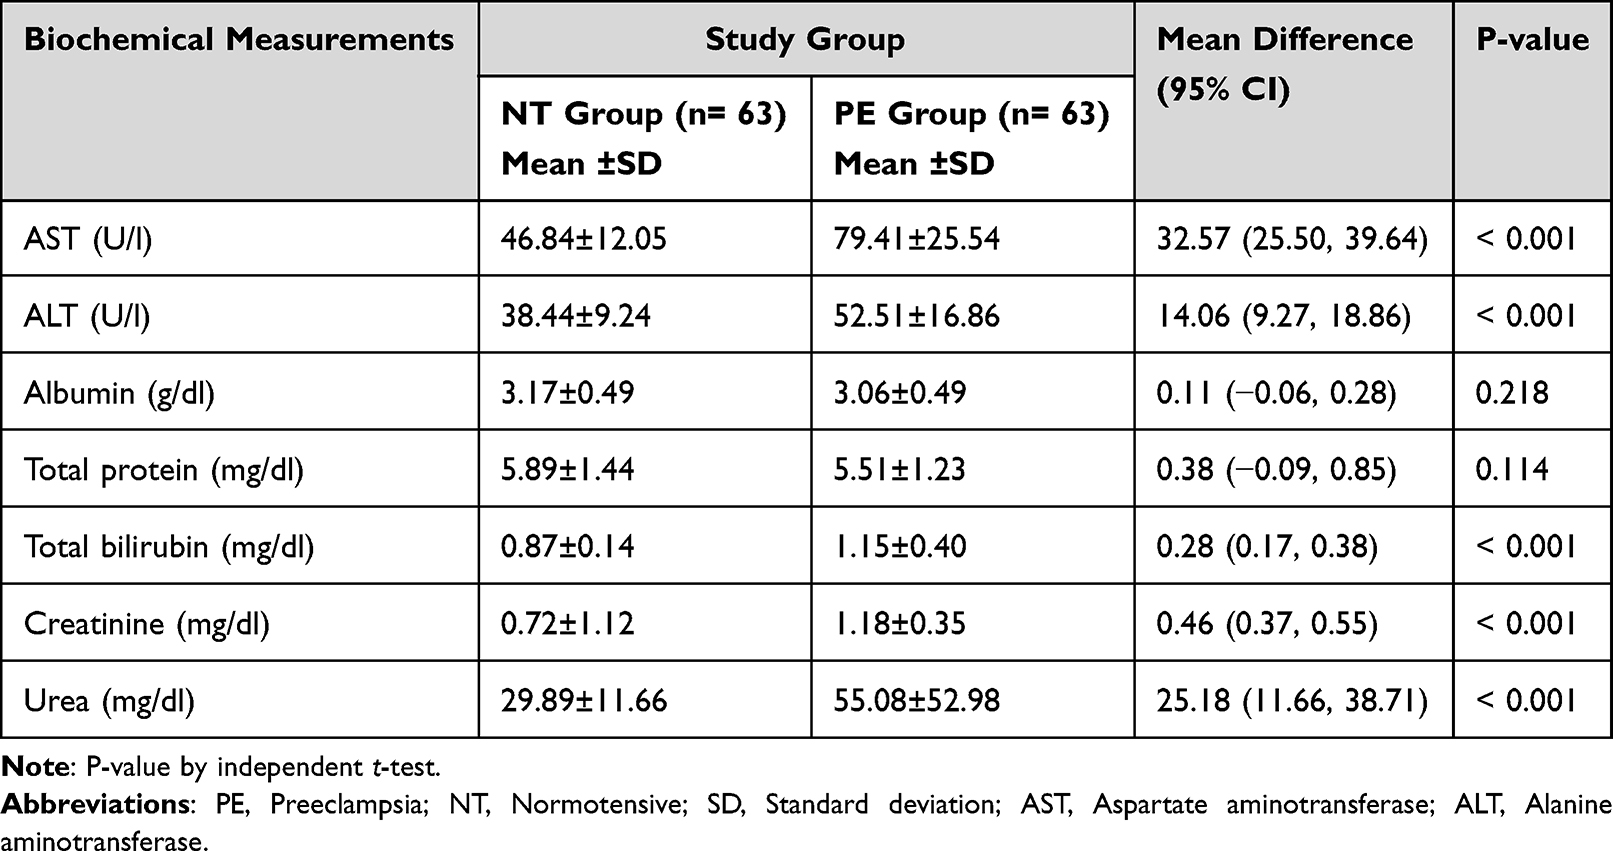 |
Table 2 Comparisons of Serum Biochemical Measurements Between Preeclamptic and Healthy Pregnant Women Attending the University of Gondar Comprehensive Specialized Hospital ANC Unit, 2021 (n = 126) |
Moreover, the values of renal biochemical parameters like Creatinine and Urea tests showed a significant difference between PE and NT groups. The mean ±SD values of serum Creatinine levels were 0.72 ± 1.12 mg/dl and 1.18 ± 0.35 mg/dl in the NT group and PE group, respectively. The mean ±SD value of serum urea level in the PE group was 55.08 ± 52.98 mg/dl and in the controls, it was 29.89 ± 11.66 mg/dl (P < 0.001) (Table 2).
Diagnostic Values of Hepatic and Renal Biochemical Tests for the Diagnosis of Preeclampsia
For those biochemical tests that showed significant differences between PE and NT groups, ROC curve analysis was performed to determine AUC, sensitivity, and specificity for the diagnosis of PE. The result showed that from biochemical measurements, which were used to assess liver function, AST had the largest AUC [0.891: 95% CI; 0.837–0.945] and had a superior diagnostic accuracy [80.9%] for PE diagnosis compared to that of serum ALT or serum total bilirubin level (Figure 1). It can distinguish PE patients from NT pregnant women at a cut-off value of ≥58.50 U/l with a sensitivity of 74.6%, specificity of 87.3%, and test accuracy of 77.8%. At this cut-off point, the positive predictive value (PPV) and negative predictive value (NPV) were 85.5% and 77.5%, respectively. The result also demonstrated that ALT had the second-largest AUC [0.782: (0.703–0.860) and that the diagnostic accuracy of serum ALT level was better than that of serum total bilirubin level. Serum ALT level can differentiate PE patients from NT pregnant women at a cut-off value of ≥45.50 U/l with sensitivity, specificity, and test accuracy of 61.9%, 81.0%, and 71.4%, respectively. Moreover, total bilirubin is indicated as a marker for the diagnosis of PE with a sensitivity of 42.9%, specificity of 93.7%, and test accuracy of 68.3% at cut-off values of ≥1.14 mg/dl (Table 3).
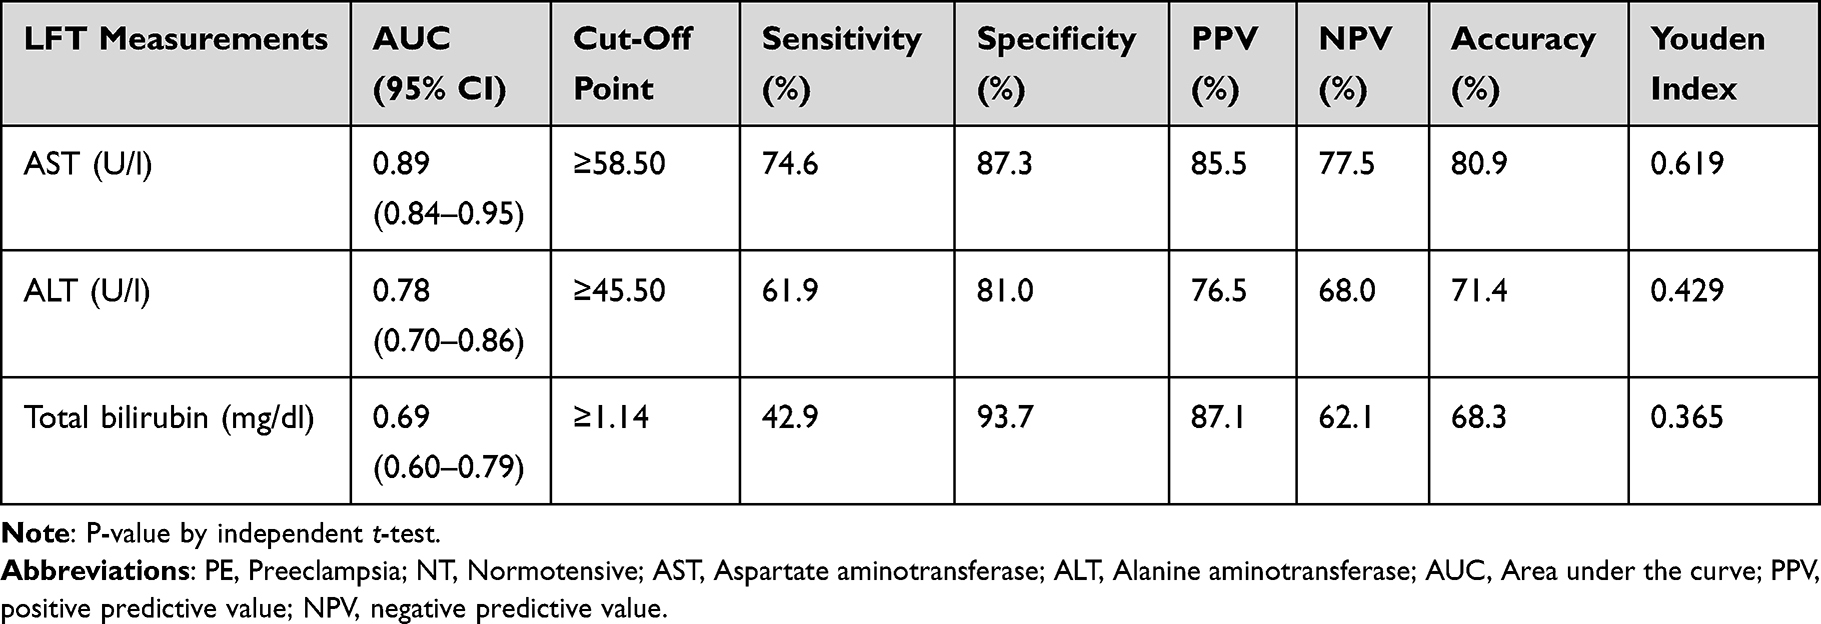 |
Table 3 The Diagnostic Values of Hepatic Biochemical Tests for the Diagnosis of PE Among Pregnant Women Attending at the University of Gondar Comprehensive Specialized Hospital ANC Unit from February to May 2021 (n = 126) |
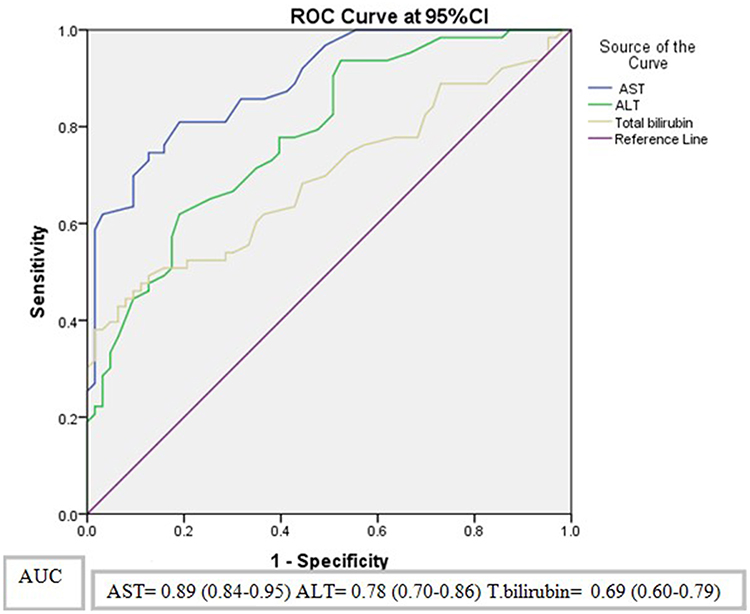 |
Figure 1 ROC curve analysis of hepatic biochemical tests in PE patients and NT pregnant women attending ANC clinic at University of Gondar Comprehensive Specialized Hospital from February to May 2021 (n=126). |
The ROC plots demonstrated that serum Creatinine level had AUC of 0.91(95% CI: 0.86–0.96) and can differentiate PE patients from NT pregnant women at a cut-off value of ≥0.90 mg/dl with a sensitivity of 77.8% and specificity of 85.7%. At this cut-off point, it has a test accuracy of 81.7%, and the PPV and NPV were 84.5% and 79.4%, respectively. On the other hand, determination of serum Urea level has a test accuracy of 73.0% a cut-off value of ≥43.15 mg/dl with a sensitivity of 57.1%, specificity of 88.9%, PPV of 83.7%, and NPV of 67.5% to differentiate PE patients from NT pregnant women (Figure 2) (Table 4).
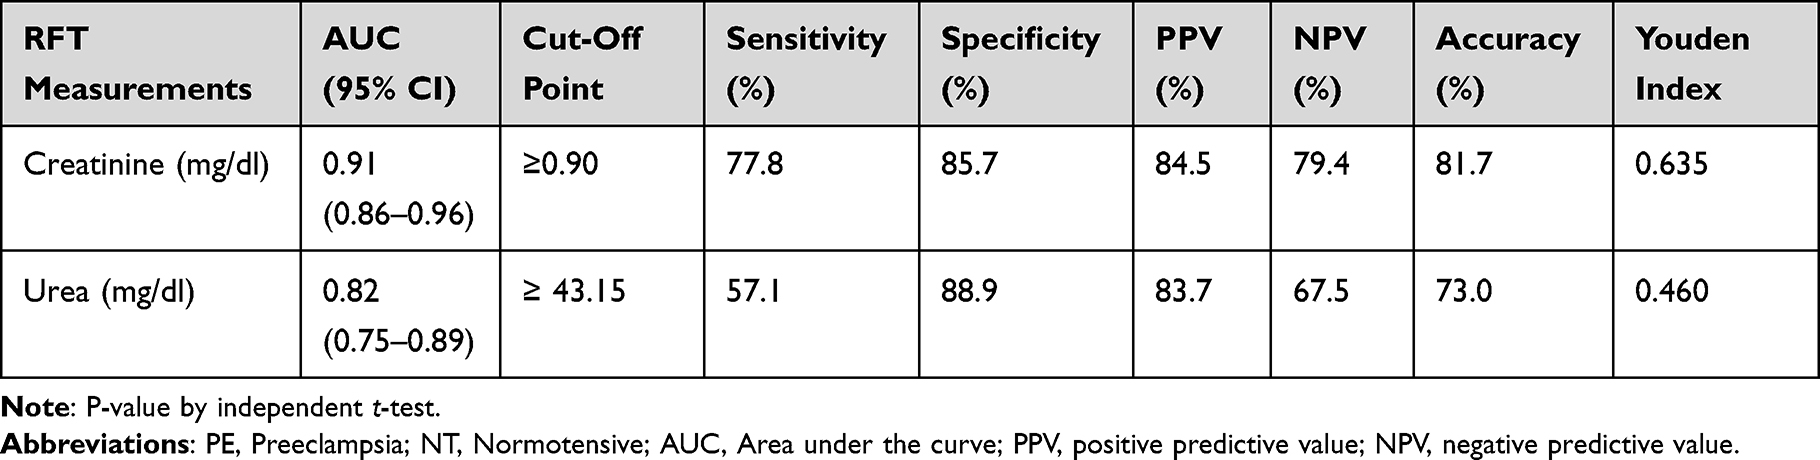 |
Table 4 The Diagnostic Values of Renal Biochemical Tests for the Diagnosis of PE Among Pregnant Women Attending ANC Clinic at the University of Gondar Comprehensive Specialized Hospital from February to May 2021 (n = 126) |
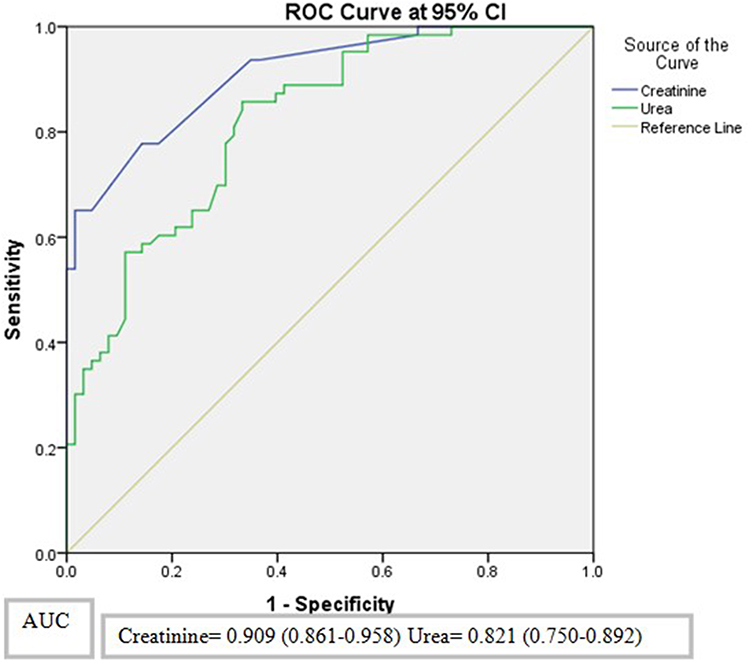 |
Figure 2 ROC curve analysis of renal biochemical tests in PE patients and NT pregnant women attending ANC clinic at University of Gondar Comprehensive Specialized Hospital from February to May 2021 (n=126). |
Discussion
In the current study, we observed that the levels of serum transaminases (ALT and AST) were significantly elevated in women with PE when compared to NT pregnancy. This finding was in line with the previous studies conducted by Dacaj et al,34 Ekun et al,18 Hassanpour et al,35 and Saeed et al,19 as they noted a significant rise of both serum AST and ALT levels in PE group compared to NT group. The elevated transaminase levels in preeclamptic patients could probably be due to the hypoxic effect of PE on their liver since hypoxia results in necrosis with a resultant degeneration of hepatocytes.34 Disruption of the endothelium results in decreased prostacyclin levels and increased thromboxane levels, which decreases the prostacyclin to thromboxane ratio and results in vasoconstriction of hepatic blood vessels. The subsequent effect of hepatic hypoxia leads to necrosis, degeneration of hepatocytes, and release of liver enzymes.36 The ROC curve analysis showed that AST had the largest AUC [0.891: 95% CI; 0.837–0.945] followed by ALT [0.782: 95% CI; 0.703–0.860] from liver parameters. This indicated that AST is the best liver parameter to differentiate PE patients from NT pregnant women at a cutoff value of ≥58.50 U/l with 74.6% sensitivity, 87.3% specificity, and 80.9% test accuracy. Whereas ALT can indicate PE at a cutoff value of ≥45.50 U/l with 61.9% sensitivity, 81.0% specificity, and 71.4% test accuracy.
In the current study, serum total bilirubin level was found significantly increased in the PE group compared to the NT group [1.15 ± 0.40 mg/dl Vs 0.87 ± 0.14 mg/dl] by a mean difference of 0.28 mg/dl [95% CI; 0.17, 0.38]. This result is in agreement with previous studies done by Hassanpour et al,35 Munazza et al,37 and Priyadarshini et al,38 that found a significant increase in serum total bilirubin level in PE patients. This may be due to significant hemolysis during PE.39 On the other hand, a significant difference was not observed in studies conducted by Al-Jameil et al,1 and Saeed et al.19 The reason for the disagreement could probably be a variation in the mean period of GW in the PE group or differences in sample size. The ROC curve analysis also demonstrated that serum total bilirubin level had the smallest AUC [0.695; 95% CI; 0.602–0.788]. Despite having the shortest AUC, serum total bilirubin level can differentiate PE patients from NT pregnant women with 42.9% sensitivity, 93.7% specificity, and 62.1% test accuracy at a cutoff value of ≥1.14 mg/dl. This suggests that serum total bilirubin level could be utilized as a marker for the prediction of PE.
It is known that serum Creatinine level is a marker of GFR and renal dysfunction.24 In the current study, we observed a statistically significant elevation of serum creatinine level in the PE group as compared to the control ones by a mean difference of 0.46 mg/dl [95% CI; 0.37, 0.55]. Similar results were reported in the previous studies done by Ilanchezhian et al,30 Asha et al,7 Ekun et al.18 This may be explained by a reduction in Creatinine excretion from the kidneys which is the cause or effect of an increase in renal vascular resistance, leading to elevated BP and increased serum Creatinine level in PE patients.40
The ROC curve analysis showed that serum Creatinine level had the largest AUC [0.909; 95% CI; 0.861–0.958] among biochemical measurements that were used to assess renal function. Moreover, the diagnostic accuracy of serum Creatinine was superior to Urea. This indicates that serum Creatinine level is the best renal parameter to distinguish preeclamptic patients from NT pregnant women at a cutoff value of ≥0.90 mg/dl with a sensitivity of 77.8%, a specificity of 85.7%, and 81.7% test accuracy. Similarly, a study done by Padma et al, noted that serum Creatinine had a superior diagnostic accuracy for PE.24 Vyakaranam et al,41 also documented that serum Creatinine had 80% sensitivity and 77.4% specificity at a cutoff value of 0.7mg/dl for the indication of PE. The small variation in the cutoff points of serum Creatinine level might be attributed to the differences in the chemistry analyzer. On the other hand, Priyadarshini et al,38 and Ambad et al,42 showed that there was no significant difference in serum Creatinine levels between PE and NT groups. This discrepancy is most likely due to the differences in sample size or variation in the mean period of GW of study groups.
The current study demonstrated that serum Urea levels increased significantly in the PE group compared to the NT group [55.08 ± 52.98 Vs 29.89 ± 11.66] with a mean difference of [95% CI; 11.66, 38.71]. This result is in agreement with previous studies conducted by Ilanchezhian et al,30 Asha et al,7 Ekun et al,18 showed a significant increase in serum Urea levels in PE patients. These changes might be due to an increase in the glomerular filtration resistance in PE by the mechanical effect of swelling in the cytoplasm, along with an alteration in the metabolism, leading to a reduction in renal perfusion and the GFR.40 On contrary, Priyadarshini et al,38 Ambad et al,42 and Charles et al,23 reported insignificant difference in the level of serum Urea between the PE group compared to the NT group and they suggested this parameter has no predictive value in PE. The ROC curve analysis of this study demonstrated that serum Urea level had an AUC of 0.821[95% CI; 0.750–0.892] and can differentiate PE patients from NT pregnant women at a cutoff value of ≥43.15 mg/dl with a sensitivity of 57.1%, a specificity of 88.9%, and 73.0% test accuracy.
Limitations and Future Scope of the Study
The main limitation of this study is that it is a single-center study, which limits the generalizability of the findings, and it was a non-longitudinal study. The exclusion was made by reviewing participants’ medical records for the presence of conditions, which could only rule out pre-existing conditions. Moreover, urinary measurements of Creatinine and Urea were not done. Broad-spectrum, multicenter, and longitudinal type studies with a large sample size are strongly recommended to evaluate the role of serum biochemical measurements in the diagnosis of PE at various GWs of pregnancy.
Conclusion
In the current study, the serum AST, ALT, total bilirubin, creatinine, and urea levels were found significantly increased in PE pregnant women compared to NT pregnant women. These parameters with specified cut-off values are generally available and can be easily used in everyday practice for the diagnosis of PE among pregnant women. Of them, serum AST level among liver parameters and serum Creatinine level among renal parameters were the best diagnostic markers for indicating PE development at a cutoff value of ≥58.50 U/l and ≥0.90 mg/dl, respectively. With the help of these parameters, most cases can be detected early in the pregnancy before they can progress to eclampsia. Measurements of serum total protein and albumin have no predictive value in PE.
Abbreviations
ACOG, American College of Obstetrics and Gynecologists; ALT, Alanine aminotransferase; AST, Aspartate aminotransferase; AUC, Area Under the Curve; BMI, Body Mass Index; BP, Blood Pressure; DBP, Diastolic Blood Pressure; GFR, Glomerular filtration rate; GW, Gestational week; MAP, Mean Arterial Pressure; MPV, Mean Platelet Volume; NPV, Negative Predictive Value; NT, Normotensive; PE, Preeclampsia; PPV, Positive Predictive Value; ROC, Receiver Operating Characteristic; SBP, Systolic Blood Pressure; SD, Standard deviation; SOP, Standard Operating Procedure.
Data Sharing Statement
All relevant datasets supporting the findings are contained within the manuscript.
Ethics Approval and Consent to Participate
This study was conducted based on the Declaration of Helsinki. The study was conducted after being approved by the Ethical Review Committee of the School of Biomedical and Laboratory Sciences with a reference number SBMLS/2750. A permission letter was obtained from the University of Gondar Comprehensive Specialized Hospital. Written informed consent was obtained from each study participant. Moreover, all the data obtained in the study were kept confidential using codes instead of personal identifiers and used only for the study’s purposes.
Acknowledgment
We appreciate the University of Gondar Comprehensive Specialized Hospital for permitting and creating a favorable condition to conduct this study. We would like to thank all the study participants for their volunteer and cooperative participation in the study. Our appreciation further goes to ANC clinic staff and diagnostic laboratory staff for their cooperation throughout the time of data collection.
Author Contributions
All authors made a significant contribution to the work reported, whether that is in the conception, study design, execution, acquisition of data, analysis and interpretation, or in all these areas; took part in drafting, revising or critically reviewing the article; gave final approval of the version to be published; have agreed on the journal to which the article has been submitted; and agree to be accountable for all aspects of the work.
Disclosure
The authors declare that they have no competing interests.
References
1. Al-Jameil N, Tabassum H, Al-Mayouf H, Al-Otay L, Khan FA. Liver function tests as probable markers of preeclampsia-a prospective study conducted in Riyadh. J Clin Anal Med. 2015;6(4):461–464.
2. Boregowda G, Shehata H. Gastrointestinal and liver disease in pregnancy. Best Pract Res Clin Obstet. 2013;27(6):835–853. doi:10.1016/j.bpobgyn.2013.07.006
3. Friedman LS, Chopra S, Travis A. Approach to the Patient with Abnormal Liver Biochemical and Function Tests. Up to Date; 2014.
4. Giannini EG, Testa R, Savarino V. Liver enzyme alteration: a guide for clinicians. Can Med Assoc J. 2005;172(3):367–379. doi:10.1503/cmaj.1040752
5. Lala V, Goyal A, Minter DA. Liver function tests [Internet]. Treasure Island (FL): StatPearls Publishing; 2021. Available from: https://www.ncbi.nlm.nih.gov/books/NBK482489/.
6. Gounden V, Bhatt H, Jialal I. Renal Function Tests [Internet]. Treasure Island (FL): StatPearls Publishing; 2022. Available from: https://www.ncbi.nlm.nih.gov/books/NBK507821.
7. Asha NS, Varghese A. Study of renal parameters in preeclampsia. J Med Sci Clin Res. 2018;6(10):1353–1355.
8. Treacy O, Brown NN, Dimeski G. Biochemical evaluation of kidney disease. Transl Androl Urol. 2019;8(Suppl 2):S214–S23. doi:10.21037/tau.2018.10.02
9. American College of Obstetricians and Gynecologists. Hypertension in pregnancy. Report of the American college of obstetricians and gynecologists’ task force on hypertension in pregnancy. Obstet Gynecol. 2013;122(5):1122–1131. doi:10.1097/01.AOG.0000437382.03963.88
10. World Health Organization. World Health Report, Make Every Mother and Child Count. Geneva: World Health Organization; 2005.
11. Abalos E, Cuesta C, Grosso AL, Chou D, Say L. Global and regional estimates of preeclampsia and eclampsia: a systematic review. Eur J Obstet Gynecol Reprod Biol. 2013;170(1):1–7. doi:10.1016/j.ejogrb.2013.05.005
12. Tesfa E, Nibret E, Gizaw ST, et al. Prevalence and determinants of hypertensive disorders of pregnancy in Ethiopia: a systematic review and meta-analysis. Public Lib Sci One. 2020;15(9):e0239048. doi:10.1371/journal.pone.0239048
13. Sunitha T, Sameera K, Umaramani G. Study of biochemical changes in preeclamptic women. Int J Biol Med Res. 2012;3(3):2025–2028.
14. Doğan K, Guraslan H, Senturk MB, Helvacioglu C, Idil S, Ekin M. Can platelet count and platelet indices predict the risk and the prognosis of preeclampsia? Hypertens Pregnancy. 2015;34(4):434–442. doi:10.3109/10641955.2015.1060244
15. Phipps E, Prasanna D, Brima W, Jim B. Preeclampsia: updates in pathogenesis, definitions, and guidelines. Clin J Am Soc Nephrol. 2016;11(6):1102–1113. doi:10.2215/CJN.12081115
16. Mannaerts D, Heyvaert S, De Cordt C, Macken C, Loos C, Jacquemyn Y. Are neutrophil/lymphocyte ratio (NLR), platelet/lymphocyte ratio (PLR), and/or mean platelet volume (MPV) clinically useful as predictive parameters for preeclampsia? J Matern Fetal Neonatal Med. 2019;32(9):1412–1419. doi:10.1080/14767058.2017.1410701
17. Calvo P, Rodríguez P, Figueroa Q. Update in preeclampsia. Rev Méd Sinergia. 2020;5(01):345.
18. Ekun OA, Olawumi OM, Makwe CC, Ogidi NO. Biochemical assessment of renal and liver function among preeclamptics in lagos metropolis. Int J Rep Med. 2018;2018:1–6. doi:10.1155/2018/1594182
19. Saeed AAM, Abubaker NE. Evaluation of hepatic biomarkers among sudanese pregnant women with preeclampsia in Khartoum state. Int J Curr Res. 2020;12(11):14970–14974.
20. Kozic JR, Benton SJ, Hutcheon JA, Payne BA, Magee LA, von Dadelszen P. Abnormal liver function tests as predictors of adverse maternal outcomes in women with preeclampsia. J Obstet Gynaecol Can. 2011;33(10):995–1004. doi:10.1016/S1701-2163(16)35048-4
21. Karumanchi SA, Maynard SE, Stillman IE, Epstein FH, Sukhatme VP. Preeclampsia: a renal perspective. Kidney Int. 2005;67(6):2101–2113. doi:10.1111/j.1523-1755.2005.00316.x
22. Stillman IE, Karumanchi SA. The glomerular injury of preeclampsia. J Am Soc Nephrol. 2007;18(8):2281–2284. doi:10.1681/ASN.2007020255
23. Charles N, Amarachukwu N, Ekpo E, Cajethan E. Changes in renal function among women with preeclampsia in a tertiary health institution in Nigeria. Int J Womens Health Rep Sci. 2020;8(3):272–275. doi:10.15296/ijwhr.2020.44
24. Padma Y, Aparna V, Kalpana B, Ritika V, Sudhakar P. Renal markers in normal and hypertensive disorders of pregnancy in Indian women: a pilot study. Int J Reprod Contracept Obstet Gynecol. 2013;2(4):514. doi:10.5455/2320-1770.ijrcog20131205
25. Faiz S. Renal biomarkers of preeclampsia. In: Kidney Biomarkers. Elsevier; 2020:289–317.
26. Mei-Dan E, Wiznitzer A, Sergienko R, Hallak M, Sheiner E. Prediction of preeclampsia: liver function tests during the first 20 gestational weeks. J Matern Fetal Neonatal Med. 2013;26(3):250–253. doi:10.3109/14767058.2012.733771
27. Sibai BM. Diagnosis and management of gestational hypertension and preeclampsia. Am J Obst Gynecol. 2003;102(1):181–192.
28. Solomon CG, Seely EW. Preeclampsia—searching for the cause. N Engl J Med. 2004;350(7):641–642. doi:10.1056/NEJMp038241
29. Delić R, Štefanović M. Optimal laboratory panel for predicting preeclampsia. J Matern Fetal Neonatal Med. 2010;23(1):96–102. doi:10.3109/14767050903156643
30. Ilanchezhian T, Priya RS, Suganya S, Rajagopalan B. A study to evaluate the renal function parameters in preclampsia. Int J Pharm Sci Res. 2017;8(1):213.
31. Israel GD. Determining Sample Size. Report No.: Fact Sheet PEOD-6. University of Florida; 1992.
32. CDC. Anthropometry Procedures Manual for National Health and Nutrition Examination Survey. Atlanta: CDC; 2007.
33. Palatini P, Asmar R, O’Brien E, et al. Recommendations for blood pressure measurement in large arms in research and clinical practice: position paper of the European society of hypertension working group on blood pressure monitoring and cardiovascular variability. J Hypertens. 2020;38(7):1244–1250. doi:10.1097/HJH.0000000000002399
34. Dacaj R, Izetbegovic S, Stojkanovic G, Dreshaj S. Elevated liver enzymes in cases of preeclampsia and intrauterine growth restriction. Med Arch. 2016;70(1):44. doi:10.5455/medarh.2016.70.44-47
35. Hassanpour SH, Karami SZ. Evaluation of hepatic biomarkers in pregnant women with preeclampsia. Gynecol Obstet. 2018;8(487):2161–0932.1000487. doi:10.4172/2161-0932.1000487
36. Alese MO, Moodley J, Naicker T. Preeclampsia and HELLP syndrome, the role of the liver. J Matern Fetal Neonatal Med. 2021;34(1):117–123. doi:10.1080/14767058.2019.1572737
37. Munazza B, Raza N, Naureen A, et al. Liver function tests in preeclampsia. J Ayub Med Coll Abbottabad. 2011;23(4):3–5.
38. Priyadarshini G. Assessment of biochemical markers of hepatorenal dysfunction in hypertensive disorders of pregnancy. Int J Sci Res. 2014;4(10):101–107.
39. Chandrasekaran S, Simon R. Hepatic complications in preeclampsia. Clin Obst Gynecol. 2020;63(1):165–174. doi:10.1097/GRF.0000000000000501
40. Lafayette R. The kidney in preeclampsia. Kidney Int. 2005;67(3):1194–1203. doi:10.1111/j.1523-1755.2005.00189.x
41. Vyakaranam S, Bhongir AV, Patlolla D, Chintapally R. Study of serum uric acid and creatinine in hypertensive disorders of pregnancy. Int J Med Sci Public Health. 2015;4(10):1424. doi:10.5455/ijmsph.2015.15042015294
42. Ambad RS, Dhok D. The role of serum urea, creatinine, uric acid in diagnosis of pre-eclampsia and eclampsia. Int J Med Biomed Stud. 2019;3(9):77–80. doi:10.32553/ijmbs.v3i9.537
 © 2022 The Author(s). This work is published and licensed by Dove Medical Press Limited. The full terms of this license are available at https://www.dovepress.com/terms.php and incorporate the Creative Commons Attribution - Non Commercial (unported, v3.0) License.
By accessing the work you hereby accept the Terms. Non-commercial uses of the work are permitted without any further permission from Dove Medical Press Limited, provided the work is properly attributed. For permission for commercial use of this work, please see paragraphs 4.2 and 5 of our Terms.
© 2022 The Author(s). This work is published and licensed by Dove Medical Press Limited. The full terms of this license are available at https://www.dovepress.com/terms.php and incorporate the Creative Commons Attribution - Non Commercial (unported, v3.0) License.
By accessing the work you hereby accept the Terms. Non-commercial uses of the work are permitted without any further permission from Dove Medical Press Limited, provided the work is properly attributed. For permission for commercial use of this work, please see paragraphs 4.2 and 5 of our Terms.