")
Back to Journals » OncoTargets and Therapy » Volume 9
The diagnostic value of 99TcM-2-(2-methyl-5-nitro-1H-imidazol-1-yl) ethyl dihydrogen phosphate hypoxia imaging and its evaluation performance for radiotherapy efficacy in non-small-cell lung cancer
Received 24 March 2016
Accepted for publication 14 June 2016
Published 21 October 2016 Volume 2016:9 Pages 6499—6509
DOI https://doi.org/10.2147/OTT.S109163
Checked for plagiarism Yes
Review by Single anonymous peer review
Peer reviewer comments 4
Editor who approved publication: Professor Min Li
Yongkun Yang, Gaohua Han, Wansong Xu
Department of Oncology, Taizhou People’s Hospital, Taizhou, Jiangsu, People’s Republic of China
Background and aim: This study was designated to assess the diagnostic value of 99TcM-2-(2-methyl-5-nitro-1H-imidazol-1-yl) ethyl dihydrogen phosphate (99TcM-MNLS) hypoxia imaging and its evaluation performance for radiotherapy efficacy in patients with non-small-cell lung cancer (NSCLC).
Patients and methods: A total of 61 patients with NSCLC were selected for this study. All patients were injected with 99TcM-MNLS within 1 week prior to radiotherapy and they were injected with 99TcM-MNLS again 3 months after radiotherapy. Qualitative analysis along with semiquantitative analysis results were obtained from hypoxia imaging. Meanwhile, the effect of radiotherapy on patients with NSCLC was evaluated based on the solid tumor curative effect evaluation standard. Finally, SPSS 19.0 statistical software was implemented for statistical analysis.
Results: There was no significant difference in age or sex between the NSCLC patient group and benign patient group (P>0.05). 99TcM-MNLS was selectively concentrated in tumor tissues with a clear imaging in 24 hours. Results from both qualitative analysis and semiquantitative analysis indicated that the sensitivity and specificity of 99TcM-MNLS hypoxia imaging in diagnosing NSCLC were 93.8% and 84.6% and 72.9% and 100%, respectively. Moreover, the receiver operating characteristic curve provided evidence that 99TcM-MNLS hypoxia imaging was a powerful diagnostic tool in distinguishing malignant lung cancer from benign lesions. As suggested by 24-hour imaging, the tumor-to-normal ratio of patients in the 99TcM-MNLS high-intake group and low-intake group had a decline of 24.7% and 14.4% after radiotherapy, respectively. The decline in the tumor-to-normal ratio between the two dosage groups was significantly different (P<0.05).
Conclusion: 99TcM-MNLS hypoxia imaging had reliable values in both diagnosing NSCLC and evaluating therapeutic effects of radiotherapy on patients with NSCLC.
Keywords: 99TcM-MNLS hypoxia imaging, non-small-cell lung cancer, diagnosis, therapeutic effect evaluation, radiotherapy
Introduction
Primary lung cancer is the second common malignancy across the world, and currently non-small-cell lung cancer (NSCLC) accounts for >80% of lung cancer cases.1 The crude incidence rate of NSCLC is significantly associated with tobacco popularity and consumptions in each region, and it has been reported to range from 2 to 80/100,000 and 1 to 39/100,000 for males and females, respectively.2 There has been an emerging trend that the prevalence of NSCLC is still rising; therefore, more efforts should be made to tackle this disease.3
It has been advocated that early diagnosis of NSCLC is critical to appropriate selection of therapy as well as accurate prediction of prognosis for NSCLC patients. Though surgical resection is widely considered as the most radical treatment for NSCLC,4 more attention has been paid to radiotherapy in alleviating NSCLC as it is appropriate for patients who were unqualified for surgical resection, such as stereotactic ablative radiotherapy.5–7 It has been estimated that ~75% of NSCLC patients could benefit from radiotherapy and postoperative radiotherapy significantly improves the overall survival of NSCLC patients in N2 stages.8 Furthermore, the combination of radiotherapy and chemotherapy not only improves the overall survival status of stage III NSCLC patients but also reduces the recurrence rate.9
Hypoxia is a result of insufficient and malfunctioning blood supply, and tumor hypoxia often contributes to the upregulation of vascular endothelial growth factor, erythropoietin hormone, and glycolytic enzymes that are responsible for radio resistance. Since hypoxic areas often have poor responses to radiotherapy, a higher dosage of radiation targeting hypoxic areas is required to suppress the development of tumor.10 Hypoxia imaging based on specific hypoxic tracers such as 18F-fluoroazomycinarabinoside (FAZA),11 18F-fluoromisonidazole (FMISO),12 99TcM-4,9-diaza-3,3,10,10-tetramethyldodecan 2,11-dione dioxime (99TcM-HL91), and 99TcM-2-(2-methyl-5-nitro-1H-imidazol-1-yl) ethyl dihydrogen phosphate (99TcM-MNLS)13 were utilized by clinicians for tumor hypoxia assessment. FMISO therein is a most popular tracer for detecting hypoxia areas in patients with head and neck cancer, but then its popularity is gradually replaced by FAZA, which is more easily cleared from blood.14 It was also validated that 99TcM-HL91 hypoxia imaging served as a potent tool to evaluate the radiosensitivity of tumors.15 Of note, 99TcM-MNLS emerges as a promising synthesized hypoxia imaging tracer for its advantages in fast clearance in blood. A study using a rat model suggested that uptake of 99mTc-MNLS was high at the early tumor stage (0.68%±0.44% ID/g after 30 minutes), indicating the strength of 99mTc-MNLS in early imaging. Moreover, 99mTc-MNLS possessed higher water solubility than 99TcM-HL91, which was beneficial in reduction of liver background and excretion through kidney.15 However, there is little evidence revealing the value of 99TcM-MNLS in diagnosing and assessing NSCLC.
Thus, the present case–control study was intended to explore whether 99TcM-MNLS hypoxia imaging can be used in diagnosing NSCLC and appraising the therapeutic effects of radiotherapy on patients with NSCLC.
Patients and methods
Clinical characteristics of study subjects
The 48 patients with NSCLC and 13 controls in this study were selected from Taizhou People’s Hospital between September 2013 and September 2015. The patient group consisted of 33 males and 15 females with ages ranging from 30 to 90. The final diagnosis of NSCLC was either confirmed by histopathological biopsy or surgery. All patients were diagnosed with NSCLC for the first time and they have not received any treatment. All participants in this study have signed the written informed consent. Blood routine, routine urine, and serum biochemical index were inspected during the study and there was no serious liver disease or other severe diseases that might affect the distribution, metabolism, and excretion of 99TcM-MNLS. This study was approved by the Ethics Committee of Taizhou People’s Hospital.
The preparation of 99TcM-MNLS
The synthetic route of MNLS is shown in Figure S1. To be specific, 0.5 g metronidazole was dissolved in 5 mL anhydrous acetonitrile. Under magnetic stirring, the mixture was dipped into 5 mL acetonitrile with 4.61 mmol phosphorus oxychloride (POCl3) inside. Subsequently, 2 mL pure water was added, and the mixture was stirred until the solution was evaporated to dryness. Approximately 60 mL mixed liquor of ethanol and diethyl ether (V:V =1:1) was then added to the remainder and then the remainder was recrystallized, leading to the production of MNLS, which was in the form of white solids.
Physiological saline was used to adjust the 99TcM liquid to the level of 7.4 MBq/0.1 mL and then they were added into frozen MNLS to form a mixture with handshaking. After being stored for 10 minutes at room temperature, polyamide, 10% hydrochloric acid solution system and Xinhua No 1, and methanol solution system were adopted for evaluating the radiochemical purity of 99TcM-MNLS, respectively.
99TcM-MNLS hypoxia-imaging method
Imaging method
99mTc-MNLS was present in the form of achromatous and transparent liquid. The radiochemical purity of 99mTc-MNLS could be maintained at 97% after being placed at room temperature for 10 minutes. Furthermore, its radiochemical purity peaked at the fourth hour since injection of 99mTc-MNLS and could be maintained at >90% even 8 hours after 99mTc-MNLS injection. Considering the physical qualities of 99mTc-MNLS, all subjects underwent single photo emission computed tomography 4 hours after injection of 99mTc-MNLS to acquire relatively satisfying images.
In addition, all patients were examined by 99TcM-MNLS hypoxia imaging a week before the commencement of radiotherapy, and 99TcM-MNLS hypoxia imaging was carried out again after radiotherapy has been performed for 3 months. Meanwhile, tumor size was measured by single photo emission computed tomography (model: Millennium VG Hawkeye; manufacturer: GE Healthcare Bio-Sciences Corp., Piscataway, NJ, USA) examination with the following procedures. 1) Imaging: patients with bland diet during the inspection orally take 400 mg potassium chlorate to close the thyroid. After 30 minutes, patients were kept at supine position, and 99TcM-MNLS was intravenously injected into the middle of elbow. Then, static planar imaging after 30 minutes was performed, and chest images after 4 hours and 24 hours were collected. 2) Collection conditions: low-energy collimator with high resolution was used. All parameters were listed as follows: planar imaging, Matrix 256×256; energy peak, 140 keV; width of window, 20%; magnification, 1.0; acquisition time, 200 seconds; tomography, Matrix 128×128. Energy peak, window width, and magnification were set the same as those in planar imaging.
Analysis and standard
All images were simultaneously read by two experienced nuclear medicine doctors. As suggested by visual analysis in the lesion area, cases were considered as positive when the radioactive distribution was higher than the background of lung, otherwise cases were suggested to be negative. Besides that, lesions were located by a radiologist through nuclear medicine image readings.
Semiquantitative analysis was performed by the region of interest technology (ROI). First, the best image was selected from all available images in order to locate the tumor by computed tomography (CT) positioning. ROI of tumor was manually outlined in accordance with tumor boundary, and ROI with the same size in contralateral normal tissues was also outlined. Meanwhile, mean standardized uptake values (mean) of tumor regions were obtained. Hence, the average standardized uptake value of each ROI and the radioactive count ratio of tumor tissues (T) over normal tissues (N) in 4 hours and 24 hours were calculated, respectively.
As suggested by the pathological diagnosis, the receiver operating characteristic (ROC) curve was created based on the analysis results of 99TcM-MNLS and tumor-to-normal (T/N) ratio, respectively, and then the area under the curve was calculated. The ROC analysis of T/N ratio was used to determine the optimal threshold for diagnosing lung cancer.
Three-dimensional conformal radiotherapy
After 99TcM-MNLS hypoxia imaging was performed, radiotherapy was conducted for all NSCLC patients using the three-dimensional (3D) conformal treatment planning system and the 6MVX linear accelerator. Radiotherapy plan: keep patient at supine position with hands crossed at elbow. The area from cricoid cartilage to adrenal gland was scanned by CT simulation positioning machine with a width of 5 mm. Then, scanned images were transported to the 3D treatment planning system through the network. Finally, the tumor area, clinical target area, plans to target area, and organs with important dosage imitation were outlined by a physician.
Immunohistochemistry of HIF-1α within tumor tissues
Slices were collected from fixed tumor cells after immunohistochemistry. Five nonoverlapped views were randomly selected under 400× magnifications, and percentages of positive cells under each view were counted twice. Finally, five views of positive cells were averaged to be the percentage of positive cells of this slice.
Radiotherapy curative effect evaluation standard
As suggested by the WHO solid tumor curative effect evaluation standard and results from CT examination, all the patients were divided into four groups after radiotherapy including complete remission (CR), partial response (PR), no change (NC), and partial development (PD). Furthermore, all the patients were further classified into two groups including the effective (CR + PR) and ineffective group (PD + NC) based on the CT imaging results before and after radiotherapy.
Curative effect evaluation standard
CR: tumor tissues completely disappeared for >4 weeks.
PR: product of the maximum transverse diameter and the maximum vertical diameter (two paths) in tumor lesions was reduced by >50% with no new lesions appeared for >4 weeks.
NC: product of the two paths of tumor lesions I was increased by <50% or 25% without new lesions.
PD: product of the two paths of in tumor lesions was increased by >25% new lesions.
Statistical analysis
Statistical analysis was carried out using 19.0 SPSS statistical software (IBM Corporation, Armonk, NY, USA) in this study. Measurement data were described in the form of mean ± SD and analyzed based on the independent two-sample t-test. Categorical data (counted data) were assessed using the chi-square test. The diagnostic performance of radiotherapy was evaluated by ROC curve analysis and P<0.05 provided evidence for statistical significance.
Results
General clinical information of subjects
All pathological diagnoses of subjects in this study are displayed in Table 1. NSCLC group was composed of a total of 48 cases (33 males and 15 females; mean age =63.6±10.8 years, age range: 30–90 years), including 24 cases of adenocarcinoma and 24 squamous cell carcinoma cases. The benign lesion group consisted of 13 cases (nine males, four females, mean age =65.0±11.4 years, age range: 35–76 years). Besides, eight cases of the benign lesion group were confirmed as pneumonia or inflammatory pseudotumor, four cases were diagnosed as tuberculosis ball, and one case was confirmed as tuberculous granuloma. There was no significant difference in either age or sex between NSCLC and benign lesion group (P<0.05).
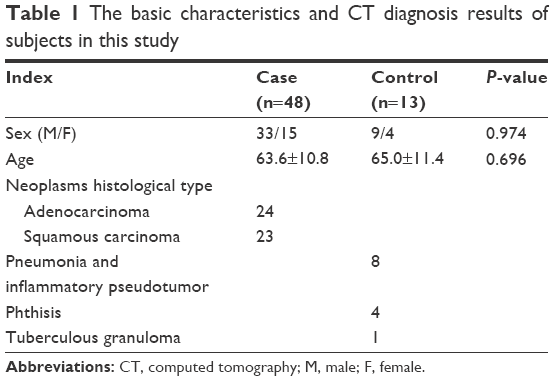 | Table 1 The basic characteristics and CT diagnosis results of subjects in this study |
The distribution of 99TcM-MNLS in human body
No one experienced any discomfort after injections of 99TcM-MNLS and all images of patients were positive. Moreover, 99TcM-MNLS has been found to be selectively concentrated in organs such as nose, mouth, pharynx, liver, kidney, gastrointestinal tract, and especially in tumor tissues. Due to the effective removal of nuclide by normal lung tissue, lesions could be more obvious and the quality of image is optimized in 24 hours after injection.
Association of immunohistochemistry of HIF-1α within NSCLC cells with 99TcM-MNLS hypoxia imaging
With regard to immunohistochemistry of HIF-1α, oxygen-rich tumor cells were featured by pigment-free cytoplasm, large nucleus, obvious heteromorphism, and evident nucleoli, whereas cytoplasms of hypoxic tumors exhibited claybank appearances (Figure 1). HIF-1α expressions of SC were slightly bigger than those of AC after 4 hours of chemotherapy, yet the gap became significant after 24-hour chemotherapy (P<0.05; Table 2). Besides, HIF-1α expressions were positively correlated with T/N ratios with statistical significance (rs=0.429; P=0.003; Figure 2).
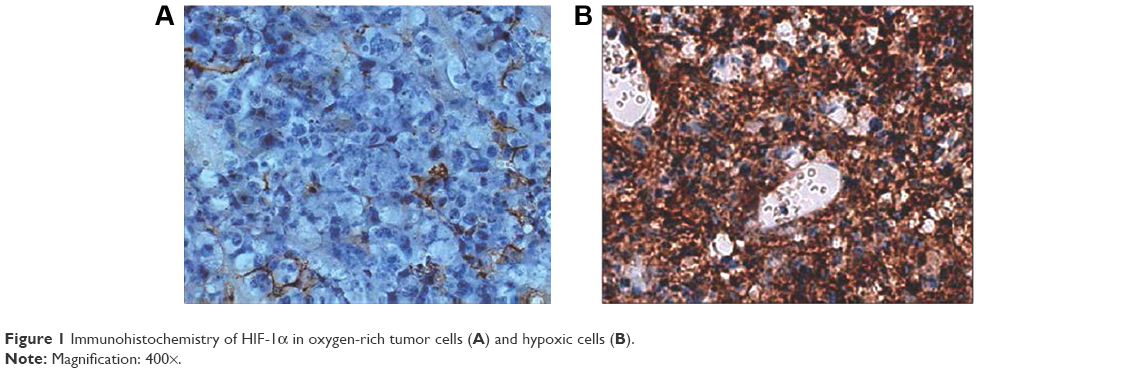 | Figure 1 Immunohistochemistry of HIF-1α in oxygen-rich tumor cells (A) and hypoxic cells (B). |
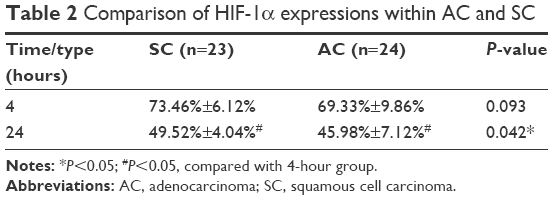 | Table 2 Comparison of HIF-1α expressions within AC and SC |
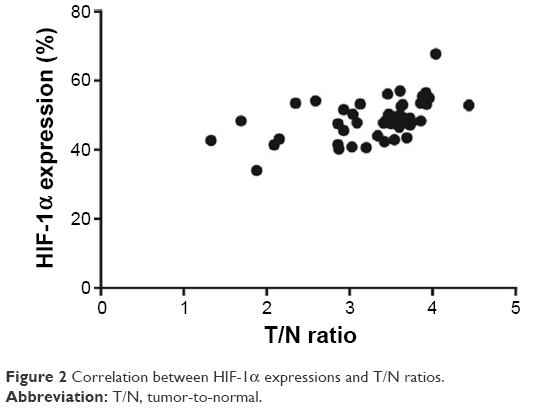 | Figure 2 Correlation between HIF-1α expressions and T/N ratios. |
99TcM-MNLS hypoxia imaging results
As suggested by visual analysis and judgment, 45 of 47 cases in the NSCLC group were diagnosed by 99TcM-MNLS as true positive cases, whereas two were diagnosed by 99TcM-MNLS as false-negative cases. In the benign lesion group, eleven cases were diagnosed as true negative, whereas three of them were confirmed as false positive. The sensitivity, specificity, and accuracy of 99TcM-MNLS hypoxia imaging visual analysis were 93.8%, 84.6%, and 91.8%, respectively. 99TcM-MNLS has been demonstrated to be useful for diagnosing both lung cancer and lung benign lesions (Figures 3–4).
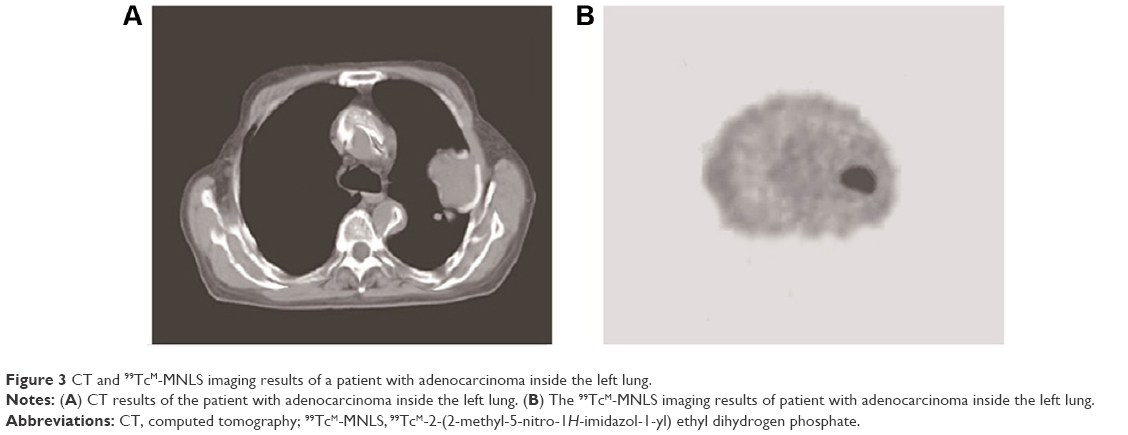 | Figure 3 CT and 99TcM-MNLS imaging results of a patient with adenocarcinoma inside the left lung. |
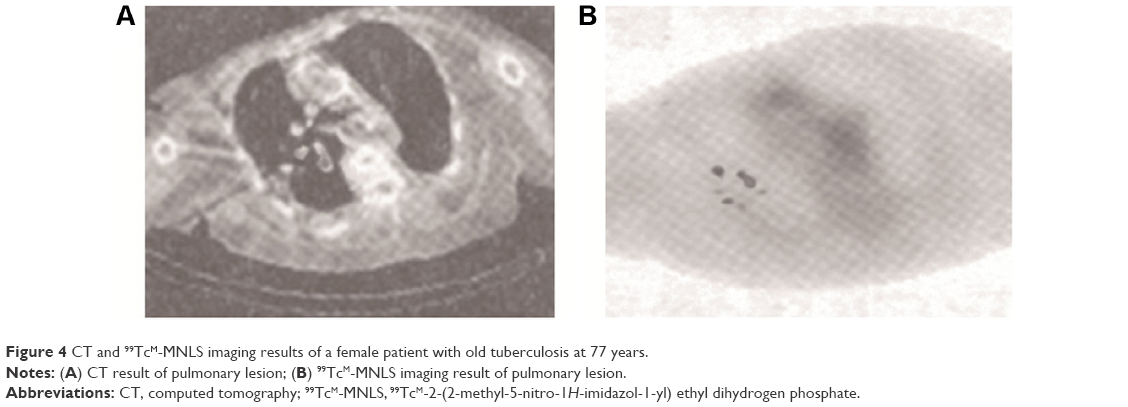 | Figure 4 CT and 99TcM-MNLS imaging results of a female patient with old tuberculosis at 77 years. |
Semiquantitative analysis showed that T/N ratios of the NSCLC group and the benign lesion group were 1.20±0.16 and 0.16±0.19 in 2-hour planar imaging, 1.24±0.20, 0.20±0.28 in 4-hour planar imaging, and 1.52±0.40, 0.40±0.97 in 24-hour planar imaging. The T/N ratio of the NSCLC group was significantly higher than that of the benign lesion group at each different time with P<0.05 (Figure 5).
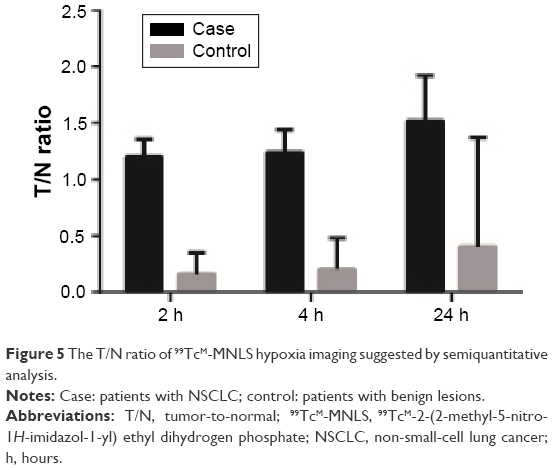 | Figure 5 The T/N ratio of 99TcM-MNLS hypoxia imaging suggested by semiquantitative analysis. |
According to different histological types of lung cancer, there was no statistically significant difference in the 4-hour T/N ratio between carcinoma group (2.338±0.508) and squamous cell carcinomas (2.225±0.499; P>0.05), whereas the 24-hour T/N ratio of squamous cell carcinoma was higher than that of adenocarcinoma with a statistically significant difference (P<0.05; Table 3).
 | Table 3 The T/N ratio of different pathological types of lung cancer |
The diagnostic value of 99TcM-MNLS hypoxia imaging in NSCLC
ROC curve was generated to assess the value of qualitative analysis through 99TcM-MNLS in diagnosing lung cancer (Figure 6). Analysis results showed that the area under the curve of 24-hour 99TcM-MNLS planar imaging visual analysis was 0.892, suggesting that 99TcM-MNLS hypoxia had accurate diagnostic values for NSCLC (P<0.05).
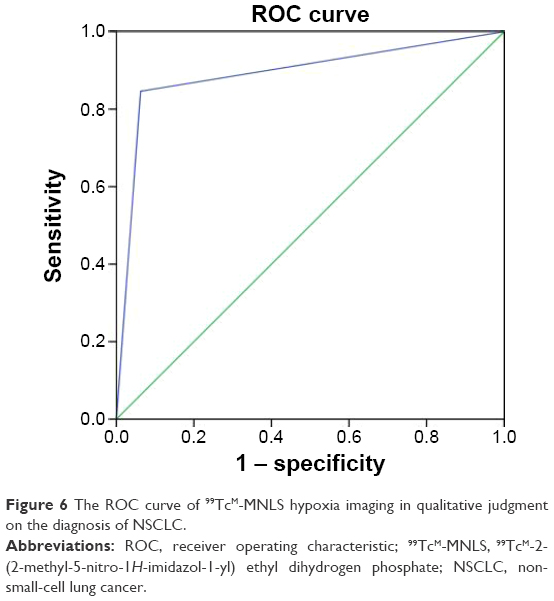 | Figure 6 The ROC curve of 99TcM-MNLS hypoxia imaging in qualitative judgment on the diagnosis of NSCLC. |
As suggested by Figure 7, the area under the curve of 24-hour 99TcM-MNLS planar imaging semiquantitative analysis was 0.875, indicating a desirable application value in distinguishing benign lung lesions from malignant lung lesions. When the T/N ratio is 2.31, the index (sensitivity + specificity − 1) is maximized at 0.729 and then the ability to identify true positive and negative cases is optimized. The sensitivity, specificity, and accuracy of 99TcM-MNLS hypoxia imaging were 72.9%, 100%, and 78.7%, respectively.
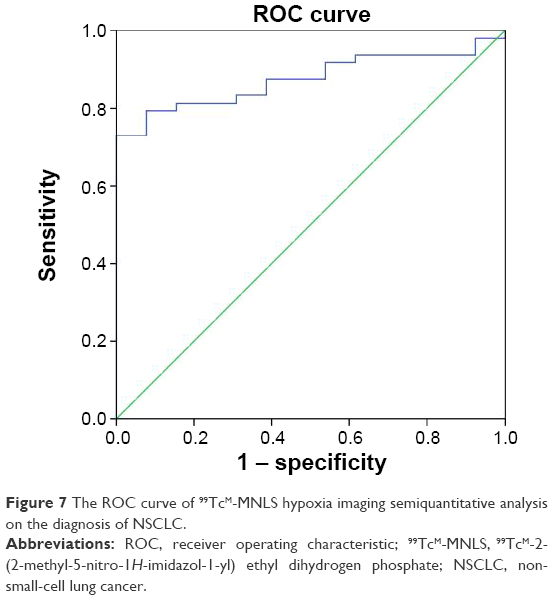 | Figure 7 The ROC curve of 99TcM-MNLS hypoxia imaging semiquantitative analysis on the diagnosis of NSCLC. |
Evaluating the efficacy of radiotherapy on NSCLC using 99TcM-MNLS hypoxia imaging
The lower limit of T/N ratio for patients who were diagnosed as positive cases before radiotherapy was 1.685. Based on this boundary value, 48 patients were divided into the high-intake group (40 cases) and the low-intake group (eight cases). There was significant difference in the radiotherapy efficiency between the high-intake and low-intake group (P<0.05; Table 4).
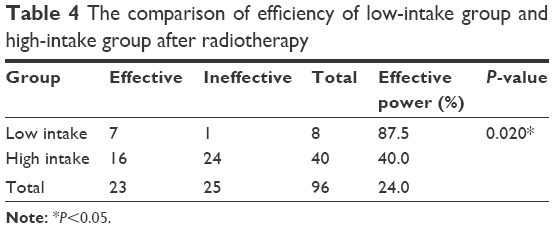 | Table 4 The comparison of efficiency of low-intake group and high-intake group after radiotherapy |
There was a dramatic decline of 24.7% and 14.4% in the 24-hour T/N ratio for the two groups before and after radiotherapy, respectively. Moreover, the decline in the 24-hour T/N ratio between the two groups was statistically significant (P<0.05; Table 5). Typical cases of NSCLC group and benign lesion lung diseases are shown in Figures 8 and 9.
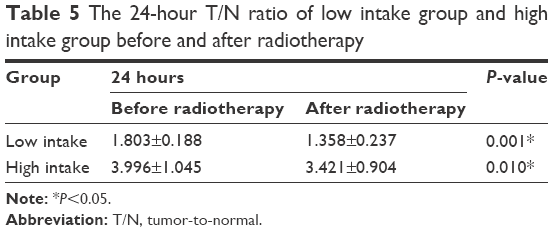 | Table 5 The 24-hour T/N ratio of low intake group and high intake group before and after radiotherapy |
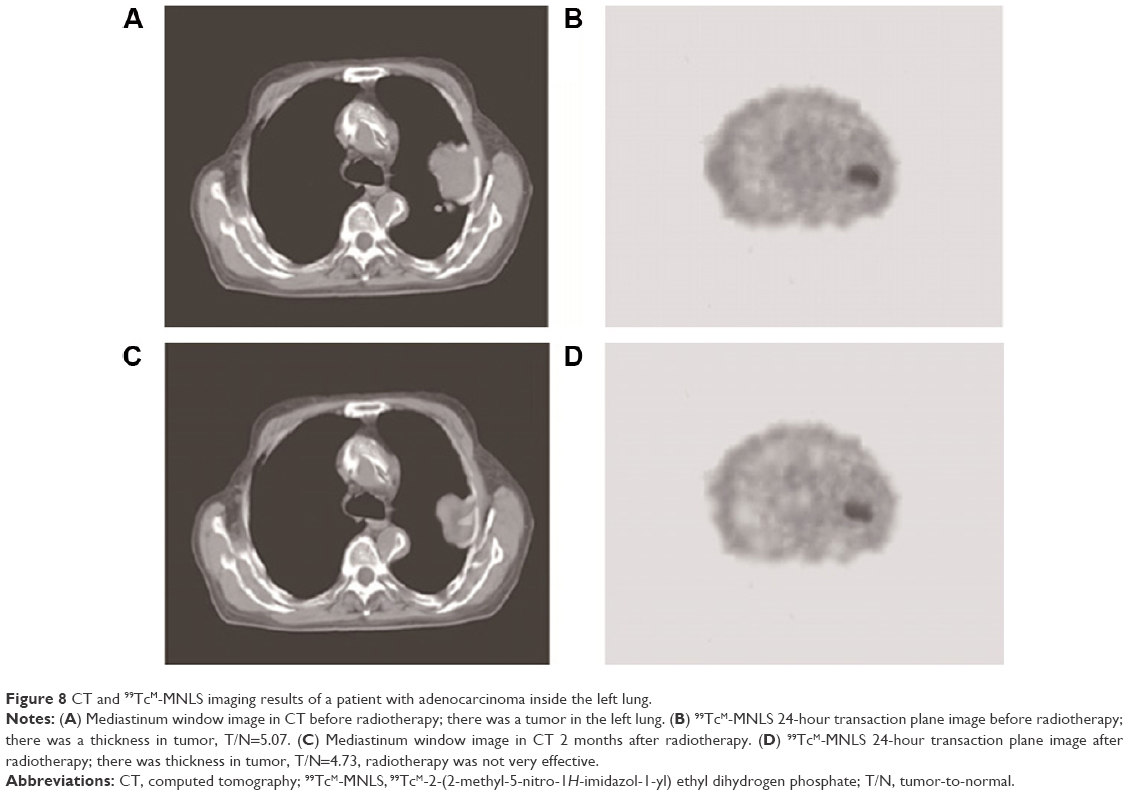 | Figure 8 CT and 99TcM-MNLS imaging results of a patient with adenocarcinoma inside the left lung. |
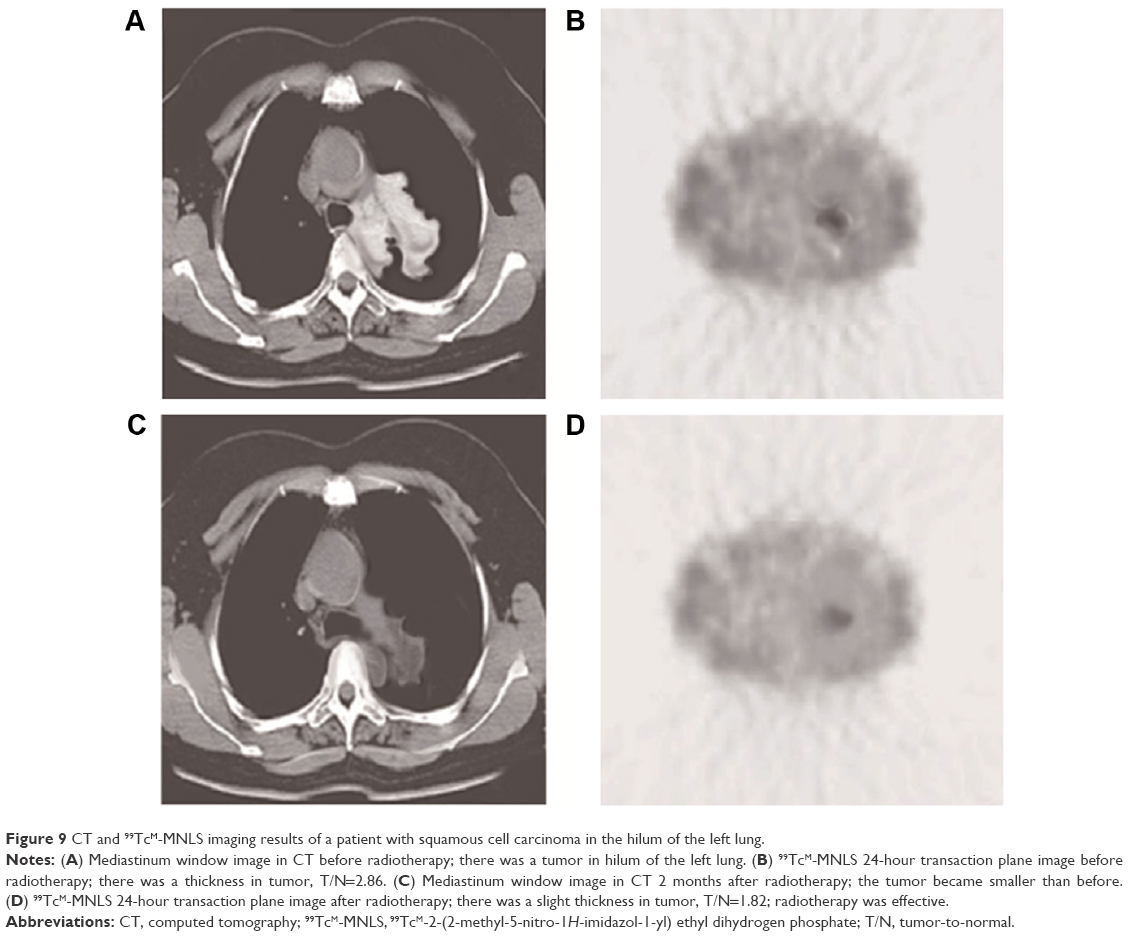 | Figure 9 CT and 99TcM-MNLS imaging results of a patient with squamous cell carcinoma in the hilum of the left lung. |
Discussion
Low oxygen was recognized as one representative phenomenon present in tumor cells (eg, NSCLCs), since sharply increased tumor cells consumed excessive oxygen and they were obliged to migrate to other body parts.16 The establishment of ectopic blood vessels and frequent alterations of blood flow were also two reasons for hypoxia.17 What we should not ignore is that hypoxia could genetically intervene with tumor progression, primarily through unusually regulating genes relevant to angiogenesis, metastasis, etc.18 Under hypoxic circumstances, for instance, elevated expressions of urokinase plasminogen activator receptor and plasminogen activator inhibitor-1 were identified to be independent prognostic elements for metastatic potentials of tumors.19 The underlying mechanism was presumed as proteolysis facilitated by the above tissue factors involved in the plasmin pathway, thereby promoting detachment of tumor cells and cell migration.20,21 Accumulating evidence also suggested that hypoxia would selectively allow cells that possessed antiapoptotic mutations (eg, p53-lof and bcl-2) to survive more, whereas normal cells were subjected to apoptosis and necrosis induced by hypoxia.18
Till date, various diagnostic techniques have emerged to target hypoxic regions of tumor cells, for instance, fluorine-18 fluorodeoxyglucose (18F-FDG) has been widely studied for lung cancer detection, diagnosis, staging, and restaging,22 yet high operation costs and limited equipment availability prevented it from wide usage clinically. Moreover, Deslauriers et al found that 60Cu-ATSM can be readily performed in patients with NSCLC, and tumor oxygenation is a predictor of tumor response to therapy.23
It was also indicated that 99TcM-depreotide scintigraphy is safe and effective for evaluating solitary pulmonary nodules with similar sensitivity and accuracy to 18F-FDG.24 Though tomographic 99TcM-octreotide scintigraphy was suggested to have a lower sensitivity for detecting hilar and mediastinal lymph node metastasis compared with 18F-FDG coincidence, it had an unexpectedly high sensitivity for detecting remote metastatic lesions.25 Additionally, 99TcM-octreotide, 99TcM-pepleomycin, and 99TcM-methoxy-isobutylisonitrile imaging were revealed to provide additional information on identifying NSCLC. 99TcM-HL91 imaging was a valuable diagnostic method for lung cancer regardless of pathologic type and tumor size, and it could be applied to predict and evaluate the 3D-CRT response of NSCLC before and after radiotherapy.
Considering the abovementioned imaging techniques of respective shortcomings, we introduced 99TcM-MNLS imaging and associated it with diagnosis and radiotherapy efficacy of NSCLC in the present study. The reason why 99mTc-MNLS could signal hypoxic tissues within tumor cells can be explained by its physical properties: nitro of 99mTc-MNLS can be reduced to produce anion-free radicals within cells, which can be rapidly oxidized in normal cells and then proliferate outside, but in hypoxic conditions the radicals cannot be oxidized and then they cannot be retained within cells. Nonetheless, it still remained unclear whether 99mTc-MNLS could monitor changes in tumor hypoxia status after radiotherapy.26 Hu et al27 indicated that 99TcM-MNLS and 99TcM-HL91 were similar in detecting hypoxic tumor changes after radiotherapy in mice models and 99TcM-MNLS might be more precise and more efficient than 99TcM-HL91 in detecting abdominal tumor hypoxia. Specifically, NSCLCs exhibited high uptake of 99TcM-MNLS at the early stage, and this uptake can be maintained for up to 2 hours. Besides, the high water-soluble characteristic enabled 99TcM-MNLS imaging to effectively reduce liver background and to accelerate excretion through kidney, under the premise of keeping relatively high tumor uptake. In contrast, 99TcM-HL91 was excreted mainly through liver, kidney, and intestinal tract, which limited fine exhibition of tumor cells in the abdomen when compared with 99TcM-MNLS. Besides, 18F-FMISO exhibited less ideal signal-to-noise ratio than 18F-FAZA and 99TcM-MNLS as the lipophilic feature rendered 18F-FMISO to be cleared primarily via the hepatobiliary tract.28 However, the images of 18F-FMISO were less easily identified than those of 18F-FDG, owing to the lower contrast between hypoxic tumor tissue and normal tissue when 18F-FMISO was applied.29 Interestingly, because of distinct effects imposed by acute and chronic hypoxia on HIF expressions, metabolism and hypoxia were not necessarily simultaneously measurable. As 18F-FDG imaging was reflective of glucose metabolism levels within internal tissues or organs, its capability of discriminating hypoxic from nonhypoxic regions in NSCLC is questioned, and other imaging agents were needed. In this respect, the superiority of 99TcM-MNLS rested on its nitroimidazole, which was sensitive in mirroring hypoxic conditions within cells. Of course, the authentic comparison results should be drawn after conduction of experiment. In conclusion, our data suggested that 99TcM-MNLS hypoxia imaging could diagnose NSCLC with a high specificity and sensitivity. Furthermore, the imaging results provide key information for evaluating the efficacy of radiotherapy applied to NSCLC patients. Nonetheless, there were still some limitations in our study. First, the ROC curve of each phase is not smooth enough due to a small number of cases in this study. Therefore, a large number of clinical cases should be accumulated to provide more accurate diagnostic results. Second, the evaluation of therapeutic effects of radiotherapy should cover a longer follow-up period so that prognostic outcomes could be determined in an accurate manner. In addition, as the NSCLC patients included were not classified based on tumor node metastasis (TNM) grade, studies regarding correlations between 99TcM-MNLS hypoxia imaging and different TNM grades of NSCLCs could not be conducted. Furthermore, this study missed the point of distinguishing NSCLCs from lung metastatic tumors or other malignancies Another shortcoming of the current study is the lack of direct comparisons among tracers of FAZA, FMISO, MNLS, and so on for NSCLC imaging. Hence, further studies are needed to clarify the potential value of 99Tcm-MNLS in clinical practice.
Disclosure
The authors report no conflicts of interest in this work.
References
Jemal A, Bray F, Center MM, Ferlay J, Ward E, Forman D. Global cancer statistics. CA Cancer J Clin. 2011;61(2):69–90. | ||
Peters S, Adjei AA, Gridelli C, et al. Metastatic non-small-cell lung cancer (NSCLC): ESMO clinical practice guidelines for diagnosis, treatment and follow-up. Ann Oncol. 2012;23(suppl 7):vii56–vii64. | ||
Morgensztern D, Ng SH, Gao F, Govindan R. Trends in stage distribution for patients with non-small cell lung cancer: a national cancer database survey. J Thorac Oncol. 2010;5(1):29–33. | ||
Molina JR, Yang P, Cassivi SD, Schild SE, Adjei AA. Non-small cell lung cancer: epidemiology, risk factors, treatment, and survivorship. Mayo Clin Proc. 2008;83(5):584–594. | ||
Delaney G, Barton M, Jacob S, Jalaludin B. A model for decision making for the use of radiotherapy in lung cancer. Lancet Oncol. 2003;4(2):120–128. | ||
Goldstraw P, Ball D, Jett JR, et al. Non-small-cell lung cancer. Lancet. 2011;378(9804):1727–1740. | ||
Vansteenkiste J, De Ruysscher D, Eberhardt WE, et al. Early and locally advanced non-small-cell lung cancer (NSCLC): ESMO clinical practice guidelines for diagnosis, treatment and follow-up. Ann Oncol. 2013;24(suppl 6):vi89–vi98. | ||
Lally BE, Zelterman D, Colasanto JM, Haffty BG, Detterbeck FC, Wilson LD. Postoperative radiotherapy for stage II or III non-small-cell lung cancer using the surveillance, epidemiology, and end results database. J Clin Oncol. 2006;24(19):2998–3006. | ||
NSCLC Meta-Analyses Collaborative Group, Arriagada R, Auperin A, et al. Adjuvant chemotherapy, with or without postoperative radiotherapy, in operable non-small-cell lung cancer: two meta-analyses of individual patient data. Lancet. 2010;375(9722):1267–1277. | ||
Bollineni VR, Wiegman EM, Pruim J, Groen HJ, Langendijk JA. Hypoxia imaging using positron emission tomography in non-small cell lung cancer: implications for radiotherapy. Cancer Treat Rev. 2012;38(8):1027–1032. | ||
Busk M, Mortensen LS, Nordsmark M, et al. PET hypoxia imaging with FAZA: reproducibility at baseline and during fractionated radiotherapy in tumour-bearing mice. Eur J Nucl Med Mol Imaging. 2013;40(2):186–197. | ||
Rajendran JG, Mankoff DA, O’Sullivan F, et al. Hypoxia and glucose metabolism in malignant tumors: evaluation by [18F]fluoromisonidazole and [18F]fluorodeoxyglucose positron emission tomography imaging. Clin Cancer Res. 2004;10(7):2245–2252. | ||
Imahashi K, Morishita K, Kusuoka H, et al. Kinetics of a putative hypoxic tracer, 99mTc-HL91, in normoxic, hypoxic, ischemic, and stunned myocardium. J Nucl Med. 2000;41(6):1102–1107. | ||
Wedman J, Pruim J, Roodenburg JL, et al. Alternative pet tracers in head and neck cancer. A review. Eur Arch Otorhinolaryngol. 2013;270(10):2595–2601. | ||
Suzuki T, Nakamura K, Kawase T, Kubo A. Monitoring of response to radiation therapy for human tumor xenografts using 99mTc-HL91 (4,9-diaza-3,3,10,10-tetramethyldodecan-2,11-dione dioxime). Ann Nucl Med. 2003;17(2):131–138. | ||
Brown JM, Giaccia AJ. The unique physiology of solid tumors: opportunities (and problems) for cancer therapy. Cancer Res. 1998;58(7):1408–1416. | ||
Graves EE, Maity A, Le QT. The tumor microenvironment in non-small-cell lung cancer. Semin Radiat Oncol. 2010;20(3):156–163. | ||
Le QT, Denko NC, Giaccia AJ. Hypoxic gene expression and metastasis. Cancer Metastasis Rev. 2004;23(3–4):293–310. | ||
Look MP, van Putten WL, Duffy MJ, et al. Pooled analysis of prognostic impact of urokinase-type plasminogen activator and its inhibitor pai-1 in 8377 breast cancer patients. J Natl Cancer Inst. 2002;94(2):116–128. | ||
Yan SF, Zou YS, Gao Y, et al. Tissue factor transcription driven by Egr-1 is a critical mechanism of murine pulmonary fibrin deposition in hypoxia. Proc Natl Acad Sci U S A. 1998;95(14):8298–8303. | ||
Postovit LM, Adams MA, Lash GE, Heaton JP, Graham CH. Oxygen-mediated regulation of tumor cell invasiveness. Involvement of a nitric oxide signaling pathway. J Biol Chem. 2002;277(38):35730–35737. | ||
Gupta NC, Maloof J, Gunel E. Probability of malignancy in solitary pulmonary nodules using fluorine-18-FDG and PET. J Nucl Med. 1996;37(6):943–948. | ||
Deslauriers J, Gregoire J. Clinical and surgical staging of non-small cell lung cancer. Chest. 2000;117(4 Suppl 1):96S–103S. | ||
Blum J, Handmaker H, Lister-James J, Rinne N. A multicenter trial with a somatostatin analog (99m)Tc depreotide in the evaluation of solitary pulmonary nodules. Chest. 2000;117(5):1232–1238. | ||
Wang F, Wang Z, Yao W, Xie H, Xu J, Tian L. Role of 99mTc-octreotide acetate scintigraphy in suspected lung cancer compared with 18f-FDG dual-head coincidence imaging. J Nucl Med. 2007;48(9):1442–1448. | ||
Chen G, Wang RF, Zhang CL, et al. Preliminary clinical application of 99tcm-hl91 hypoxia imaging in the radiotherapy of patients with non-small cell lung cancer. Chin J Med Imaging Technol. 2007;23(8):1233–1236. | ||
Hu YJ, Bian YZ, Zhang WY, Wu DY, Wei Q. Comparison between 99Tcm-MNLS and 99Tcm-HL91 in assessing the hypoxia of the tumor after radiotherapy. Chongqing Med. 2015;44:2618–2620. | ||
Dullin C, Zientkowska M, Napp J, et al. Semiautomatic landmark-based two-dimensional-three-dimensional image fusion in living mice: correlation of near-infrared fluorescence imaging of Cy5.5-labeled antibodies with flat-panel volume computed tomography. Mol Imaging. 2009;8(1):2–14. | ||
Kerner GS, Bollineni VR, Hiltermann TJ, et al. An exploratory study of volumetric analysis for assessing tumor response with (18)F-FAZA PET/CT in patients with advanced non-small-cell lung cancer (NSCLC). EJNMMI Res. 2016;6(1):33. |
Supplementary material
 | Figure S1 The synthetic route of 2-(2-methyl-5-nitro-1H-imidazol-1-yl) ethyl dihydrogen phosphate (MNLS). |
 © 2016 The Author(s). This work is published and licensed by Dove Medical Press Limited. The full terms of this license are available at https://www.dovepress.com/terms.php and incorporate the Creative Commons Attribution - Non Commercial (unported, v3.0) License.
By accessing the work you hereby accept the Terms. Non-commercial uses of the work are permitted without any further permission from Dove Medical Press Limited, provided the work is properly attributed. For permission for commercial use of this work, please see paragraphs 4.2 and 5 of our Terms.
© 2016 The Author(s). This work is published and licensed by Dove Medical Press Limited. The full terms of this license are available at https://www.dovepress.com/terms.php and incorporate the Creative Commons Attribution - Non Commercial (unported, v3.0) License.
By accessing the work you hereby accept the Terms. Non-commercial uses of the work are permitted without any further permission from Dove Medical Press Limited, provided the work is properly attributed. For permission for commercial use of this work, please see paragraphs 4.2 and 5 of our Terms.