")
Back to Journals » Clinical Ophthalmology » Volume 12
The development of a reference database with the Topcon 3D OCT-1 Maestro
Authors Chaglasian M, Fingeret M, Davey PG, Huang WC, Leung D, Ng E, Reisman CA
Received 26 October 2017
Accepted for publication 8 February 2018
Published 7 May 2018 Volume 2018:12 Pages 849—857
DOI https://doi.org/10.2147/OPTH.S155229
Checked for plagiarism Yes
Review by Single anonymous peer review
Peer reviewer comments 2
Editor who approved publication: Dr Scott Fraser
Michael Chaglasian,1 Murray Fingeret,2 Pinakin Gunvant Davey,3 Wei-Chieh Huang,4 Danny Leung,4 Edmund Ng,5 Charles A Reisman4
1Illinois Eye Institute, Illinois College of Optometry, Chicago, IL, USA; 2Department of Veterans Affairs, New York Harbor Health Care System, Brooklyn, NY, USA; 3School of Optometry, Western University of Health Sciences, Pomona, CA, USA; 4Topcon Healthcare Solutions Research and Development, Oakland, NJ, USA; 5Edmund Ng Consulting, LLC, Seattle, WA, USA
Importance: The paper presents the range for measurements taken with a new spectral domain optical coherence tomography (OCT) device to establish a reference database for discrimination purposes.
Objective: To report the range of thickness values for the new Topcon Maestro 3D OCT device with 2 scan size settings: the 12×9 mm wide field and 6×6 mm scans.
Design: Prospective, multicenter cohort study conducted at 7 clinical sites across the USA.
Setting: Primary eyecare clinics within academic, hospital, and private practice locations.
Participants: Healthy volunteers; all enrolled participants underwent a complete ophthalmological examination to confirm healthy ocular status prior to being enrolled in the study.
Main outcome measure: Average and 1st, 5th, 95th, and 99th percentile ranges for OCT parameters Early Treatment Diabetic Retinopathy Study macula full retinal thickness, ganglion cell + inner plexiform layer thickness (GCL + IPL), ganglion cell complex (GCC) thickness, circumpapillary retinal nerve fiber layer (cpRNFL) thickness.
Results: Three hundred and ninety-nine eyes of 399 subjects were included in the analysis. Mean (SD) age was 46.3 (16.3) years (range 18–88 years). Forty-three percent of the subjects were male. Mean (SD) measurements (in μm) for the 12×9 mm wide scan were as follows: foveal thickness=237.079 (20.899), GCL + IPL=71.363 (5.924), GCC=105.949 (8.533), cpRNFL=104.720 (11.829); measurements for the 6×6 mm scans were as follows: foveal thickness=234.000 (20.657), GCL + IPL=71.726 (5.880), GCC=106.698 (9.094), cpRNFL=104.036 (11.341).
Conclusion: The overall normal thickness values reported with Topcon 3D OCT-1 Maestro were like those studies with OCT from different manufactures. The reference limits at the 1st, 5th, 95th, and 99th percentile points establish the thresholds for the quantitative comparison of the cpRNFL and the macula in the human retina to a database of known healthy subjects.
Keywords: spectral domain optical coherence tomography, normal eyes, 3D OCT-1 Maestro, macular measurements, circumpapillary retinal nerve fiber layer, optic disc
Introduction
Since its introduction in 1991,1 optical coherence tomography (OCT) has become the reference standard imaging device for evaluating retinal and optic nerve disorders.2–4 It uses low-coherence interferometry to generate in vivo, cross-sectional images of ocular tissues. Over the last 2 decades, technology has evolved to produce the spectral domain OCT (SD-OCT) with rapid image acquisition rate and high-resolution axial images of the retina and optic nerve.5 Thus, SD-OCT is commonly used in the monitoring of glaucoma and diabetic macula edema.6–10
Topcon 3D OCT-1 Maestro is a noncontact SD-OCT system introduced in 2013. The instrument operates a fully automated “alignment, focus and capture” procedure, and captures 50,000 axial scans per second. The device simultaneously captures the macula and optic nerve head areas, giving both a digital fundus image and a 12×9 mm automated segmentation OCT scan (“wide scan” setting). The device also has the option for separate 6×6 mm optic disc and macula scans. It produces a 20 μm lateral and 6 μm axial resolution (Topcon; http://www.topconmedical.com/products/3doct1maestro-literature.htm).
One of the goals of ophthalmic imaging is to assist clinicians to discriminate between normality and pathology. In order to provide quantitative metrics for clinicians to determine retinal pathologies, we conducted a multicenter prospective study within the USA (ClincialTrial.gov Identifier: NCT02447120) to collect OCT data of healthy eyes for the estimations of normal variation limits for various retinal and optic disc measurements using the Topcon 3D OCT-1 Maestro. The reference limits were estimated using non-crossing quantile regressions and 1st, 5th, 50th, 95th, and 99th percentiles were reported.
Methods
The study was conducted at 7 investigational sites in the USA and was performed in accordance with Good Clinical Practices (as described by the International Conference on Harmonisation), the Code of Federal Regulations, the ethical principles in the Declaration of Helsinki, Health Insurance Portability and Accountability Act regulations, and other applicable local regulations. The study was registered at the US National Institutes of Health (ClinicalTrials.gov Identifier: NCT02447120). Between May and October 2015, 504 participants were enrolled. Institutional Review Board approval was provided by IntegReview IRB (Austin, TX, USA) for the following sites: Illinois College of Optometry, Marshall B. Ketchum University, State University of New York College of Optometry, Western University, and Valley Eye Care Center Medical Associates. Local IRB was used for the University of Alabama School of Optometry and New York Harbor Health Care System sites. All subjects, at all sites, provided written informed consent before the performance of any study procedure. Subjects were eligible for the study if both eyes were free of eye disease, with an intraocular pressure of ≤21 mmHg bilaterally and a best-corrected visual acuity of 20/40 or better in each eye. All subjects underwent Humphrey Field Analyzer (HFA; Carl Zeiss Meditech, Inc., Dublin, CA, USA) testing using the Swedish Interactive Threshold Algorithm (SITA) 24-2 test strategy. Subjects were excluded if they exhibited a field defect or if they had unreliable test result, (defined as fixation losses >20%, or false positives >33%, or false negatives >33%). Subjects were also excluded if they were unable to tolerate ophthalmic imaging; had media opacities that inhibited OCT imaging; showed the presence of any ocular pathology except for cataract; had narrow angles on gonioscopy; had a history of leukemia, dementia, or multiple sclerosis; or were concomitantly using hydroxychloroquine and chloroquine. All ocular examinations to determine participant eligibility were performed within 2 calendar months of the scan acquisitions, and where possible, all OCT scans were performed in a single session.
One eye of each study participant was randomly selected and scanned with the 3D OCT-1 Maestro (firmware version 1.27). A minimum of 9 scans were obtained under 3 different settings: 3 wide scans (12×9 mm), 3 disc scans (6×6 mm), and 3 macula scans (6×6 mm). Additional scans were taken at the operator’s discretion if image quality was unacceptable. All study scans that were deemed acceptable by the clinical site operator were saved.
Clinical sites were also allowed to make manual adjustments to correct automatic segmentation errors such as grid locations, boundary segmentations, and/or disc margin with Fastmap (version 8.27). Such modifications were performed only at the clinical sites by qualified investigators within the purview of typical clinical use. All manual adjustments were electronically documented. The fovea modification corresponded to relocation of the Early Treatment Diabetic Retinopathy Study (ETDRS) and Macula 6 grid center location, while the disc margin and disc center modifications corresponded to adjustments of the disc outline and location, respectively. The remaining modifications involved segmentation adjustments between boundaries. The scan adjustment rates were between 1% and 8%. The scan adjustment rates with respect to macula measurements ranged between 1% and 3%, and the adjustment rates with respect to optic disc and circumpapillary measurements fell within the 6%–8% range.
OCT data were then exported to Topcon Reading Center (Oakland, NJ, USA), where image quality was checked by individuals with experience in OCT imaging. Scan exclusion criteria included image quality score, presence of eye blinks, eye motion, clipping, local weak signal, and feature centration. All scan exclusions were documented. No manual adjustments were made in the Topcon Reading Center. Approximately 1,200 scans were captured per scan mode (all subjects combined). Scan exclusion rates were 3% for wide scans, 3% for disc scans, and 2% for macula scans. All scans deemed acceptable by Topcon Reading Center qualified for data analysis.
Measurement endpoints
Measurement endpoints by scan patterns are listed below:
Macular full retinal thickness (FRT, Figure 1): ETDRS grid was placed automatically at the foveal center and sectors measured as per ETDRS chart specifications:11 central fovea, superior, nasal, inferior, and temporal inner quadrants (para-foveal); superior, nasal, inferior, and temporal outer quadrants (peri-foveal), measured with 12×9 wide and 6×6 macula modes; FRT consisted the distance between the inner limiting membrane (ILM) and the outer segments/retinal pigment epithelium junction boundary (Figure 1), the 2 green boundaries. An average value over the entire sector was reported.
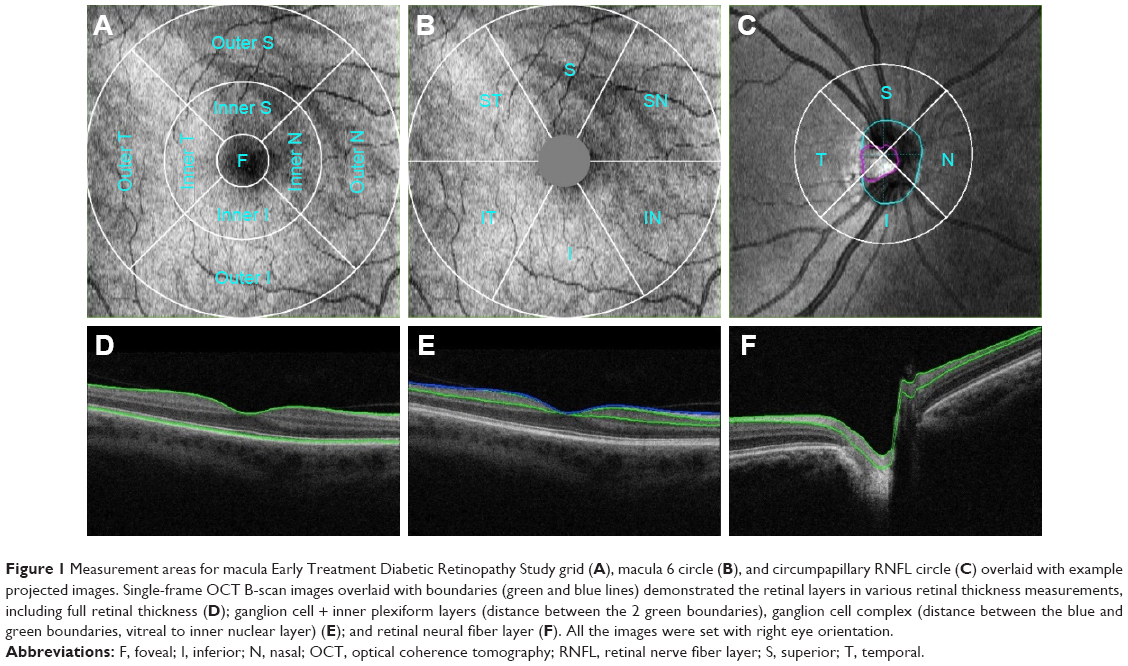 | Figure 1 Measurement areas for macula Early Treatment Diabetic Retinopathy Study grid (A), macula 6 circle (B), and circumpapillary RNFL circle (C) overlaid with example projected images. Single-frame OCT B-scan images overlaid with boundaries (green and blue lines) demonstrated the retinal layers in various retinal thickness measurements, including full retinal thickness (D); ganglion cell + inner plexiform layers (distance between the 2 green boundaries), ganglion cell complex (distance between the blue and green boundaries, vitreal to inner nuclear layer) (E); and retinal neural fiber layer (F). All the images were set with right eye orientation. |
Macular ganglion cell + inner plexiform layer thickness (GCL + IPL, Figure 1): The Macula 6 sector circle was placed automatically at the foveal center (Figure 1). The center 1 mm region was excluded from measurement. Superior, superior nasal, superior temporal, inferior, inferior nasal, inferior temporal, and average thickness were measured with 12×9 wide and 6×6 macula modes; GCL + IPL thickness included the distance labeled in Figure 1 (regions between 2 green boundaries). An average value of the entire sector was reported.
Macular ganglion cell complex (GCC, Figure 1): GCC measurement was performed with the same Macula 6 sector circle as GCL + IPL measurements. Superior, superior nasal, superior temporal, inferior, inferior nasal, inferior temporal, and average thickness were measured with 12×9 wide and 6×6 macula modes; GCC thickness consisted of the regions labeled in Figure 1, which consisted of regions between the ILM (blue) and the green boundary vitreal to inner nuclear layer. An average value of the entire sector was reported.
Circumpapillary retinal nerve fiber layer (cpRNFL) thickness: 3.4 mm diameter temporal-superior-nasal-inferior-temporal (TSNIT) circle was placed automatically at the optic disc center (Figure 1). Average RNFL thickness over TSNIT circle; 4 quadrants and 12 clock-hour sectors around TSNIT circle; measured with 12×9 wide and 6×6 disc modes; RNFL thickness consisted of regions labeled in Figure 1 (between 2 green boundaries). Average values of each sector (excluding the optic disc contour and cyan circle) were reported.
Optic disc measurements: Optic disc contour was automatically detected (Figure 1, cyan circle). Disc area, cup area, rim area, cup/disc (C/D) vertical diameter, C/D area, cup volume and rim volume were measured with 12×9 wide and 6×6 disc modes. Optic disc measurements were based on optic disc contour; an example is shown in Figure 1.
Data analysis
For each scan mode, the first acceptable scan by chronological order from each subject and scan mode was included in the analysis. The 99 percentiles (the 1st to the 99th) of each parameter were estimated by a simultaneous estimation of 99 non-crossing quantile regressions.12 Age was the regression covariate used in reference limits estimation for macula FRT, GCL + IPL, and GCC, whereas age and disc area were used as the regression covariates for RNFL thickness and optic disc parameters.13–17 Estimation of the non-crossing quantile regressions was performed using an R program provided by Bondell (available at http://www4.stat.ncsu.edu/~bondell/Software/NoCross/NoCrossQuant.R). The 1st, 5th, 50th (median), 95th, and 99th percentile results were reported.
The sample size was based on the nonparametric 95% CI for the percentiles of the scan parameters without any covariate adjustments. The goal was to find a minimum sample size such that the nonparametric 95% CI for the 1st and the 5th percentiles did not overlap. For a sample size of 315 eyes, the nonparametric 95% CI values are (X(1), X(9)) and (X(10), X(27)) for the 1st and the 5th percentiles, respectively, where X(k) is the kth smallest value in a sample of 315 measurements without ties.18 Therefore, at least 315 evaluable eyes were needed to achieve the sample size goal. A study eye was evaluable if the subject met all eligibility criteria and had at least 1 acceptable scan. The final sample size was increased by about 10% of the minimum number of evaluable eyes to 350 evaluable eyes to ensure that all scan parameters would have at least 315 eyes for analysis. Assuming 30% of the subjects would not meet eligibility criteria, the study planned to enroll 500 subjects.
Results
Five hundred and four subjects were screened for the study. One hundred and two did not meet the eligibility criteria and were excluded from imaging. Reasons for screen failure included visual fields with an apparent defect or artifact per study criteria (n=73), unreliable HFA visual field (n=26), and other ocular pathology/presence of eye disease (n=33). Some subjects failed multiple eligibility criteria. Two subjects who met the eligibility criteria did not have acceptable scans and 1 subject with unknown eligibility status did not have any scans. Therefore, 399 eyes of the 504 enrolled subjects were included in the analysis.
The mean (SD) age was 46.3 (16.3) years (ranged 18–88 years). The most prominent age group was 18–30 years (22%) followed by 51–60 years (20%). Fifty-seven percent (n=226) of the subjects were female and 18% (n=71) of the subjects were Hispanic or Latino. Fifty-nine percent of the subject were Caucasians, followed by Black/African American (20%), Asian (13%), Native American/Pacific Islander (2%), and American Indian/Alaskan Native (1%); 6% reported their race as “other”.
The study eyes had a mean sphere of −1.441 diopters (D)±2.537 (ranged −12.5D to 4.0D), a cylinder of 0.565D±0.691 (ranged 0–5.0D), and a manifest refractive spherical equivalent of −1.159D±2.418 (ranged −11.00 to 4.50D).
Subjects had at least 3 acceptable scans per scan mode. Images were reviewed for acceptability prior to calculating results. The first accepted scan of each scan parameter in each scan mode from each eligible subject was included in the analysis. Scan rejection rates ranged from 2% to 5%. Specifically, the scan rejection rates were 2%–4% with respect to macula measurements and 4%–5% with respect to optic disc and circumpapillary measurements.
Macular FRT
Summary statistic of foveal FRT measured with 2 scan modes are shown in Table 1. Four patients were excluded from this analysis, as all their macula scans were determined to be unacceptable; thus, 395 of 399 subjects were included. The 1st, 5th, 50th, 95th, and 99th percentiles of foveal FRT by age are shown in Figure 2. The median intercepts and coefficients were highly similar between 12×9 wide and 6×6 macula scan modes. Overall, there was a reduction in FRT with age in the outer ETDRS quadrants.
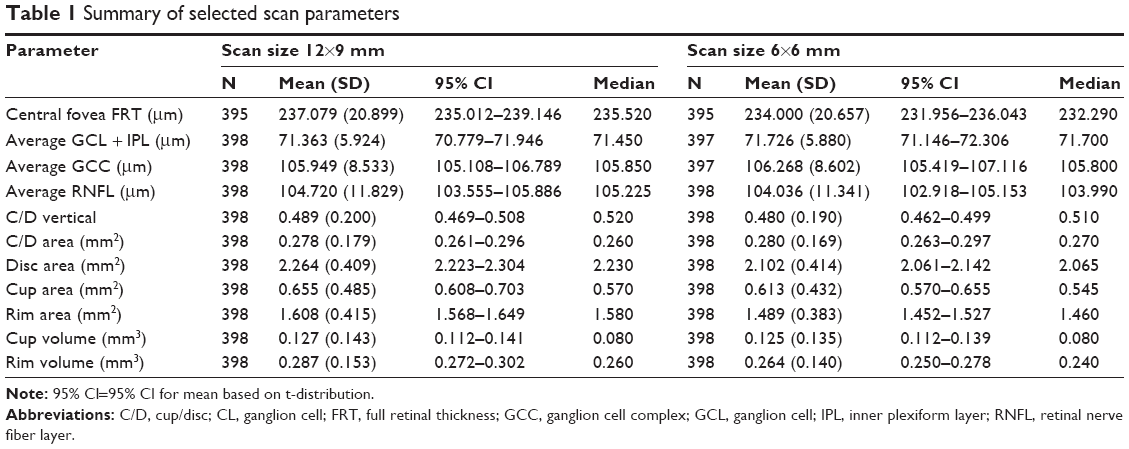 | Table 1 Summary of selected scan parameters |
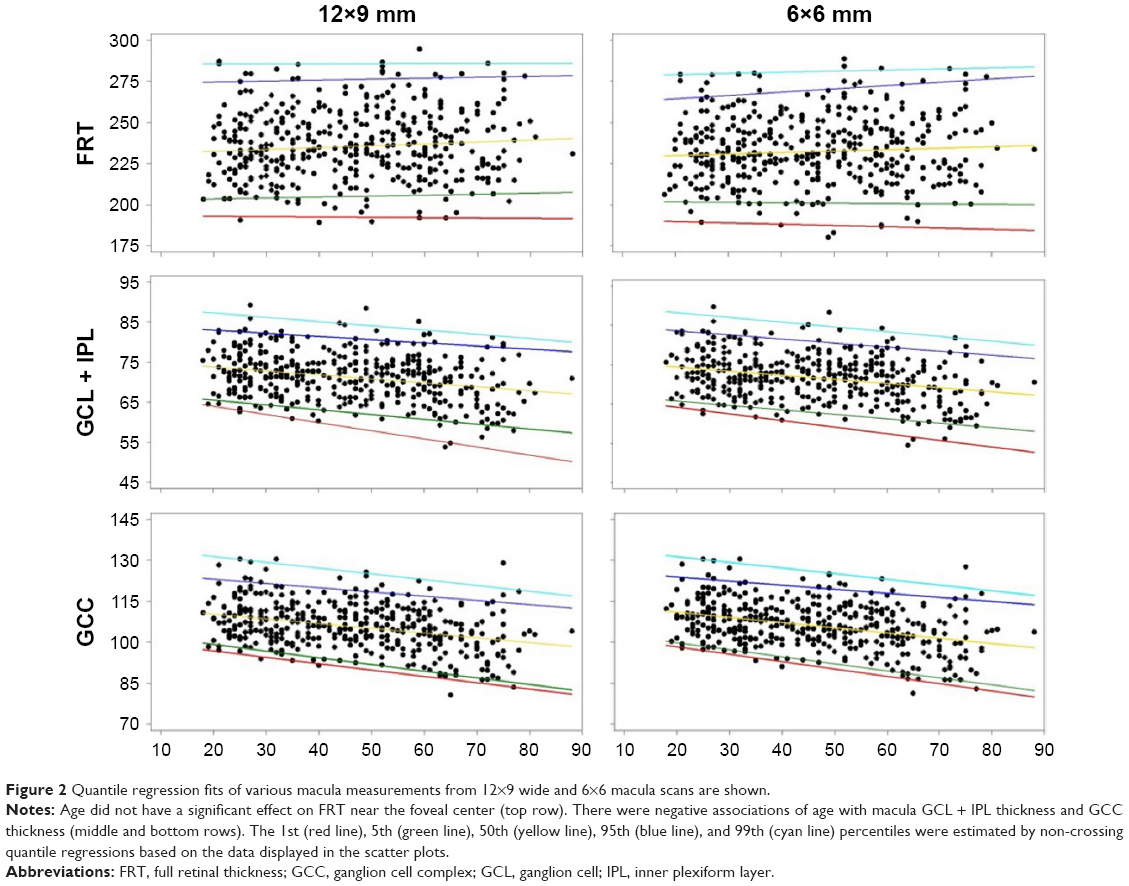 | Figure 2 Quantile regression fits of various macula measurements from 12×9 wide and 6×6 macula scans are shown. |
GCL + IPL thickness
The 1st, 5th, 50th, 95th, and 99th percentiles of average macula GCL + IPL thickness are shown in Figure 2. The median intercepts and coefficients were highly similar between 12×9 wide and 6×6 macula scan modes, and overall, there was a reduction in GCL + IPL thickness with age.
GCC thickness
Summary statistics of average GCC thickness with 2 scan modes are shown in Table 1. The 1st, 5th, 50th, 95th, and 99th percentiles of average macula GCC thickness are shown in Figure 2, bottom panels. The median intercepts and slopes were highly similar between 12×9 wide and 6×6 macula scan modes, and overall, there was a reduction in GCC thickness with age.
cpRNFL thickness
Summary statistics of average cpRNFL thickness with 2 scan modes are shown in Table 1. The disc areas ranged from 1.25 to 3.97 mm2 (2.26±0.41 mm2, mean ± SD) for 12×9 wide scan and 1.03–3.85 mm2 (2.10±0.41 mm2) for 6×6 disc scan. The median intercepts and slopes were highly similar between 12×9 wide and 6×6 disc scan modes. Age had little or no effect, whereas disc area showed large degree of influence on the cpRNFL thickness (Figure 3A). Reference limits of the circle profile around the perimeter of the 3.4 mm TNSIT circle is shown in Figure 3B.
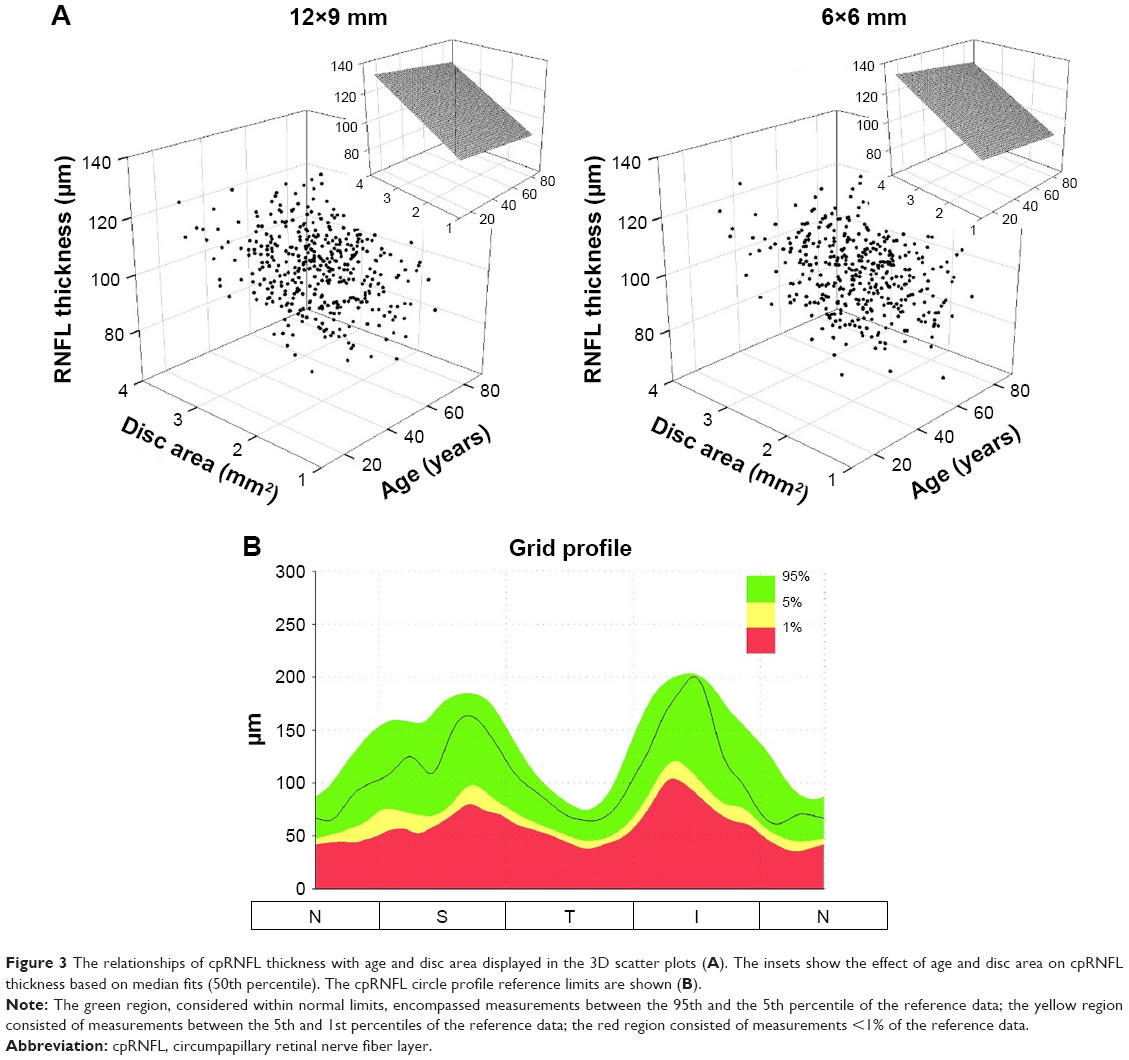 | Figure 3 The relationships of cpRNFL thickness with age and disc area displayed in the 3D scatter plots (A). The insets show the effect of age and disc area on cpRNFL thickness based on median fits (50th percentile). The cpRNFL circle profile reference limits are shown (B). |
Optic disc parameters
Summary statistics of disc area, cup area, rim area, cup volume, and rim volume with both 12×9 wide and 6×6 disc scan modes are reported in Table 1. Age and disc area were the covariates used in the quartile regression analyses. Overall, optic disc parameters increased with disc area, except rim volume, and the effect of aging was not significant.
Discussion
The purpose of this paper was to report the normal reference limits for macula, optic nerve, and nerve fiber layer thickness measurements from Topcon 3D OCT-1 Maestro. The measurements included various parameters of full retinal thickness, RNFL thickness, ganglion cell layer plus the IPL layer thickness, ganglion cell complex, and the optic disc for healthy eyes. Across all parameters, the measurements obtained by the 12×9 wide, the 6×6 macula, and 6×6 disc scan modes were generally similar.
FRT measurements were consistent with reported OCT measured thickness ranges for healthy eyes.19–23 We found a negative association between peri-foveal (outer retinal) thickness with age, but there were no significant age associations with central foveal or inner ETDRS quadrants. There are conflicting reports in the literature regarding whether retinal thickness, as measured with digital imaging techniques, decreases with age. Some authors found no association between overall macula thickness and age.19–21 However, like us, others have found a decreased FRT in both the inner and outer quadrants with age.23–26 Histological studies suggest that retinal thickness reduces with age, but that the changes in the foveal region are much less than those in the outer retinal areas.27 As with others’ reports, we recommend that due to differences in image acquisition and processing methods, imaging devices should not be interchanged when evaluating retinal thickness measurements.21–28
Our reported reference values for ganglion cell and inner limiting plexiform layer thickness were thinner than those reported by others using the Cirrus SD-OCT, but similar to measurements found using swept source OCT.29–33 Furthermore, we found a thicker GCC average measurement than previous reports.34–36 Differences may be primarily due to size and location of grid sectors used by the different devices, and add further evidence that imaging devices should not be interchanged when monitoring ophthalmic disease in an individual.
We found that both the GCL + IPL thickness and GCC thickness decreased with advancing age, which is consistent with some published data,37,38 but not with other published data.39,40 An age-related reduction in the ganglion cell layer has been noted in histological studies;27 thus, it might be expected that in vivo imaging of the area in a wide age range would show similar findings. In addition to age-related trends in loss of tissue, individual variation in the location of the major RNFL arcuates (since the GCC includes the nerve fiber layer, the ganglion cell layer, and the inner plexiform layer) is also likely factoring in our results.
cpRNFL thickness parameters included average, superior quadrant, nasal quadrant, inferior quadrant, temporal quadrant, and 12 clock-hour sections around the TSNIT circle. Overall, the measurements were consistent with those in the literature,41–43 although there is some variation in the values reported by different devices.44 Some sectors showed the trend of cpRNFL thickness decreasing with age, which can be explained by 2 competing factors: a neuronal tissue loss and a non-neuronal tissue gain that typically occurs to a smaller extent.43,45–47 However, our data showed that disc area had a more profound effect on cpRNFL thickness. This is mainly due to the following reasons:
- The measurement region was a circle with a fixed diameter of 3.4 mm centering at the geographical center of the optic disc. As it has been proposed in previous studies, there could be greater amount of retinal neural fibers present with eyes having large optic disc, or it could be an artifact with fixed diameter scans.2,48,49
- Individual variation in the location of blood vessels and RNFL arcuates could contribute to variations in RNFL layer segmentations. To encompasses individual variations, the 3D OCT-1 Maestro’s cpRNFL reference variation limits were estimated based on the influence of both age and disc area.
In summary, the measurements and trends observed for the various parameters were largely consistent with those in the literature. Thus, the measurements presented in this report can be considered as a reference database for the measurements of healthy eyes. This study collected measurements of healthy eyes for full retinal thickness, RNFL thickness, ganglion cell layer plus the IPL layer thickness, GCC, and the optic disc in addition to small and large super pixel grid and TSNIT circle profile measurements. The reference limits at the 1st, 5th, 95th, and 99th percentile points establish thresholds to provide for the quantitative comparison of the RNFL, optic nerve head, and the macula in the human retina to a database of known healthy eyes. Consistent with the device’s proposed indications for use, this quantitative comparison can aid in the diagnosis, documentation, and management of ocular health and diseases in the adult population.
Acknowledgments
Additional investigators and data collection sites included: Jeffrey Chou, New York Harbor Health Care System, Brooklyn, NY; George Comer, Marshall B Ketchum University, Southern California College of Optometry Fullerton, CA; Mitchell Dul, State University of New York College of Optometry, New York, NY; Michael Gagnon, Valley EyeCare Center Medical Associates, Pleasanton, CA; Michael D Twa, University of Alabama School of Optometry, Birmingham, AL.
Disclosure
MC, MF, and PGD received financial support from Topcon Medical Systems. WCH, DL, and CAR are employees of Topcon Medical Systems. EN is a consultant of Topcon for this work. The authors report no other conflicts of interest in this work.
References
Huang D, Swanson EA, Lin CP, et al. Optical coherence tomography. Science. 1991;254(5035):1178–1181. | ||
Kaiser PK, Blodi BA, Shapiro H, Acharya NR; MARINA Study Group. Angiographic and optical coherence tomographic results of the MARINA study of ranibizumab in neovascular age-related macular degeneration. Ophthalmology. 2007;114(10):1868–1875. | ||
Mwanza JC, Budenz DL. Optical coherence tomography platforms and parameters for glaucoma diagnosis and progression. Curr Opin Ophthalmol. 2015;27(2):102–110. | ||
Wilde C, Patel M, Lakshmanan A, et al. The diagnostic accuracy of spectral-domain optical coherence tomography for neovascular age-related macular degeneration: a comparison with fundus fluorescein angiography. Eye (Lond). 2015;29(5):602–610. | ||
Wojtkowski M, Srinivasan V, Fujimoto JG, et al. Three-dimensional retinal imaging with high-speed ultrahigh-resolution optical coherence tomography. Ophthalmology. 2005;112(10):1734–1746. | ||
Hee MR, Baumal CR, Puliafito CA, et al. Optical coherence tomography of age-related macular degeneration and choroidal neovascularization. Ophthalmology. 1996;103(8):1260–1270. | ||
Coscas F, Coscas G, Souied E, Tick S, Soubrane G. Optical coherence tomography identification of occult choroidal neovascularization in age-related macular degeneration. Am J Ophthalmol. 2007;144(4):592–599. | ||
Elman MJ, Aiello LP, Beck RW, et al; Diabetic Retinopathy Clinical Research Network. Randomized trial evaluating ranibizumab plus prompt or deferred laser or triamcinolone plus prompt laser for diabetic macular edema. Ophthalmology. 2010;117(6):1064.e35–1077.e35. | ||
Michelessi M, Lucenteforte E, Oddone F, et al. Optic nerve head and fibre layer imaging for diagnosing glaucoma. Cochrane Database Syst Rev. 2015;11:CD008803. | ||
Wang YT, Tadarati M, Wolfson Y, Bressler SB, Bressler NM. Comparison of prevalence of diabetic macular edema based on monocular fundus photography vs optical coherence tomography. JAMA Ophthalmol. 2016;134(2):222–228. | ||
Photocoagulation for diabetic macular edema. Early treatment diabetic retinopathy study report number 1. Early treatment diabetic retinopathy study research group. Arch Ophthalmol. 1985;103(12):1796–1806. | ||
Bondell HD, Reich BJ, Wang H. Noncrossing quantile regression curve estimation. Biometrika. 2010;97(4):825–838. | ||
Alamouti B, Funk J. Retinal thickness decreases with age: an OCT study. Br J Ophthalmol. 2003;87(7):899–901. | ||
Celebi AR, Mirza GE. Age-related change in retinal nerve fiber layer thickness measured with spectral domain optical coherence tomography. Invest Ophthalmol Vis Sci. 2013;54(13):8095–8103. | ||
Song WK, Lee SC, Lee ES, Kim CY, Kim SS. Macula thickness variation with sex, age, and axial length in healthy subjects: a spectral domain-optical coherence tomography study. Invest Ophthalmol Vis Sci. 2010;51(8):3913–3918. | ||
Mansoori T, Balakrishna N, Viswanath K. Influence of disc area on retinal nerve fiber layer thickness measurement by spectral domain optical coherence tomography. Indian J Ophthalmol. 2014;62(5):615–618. | ||
Tariq MY, Li H, Burlutsky G, Mitchell P. Retinal nerve fiver layer and optic disc measurements by spectral domain OCT: normative values and associations in young adults. Eye (Lond). 2012;26(12):1563–1570. | ||
Hollander M, Woolfe DA. Nonparametric Statistical Methods. 2nd ed. New York: Wiley-Interscience; 1999. | ||
Grover S, Murthy RK, Brar VS, Chalam KV. Normative data for macular thickness by high-definition spectral-domain optical coherence tomography (spectralis). Am J Ophthalmol. 2009;148(2):266–271. | ||
Sull AC, Vuong LN, Price LL, et al. Comparison of spectral/Fourier domain optical coherence tomography instruments for assessment of normal macular thickness. Retina. 2010;30(2):235–245. | ||
Wolf-Schnurrbusch UE, Ceklic L, Brinkmann CK, et al. Macular thickness measurements in healthy eyes using six different optical coherence tomography instruments. Invest Ophthalmol Vis Sci. 2009;50(7):3432–3437. | ||
Chan A, Duker JS, Ko TH, Fujimoto JG, Schuman JS. Normal macular thickness measurements in healthy eyes using Stratus optical coherence tomography. Arch Ophthalmol. 2006;124(2):193–198. | ||
Manassakorn A, Chaidaroon W, Ausayakhun S, Aupapong S, Wattananikorn S. Normative database of retinal nerve fiber layer and macular retinal thickness in a Thai population. Jpn J Ophthalmol. 2008;52(6):450–456. | ||
Sung KR, Wollstein G, Bilonick RA, et al. Effects of age on optical coherence tomography measurements of healthy retinal nerve fiber layer, macula, and optic nerve head. Ophthalmology. 2009;116(6):1119–1124. | ||
Duan XR, Liang YB, Friedman DS, et al. Normal macular thickness measurements using optical coherence tomography in healthy eyes of adult Chinese persons: the Handan eye study. Ophthalmology. 2010;117(8):1585–1594. | ||
Song WK, et al. Macular thickness variations with sex, age, and axial length in healthy subjects: a spectral domain-optical coherence tomography study. Invest Ophthalmol Vis Sci. 2010;51(8):3913–3918. | ||
Gao H, Hollyfield JG. Aging of the human retina. Differential loss of neurons and retinal pigment epithelial cells. Invest Ophthalmol Vis Sci. 1992;33(1):1–17. | ||
Giani A, Cigada M, Choudhry N, et al. Reproducibility of retinal thickness measurements on normal and pathologic eyes by different optical coherence tomography instruments. Am J Ophthalmol. 2010;150(6):815–824. | ||
Mwanza JC, Durbin MK, Budenz DL, et al. Glaucoma diagnostic accuracy of ganglion cell-inner plexiform layer thickness: comparison with nerve fiber layer and optic nerve head. Ophthalmology. 2012;119(6):1151–1158. | ||
Francoz M, Fenolland JR, Giraud JM, et al. Reproducibility of macular ganglion cell-inner plexiform layer thickness measurement with cirrus HD-OCT in normal, hypertensive and glaucomatous eyes. Br J Ophthalmol. 2014;98(3):322–328. | ||
Lee H-J, Kim MS, Jo YJ, Kim JY. Ganglion cell–inner plexiform layer thickness in retinal diseases: repeatability study of spectral-domain optical coherence tomography. Am J Ophthalmol. 2015;160(2):283.e1–289.e1. | ||
Moon H, Yoon JY, Lim HT, Sung KR. Ganglion cell and inner plexiform layer thickness determined by spectral domain optical coherence tomography in patients with brain lesions. Br J Ophthalmol. 2015;99(3):329–335. | ||
Yang Z, Tatham AJ, Weinreb RN, Medeiros FA, Liu T, Zangwill LM. Diagnostic ability of macular ganglion cell inner plexiform layer measurements in glaucoma using swept source and spectral domain optical coherence tomography. PLoS One. 2015;10(5):e0125957. | ||
Tan O, Chopra V, Lu AT, et al. Detection of macular ganglion cell loss in glaucoma by Fourier-domain optical coherence tomography. Ophthalmology. 2009;116(12):2305.e2–2314.e2. | ||
Kim NR, Chopra V, Lu AT, et al. Structure-function relationship and diagnostic value of macular ganglion cell complex measurement using Fourier-domain OCT in glaucoma. Invest Ophthalmol Vis Sci. 2010;51(9):4646–4651. | ||
Loewen NA, Zhang X, Tan O, et al. Combining measurements from three anatomical areas for glaucoma diagnosis using Fourier-domain optical coherence tomography. Br J Ophthalmol. 2015;99(9):1224–1229. | ||
Mwanza JC, Durbin MK, Budenz DL, et al; Cirrus OCT Normative Database Study Group. Profile and predictors of normal ganglion cell-inner plexiform layer thickness measured with frequency-domain optical coherence tomography. Invest Ophthalmol Vis Sci. 2011;52(11):7872–7879. | ||
Koh VT, Tham YC, Cheung CY, et al. Determinants of ganglion cell-inner plexiform layer thickness measured by high-definition optical coherence tomography. Invest Ophthalmol Vis Sci. 2012;53(9):5853–5859. | ||
Kita Y, Kita R, Takeyama A, Anraku A, Tomita G, Goldberg I. Relationship between macular ganglion cell complex thickness and macular outer retinal thickness: a spectral-domain optical coherence tomography study. Clin Experiment Ophthalmol. 2013;41(7):674–682. | ||
Wang J, Gao X, Huang W, et al. Swept-source optical coherence tomography imaging of macular retinal and choroidal structures in healthy eyes. BMC Ophthalmology. 2015;15:122. | ||
Parikh RS, Parikh SR, Sekhar GC, Prabakaran S, Babu JG, Thomas R. Normal age-related decay of retinal nerve fiber layer thickness. Ophthalmology. 2007;114(5):921–926. | ||
Budenz DL, Anderson DR, Varma R, et al. Determinants of normal retinal nerve fiber layer thickness measured by Stratus OCT. Ophthalmology. 2007;114(6):1046–1052. | ||
Bendschneider D, Tornow RP, Horn FK, et al. Retinal nerve fiber layer thickness in normals measured by spectral domain OCT. J Glaucoma. 2010;19(7):475–482. | ||
Seibold LK, Mandava N, Kahook MY. Comparison of retinal nerve fiber layer thickness in normal eyes using time-domain and spectral-domain optical coherence tomography. Am J Ophthalmol. 2010;150(6):807.e1–814.e1. | ||
Alamouti B, Funk J. Retinal thickness decreases with age: an OCT study. Br J Ophthalmol. 2003;87(7):899–901. | ||
Vianna JR, Danthurebandara VM, Sharpe GP. Importance of normal aging in estimating the rate of glaucomatous neuroretinal rim and retinal nerve fiber layer loss. Ophthalmology. 2015;122(12):2392–2398. | ||
Harwerth RS, Wheat JL, Rangaswamy NV. Age-related losses of retinal ganglion cells and axons. Invest Ophthalmol Vis Sci. 2008;49(10):4437–4443. | ||
Savini G, Zanini M, Carelli V, Sadun AA, Ross-Cisneros FN, Barboni P. Correlation between retinal nerve fibre layer thickness and optic nerve head size: an optical coherence tomography study. Br J Ophthalmol. 2005;89:489–492. | ||
Funaki S, Shirakashi M, Abe H. Relation between size of optic disc and thickness of retinal nerve fibre layer in normal subjects. Br J Ophthalmol. 1998;82:1242–1245. |
 © 2018 The Author(s). This work is published and licensed by Dove Medical Press Limited. The full terms of this license are available at https://www.dovepress.com/terms.php and incorporate the Creative Commons Attribution - Non Commercial (unported, v3.0) License.
By accessing the work you hereby accept the Terms. Non-commercial uses of the work are permitted without any further permission from Dove Medical Press Limited, provided the work is properly attributed. For permission for commercial use of this work, please see paragraphs 4.2 and 5 of our Terms.
© 2018 The Author(s). This work is published and licensed by Dove Medical Press Limited. The full terms of this license are available at https://www.dovepress.com/terms.php and incorporate the Creative Commons Attribution - Non Commercial (unported, v3.0) License.
By accessing the work you hereby accept the Terms. Non-commercial uses of the work are permitted without any further permission from Dove Medical Press Limited, provided the work is properly attributed. For permission for commercial use of this work, please see paragraphs 4.2 and 5 of our Terms.