")
Back to Journals » Patient Preference and Adherence » Volume 8
The development and validation of the Satisfaction Questionnaire for Osteoporosis Prevention in Malaysia
Authors Toh LS, Lai PSM , Wu DB, Wong KT, Low BY, Tan ATB, Anderson C
Received 8 April 2014
Accepted for publication 24 June 2014
Published 30 September 2014 Volume 2014:8 Pages 1365—1381
DOI https://doi.org/10.2147/PPA.S65718
Checked for plagiarism Yes
Review by Single anonymous peer review
Peer reviewer comments 2
Video abstract presented by Li Shean Toh
Views: 267
Li Shean Toh,1 Pauline Siew Mei Lai,2 David Bin-Chia Wu,3 Kok Thong Wong,1 Bee Yean Low,1 Alexander Tong Boon Tan,4 Claire Anderson5
1School of Pharmacy, University of Nottingham, Semenyih, Malaysia; 2Department of Primary Care Medicine, University of Malaya Primary Care Research Group, University of Malaya, Kuala Lumpur, Malaysia; 3School of Pharmacy, Monash University Malaysia, Bandar Sunway, Malaysia; 4Department of Medicine, University of Malaya, Kuala Lumpur, Malaysia; 5Division of Social Research in Medicine and Health, School of Pharmacy, University of Nottingham, Nottingham, UK
Purpose: To develop and validate the English version of the Satisfaction Questionnaire for Osteoporosis Prevention (SQOP) in Malaysia.
Methods: The SQOP was modified from the Osteoporosis Patient Satisfaction Questionnaire and developed based on literature review and patient interviews. Face and content validity were established via an expert panel. The SQOP consists of two sections: clinical services and types of counseling. There were 23 items in total, each with a five-point Likert-type response. Satisfaction score was calculated by converting the total score to a percentage. A higher score indicates higher satisfaction. English speaking, non-osteoporotic, postmenopausal women aged ≥50 years were included in the study. Participants were randomized to either the control or intervention group. Intervention participants were provided counseling, whereas control participants received none. Participants answered the SQOP at baseline and 2 weeks later.
Results: A total of 140 participants were recruited (control group: n=70; intervention group: n=70). No significant differences were found in any demographic aspects. Exploratory factor analysis extracted seven domains. Cronbach’s a for the domains ranged from 0.531–0.812. All 23 items were highly correlated using Spearman’s correlation coefficient 0.469–0.996 (P<0.05), with no significant change in the control group’s overall test–retest scores, indicating that the SQOP achieved stable reliability. The intervention group had a higher score than the control group (87.91±5.99 versus 61.87±8.76; P<0.05), indicating that they were more satisfied than control participants. Flesch reading ease was 62.9.
Conclusion: The SQOP was found to be a valid and reliable instrument for assessing patients’ satisfaction towards an osteoporosis screening and prevention service in Malaysia.
Keywords: patient satisfaction, randomized controlled trial, postmenopausal women, screening
Introduction
Patient satisfaction may potentially be used to evaluate current preventive efforts and to predict patients’ adherence to preventive advice.1 The shift from health care provider-centered care to a more patient-centered care emphasizes the need to evaluate humanistic outcomes such as patient satisfaction.2 The rating of satisfaction by patients is a personal evaluation of health care services and providers.3,4 Patient satisfaction serves as an important determinant of the viability and sustainability of health care services.5
Due to the asymptomatic nature of osteoporosis, women who have osteoporosis are often not aware that they are at an increased risk of sustaining a fracture.6 Prevention measures and screening that aid in early detection are the most cost-effective ways to reduce the number of hospital admissions due to osteoporotic fractures. Evidence shows that satisfied patients are more likely to continue using health care services, value and maintain relationships with health care providers, follow the advice of the health care professionals, adhere to treatment, and have better health outcomes, which in this case is a reduction in fracture rates.1,7
Evaluating satisfaction can also assist health care professionals to provide health care services more effectively. Patient evaluations will help identify patients’ needs, perceptions, concerns, and areas of service failure. This in turn may encourage health care providers to be accountable for the quality of service delivered which ensures continuous monitoring and improvement in health care delivery.8
A search of published literature found several randomized controlled trials for osteoporosis screening services. These randomized controlled trials were conducted by various health care professionals such as primary care physicians,9,10 orthopedic surgeons,10,11 pharmacists,12–14 and nurses.15 All interventions demonstrated a positive effect towards bone mineral density scanning and osteoporosis treatment post fracture.9–15 However, only one study assessed patient satisfaction, highlighting the fact that many studies did not assess patient satisfaction as an outcome.16
A validated tool is necessary as it ensures the validity and the reliability of the results. Validity refers to the questionnaire measuring the objective it was designed to measure. Reliability refers to the ability of the questionnaire to produce the same results under the same conditions. Three tools have been developed globally to assess satisfaction pertaining to osteoporosis and its treatment,17–19 two of which were developed and validated in the US17,18 and one was developed in Malaysia.19 However, these satisfaction tools were not suitable to assess the satisfaction of patients from an osteoporosis screening and prevention program, as their focus was on osteoporosis and its treatment.17–19 To date, no instrument has been developed and validated specifically to assess patients’ satisfaction towards an osteoporosis screening and prevention program in Malaysia. Therefore, the aim of this study was to develop and validate the English version of the Satisfaction Questionnaire for Osteoporosis Prevention (SQOP) to evaluate patients’ satisfaction towards an osteoporosis screening and prevention program in Malaysia.
Methods
Development of the SQOP
Despite Malay being the national language of Malaysia, postmenopausal women aged 50 years residing in Malaysia are more fluent in English, as schooling was only conducted in the English language back then. Hence, the SQOP was developed in English based on modifications from the Osteoporosis Patient Satisfaction Questionnaire (OPSQ) and findings from a qualitative study that examined the barriers and needs towards an osteoporosis screening and prevention service in Malaysia.
Of the 16 items in the OPSQ, nine items were removed. Eight of these items were on satisfaction related to osteoporosis medication, whilst one item was on a follow-up visit. Four items from the OPSQ were rephrased. In item two, the word “session” was used instead of “appointment” as appointments were not made with the participants. The question in item seven – “How useful was the service provided by the pharmacist in this study?” – was considered leading and was rephrased to “How would you rate the advice given by the pharmacist?”. The word “overall” was added to item nine – “How would you rate the overall quality of service that was given by the pharmacist to you?” – to make the question more specific. The original question for item 18 – “How would you rate your understanding of osteoporosis since you participated in the study?” – was modified to “How would you rate your understanding of osteoporosis now?” as the questionnaire was going to be used in clinical practice after completion of the study. Three items were retained from the OPSQ without any modifications.
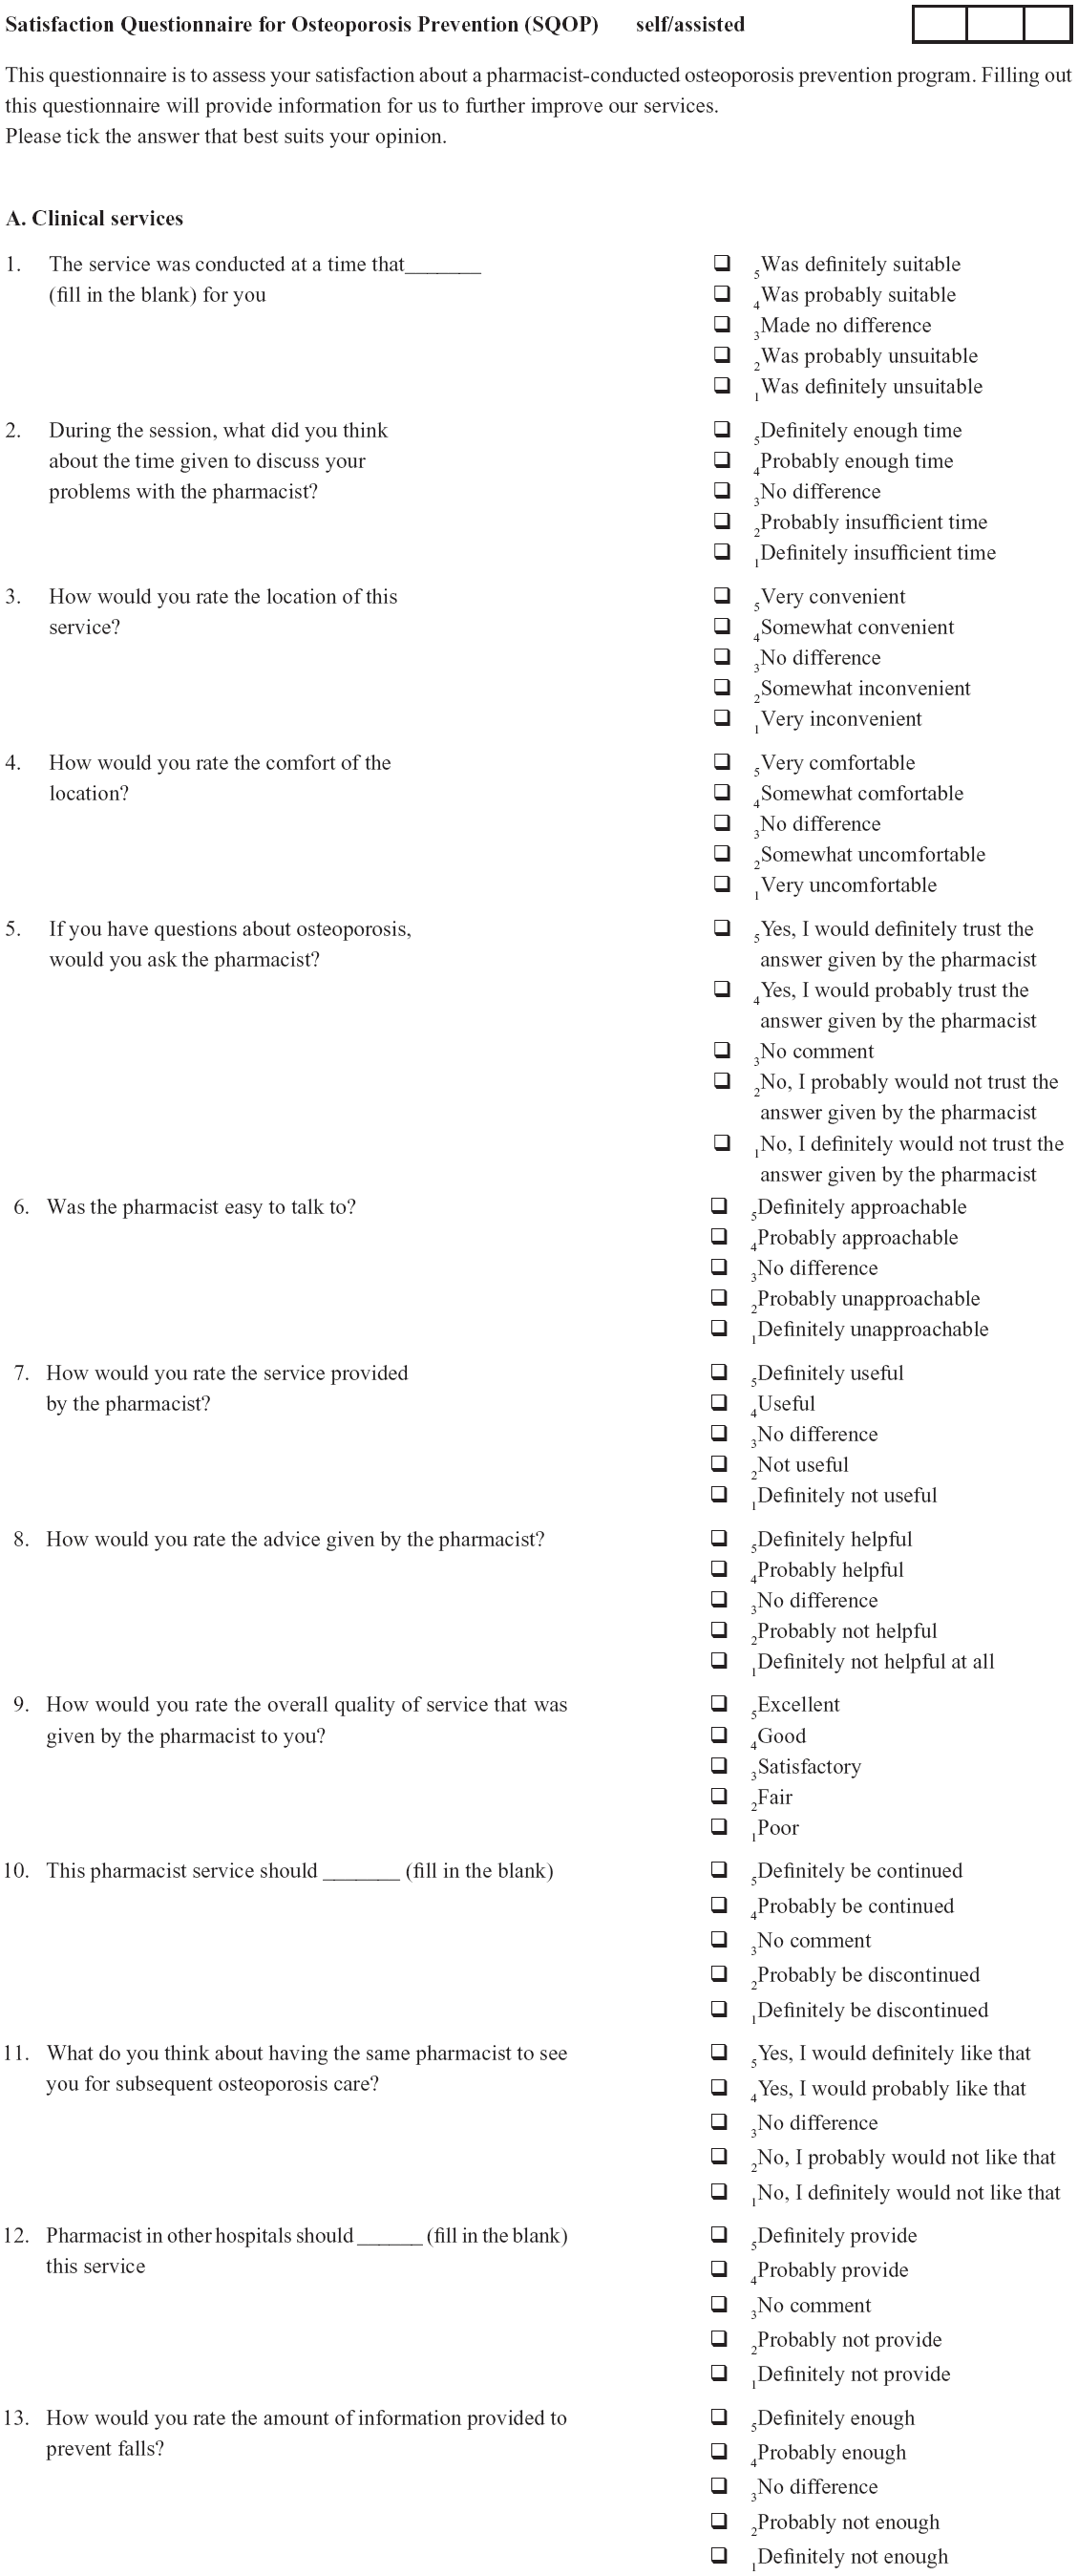
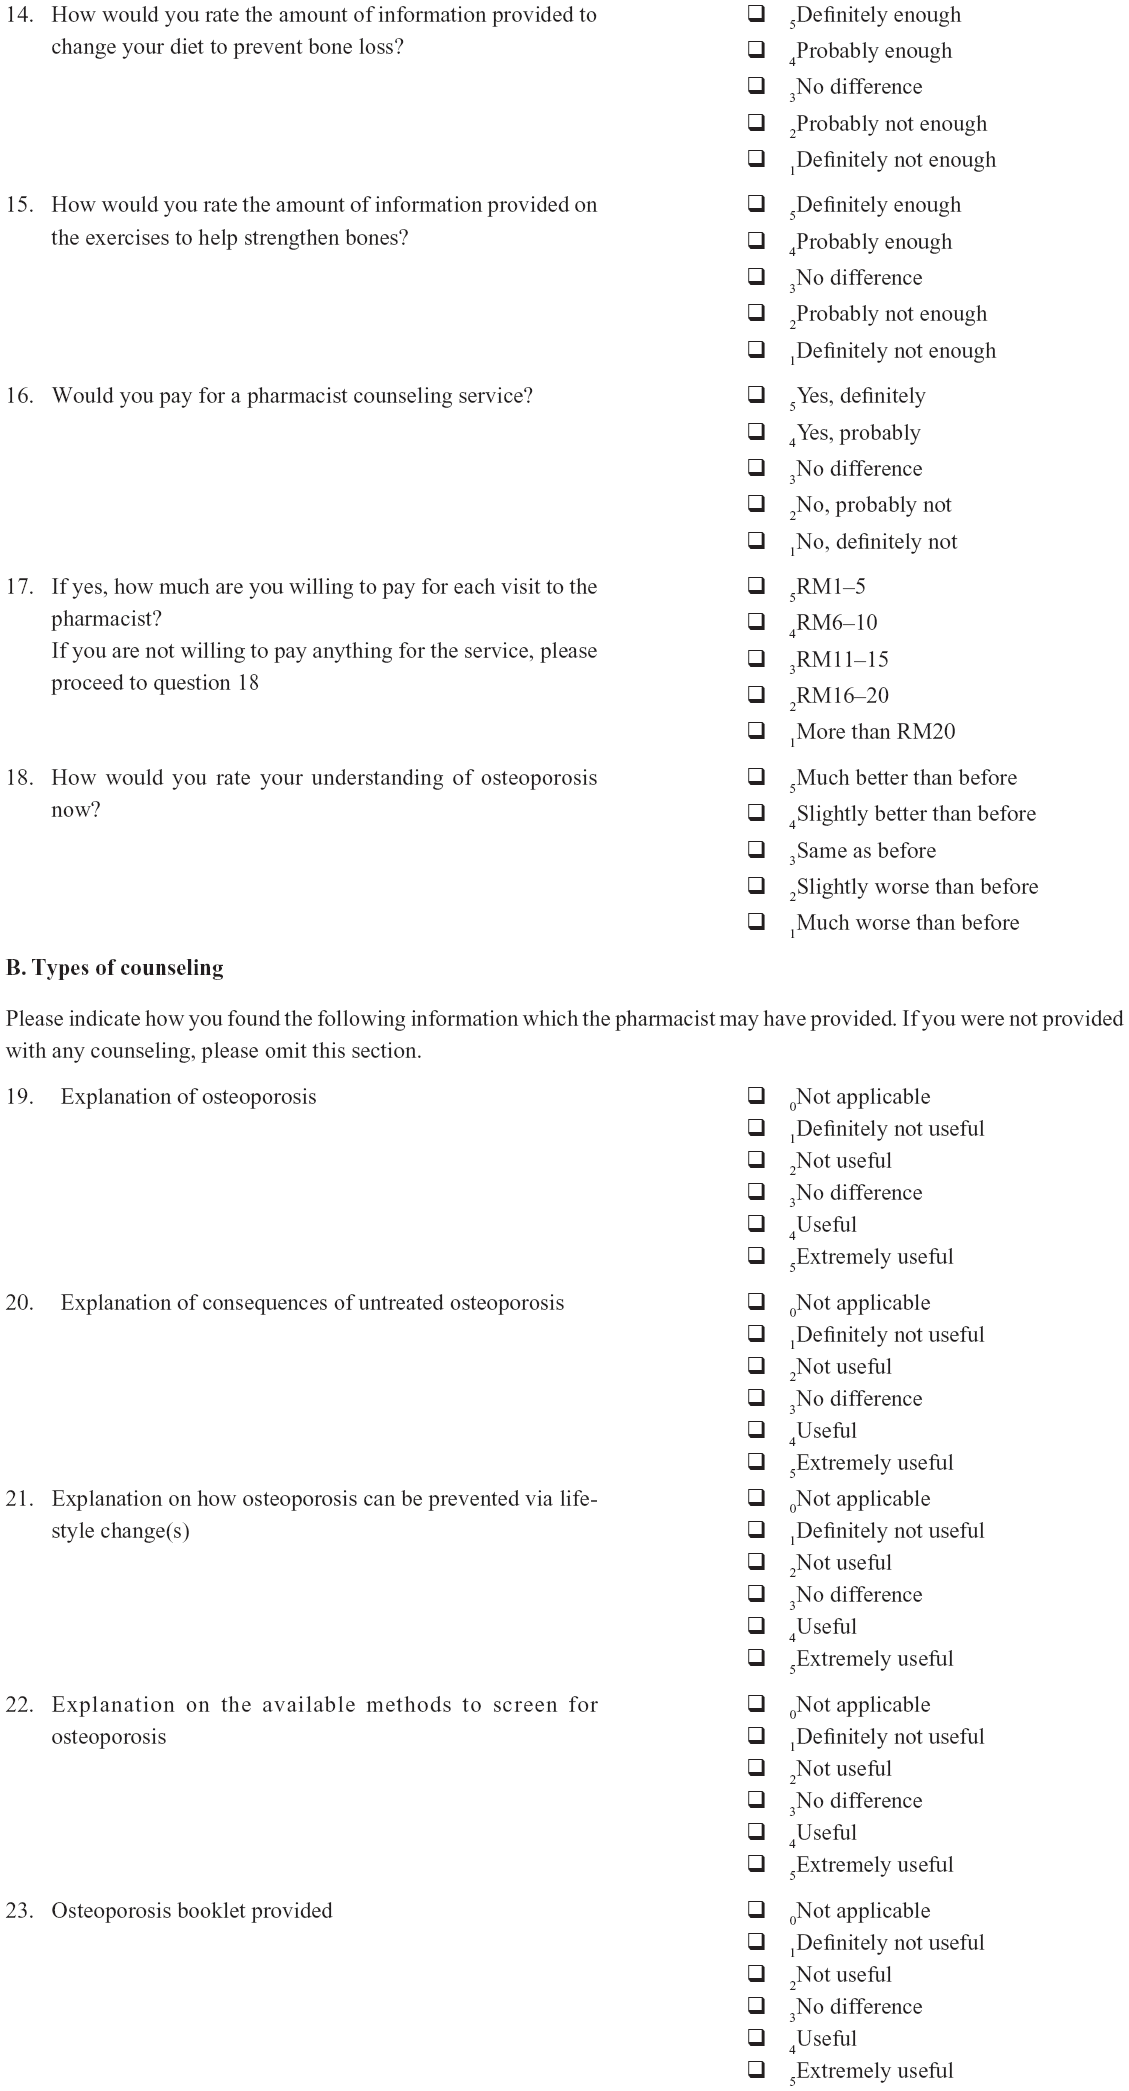
Results from the qualitative findings suggest that the following domains may influence patients’ satisfaction when utilizing an osteoporosis screening and prevention service: outcomes/efficacy, accessibility/convenience, technical quality, interpersonal relationship, finance, and continuity. A literature search noted that these domains were similar to those recommended by Ware et al except that Ware et al had an additional domain (ie, physical condition)4. Hence, the domain of physical condition was also included in the SQOP. Therefore, 16 new items were added. The final SQOP consisted of 23 items, and was divided into seven domains. Each item had a five-point Likert-type response. Please refer to the Supplementary material for the full questionnaire.
Validation of the SQOP
The validation process was a prospective, randomized controlled trial conducted from September to December 2013 at a primary care clinic of a tertiary hospital in Malaysia. Institutional Medical Ethics approval was obtained prior to the study (reference number 920.27).
Face and content validity of the SQOP was established via consultation with an expert panel (a consultant endocrinologist and four pharmacists with many years of research and clinical experience). Comprehension of the questionnaire was tested on ten postmenopausal women who understood English. This involved asking the participants for their opinions about the phrasing, format, and content of the instrument. This resulted in the change of item eight from “Has the advice given by the pharmacist affected your life in general?” to “How would you rate the advice given by the pharmacist?” as participants commented that it was difficult to gauge the effect of newly given advice.
Participants
To validate the final version of the SQOP, 140 postmenopausal women were recruited. Postmenopausal women aged 50 years and above who had not been diagnosed with osteoporosis/osteopenia were included. Women who did not speak English were excluded. Sample size was calculated based on a 5:1 subject-to-item ratio for factor analysis.20 Allowing for a 20% loss at follow-up, the total number of participants required was 70 in each arm.
Intervention
Intervention participants received 30 minutes of verbal counseling and an osteoporosis booklet. Topics covered during the counseling session were the definition of osteoporosis, consequences of untreated osteoporosis, risk factors for osteoporosis, the role of the bone mineral density scan (its function, what the results mean, accessibility, and the frequency a patient has to go for a bone mineral density scan), other tests used in osteoporosis screening (quantitative ultrasound scanning, X-ray, blood test, and the Osteoporosis Screening Tool for Asians), lifestyle changes (calcium intake, vitamin D intake, weight bearing exercise, and fall prevention), and treatment of osteoporosis.
Control participants received standard care. Standard care involved a regular visit to the doctor. Any counseling on osteoporosis by the doctor was opportunistic and at the doctors’ discretion.
Procedure
The researcher screened for potential participants by using a 1:2 systematic random sampling procedure (Figure 1). Participants were recruited in the clinic’s waiting area while they were waiting to see their doctor. Randomization of participants to either the control or intervention group was performed by drawing pieces of paper stating control or intervention from a bag while participants were filling out the demographic form. Participants answered the questionnaire themselves. However, for those who experienced some difficulty in reading the questions themselves, the researcher read the questions out for them and assisted them in filling in the questionnaire. The researcher ensured that all questions had been answered. Most participants required about 5 minutes to complete the questionnaire.
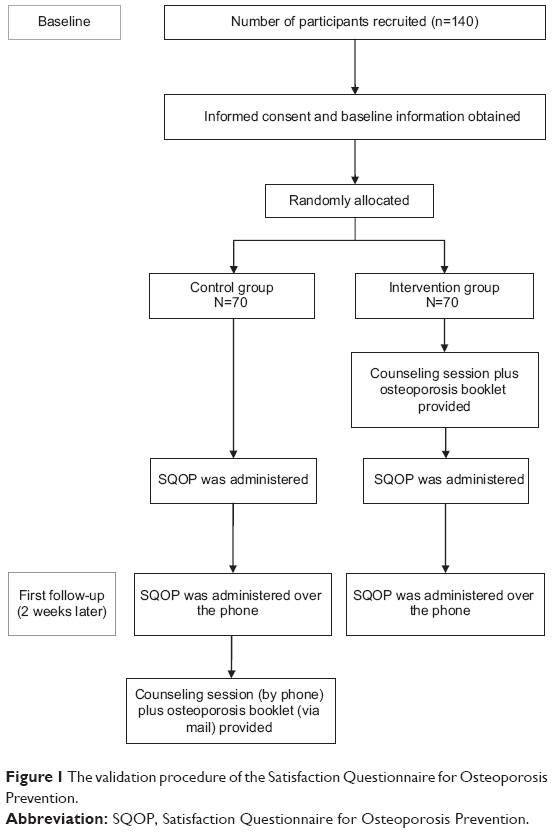 | Figure 1 The validation procedure of the Satisfaction Questionnaire for Osteoporosis Prevention. |
Data analysis
All data was entered into IBM® SPSS® version 20 (IBM Corporation, Armonk, NY, USA). Each item had a five-point Likert-type response. One indicates the lowest satisfaction for that item and five indicates the highest satisfaction. Scores ranged from 30–150, and were converted to a percentage, ranging from 0%–100%. Zero indicates the lowest level of satisfaction, whilst 100 indicates the highest. Baseline demographic data of the control and intervention group was compared using the chi-square test for categorical variables or the independent t-test for continuous variables. Nonparametric tests were used since the data obtained was not of normal distribution. A P-value <0.05 was considered statistically significant.
Face and content validity were used to ascertain analytical validity. Exploratory factor analysis (EFA) was used to determine empirical validity. EFA was performed to provide information about the validity of the items within each domain and to explore the appropriateness of the factor structure of the current questionnaire. It is important to note that the control group was not required to answer items 19–23 as these items were specifically assessing the satisfaction of the intervention conducted. However, all items (ie, items 1–23) in the EFA were included for two reasons. Firstly, although the control group did not answer items 19–23, it still represented one of the seven domains. Secondly, if control participants were excluded from the EFA, then the minimum number of participants required would not have been satisfied (ie, 100 participants) as there were more than six factors present.21 The extraction method used was maximum likelihood and the rotation method was promax. To determine how many factors were retained, a criterion of eigenvalue >1.0 was used. Corrected item-total correlations were used to identify items which did not measure the same main component as the other items. A value of <0.3 indicates that the item is measuring a different component from the scale as a whole.
The mean score ± standard deviation was calculated for each item. Cronbach’s α and test–retest were used to assess the internal consistency and stable reliability of the questionnaire, respectively. The results for the intervention and control groups were combined to test for internal reliability (Cronbach’s α). Cronbach’s α ≥0.70 indicates good internal reliability.22 Microsoft Office® Word® 2007 (Microsoft Corporation, Redmond, WA, USA) was used to calculate the Flesch reading ease. Flesch reading ease was performed to assess the reading comprehension level necessary to understand the written document. An average document should have a score of 60–70.23
External validity was determined using discriminant validity, which was performed on the control and intervention groups to assess if the SQOP was able to differentiate between the satisfaction levels of the two groups. Since, the control group was not required to answer items 19–23, the total score of both the control and intervention groups were changed into percentages. The Mann–Whitney U-test was then used to analyze the discriminant validity between the control and intervention groups using their percentages. To assess test–retest reliability, the Wilcoxon signed-rank test and Spearman’s correlation were used.
Results
A total of 173 participants were approached: 33 declined and 140 participants (80.9%) were recruited (control group: n=70; intervention group: n=70). No significant differences were found between the control group and intervention group in all demographic aspects (Table 1).
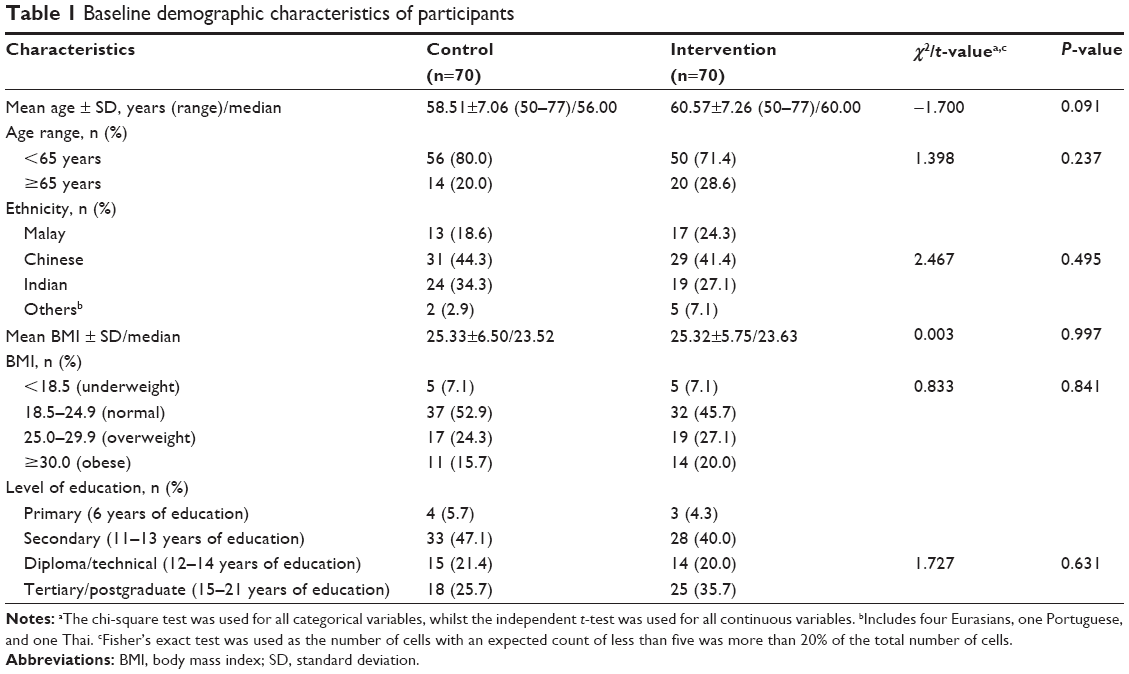 | Table 1 Baseline demographic characteristics of participants |
Factor analysis and psychometric properties of the SQOP
EFA extracted seven domains with a criterion of eigenvalue >1.0. This explains the 79.1% of the cumulative variances. The eigenvalue and the proportion of variance explained are shown in Table 2. The factor loading of the items to each factor are shown in Table 3 (0.118–0.977). All items had a factor loading of >0.3 except item 17, which had a factor loading of 0.118. However, this item was maintained due to its importance based on findings from the qualitative study. Correlations between the factors resulting from the rotation were similar and the residuals ranged from −0.184–0.167 (Table 4).
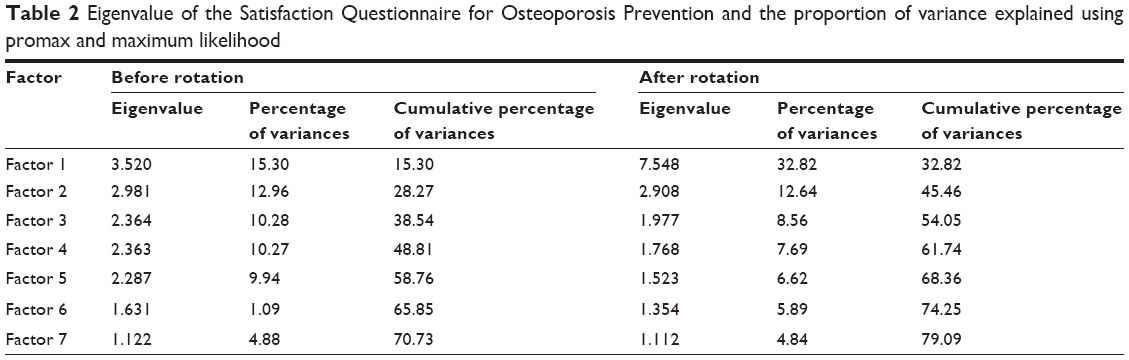 | Table 2 Eigenvalue of the Satisfaction Questionnaire for Osteoporosis Prevention and the proportion of variance explained using promax and maximum likelihood |
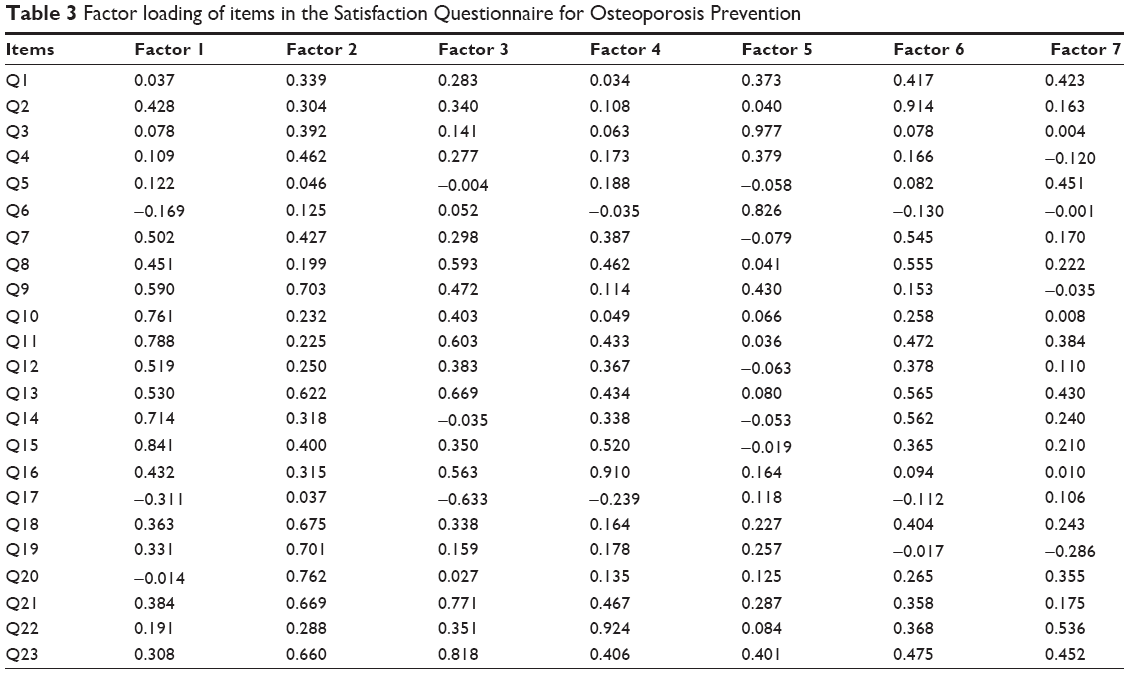 | Table 3 Factor loading of items in the Satisfaction Questionnaire for Osteoporosis Prevention |
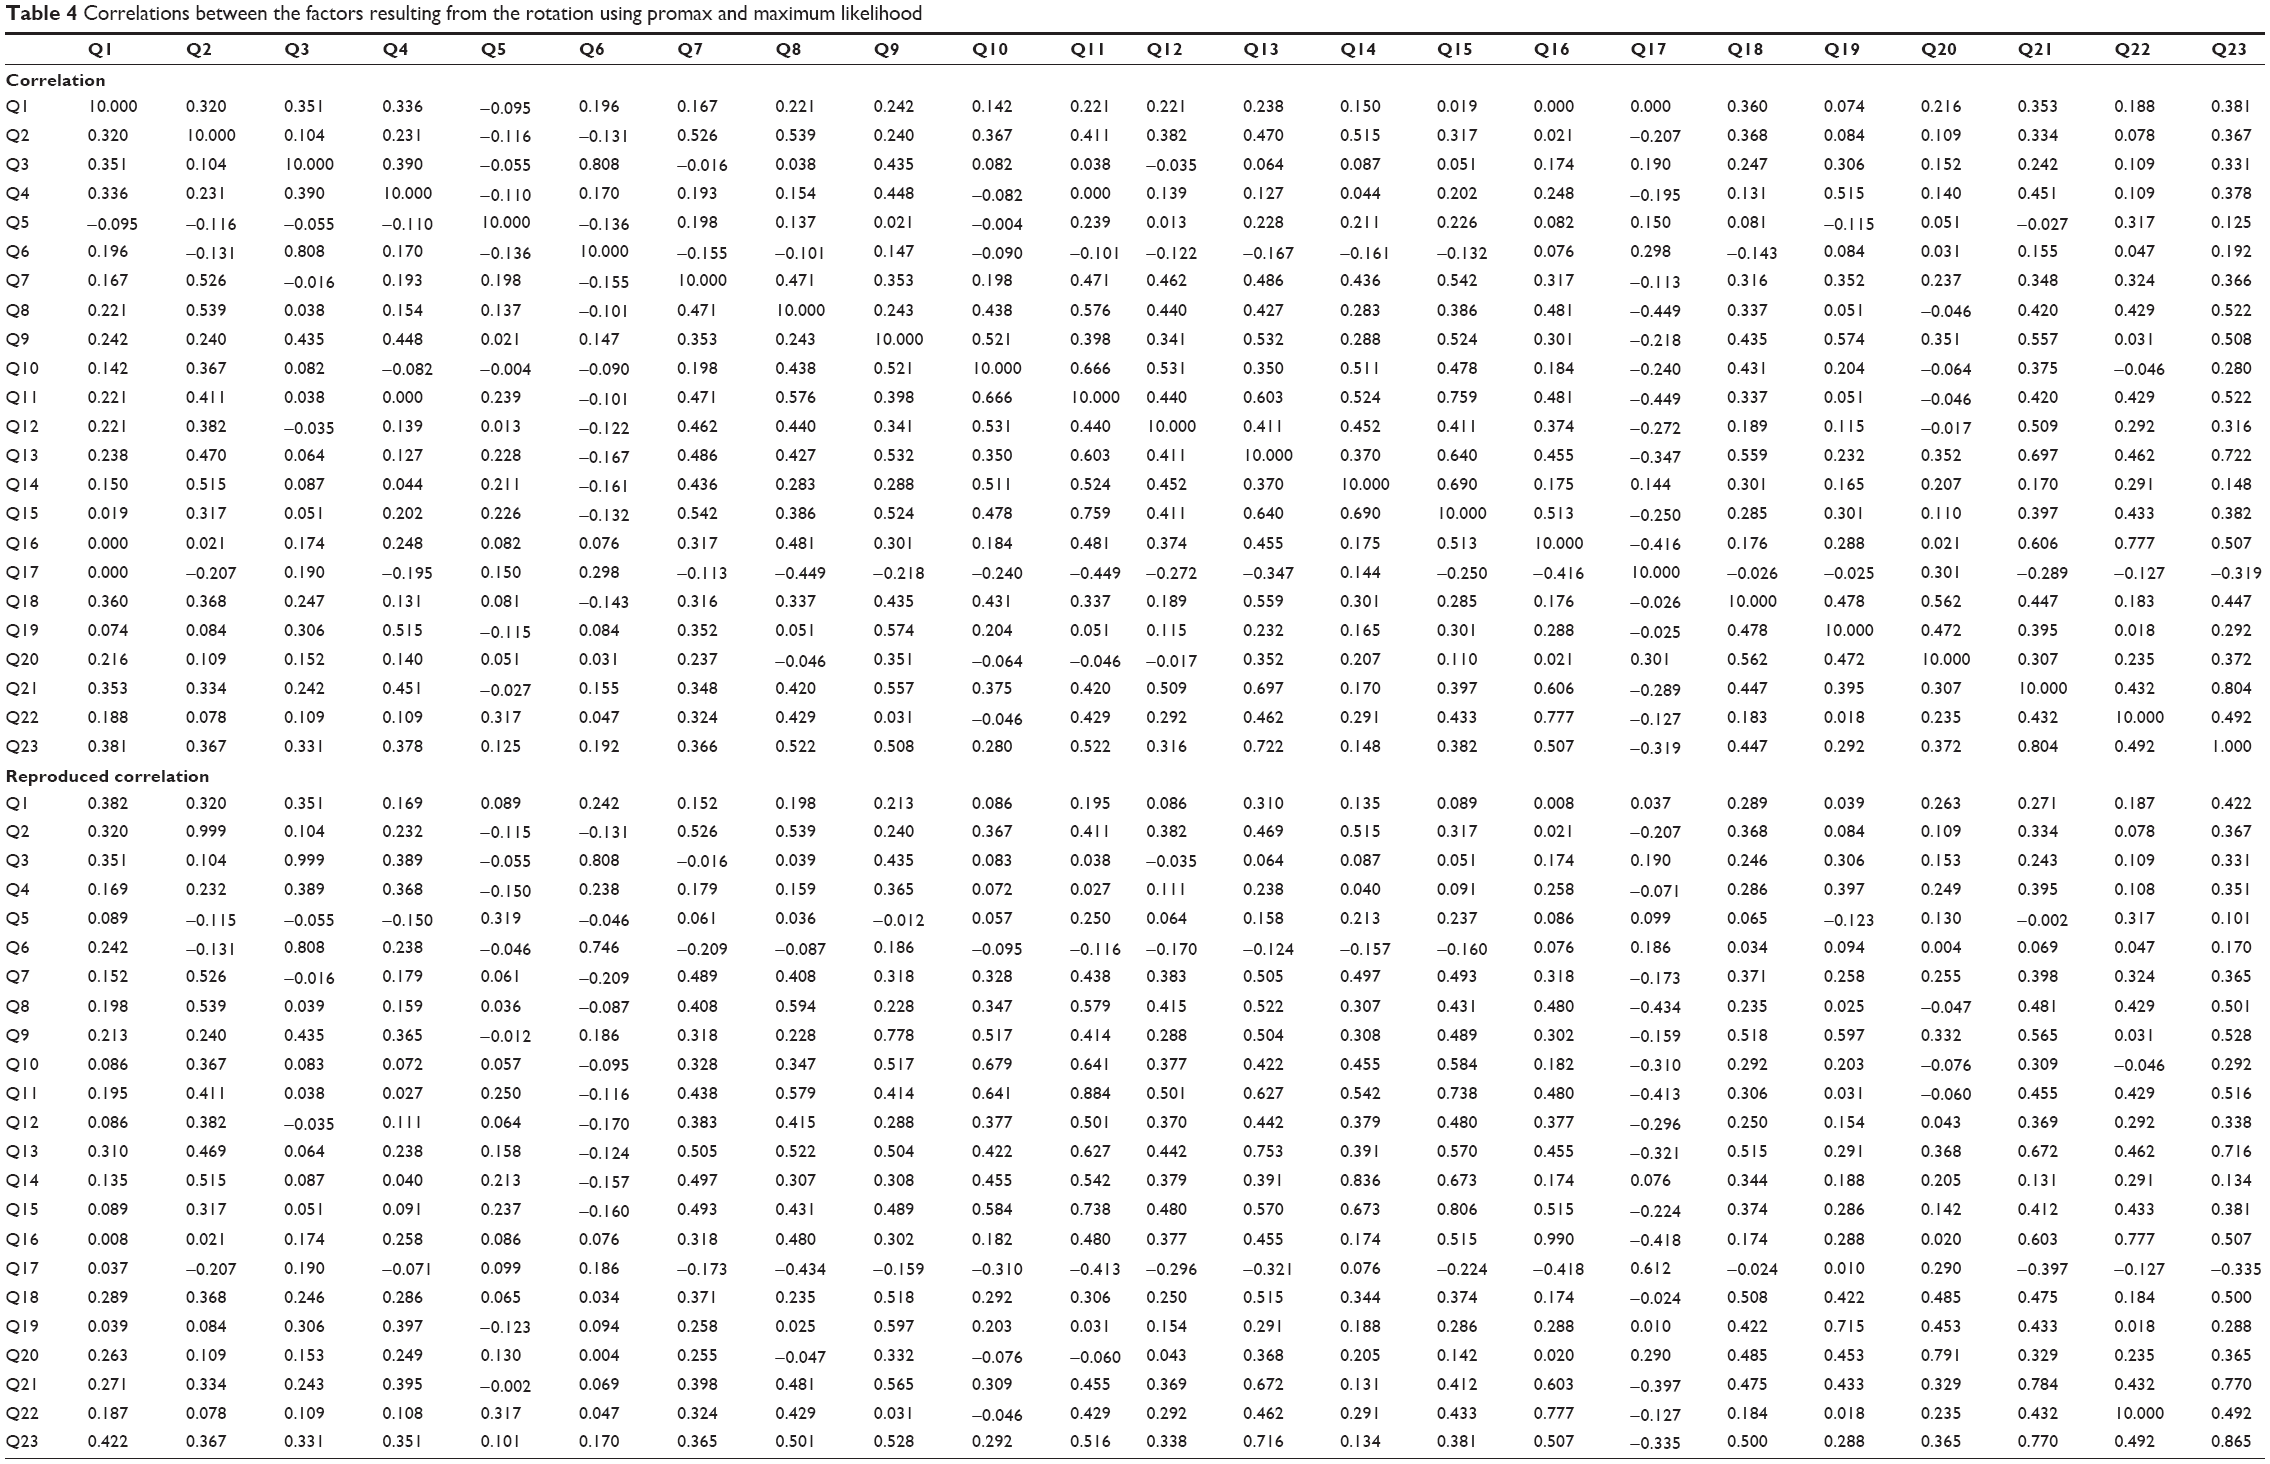 | Table 4 Correlations between the factors resulting from the rotation using promax and maximum likelihood |
The items representing each domain are shown in Table 5. Cronbach’s α of each domain are shown in Table 5 ranging from 0.531–0.812. All items had a corrected item-total correlation of >0.3. Flesch reading ease was 62.9.
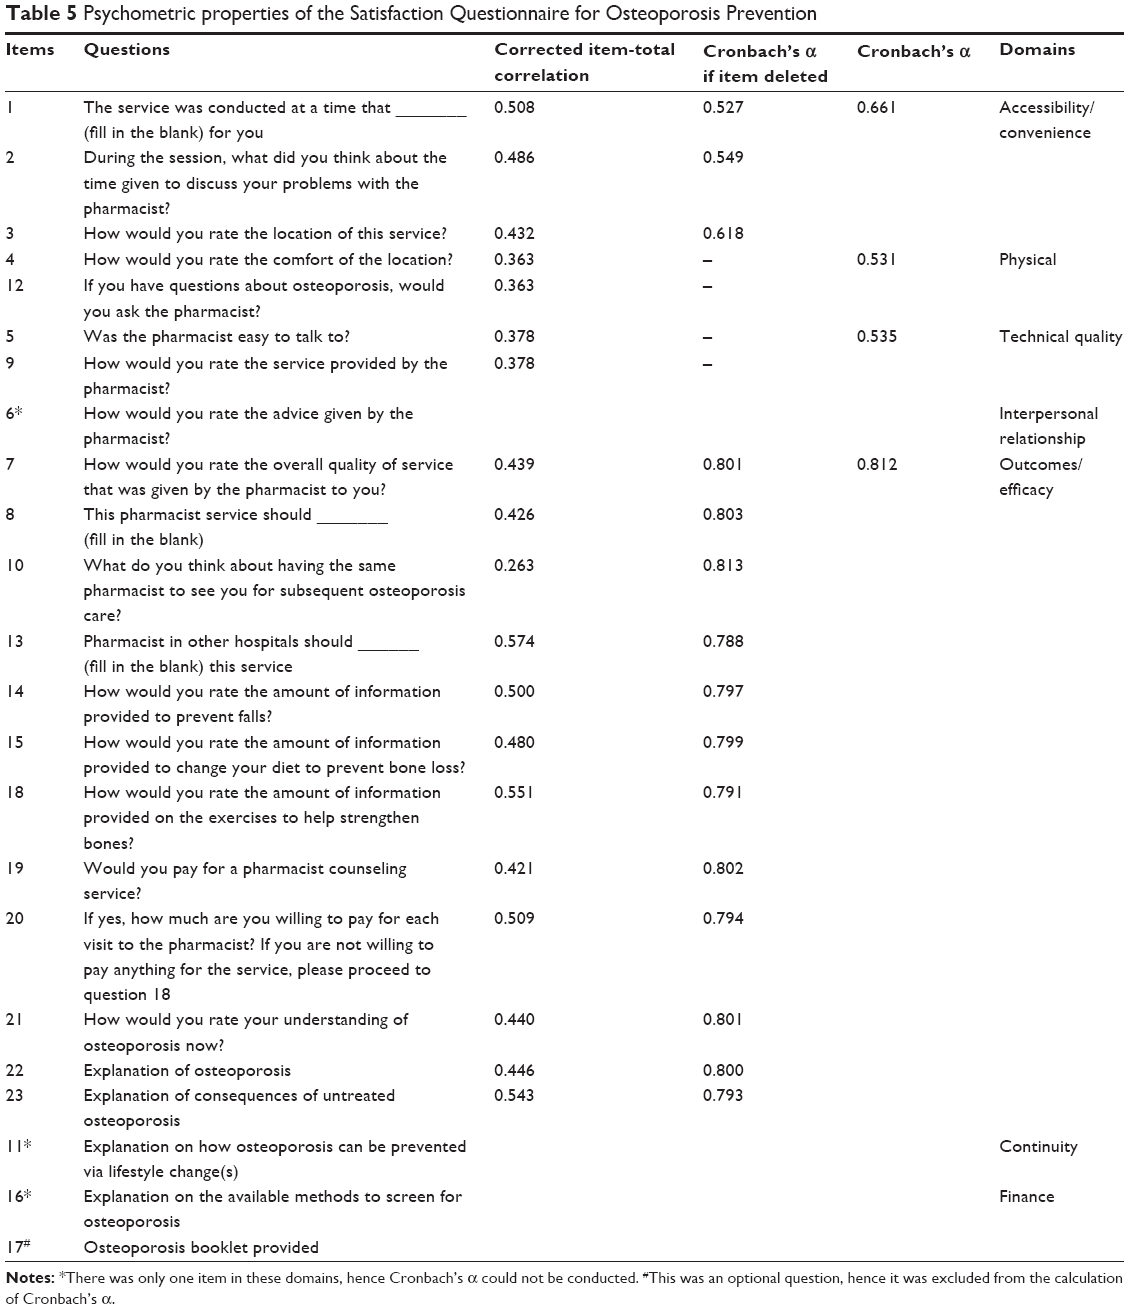 | Table 5 Psychometric properties of the Satisfaction Questionnaire for Osteoporosis Prevention |
At retest, eight participants (5.7%) dropped out of the study: three (2.1%) were overseas and five (3.6%) could not be contacted, leaving 132 (94.3%) at retest. Results from the control group and intervention group were analyzed separately. All test–retest scores were significantly correlated for both the control (P<0.05) and intervention (P<0.05) group. No significant difference was found for all items in the control group except items five and six (Table 6). For the intervention group, no significant difference was found for all items except items four, five, 13, 20, 21, and 23 (Table 6). The instrument in this study showed that the intervention group had a significantly higher patient satisfaction compared to the control group (88.10±5.87 versus 61.87±8.76; P<0.05). Thus, the SQOP was able to discriminate between a group with higher satisfaction and lower satisfaction. This also demonstrated that the intervention had an effect on participants’ satisfaction level.
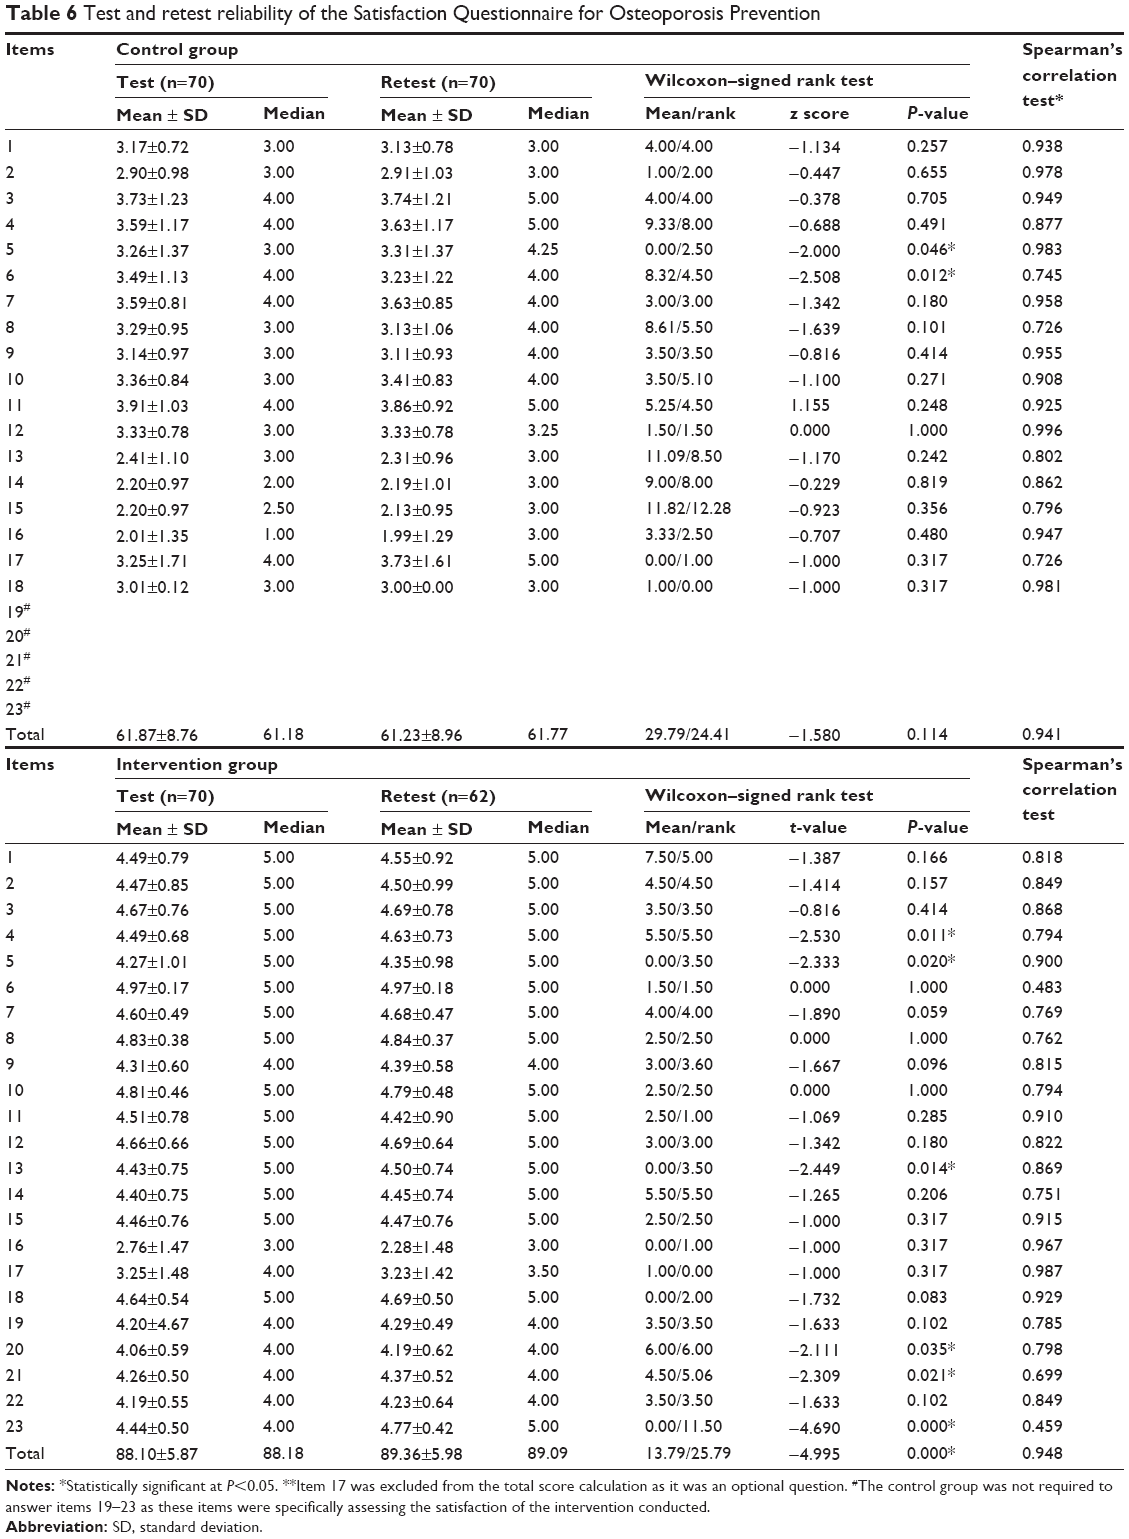 | Table 6 Test and retest reliability of the Satisfaction Questionnaire for Osteoporosis Prevention |
Comparison of the SQOP with other validated instruments
The psychometric properties of the SQOP were similar to that of other validated instruments for measuring patient satisfaction (Table 7).
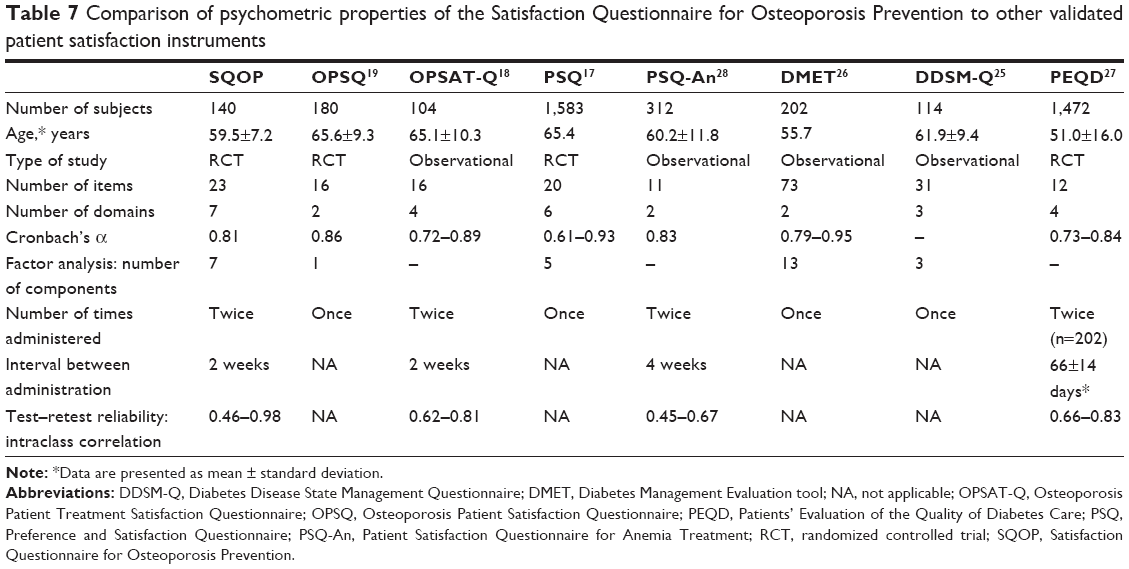 | Table 7 Comparison of psychometric properties of the Satisfaction Questionnaire for Osteoporosis Prevention to other validated patient satisfaction instruments |
Discussion
The SQOP performed satisfactorily in both the EFA and psychometric properties. This indicates that the SQOP is suitable to assess patients’ satisfaction towards an osteoporosis screening and prevention service in Malaysia.
EFA showed that there were seven domains of satisfaction being measured within the main component to assess patients’ satisfaction towards an osteoporosis screening and prevention program in Malaysia. This was as expected as the researchers initially designed this tool to assess seven domains, namely outcomes/efficacy, accessibility/convenience, technical quality, interpersonal relationship, finance, physical condition, and continuity. The seven domains were deemed to be significant to assess patients’ satisfaction as they concurred with the themes from a previous qualitative study.4
The domains measured by SQOP were then compared to that of other satisfaction tools related to osteoporosis. For example, the OPSQ measured convenience, time, trust, and usefulness of the counseling session.19 The Osteoporosis Patient Treatment Satisfaction Questionnaire measured convenience, confidence with daily activities, side effects, and overall satisfaction.18 The Preference and Satisfaction Questionnaire on the other hand measured preference, bother, and satisfaction.17 It was difficult to compare the domains of the Osteoporosis Patient Treatment Satisfaction Questionnaire, Preference and Satisfaction Questionnaire, and OPSQ as these tools were targeted at osteoporosis treatment instead of prevention. However, there were similarities in terms of some of the domains measured such as convenience and usefulness.
Corrected item-total correlations showed that all items measured the same main component – satisfaction. SQOP was designed as a multidimensional tool, rendering an overall Cronbach’s α unsuitable. Hence, Cronbach’s α was conducted for each domain. The physical and technical quality domains had a low Cronbach’s α of 0.531 and 0.535, respectively, due to the small number of items in each domain.24 Nonetheless, the other two domains had an acceptable and good Cronbach’s α of 0.661 (accessibility/convenience) and 0.812 (outcomes/efficacy).24 However, Cronbach’s α was not computed for the interpersonal relationship, continuity, and finance domains as these domains only had one item. These domains comprise a total of four items out of the 23 items. Flesch reading ease was satisfactory at 62.9 as this represents the standard reading level of documents for adults.
The SQOP performed satisfactorily at test–retest, indicating that the SQOP achieved stable reliability. Only item five and item six were significantly different at test–retest for control participants. This may be because participants may have been more “satisfied with the service” provided by the pharmacist.
As for the intervention group, there was no significant difference in item scores between test and retest except for items four, five, 13, 20, 21, and 23. Item four was regarding the comfort of the location. This difference may be due to participants having more time to reflect on the program and realizing that they were “more satisfied”, leading them to view the overall comfort more positively. Item five was regarding whether participants would ask the pharmacist if they had any questions about osteoporosis. Several of the participants changed to a more positive answer during the retest and this may be because of their intervention experience with the researcher who is a pharmacist. Items 13, 20, 21, and 23 were regarding the amount of information provided, explanation of consequences of untreated osteoporosis, explanation on how osteoporosis can be prevented via lifestyle changes, and osteoporosis booklet provided, respectively. A possible explanation for this positive change could be because participants may have had more time to consider the information provided, found it useful, and hence were more satisfied. This in turn improved the overall score for the intervention participants significantly.
The SQOP was able to differentiate between patients who were expected to be more satisfied as they received an additional service (ie, the intervention) compared to those who did not receive the intervention, indicating that the items in SQOP were specific in addressing the different attributes of patients’ satisfaction towards an osteoporosis screening and prevention service in Malaysia.
Currently, there are only a limited number of studies that have validated instruments to measure patient satisfaction.17–19,25–28 The psychometric properties of the SQOP were similar to previous satisfaction tools.
A limitation of this study was that SPSS Amos (IBM) was not used to conduct confirmatory factor analysis as five of the seven domains were developed with two items or less (finance, physical condition, interpersonal relationship, continuity, and technical quality). This was because the questionnaire was designed so that participants would only take approximately 5 minutes to complete, to ensure the practicality of its usage in daily practice. The number of items per domain was determined based on the patients’ emphasis towards the domain during the in-depth interviews. Nonetheless, EFA showed that there were seven components measuring the patients’ satisfaction.
Another limitation of this study was that SQOP was designed to measure the satisfaction of patients towards a pharmacist-conducted osteoporosis screening and prevention service. Hence, wordings such as “Was the pharmacist easy to talk to?” was used. Hence, the implementation of this questionnaire is limited to services provided by a pharmacist. Minor modifications of the SQOP will be required if used to assess satisfaction provided by other health care professionals.
Participants in this study were mainly Chinese (42.9%) and Indians (30.7%). This does not represent the ethnic distribution of Malaysia. It only represents the ethnicity of patients who sought treatment at the study site, meaning that the results cannot be considered population based. Future validation studies of the tool to Malay and Mandarin, and enrollment of participants from multiple sites would be more representative of the Malaysian population.
Conclusion
The English version of the SQOP was found to be a reliable and valid instrument for assessing patients’ satisfaction towards an osteoporosis screening and prevention program in Malaysia. Future studies should include the translation of the SQOP into Malay and Mandarin to assess patient satisfaction for Malaysians that are not fluent in English.
Acknowledgments
The authors would like to thank all participants for their involvement in this study. This project was funded by the M0068.54.01 Ministry of Science, Technology, and Innovation, Malaysia.
Disclosure
The authors report no conflicts of interest in this work.
References
Pascoe GC. Patient satisfaction in primary health care: a literature review and analysis. Evaluation and Program Planning. 1983;6:185–210. | ||
Gourley GA, Duncan DV. Patient satisfaction and quality of life: humanistic outcomes. The American Journal of Managed Care. 1998; 4(5):746–755. | ||
Hardy GE, West MA, Hill F. Components and predictors of patient satisfaction. British Journal of Health Psychology. 1996;1:65–85. | ||
Ware JE, Snyder MK, Wright R, Davies AR. Defining and measuring patient satisfaction with medical care. Evaluation and Program Planning. 1983;6:247–263. | ||
Johnson JA, Coons SJ, Hays RD, Sabers D, Jones P, Langley PC. A comparison of satisfaction with mail versus traditional pharmacy services. Journal of Managed Care Pharmacy. 1997;3(3):327–337. | ||
International Osteoporosis Foundation. The Asian Audit: Epidemiology, cost and burden of osteoporosis in Asia 2009. | ||
Locker D, Dunt D. Theoratical and methodological issues in sociological studies of consumer satisfaction with medical care. Soc Sci Med. 1978; 12:283–292. | ||
Ford RC, Bach SA, Fottler MD. Methods of measuring patient satisfaction in health care organizations. Health Care Management Review. 1997;22(2):74–89. | ||
Gardner MJ, Brophy RH, Demetrakopoulos D, et al. Interventions to improve osteoporosis treatment following hip fracture. A prospective, randomized trial. The Journal of Bone and Joint Surgery. American Volume. 2005;87(1):3–7. | ||
Rozental TD, Makhni EC, Day CS, Bouxsein ML. Improving evaluation and treatment for osteoporosis following distal radial fractures. A prospective randomized intervention. The Journal of Bone and Joint Surgery. American Volume. 2008;90(5):953–961. | ||
Miki RA, Oetgen ME, Kirk J, Insogna KL, Lindskog DM. Orthopaedic management improves the rate of early osteoporosis treatment after hip fracture. A randomized clinical trial. The Journal of Bone and Joint Surgery. American Volume. 2008;90(11):2346–2353. | ||
Yuksel N, Majumdar SR, Biggs C, Tsuyuki RT. Community pharmacist-initiated screening program for osteoporosis: randomized controlled trial. Osteoporosis International: A Journal Established as Result of Cooperation between the European Foundation for Osteoporosis and the National Osteoporosis Foundation of the U S A. 2010;21(3): 391–398. | ||
Crockett JA, Taylor SJ, McLeod LJ. Patient responses to an integrated service, initiated by community pharmacists, for the prevention of osteoporosis. International Journal of Pharmacy Practice. 2008;16(2):65–72. | ||
McDonough RP, Doucette WR, Kumbera P, Klepser DG. An evaluation of managing and educating patients on the risk of glucocorticoid-induced osteoporosis. Value in Health: The Journal of the International Society for Pharmacoeconomics and Outcomes Research. 2005;8(1):24–31. | ||
Majumdar SR, Beaupre LA, Harley CH, et al. Use of a case manager to improve osteoporosis treatment after hip fracture. Arch Intern Med. 2007;167(19):2110–2115. | ||
Lai PSM, Chua SS, Chan SP. Impact of pharmaceutical care on knowledge, quality of life and satisfaction of postmenopausal women with osteoporosis. International Journal of Clinical Pharmacy. 2013; 35(4):629–637. | ||
Gold DT, Horne R, Coon CD, et al. Development, reliability, and validity of a new Preference and Satisfaction Questionnaire. Value in health: the journal of the International Society for Pharmacoeconomics and Outcomes Research. 2011;14(8):1109–1116. | ||
Flood EM, Beusterien KM, Green H, et al. Psychometric evaluation of the Osteoporosis Patient Treatment Satisfaction Questionnaire (OPSAT-Q), a novel measure to assess satisfaction with bisphosphonate treatment in postmenopausal women. Health and Quality of Life Outcomes. 2006;4:42. | ||
Lai PS, Chua SS, Chan SP, Low WY, Wong IC. Development and validation of the osteoporosis patient satisfaction questionnaire (OPSQ). Maturitas. 2010;65(1):55–63. | ||
Gorsuch RL. Factor analysis. 2nd Edition ed. Hillsdale, NJ: Lawarence Erlbaum Associates; 1983. | ||
Mundform DJ, Shaw DG, K. TL. Minimum sample size recommendations for conductiong factor analysis. International Journal of Testing. 2005;5(2):159. | ||
Cronbach LJ. Coefficient alpha and the internal structure of tests. Psychometrika. 1951;16(3):297–334. | ||
Flesch R. A new readability yardstick. Journal of Applied Psychology. 1948;32(3):221–233. | ||
George D, Mallery P. SPSS for Windows step by step: A simple guide and reference. 11.0 update (4th Edition) ed. Boston, USA: Allyn and Bacon; 2003. | ||
Krass I, Delaney C, Glaubitz S, Kanjanarach T. Measuring patient satisfaction with diabetes disease state management services in community pharmacy. Research in Social and Administrative Pharmacy: RSAP. 2009;5(1):31–39. | ||
Paddock LE, Veloski J, Chatterton ML, Gevirtz FO, Nash DB. Development and validation of a questionnaire to evaluate patient satisfaction with diabetes disease management. Diabetes Care. 2000; 23(7):951–956. | ||
Pouwer F, Snoek FJ. Patients evaluation of the quality of diactes care (PEQD): development and validation of a new instrument. Qual Saf Health Care. 2002;11:131–136. | ||
Nordyke RJ, Chang C-H, Chiou C-F, Wallace JF, Yao B, Schwartzberg LS. Validation of a patient satisfaction questionnaire for anemia treatment, the PSQ-An. Health and Quality of Life Outcomes. 2006;4(1):28. |
Supplementary material
The full questionnaire of the English version of the Satisfaction Questionnaire for Osteoporosis Prevention.
  |
 © 2014 The Author(s). This work is published and licensed by Dove Medical Press Limited. The full terms of this license are available at https://www.dovepress.com/terms.php and incorporate the Creative Commons Attribution - Non Commercial (unported, v3.0) License.
By accessing the work you hereby accept the Terms. Non-commercial uses of the work are permitted without any further permission from Dove Medical Press Limited, provided the work is properly attributed. For permission for commercial use of this work, please see paragraphs 4.2 and 5 of our Terms.
© 2014 The Author(s). This work is published and licensed by Dove Medical Press Limited. The full terms of this license are available at https://www.dovepress.com/terms.php and incorporate the Creative Commons Attribution - Non Commercial (unported, v3.0) License.
By accessing the work you hereby accept the Terms. Non-commercial uses of the work are permitted without any further permission from Dove Medical Press Limited, provided the work is properly attributed. For permission for commercial use of this work, please see paragraphs 4.2 and 5 of our Terms.